Page 1
PRODUCTION OF 500 TONS PER DAY OF PURE HYDROGEN GAS
FROM REFINERY OFF-GAS STREAM
A PROJECT REPORT SUBMITTED IN THE PARTIAL FULFILLMENT
OF THE REQUIREMENT FOR THE DEGREE OF
BACHELOR OF TECHNOLOGY
IN
CHEMICAL ENGINEERING
UNDER THE GUIDIANCE
OF
PRADIP RATH
By
Pramod Kumar Bal
(109CH0003)
Department of Chemical Engineering
National Institute of Technology, Rourkela
2013
Page 2
i
National Institute of Technology
Rourkela
CERTIFICATE
This is to certify that the thesis entitled, " PRODUCTION OF 500 TONS PER DAY OF
PURE HYDROGEN GAS FROM REFINERY OFF-GAS STREAM" submitted by Pramod
Kumar Bal in partial fulfillments for the requirement for the award of Bachelor of Technology
Degree in Chemical Engineering at National Institute of Technology Rourkela (Deemed
University) is an authentic work carried out by him under supervision and guidance.
To best of my knowledge, the matter embodied in the thesis has not been submitted to any other
University/Institution for the award of any Degree.
Date: - Prof. Pradip Rath
Department of Chemical Engineering
National Institute of Technology
Rourkela-769008
Page 3
ii
ACKNOWLEDGEMENT
I would like to convey my sincere gratitude to my project supervisor, Prof Pradip Rath for his
invaluable suggestions, constructive criticism, motivation and guidance for carrying out related
experiments and for preparing the associated reports and presentations. His encouragement
towards the current topic helped me a lot in this project work which also created an area of
interest for my professional career ahead.
I owe my thankfulness to Prof R. K. Singh, Head of the Department of Chemical Engineering for
providing necessary facilities in the department and also to Prof H. M. Jena for the excellent
coordination and arrangement towards the consistent evaluation of this project.
I thank my family and friends for their encouragement towards this project work.
Date: Pramod Kumar Bal
Place: Roll Number-109CH0003
Department of Chemical Engineering,
NIT, Rourkela-769008
Page 4
iii
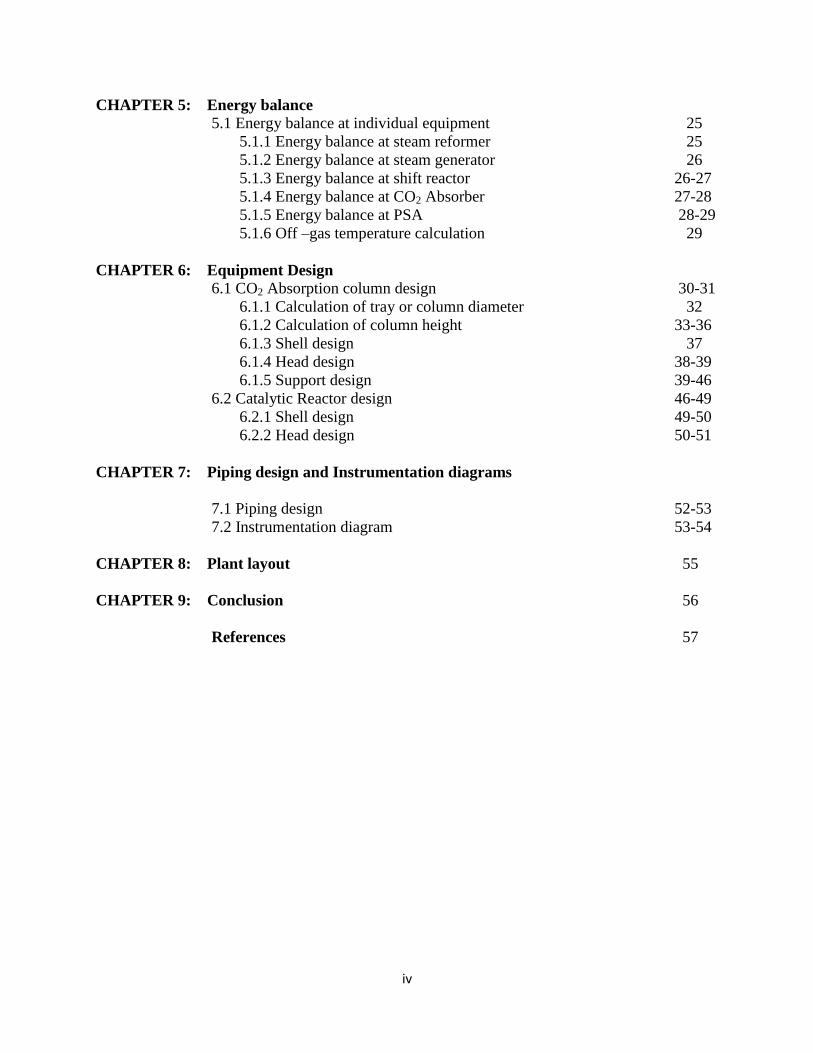
CONTENTS
PAGE NO.
Abstract ix
List of Tables vi
List of Figures v
List of Symbols vii
CHAPTER 1: Introduction 1-2
CHAPTER 2: Literature Review
2.1 Refinery off-gas stream 3
2.1.1 Refinery off-gas composition 3
2.2 Steam-reforming 4
2.2.1 Industrial reforming 4
2.3 Shift Reactor 5
2.4 Pressure swing adsorption 6
2.5 Various methods of hydrogen production 7
2.5.1 Steam methane reforming 7
2.5.2 Coal gasification 8
2.5.3 Partial Oxidation of Hydrocarbon 8
2.5.4 Biomass gasification 8-9
2.5.5 Electrolysis 9
2.5.6 Thermochemical 10
2.5.7 Photo-biological 10
CHAPTER 3: Process Description 3.1 Introduction 11
3.2 Process Description 12-13
CHAPTER 4: Material Balance 4.1 Basis 14
4.2 Refinery off-gas required 14
4.3 Material balance of individual equipment 15
4.3.1 Desulfurizer 15
4.3.2 Reformer 16-19
4.3.3 Shift reactor 20
4.3.4 CO2 absorber 21
4.3.5 Pressure swing adsorption 22-24
Page 5
iv
CHAPTER 5: Energy balance
5.1 Energy balance at individual equipment 25
5.1.1 Energy balance at steam reformer 25
5.1.2 Energy balance at steam generator 26
5.1.3 Energy balance at shift reactor 26-27
5.1.4 Energy balance at CO2 Absorber 27-28
5.1.5 Energy balance at PSA 28-29
5.1.6 Off –gas temperature calculation 29
CHAPTER 6: Equipment Design
6.1 CO2 Absorption column design 30-31
6.1.1 Calculation of tray or column diameter 32
6.1.2 Calculation of column height 33-36
6.1.3 Shell design 37
6.1.4 Head design 38-39
6.1.5 Support design 39-46
6.2 Catalytic Reactor design 46-49
6.2.1 Shell design 49-50
6.2.2 Head design 50-51
CHAPTER 7: Piping design and Instrumentation diagrams
7.1 Piping design 52-53
7.2 Instrumentation diagram 53-54
CHAPTER 8: Plant layout 55
CHAPTER 9: Conclusion 56
References 57
Page 6
v
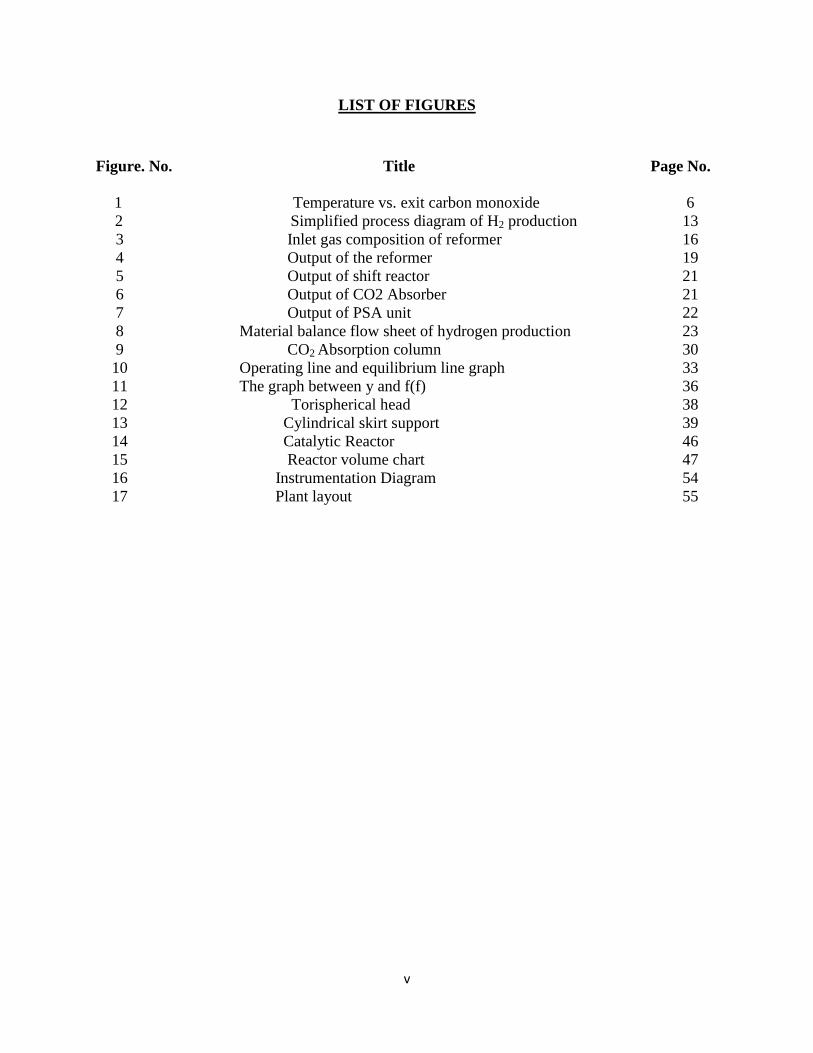
LIST OF FIGURES
Figure. No. Title Page No.
1 Temperature vs. exit carbon monoxide 6
2 Simplified process diagram of H2 production 13
3 Inlet gas composition of reformer 16
4 Output of the reformer 19
5 Output of shift reactor 21
6 Output of CO2 Absorber 21
7 Output of PSA unit 22
8 Material balance flow sheet of hydrogen production 23
9 CO2 Absorption column 30
10 Operating line and equilibrium line graph 33
11 The graph between y and f(f) 36
12 Torispherical head 38
13 Cylindrical skirt support 39
14 Catalytic Reactor 46
15 Reactor volume chart 47
16 Instrumentation Diagram 54
17 Plant layout 55
Page 7
vi
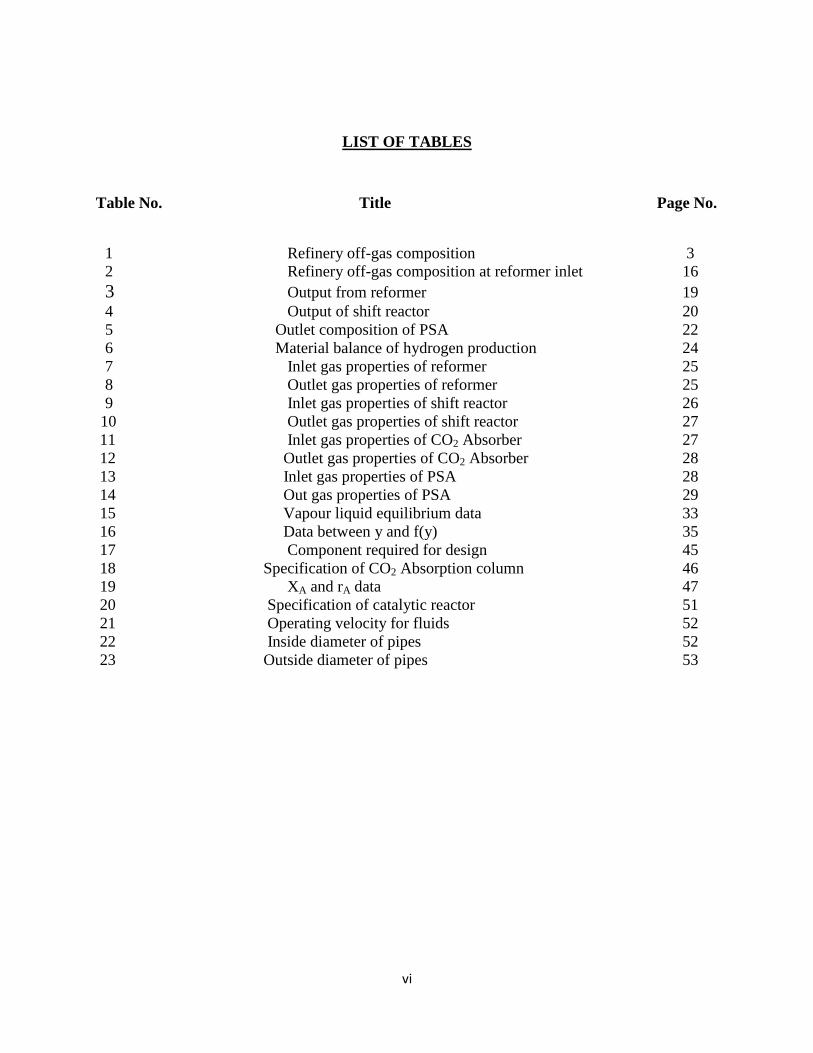
LIST OF TABLES
Table No. Title Page No.
1 Refinery off-gas composition 3
2 Refinery off-gas composition at reformer inlet 16
3 Output from reformer 19
4 Output of shift reactor 20
5 Outlet composition of PSA 22 6 Material balance of hydrogen production 24
7 Inlet gas properties of reformer 25
8 Outlet gas properties of reformer 25
9 Inlet gas properties of shift reactor 26
10 Outlet gas properties of shift reactor 27
11 Inlet gas properties of CO2 Absorber 27
12 Outlet gas properties of CO2 Absorber 28
13 Inlet gas properties of PSA 28
14 Out gas properties of PSA 29
15 Vapour liquid equilibrium data 33
16 Data between y and f(y) 35
17 Component required for design 45
18 Specification of CO2 Absorption column 46
19 XA and rA data 47
20 Specification of catalytic reactor 51
21 Operating velocity for fluids 52
22 Inside diameter of pipes 52
23 Outside diameter of pipes 53
Page 8
vii
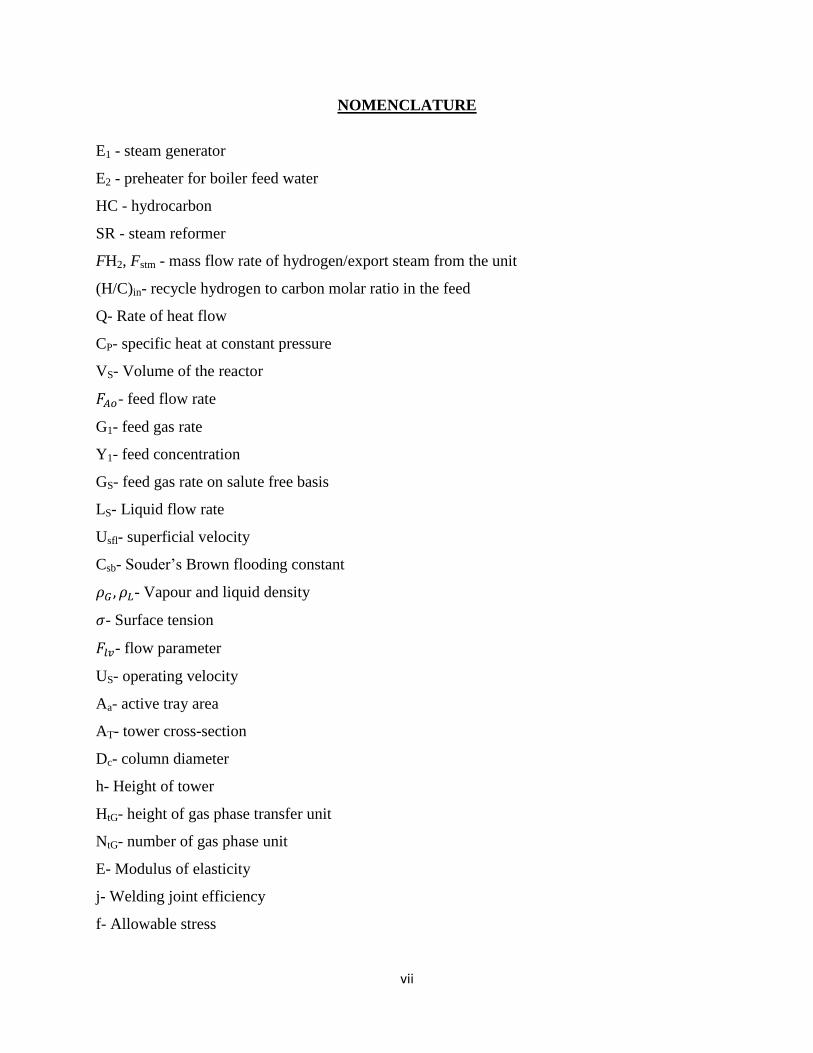
NOMENCLATURE
E1 - steam generator
E2 - preheater for boiler feed water
HC - hydrocarbon
SR - steam reformer
FH2, Fstm - mass flow rate of hydrogen/export steam from the unit
(H/C)in- recycle hydrogen to carbon molar ratio in the feed
Q- Rate of heat flow
CP- specific heat at constant pressure
VS- Volume of the reactor
- feed flow rate
G1- feed gas rate
Y1- feed concentration
GS- feed gas rate on salute free basis
LS- Liquid flow rate
Usfl- superficial velocity
Csb- Souder’s Brown flooding constant
- Vapour and liquid density
- Surface tension
- flow parameter
US- operating velocity
Aa- active tray area
AT- tower cross-section
Dc- column diameter
h- Height of tower
HtG- height of gas phase transfer unit
NtG- number of gas phase unit
E- Modulus of elasticity
j- Welding joint efficiency
f- Allowable stress
Page 9
viii
U- out of roundness in %
tsk- thickness of skirt
Wa- weight of attachment
Wl- weight of liquid content
WS- weight of shell
Wins- weight of insulation
T- Period of vibration
C- Stress concentration factor
Page 10
ix
ABSTRACT
Steam methane reforming (SMR) is one of the most promising processes for hydrogen
production. Several studies have demonstrated its advantages from the economic viewpoint.
Nowadays process development is based on technical and economic aspects, however, in the
near future; the environmental impact will play a significant role in the design of such processes.
In this paper, an SMR process is studied from the viewpoint of overall environmental impact,
using an exergoenvironmental analysis. This analysis presents the combination of exergy
analysis and life cycle assessment. Components where chemical reactions occur are the most
important plant components from the exergoenvironmental point of view, because, in general,
there is a high environmental impact associated with these components. This is mainly caused by
the energy destruction within the components, and this in turn is mainly due to the chemical
reactions. The obtained results show that the largest potential for reducing the overall
environmental impact is associated with the combustion reactor, the steam reformer, the
hydrogen separation unit and the major heat exchangers. The environmental impact in these
components can mainly be reduced by improving their exergetic efficiency. A sensitivity
analysis for some important exergoenvironmental variables is also presented in the paper.
Keywords: Hydrogen production, Steam methane reforming process, Exergy analysis;
Page 11
1
Chapter 1
1. Introduction [1]
:
Hydrogen is a chemical element with symbol H and atomic number 1 with an atomic weight of
1.00794u, hydrogen is the lightest element and its monatomic form (H) is the most abundant
chemical substance, constituting roughly 75% of the Universe's baryonic mass.Non-remnant
starts are mainly composed of hydrogen in its plasma state. At standard temperature and pressure
hydrogen is a colorless, odorless, nontoxic, nonmetallic, highly combustible diatomic gas with
the molecular formula H2.Naturally occurring atomic hydrogen is rare on Earth because
hydrogen readily forms covalent compounds with most elements and is present in the water
molecule and in most organic compounds. Hydrogen plays a particularly important role in acid-
base chemistry with many reactions exchanging protons between soluble molecules. The
latter cation is written as though composed of a bare proton, but in reality, hydrogen cations
in ionic compounds always occur as more complex species. The most common isotope of
hydrogen is protium (name rarely used, symbol 1H) with a single proton and no neutrons. As the
simplest atom known, the hydrogen atom has been of theoretical use. For example, as the only
neutral atom with an analytic solution to the Schrödinger equation, the study of the energetics
and bonding of the hydrogen atom played a key role in the development of quantum mechanics.
Hydrogen gas was first artificially produced in the early 16th century, via the mixing of metals
with strong acids. In 1766–81, Henry Cavendish was the first to recognize that hydrogen gas was
a discrete substance, and that it produces water when burned, a property which later gave it its
name: in Greek, hydrogen means "water-former".
Industrial production is mainly from the steam reforming of natural gas, and less often from
more energy-intensive hydrogen production methods like the electrolysis of water. Most
hydrogen is employed near its production site, with the two largest uses being fossil
fuel processing (e.g., hydrocracking) and ammonia production, mostly for the fertilizer market.
Hydrogen is a concern in metallurgy as it can embrittle many metals, complicating the design of
pipelines and storage tanks.
Page 12
2
Hydrogen can be produced from a variety of feedstocks. These include fossil resources, such as
natural gas and coal, as well as renewable resources, such as biomass and water with input from
renewable energy sources (e.g. sunlight, wind, wave or hydro-power). A variety of process
technologies can be used, including chemical, biological, electrolytic, photolytic and thermo-
chemical. Each technology is in a different stage of development, and each offers unique
opportunities, benefits and challenges. Local availability of feedstock, the maturity of the
technology, market applications and demand, policy issues, and costs will all influence the
choice and timing of the various options for hydrogen production. High to ultra-high purity
hydrogen may be needed for the durable and efficient operation of fuel cells, consumption in
different process plants, in semiconductor industry and as an energy carrier. Impurities are
believed to cause various problems in the current state-of-the-art fuel cell designs, including
catalyst poisoning and membrane failure. As such, additional process steps may be required to
purify the hydrogen to meet industry quality standards.
Page 13
3
Chapter 2
Literature Review
2.1 refinery off-gas stream [2]
Refinery gas is a mixture of gases generated during refinery processes which are used to
process crude oil into various petroleum products which can be traded or sold. The composition
of refinery gas varies, depending on the composition of the crude it originates from and the
processes it has been subjected to common components include butanes, butylenes, methane and
ethylene. Some products found in refinery gas are subject to control as a result of programs
which are designed to address climate change.
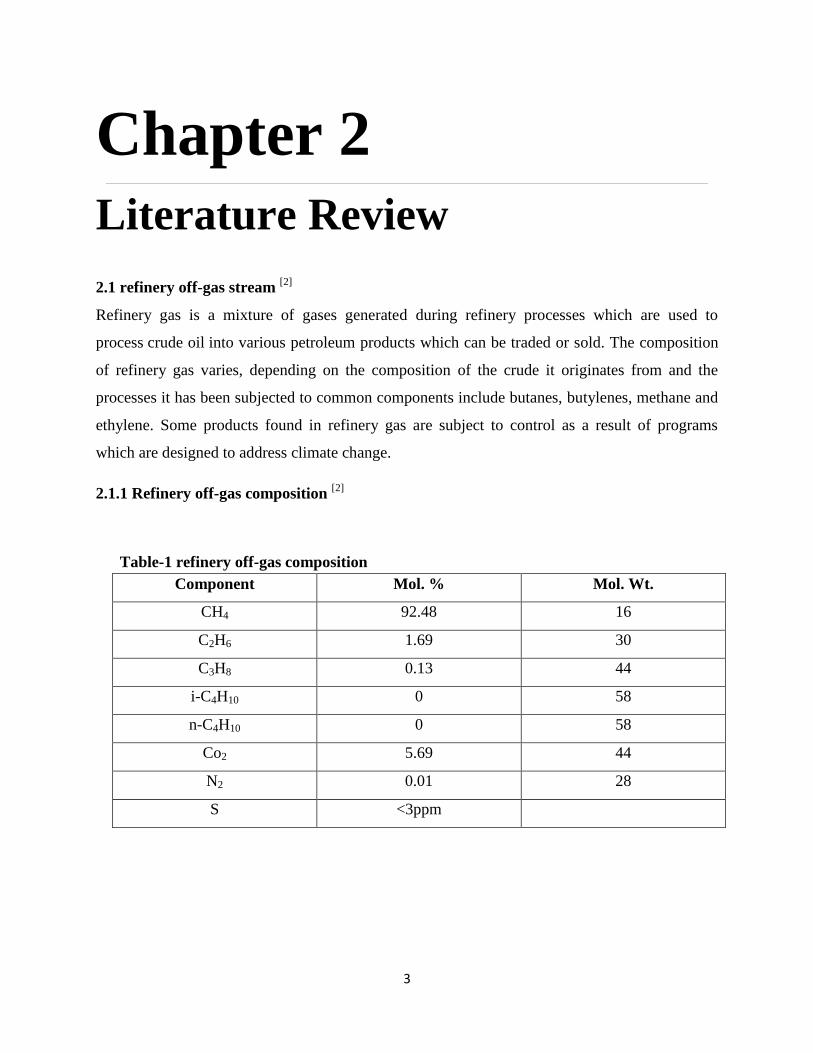
2.1.1 Refinery off-gas composition [2]
Table-1 refinery off-gas composition
Component Mol. % Mol. Wt.
CH4 92.48 16
C2H6 1.69 30
C3H8 0.13 44
i-C4H10 0 58
n-C4H10 0 58
Co2 5.69 44
N2 0.01 28
S <3ppm
Page 14
4
2.2. Steam reforming [3]
Steam reforming, sometimes called Fossil fuel reforming is a method for hydrogen production or
other useful products from hydrocarbon fuels such as natural gas. This is achieved in a
processing device called a reformer which reacts steam at high temperature with the fossil fuel.
The steam methane reformer is widely used in industry to make hydrogen. There is an in
development of much smaller units based on similar technology produce hydrogen as a feedstock
for fuel cells. Small-scale steam reforming units to supply fuel cells are currently the subject of
research and development, typically involving the reforming of methanol or natural gas but other
fuels are also being considered as propane, gasoline, auto gas, and ethanol.
2.2.1 Industrial reforming [4]
Steam reforming of natural gas or syngas sometimes referred to as steam methane reforming
(SMR) is the most common method of producing commercial bulk hydrogen as well as the
hydrogen used in the industrial synthesis of ammonia. It is also the least expensive method. At
high temperatures (700 – 1100 °C) and in the presence of a metal-based catalyst (nickel), steam
reacts with methane to yield carbon monoxide and hydrogen. These two reactions are reversible
in nature.
CH4 + H2O ⇌ CO + 3 H2……………………………… (2.1)
Additional hydrogen can be recovered by a lower-temperature gas-shift reaction with
the carbon monoxide produced. The reaction is summarized by
CO + H2O → CO2 + H2……………………………………… (2.2)
The first reaction is strongly endothermic (consumes heat), the second reaction is
mildly exothermic (produces heat).The United States produces nine million tons of hydrogen per
year, mostly with steam reforming of natural gas. The worldwide ammonia production, using
hydrogen derived from steam reforming, was 109 million metric tons in 2004. This SMR process
is quite different from and not to be confused with catalytic reforming of naphtha, an oil
refinery process that also produces significant amounts of hydrogen along with
high octane gasoline. The efficiency of the process is approximately (65 -75) %.
Page 15
5
2.3. shift reactor [5]
At the outlet of steam reformers, partial oxidation reactors or coke oven gas units the syngas
contains H2, CO, CO2, CH4 and water in chemical equilibrium at high temperatures in the range
of 700 to 1400 °C depending on the process pressure and the mixture of feed stock and process
steam or water. By means of the CO shift conversion an important portion of the CO content in
the cracked gas is used for additional hydrogen generation, which is following the chemical
reaction
CO + H2O→ H2 + CO2……………………….. (2.3)
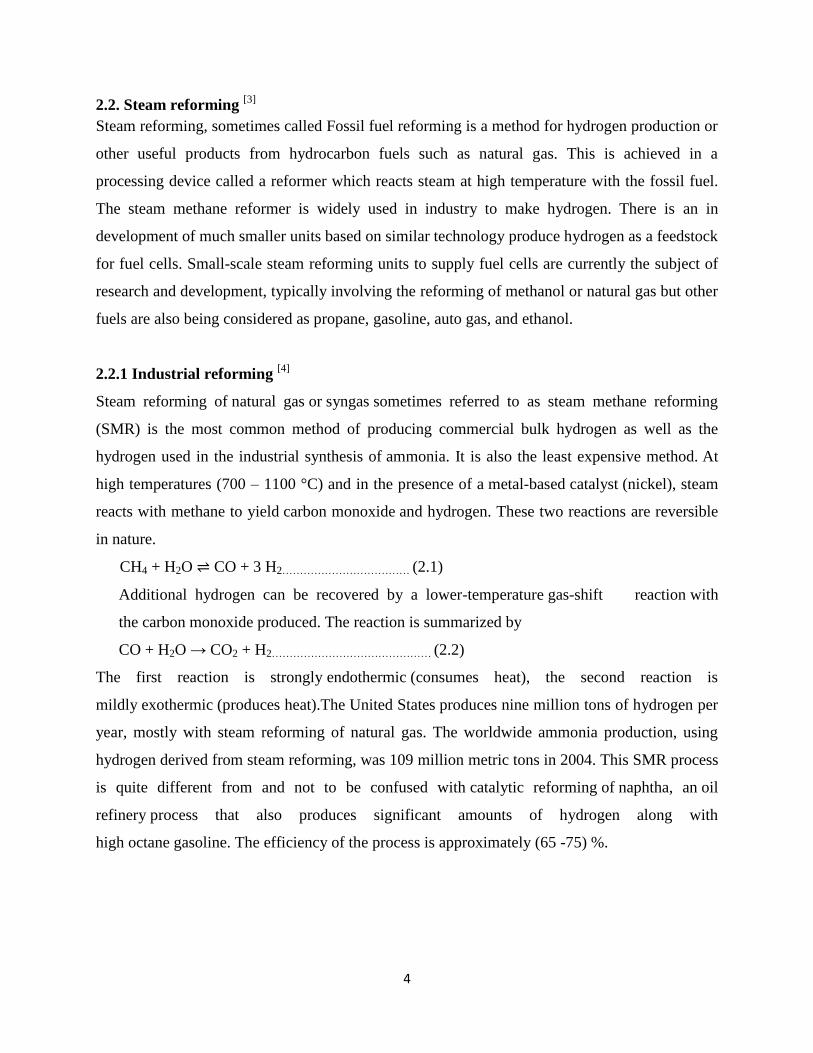
This process is exothermic and is limited by the chemical equilibrium. There are three different
versions of CO shift conversion: High temperature (HT) CO shift conversion at about 300 to 450
°C down to approx. 2.5 % CO on dry basis at the reactor outlet Medium temperature (MT) CO
shift conversion or so-called isothermal shift conversion at about 220 to 270 °C down to approx.
0.5 % CO on dry basis at the reactor outlet. Low temperature (LT) CO shift conversion at about
180 to 250 °C down to approx. 0.2 % CO on dry basis at the reactor outlet for every process a
special catalyst will be used in a fixed bed reactor to get maximum yield of H2 product.
The use of HT CO shift conversion is state of the art in almost every hydrogen plant. The
application of the low temperature CO shift conversion is normally installed downstream of the
HT shift at already reduced CO content in the feed gas. The additional investment is considered
for plants having a capacity above approx. 40,000 Nm³/h H2 product. The catalyst of the LT shift
is very sensitive against sulphur, chlorine and liquid water and special attention is required
during start up and plant upset conditions. In former concepts the LT shift was important because
of the downstream methanisation of CO following the CO2 removal unit, to meet the product
purity at minimum H2 losses. After the implementation of the Pressure Swing Adsorption (PSA
unit) for H2 purification these process steps have become obsolete. The MT CO shift conversion
as isothermal reaction can be approximated in several adiabatic reactors with intercoolers or
better in an isothermal reactor with integrated steam generation for cooling of the process gas.
The temperature of the shift reaction is controlled easily by setting the pressure of the generated
steam.
Page 16
6
Inlet temperature in
Fig-1 temperature vs. exit carbon monoxide
2.4. pressure swing adsorber [6]
Adsorption process is designed in such a way that a gas mixture is fed to adsorber at ambient
temperature and increased pressure. At higher temperature, a smaller amount of impurities can
be adsorbed on any adsorbent. The regeneration at high temperature level T2 reduces the loading
L2 of adsorbent at adsorption pressure P1 and temperature T2 and reduced pressure P2.PSA
process works between two pressure levels: (1) Adsorption & (2) Regeneration. In adsorption
phase, adsorption of impurities is carried out at high pressure to increase the partial pressure and
thus increase loading of impurities on adsorbent. The raw feed gas flows through an adsorber in
upward direction and the impurities are selectively adsorbed on the surface of the adsorbent in
the order- water, hydrocarbons, CO and N2 from bottom to top. The purified product gas leaves
the adsorber at the outlet and flows to the product line.
The adsorbing capacity of one adsorber being limited, after certain time the impurities break
through at the outlet of the adsorber. First the impurities come in traces, but gradually their
concentration increases. To avoid this breakthrough, the adsorption step must be interrupted to
regenerate the loaded adsorber. For continuous product supply, at least two absorbers are
necessary. While the first one is regenerated, a second already regenerated one purifies the raw
Mol%
CO
Page 17
7
feed gas. In the regeneration phase, the process is carried out at low pressure at approximately
the same temperature. During this phase, the adsorbed impurities are desorbed. The residual
impurities loading are reduced as much as possible in order to achieve high product purity and a
high H2 recovery.
Regeneration phase consist of several steps;
Expansion to adsorption pressure, where the adsorbed components start to desorb
from the adsorbent.
Purging supports this desorption process with some gas having very low partial
pressure of impurities.
Pressurization to adsorption pressure.
2.5. various methods for hydrogen production [7]
Steam Methane Reforming
Coal Gasification
Partial Oxidation of Hydrocarbons
Biomass Gasification
Electrolysis
Thermochemical
Photo biological
2.5.1. Steam Methane Reforming
Steam reforming involves the endothermic conversion of methane and water vapour into
hydrogen and carbon monoxide (2.4). The heat is often supplied from the combustion of some of
the methane feed-gas. The process typically occurs at temperatures of 700 to 850 °C and
pressures of 3 to 25 bars. The product gas contains approximately 12 % CO, which can be
further converted to CO2 and H2 through the water-gas shift reaction (2.5).
CH4 + H2O + heat →CO + 3H2……………….. (2.4)
CO + H2O → CO2 + H2 + heat ……………....... (2.5)
Page 18
8
2.5.2. Coal Gasification
Hydrogen can be produced from coal through a variety of gasification processes (e.g. fixedbed,
fluidized bed or entrained flow). In practice, high-temperature entrained flow processes are
favored to maximize carbon conversion to gas, thus avoiding the formation of significant
amounts of char, tars and phenols. A typical reaction for the process is given in equation (2.4), in
which carbon is converted to carbon monoxide and hydrogen
C(s) + H2O + heat → CO + H2
Since this reaction is endothermic, additional heat is required, as with methane reforming. The
CO is further converted to CO2 and H2 through the water-gas shift reaction, described in equation
(2.5). Hydrogen production from coal is commercially mature, but it is more complex than the
production of hydrogen from natural gas. The cost of the resulting hydrogen is also higher. But
since coal is plentiful in many parts of the world and will probably be used as an energy source
regardless, it is worthwhile to explore the development of clean technologies for its use.
2.5.3. Partial Oxidation of Hydrocarbons
Partial oxidation of natural gas is the process whereby hydrogen is produced through the partial
combustion of methane with oxygen gas to yield carbon monoxide and hydrogen (2.6). In this
process, heat is produced in an exothermic reaction, and hence a more compact design is possible
as there is no need for any external heating of the reactor. The CO produced is further converted
to H2 as described in equation (2.5).
CH4 + 1/2O2 →CO + 2H2 + heat………….. (2.6)
2.5.4. Biomass Gasification
In biomass conversion processes, a hydrogen-containing gas is normally produced in a manner
similar to the gasification of coal. However, no commercial plants exist to produce hydrogen
from biomass. Currently, the pathways followed are steam gasification (direct or indirect),
entrained flow gasification, and more advanced concepts such as gasification in supercritical
water, application of thermo-chemical cycles, or the conversion of intermediates (e.g. ethanol,
Page 19
9
bio-oil ororrified wood). None of the concepts have reached a demonstration phase for hydrogen
production. Biomass gasification is an R&D area shared between H2 production and biofuels
production. Gasification and pyrolysis are considered the most promising medium-term
technologies for the commercialization of H2 production from biomass. A typical flow sheet for
the production of hydrogen
In terms of its energy requirements, the drying of biomass might not be justifiable; therefore,
other pathways based on wet biomass are being sought as well. Biomass feedstocks are unrefined
products with inconsistent quality and poor quality control. The production methods vary
according to crop type, location and climatic variations. Erratic fuels have contributed to the
difficulties in technological innovation, since less homogenous and low quality fuels need more
sophisticated conversion systems. There is a need to rationalize the production and preparation of
fuel to produce more consistent, higher-quality fuels that can be described by common standards.
Large-scale systems tend to be suitable for cheaper and lower quality fuels, while smaller plants
tend to require higher levels of fuel quality and better fuel homogeneity. A better understanding
of this relationship, and the specific tolerances that each technology can accommodate, is
needed.
2.5.5. Electrolysis
Water electrolysis is the process whereby water is split into hydrogen and oxygen through the
application of electrical energy, as in equation (2.7). The total energy that is needed for water
Porous water-filled layer in the earth strata. Electrolysis is increasing slightly with temperature,
while the required electrical energy decreases. A high-temperature electrolysis process might,
therefore, be preferable when high-temperature heat is available as waste heat from other
processes. This is especially important globally, as most of the electricity produced is based on
fossil energy sources with relatively low efficiencies.
H2O + electricity → H2 + 1/2O2……………… (2.7)
Page 20
10
2.5.6. Thermochemical
Thermo-chemical water splitting is the conversion of water into hydrogen and oxygen by a series
of thermally driven chemical reactions. Thermo-chemical water-splitting cycles have been
known for the past 35 years. They were extensively studied in the late 1970s and 1980s, but have
been of little interest in the past 10 years. While there is no question about the technical
feasibility and the potential for high efficiency, cycles with proven low cost and high efficiency
have yet to be developed commercially. An example of a thermo-chemical process is the
iodine/sulphur cycle. For this process, the research and development needs are to capture the
thermally split H2, to avoid side reactions and to eliminate the use of noxious substances. The
corrosion problems associated with the handling of such materials are likely to be extremely
serious.
H2SO4 →SO2 + H2O + 1/2O2………………. (2.8)
I2 + SO2 + 2H2O → H2SO4 + 2HI………… (2.9)
2HI → I2 + H2……………………………… (2.10)
H2O →H2 + 1/2O2…………………………. (2.11)
2.5.7. Photobiological
Photo-biological production of hydrogen is based on two steps: photosynthesis (2.12) and
hydrogen production catalyzed by hydrogenases (2.13) in, for example, green algae and
cyanobacteria. Long term basic and applied research is needed in this area, but if successful, a
long-term solution for renewable hydrogen production will result. It is of vital importance to
understand the natural processes and the genetic regulations of H2 production. Metabolic and
genetic engineering maybe used to demonstrate the process in larger bioreactors. Another option
is to reproduce the two steps using artificial photosynthesis.
Photosynthesis: 2H2 O → 4H+ + 4e
– + O2 …… …… (2.12)
Hydrogen Production: 4H+ + 4e
– →2H2 …………… ……… (2.13)
Page 21
11
Chapter 3
Process description
3.1 Introduction [8, 9]
Steam reforming of hydrocarbons has established itself as the most economic and preferred
process for the production of hydrogen and synthesis gas. In view of the large value addition
involved in the process and its high energy consumption coupled with increasing energy cost, the
optimal operation of such units is of utmost concern to the industry. The choice of feedstock for
steam reforming is largely determined by location, availability, and the local energy policy. Two
Common feedstocks range from natural gas to heavy naphtha. Because even the simplest of these
feedstocks contains many components (natural gas contains mainly methane but also ethane,
propane, butane, and other higher hydrocarbons), a multitude of chemical reactions occur in the
steam reformer, making it impractical to account for all of them. Reformation experiments
carried out with hydrocarbons such as propane, butane, hexane, and benzene suggest methane to
be the primary product of the reaction. Based on this observation, many published works3-5 on
steam reforming with heavier hydrocarbons assume that all hydrocarbons heavier than methane
hydrocrack to methane instantaneously at the reformer inlet. As a result, the reaction system
within the reformer can be reduced to that for the steam-methane reaction regardless of the
feedstock used. This simplifying assumption gained wide acceptance because it was found to be
satisfactory for predicting the gas composition at the reformer outlet. This is primarily because
the reforming reactions are thermodynamically and not kinetically controlled. However, axial
conversion profiles in an ammonia plant steam reformer suggest that methanation is completed
between 2 and 6 m from the reformer.
Page 22
12
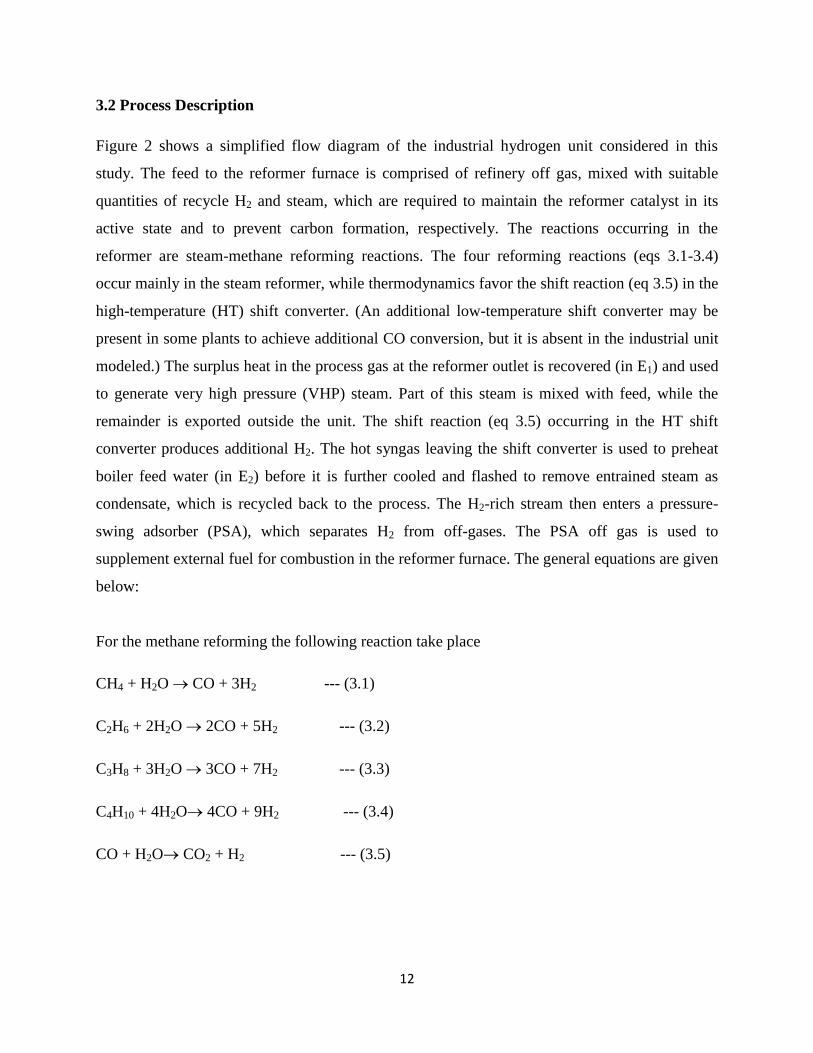
3.2 Process Description
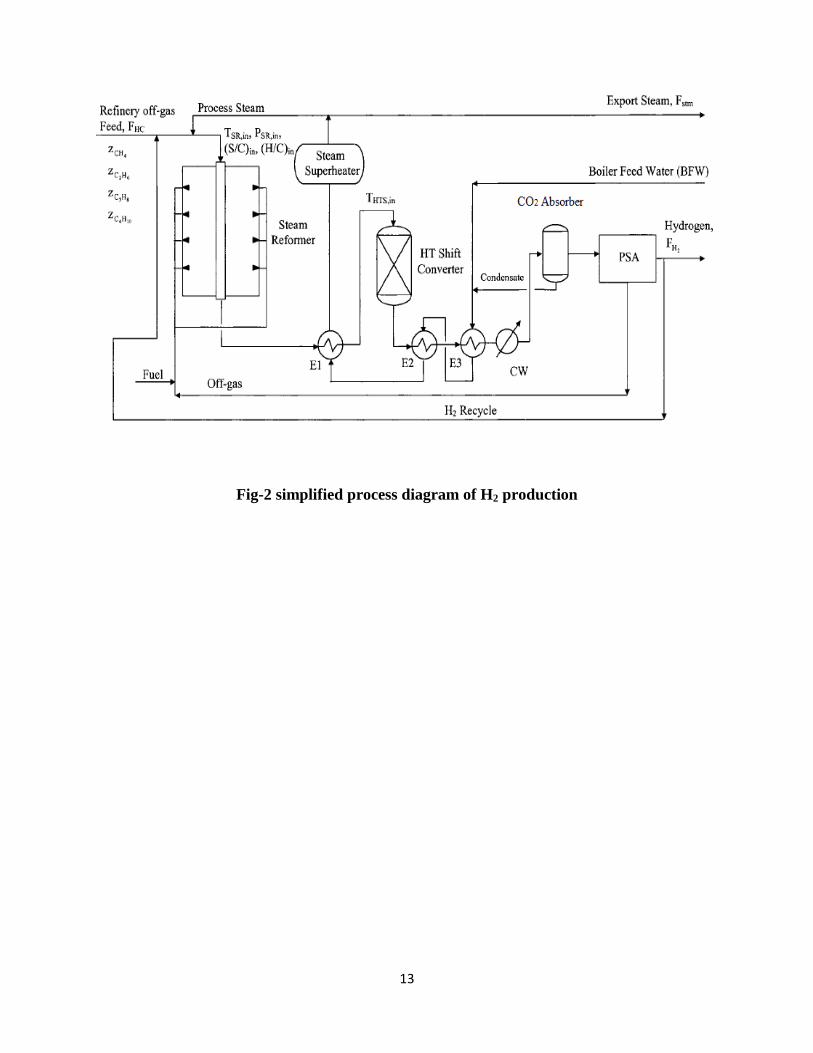
Figure 2 shows a simplified flow diagram of the industrial hydrogen unit considered in this
study. The feed to the reformer furnace is comprised of refinery off gas, mixed with suitable
quantities of recycle H2 and steam, which are required to maintain the reformer catalyst in its
active state and to prevent carbon formation, respectively. The reactions occurring in the
reformer are steam-methane reforming reactions. The four reforming reactions (eqs 3.1-3.4)
occur mainly in the steam reformer, while thermodynamics favor the shift reaction (eq 3.5) in the
high-temperature (HT) shift converter. (An additional low-temperature shift converter may be
present in some plants to achieve additional CO conversion, but it is absent in the industrial unit
modeled.) The surplus heat in the process gas at the reformer outlet is recovered (in E1) and used
to generate very high pressure (VHP) steam. Part of this steam is mixed with feed, while the
remainder is exported outside the unit. The shift reaction (eq 3.5) occurring in the HT shift
converter produces additional H2. The hot syngas leaving the shift converter is used to preheat
boiler feed water (in E2) before it is further cooled and flashed to remove entrained steam as
condensate, which is recycled back to the process. The H2-rich stream then enters a pressure-
swing adsorber (PSA), which separates H2 from off-gases. The PSA off gas is used to
supplement external fuel for combustion in the reformer furnace. The general equations are given
below:
For the methane reforming the following reaction take place
CH4 + H2O CO + 3H2 --- (3.1)
C2H6 + 2H2O 2CO + 5H2 --- (3.2)
C3H8 + 3H2O 3CO + 7H2 --- (3.3)
C4H10 + 4H2O 4CO + 9H2 --- (3.4)
CO + H2O CO2 + H2 --- (3.5)
Page 23
13
Fig-2 simplified process diagram of H2 production
Page 24
14
Chapter 4
Material balance [10]
Material balances are the basis of process design. A material balance taken over complete
process will determine the quantities of raw materials required and products produced. Balances
over Individual process until set the process stream flows and compositions. The general
conservation equation for any process can be written as;
Material out = material in + accumulation
For a steady state process the accumulation term is zero. If a chemical reaction is taking place a
particular chemical species may be formed or consumed. But if there is no chemical reaction, the
steady state balance reduces to:
Material out = Material in
A balance equation can be written for each separately identifiable species present, elements,
compounds and for total material
4.1 basis
500 T/days of hydrogen gas produced
(500*1000)/ (24*2) = 10,500 kg mol/hr hydrogen produced
4.2 refinery off-gases required
The reactions involved are as followed:
CH4 + H2O CO + 3H2 ………………………… (4.1)
C2H6 + 2H2 O 2 CO + 5H2 ………………………… (4.2)
Page 25
15
C3H8 + 3H2O 3 CO + 7H2 …………………………... (4.3)
C4H10 + 4H2O 4 CO + 9H2 ……………………………. (4.4)
CO + H2O CO2 + H2 …………………………………… (4.5)
IF x kg mol / hr of refinery off-gas be supplied then the H2 content as based on the refinery off-
gas composition is given by:
= (3*0.9248 + 5*0.0169 + 7*0.0013) * X
= 2.8121X
Hence,
2.8121 X = 10,500 kg mol/hr
X = 3733.86 kg-mol / hr
Hence, refinery off-gas required = 3733.86 kg-mol / hr.
4.3 material balance of individual equipment
4.3.1 Desulfurizer
In the desulfurizer, there is removal of sulfur, since, the concentration of the sulfur being
encountered is less than 3 ppm, we can say that for the desulfurizer.
Input = 3733.86 kg-mol / hr of the refinery off-gas
Output = 3733.86 kg-mol / hr of the refinery off-gas.
Both the input and output have the same composition and this composition is seen in the table
below for feed to the primary reformer
Page 26
16
4.3.2 Reformer:
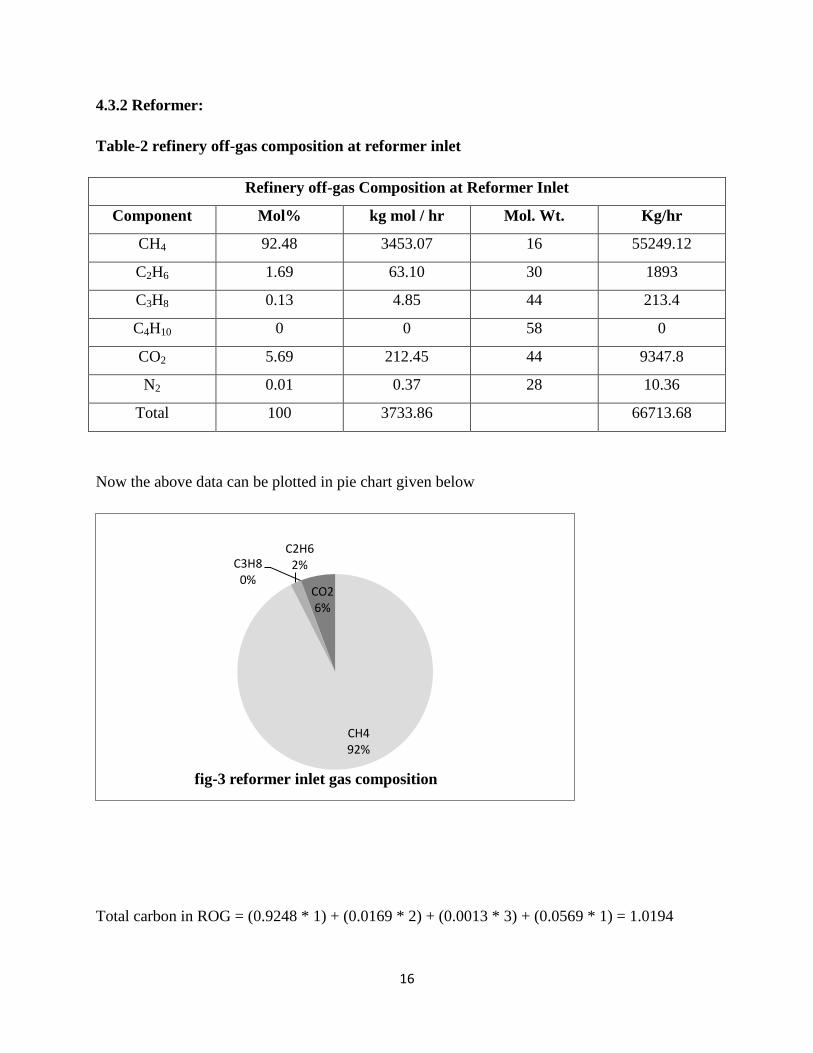
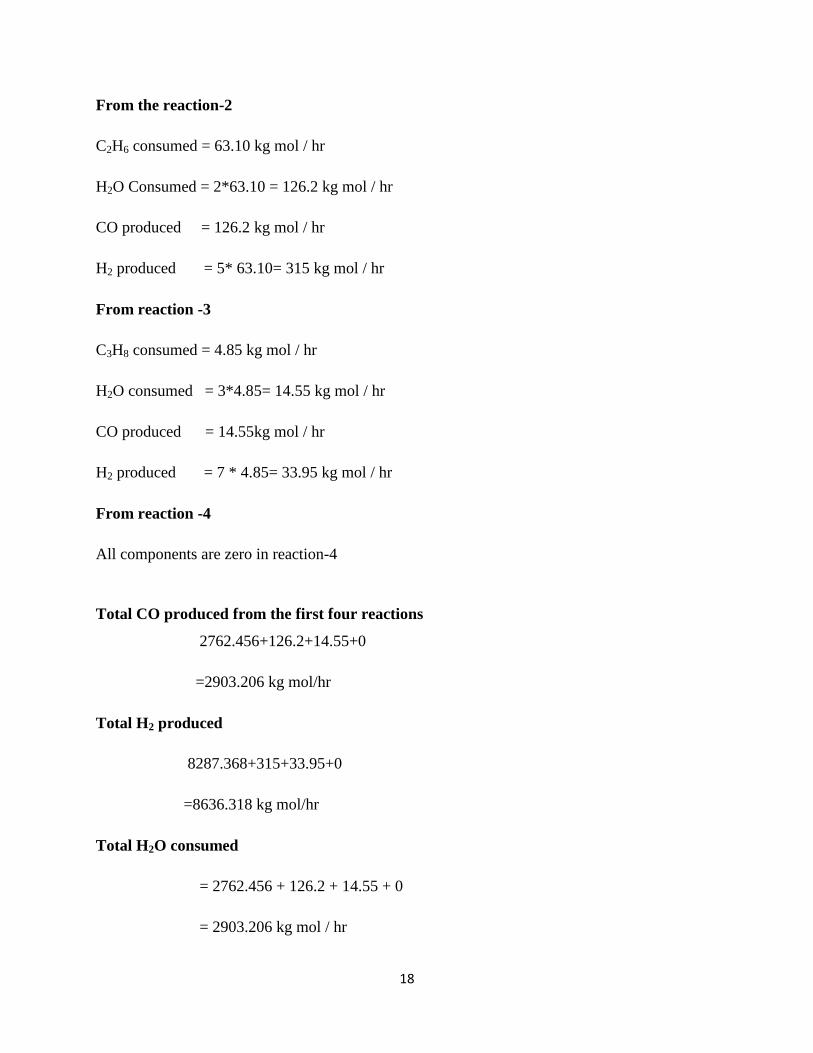
Table-2 refinery off-gas composition at reformer inlet
Refinery off-gas Composition at Reformer Inlet
Component Mol% kg mol / hr Mol. Wt. Kg/hr
CH4 92.48 3453.07 16 55249.12
C2H6 1.69 63.10 30 1893
C3H8 0.13 4.85 44 213.4
C4H10 0 0 58 0
CO2 5.69 212.45 44 9347.8
N2 0.01 0.37 28 10.36
Total 100 3733.86 66713.68
Now the above data can be plotted in pie chart given below
Total carbon in ROG = (0.9248 * 1) + (0.0169 * 2) + (0.0013 * 3) + (0.0569 * 1) = 1.0194
CH4 92%
C2H6 2% C3H8
0% CO2 6%
fig-3 reformer inlet gas composition
Page 27
17
Here taking the steam to carbon mole ratio is 3:1 we have.
Steam = 3 *1.0194 *3733.86 = 11418.89 kg mol / hr = 205540.03 Kg / hr
Total feed to reformer = ROG+ steam
= 3733.86 + 11418.89 = 15152.75 kgmol / hr
For the methane reforming the following reaction take place
CH4 + H2O CO + 3H2 --- (4.6)
C2H6 + 2H2O 2CO + 5H2 --- (4.7)
C3H8 + 3H2O 3CO + 7H2 --- (4.8)
C4H10 + 4H2O 4CO + 9H2 --- (4.9)
CO + H2O CO2 + H2 --- (4.10)
Assume: (1) 80% conversion of the first reaction.
(2) 100% conversion of 4.7, 4.8 and 4.9 reaction.
(3) 65% conversion of reaction 4.10
From the reaction -1
CH4 consumed = 0.8 * 3453.07 = 2762.456 kg mol / hr
CH4 unconverted = 3453.07 - 2762.456 = 690.614kg mol / hr
H2O consumed = 2762.456 kg mol / hr
H2 produced = 3*2762.456 = 8287.368kg mol / hr
CO produced = 2762.456 kg mol / hr
Page 28
18
From the reaction-2
C2H6 consumed = 63.10 kg mol / hr
H2O Consumed = 2*63.10 = 126.2 kg mol / hr
CO produced = 126.2 kg mol / hr
H2 produced = 5* 63.10= 315 kg mol / hr
From reaction -3
C3H8 consumed = 4.85 kg mol / hr
H2O consumed = 3*4.85= 14.55 kg mol / hr
CO produced = 14.55kg mol / hr
H2 produced = 7 * 4.85= 33.95 kg mol / hr
From reaction -4
All components are zero in reaction-4
Total CO produced from the first four reactions
2762.456+126.2+14.55+0
=2903.206 kg mol/hr
Total H2 produced
8287.368+315+33.95+0
=8636.318 kg mol/hr
Total H2O consumed
= 2762.456 + 126.2 + 14.55 + 0
= 2903.206 kg mol / hr
Page 29
19
H2O remaining
=11418.89– 2903.206
= 8515.684 kg mol / hr
N2 is used as an inert gas
So, N2 Input = N2 Output=0.37 kg mol/ hr
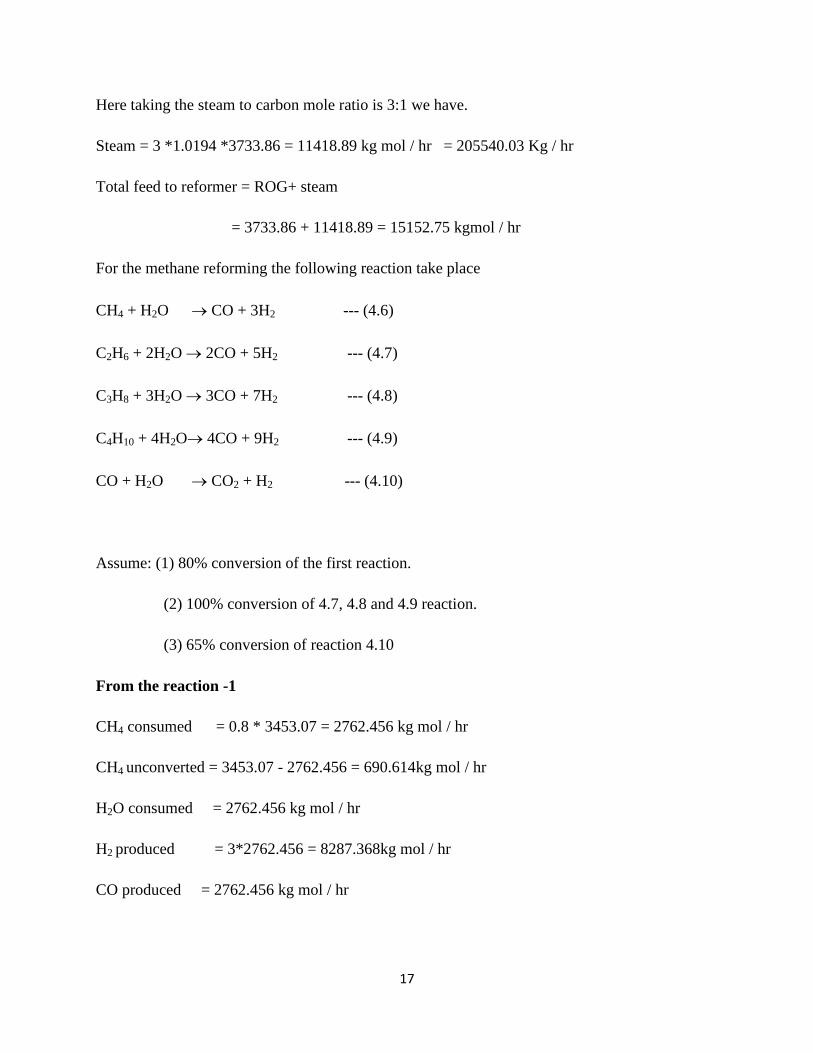
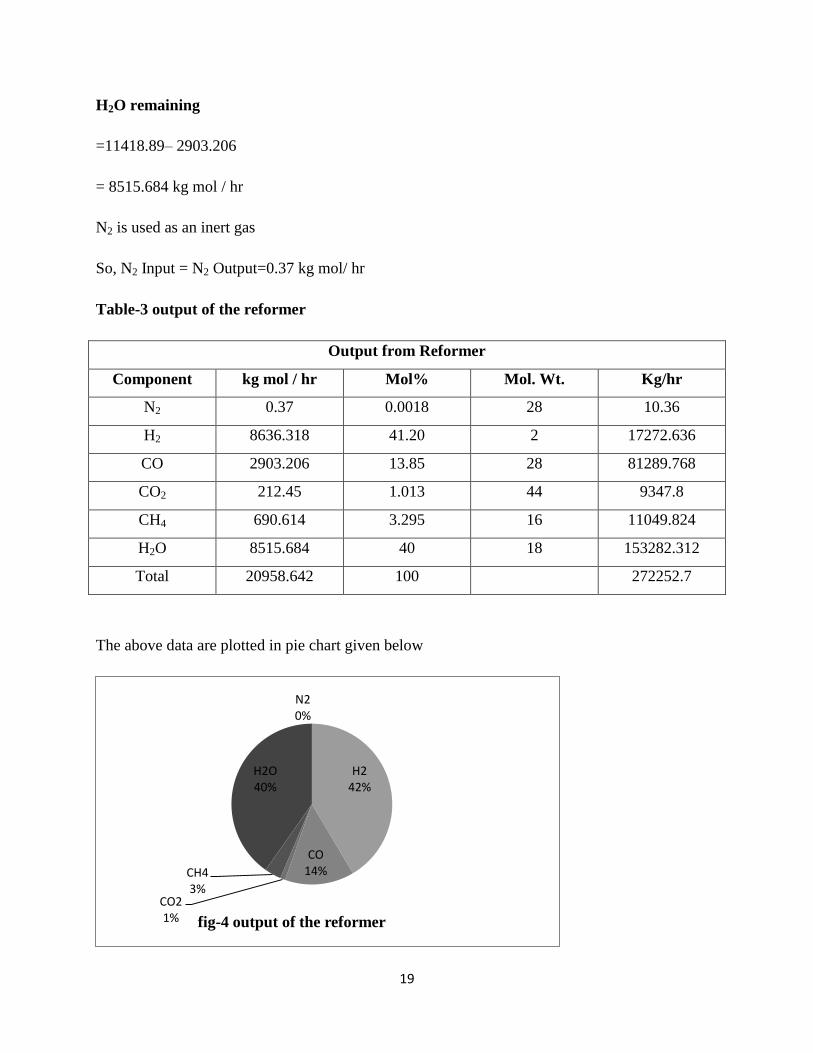
Table-3 output of the reformer
Output from Reformer
Component kg mol / hr Mol% Mol. Wt. Kg/hr
N2 0.37 0.0018 28 10.36
H2 8636.318 41.20 2 17272.636
CO 2903.206 13.85 28 81289.768
CO2 212.45 1.013 44 9347.8
CH4 690.614 3.295 16 11049.824
H2O 8515.684 40 18 153282.312
Total 20958.642 100 272252.7
The above data are plotted in pie chart given below
N2 0%
H2 42%
CO 14%
CO2 1%
CH4 3%
H2O 40%
fig-4 output of the reformer
Page 30
20
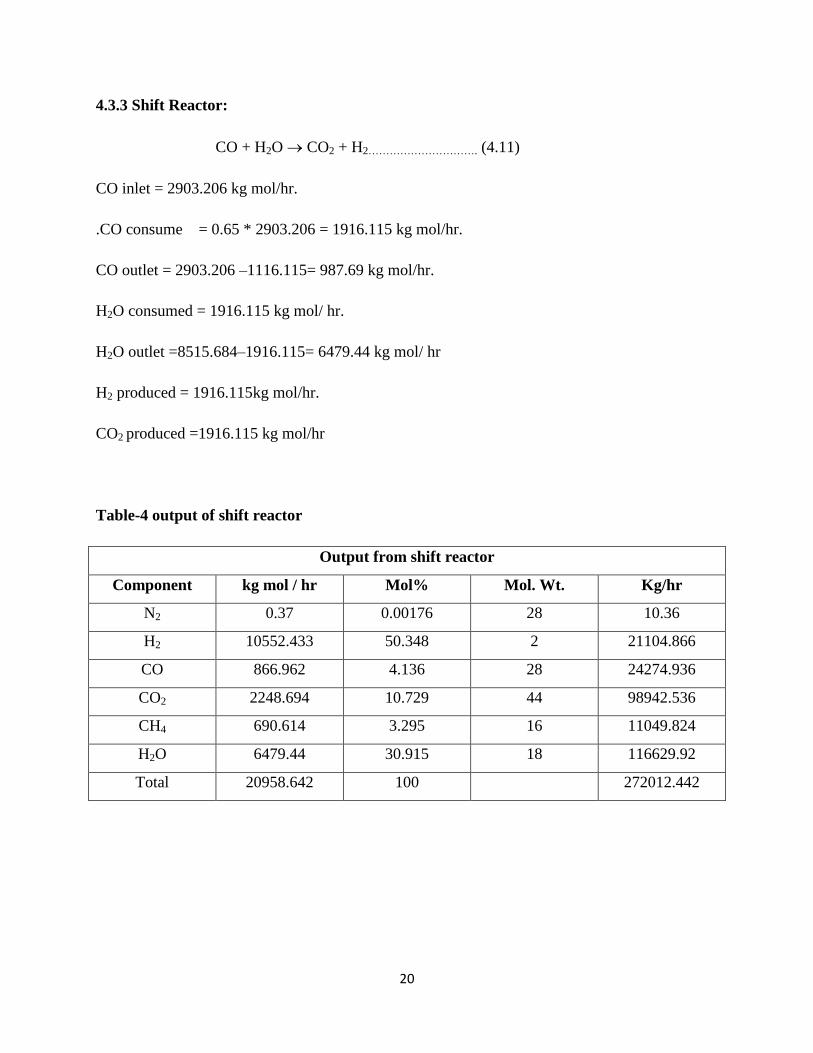
4.3.3 Shift Reactor:
CO + H2O CO2 + H2…………………………. (4.11)
CO inlet = 2903.206 kg mol/hr.
.CO consume = 0.65 * 2903.206 = 1916.115 kg mol/hr.
CO outlet = 2903.206 –1116.115= 987.69 kg mol/hr.
H2O consumed = 1916.115 kg mol/ hr.
H2O outlet =8515.684–1916.115= 6479.44 kg mol/ hr
H2 produced = 1916.115kg mol/hr.
CO2 produced =1916.115 kg mol/hr
Table-4 output of shift reactor
Output from shift reactor
Component kg mol / hr Mol% Mol. Wt. Kg/hr
N2 0.37 0.00176 28 10.36
H2 10552.433 50.348 2 21104.866
CO 866.962 4.136 28 24274.936
CO2 2248.694 10.729 44 98942.536
CH4 690.614 3.295 16 11049.824
H2O 6479.44 30.915 18 116629.92
Total 20958.642 100 272012.442
Page 31
21
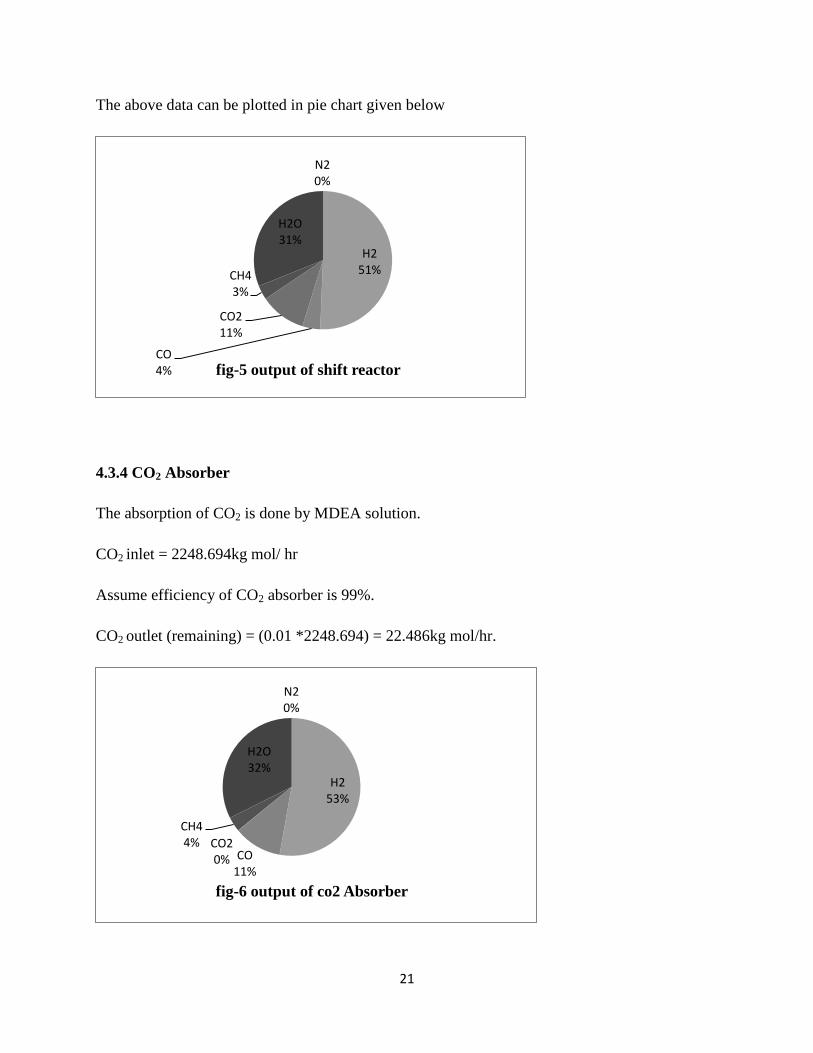
The above data can be plotted in pie chart given below
4.3.4 CO2 Absorber
The absorption of CO2 is done by MDEA solution.
CO2 inlet = 2248.694kg mol/ hr
Assume efficiency of CO2 absorber is 99%.
CO2 outlet (remaining) = (0.01 *2248.694) = 22.486kg mol/hr.
N2 0%
H2 51%
CO 4%
CO2 11%
CH4 3%
H2O 31%
fig-5 output of shift reactor
N2 0%
H2 53%
CO 11%
CO2 0%
CH4 4%
H2O 32%
fig-6 output of co2 Absorber
Page 32
22
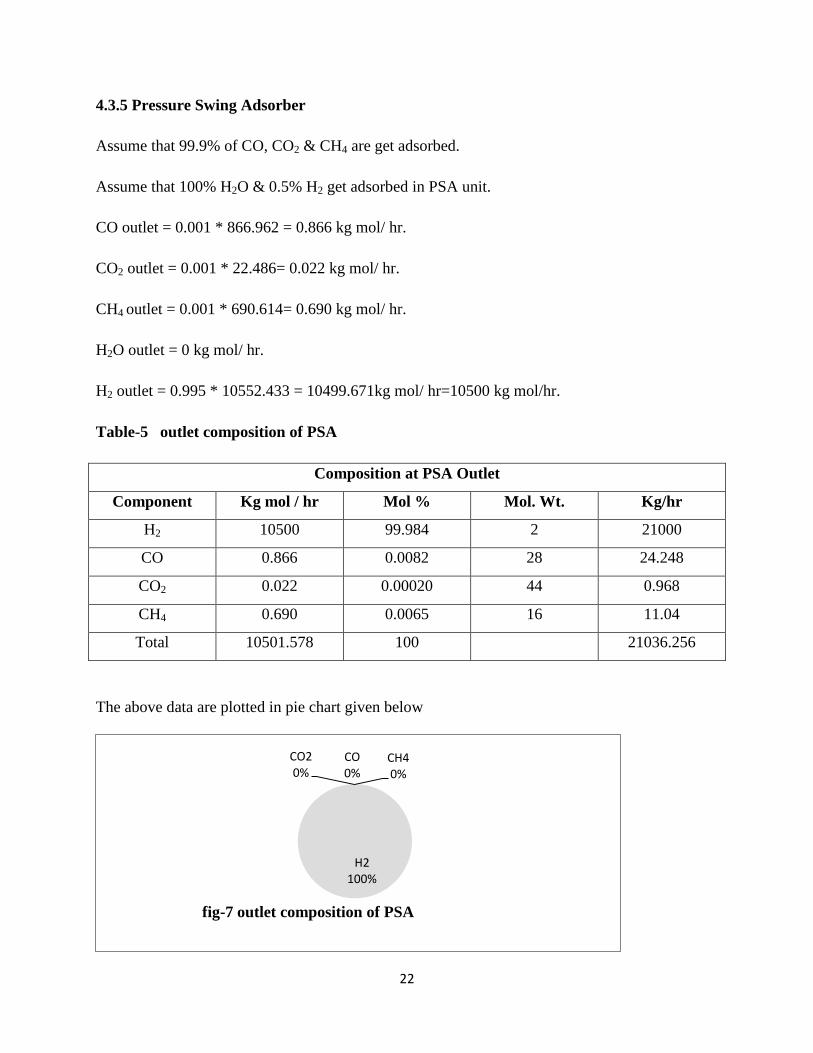
4.3.5 Pressure Swing Adsorber
Assume that 99.9% of CO, CO2 & CH4 are get adsorbed.
Assume that 100% H2O & 0.5% H2 get adsorbed in PSA unit.
CO outlet = 0.001 * 866.962 = 0.866 kg mol/ hr.
CO2 outlet = 0.001 * 22.486= 0.022 kg mol/ hr.
CH4 outlet = 0.001 * 690.614= 0.690 kg mol/ hr.
H2O outlet = 0 kg mol/ hr.
H2 outlet = 0.995 * 10552.433 = 10499.671kg mol/ hr=10500 kg mol/hr.
Table-5 outlet composition of PSA
Composition at PSA Outlet
Component Kg mol / hr Mol % Mol. Wt. Kg/hr
H2 10500 99.984 2 21000
CO 0.866 0.0082 28 24.248
CO2 0.022 0.00020 44 0.968
CH4 0.690 0.0065 16 11.04
Total 10501.578 100 21036.256
The above data are plotted in pie chart given below
H2 100%
CO 0%
CO2 0%
CH4 0%
fig-7 outlet composition of PSA
Page 33
23
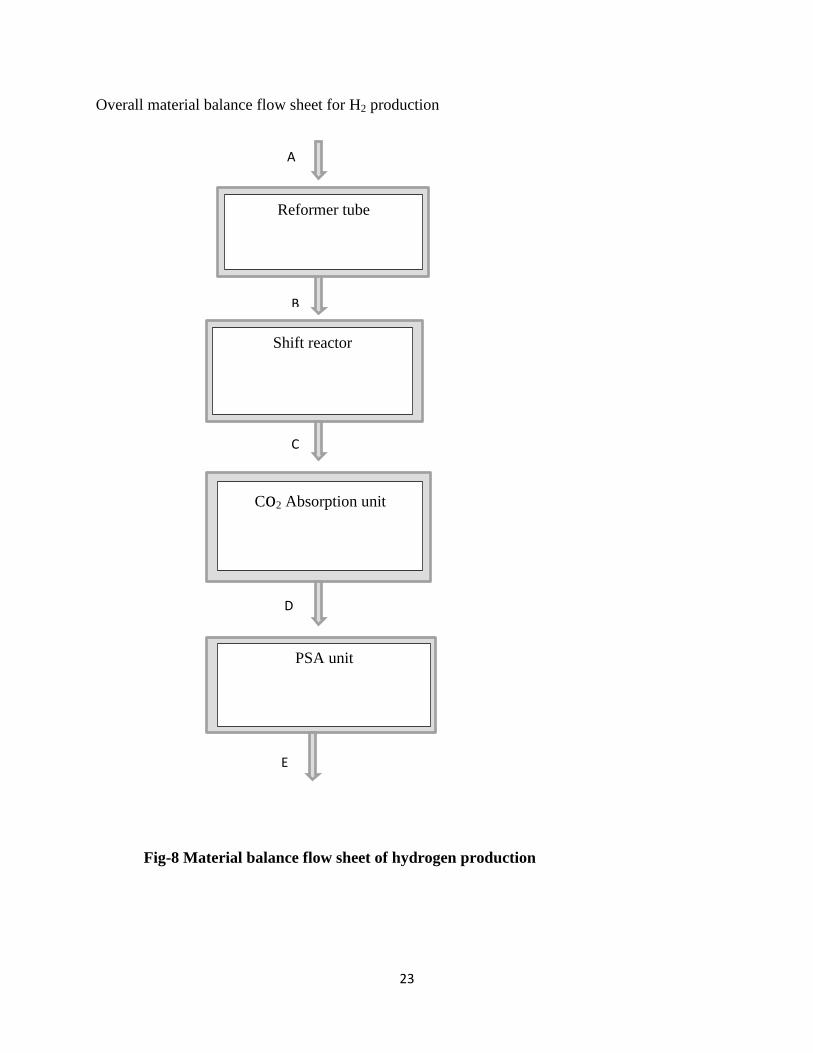
Overall material balance flow sheet for H2 production
Fig-8 Material balance flow sheet of hydrogen production
Reformer tube
Shift reactor
Co2 Absorption unit
PSA unit
A
C
B
D
E
Page 34
24
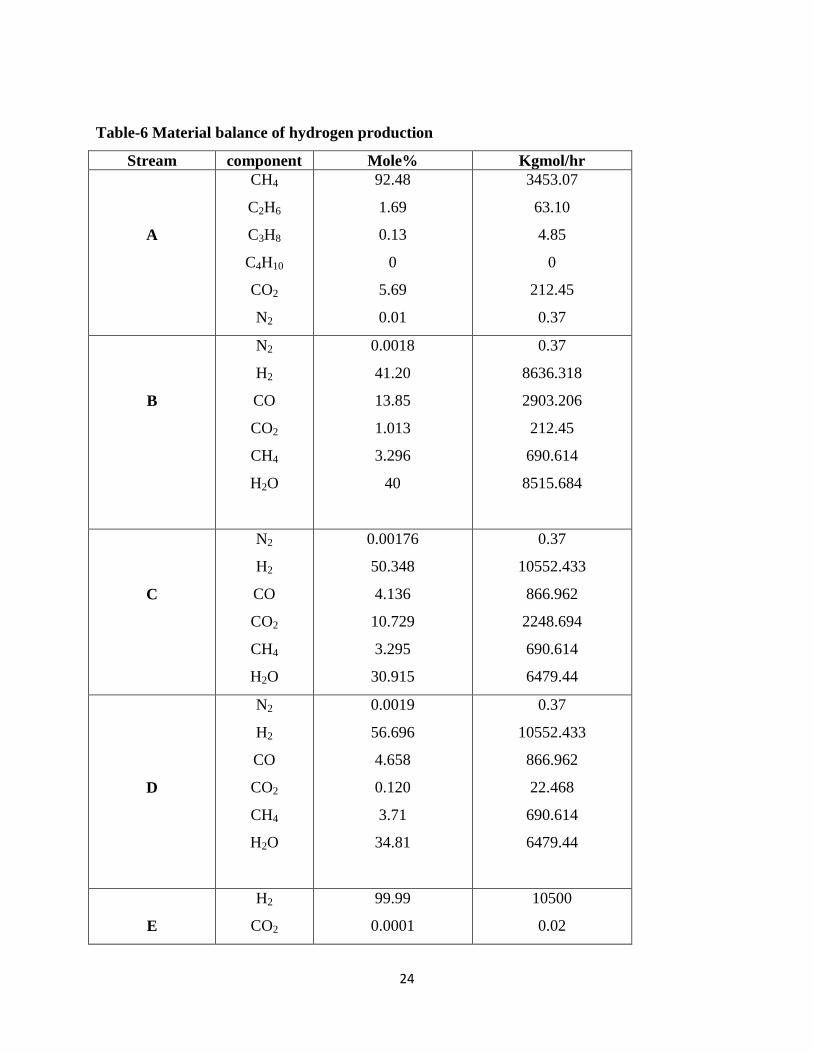
Table-6 Material balance of hydrogen production
Stream component Mole% Kgmol/hr
A
CH4
C2H6
C3H8
C4H10
CO2
N2
92.48
1.69
0.13
0
5.69
0.01
3453.07
63.10
4.85
0
212.45
0.37
B
N2
H2
CO
CO2
CH4
H2O
0.0018
41.20
13.85
1.013
3.296
40
0.37
8636.318
2903.206
212.45
690.614
8515.684
C
N2
H2
CO
CO2
CH4
H2O
0.00176
50.348
4.136
10.729
3.295
30.915
0.37
10552.433
866.962
2248.694
690.614
6479.44
D
N2
H2
CO
CO2
CH4
H2O
0.0019
56.696
4.658
0.120
3.71
34.81
0.37
10552.433
866.962
22.468
690.614
6479.44
E
H2
CO2
99.99
0.0001
10500
0.02
Page 35
25
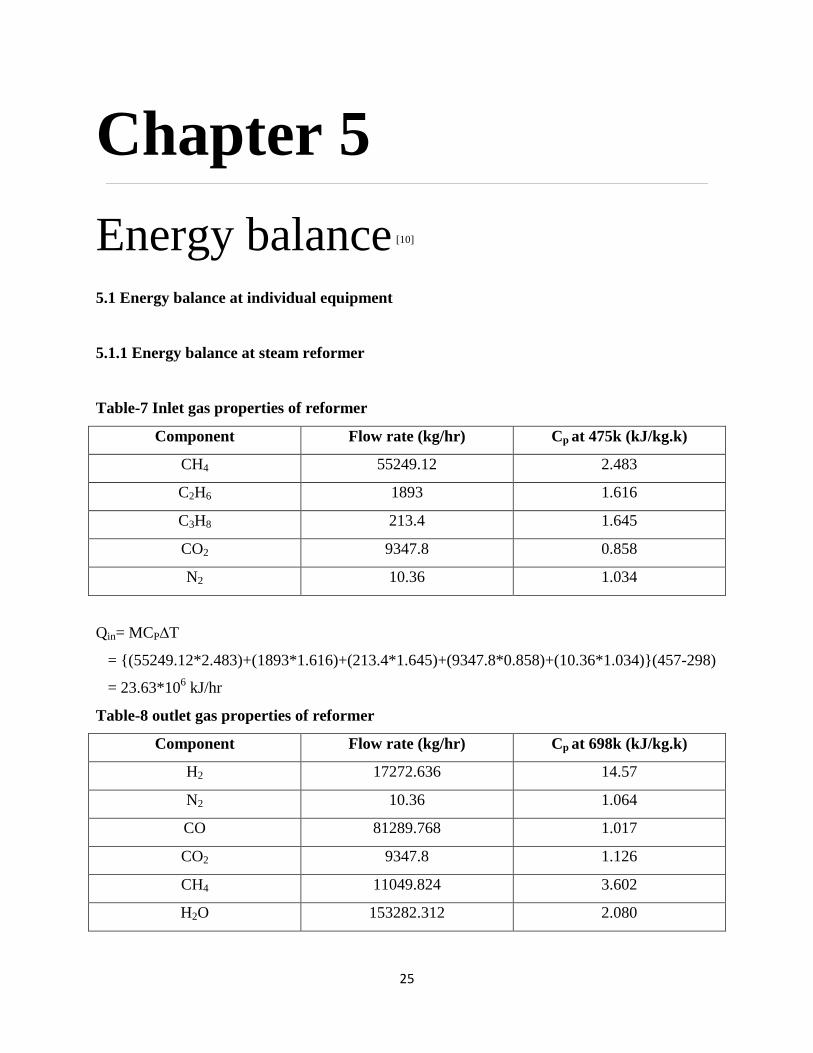
Chapter 5
Energy balance [10]
5.1 Energy balance at individual equipment
5.1.1 Energy balance at steam reformer
Table-7 Inlet gas properties of reformer
Component Flow rate (kg/hr) Cp at 475k (kJ/kg.k)
CH4 55249.12 2.483
C2H6 1893 1.616
C3H8 213.4 1.645
CO2 9347.8 0.858
N2 10.36 1.034
Qin= MCP∆T
= {(55249.12*2.483)+(1893*1.616)+(213.4*1.645)+(9347.8*0.858)+(10.36*1.034)}(457-298)
= 23.63*106 kJ/hr
Table-8 outlet gas properties of reformer
Component Flow rate (kg/hr) Cp at 698k (kJ/kg.k)
H2 17272.636 14.57
N2 10.36 1.064
CO 81289.768 1.017
CO2 9347.8 1.126
CH4 11049.824 3.602
H2O 153282.312 2.080
Page 36
26
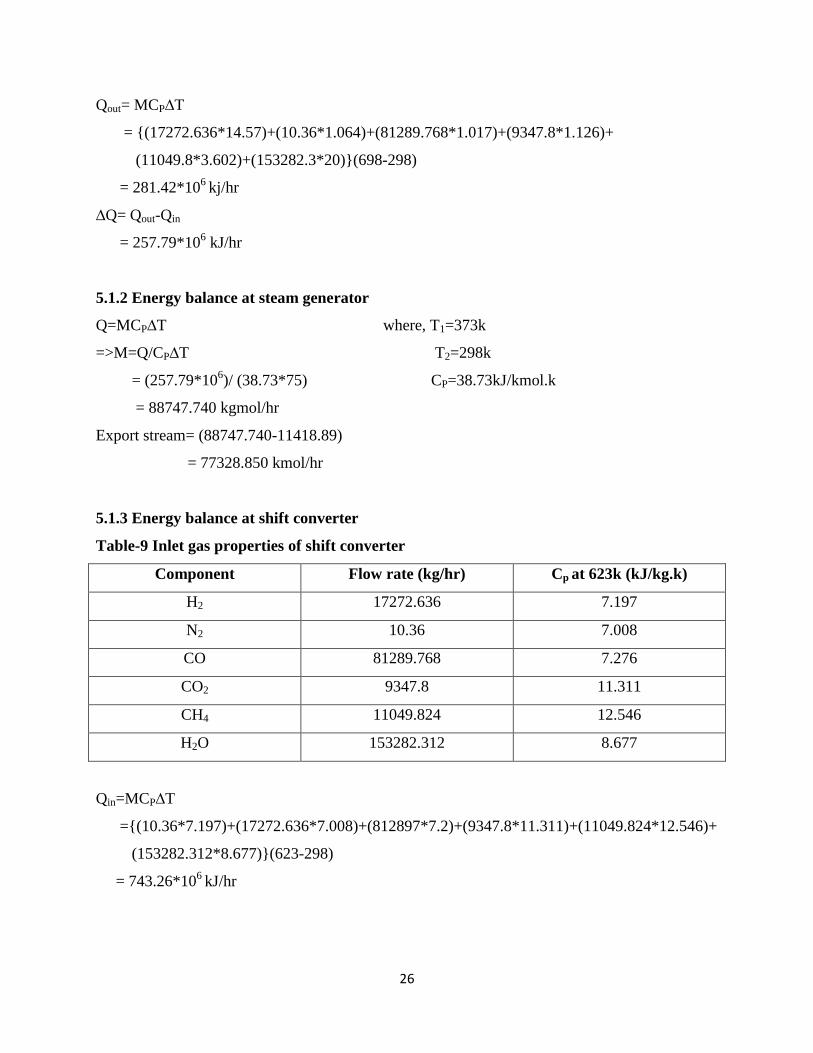
Qout= MCP∆T
= {(17272.636*14.57)+(10.36*1.064)+(81289.768*1.017)+(9347.8*1.126)+
(11049.8*3.602)+(153282.3*20)}(698-298)
= 281.42*106
kj/hr
∆Q= Qout-Qin
= 257.79*106 kJ/hr
5.1.2 Energy balance at steam generator
Q=MCP∆T where, T1=373k
=>M=Q/CP∆T T2=298k
= (257.79*106)/ (38.73*75) CP=38.73kJ/kmol.k
= 88747.740 kgmol/hr
Export stream= (88747.740-11418.89)
= 77328.850 kmol/hr
5.1.3 Energy balance at shift converter
Table-9 Inlet gas properties of shift converter
Component Flow rate (kg/hr) Cp at 623k (kJ/kg.k)
H2 17272.636 7.197
N2 10.36 7.008
CO 81289.768 7.276
CO2 9347.8 11.311
CH4 11049.824 12.546
H2O 153282.312 8.677
Qin=MCP∆T
={(10.36*7.197)+(17272.636*7.008)+(812897*7.2)+(9347.8*11.311)+(11049.824*12.546)+
(153282.312*8.677)}(623-298)
= 743.26*106
kJ/hr
Page 37
27
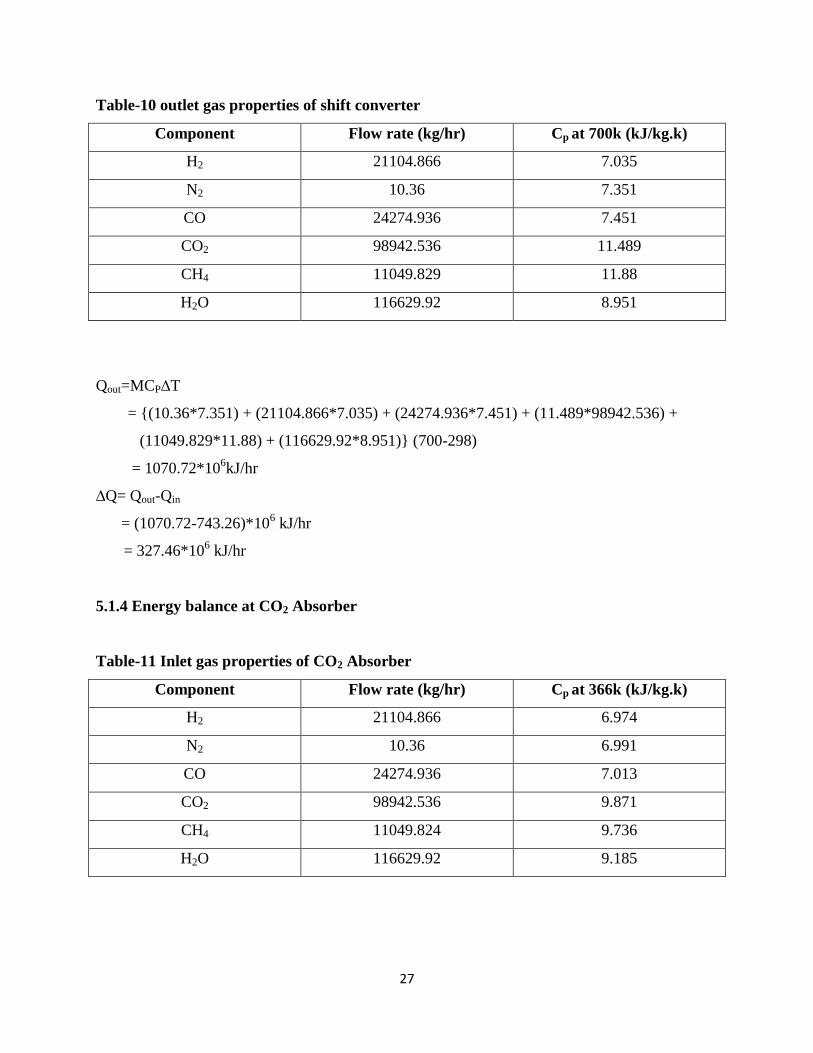
Table-10 outlet gas properties of shift converter
Component Flow rate (kg/hr) Cp at 700k (kJ/kg.k)
H2 21104.866 7.035
N2 10.36 7.351
CO 24274.936 7.451
CO2 98942.536 11.489
CH4 11049.829 11.88
H2O 116629.92 8.951
Qout=MCP∆T
= {(10.36*7.351) + (21104.866*7.035) + (24274.936*7.451) + (11.489*98942.536) +
(11049.829*11.88) + (116629.92*8.951)} (700-298)
= 1070.72*106kJ/hr
∆Q= Qout-Qin
= (1070.72-743.26)*106 kJ/hr
= 327.46*106 kJ/hr
5.1.4 Energy balance at CO2 Absorber
Table-11 Inlet gas properties of CO2 Absorber
Component Flow rate (kg/hr) Cp at 366k (kJ/kg.k)
H2 21104.866 6.974
N2 10.36 6.991
CO 24274.936 7.013
CO2 98942.536 9.871
CH4 11049.824 9.736
H2O 116629.92 9.185
Page 38
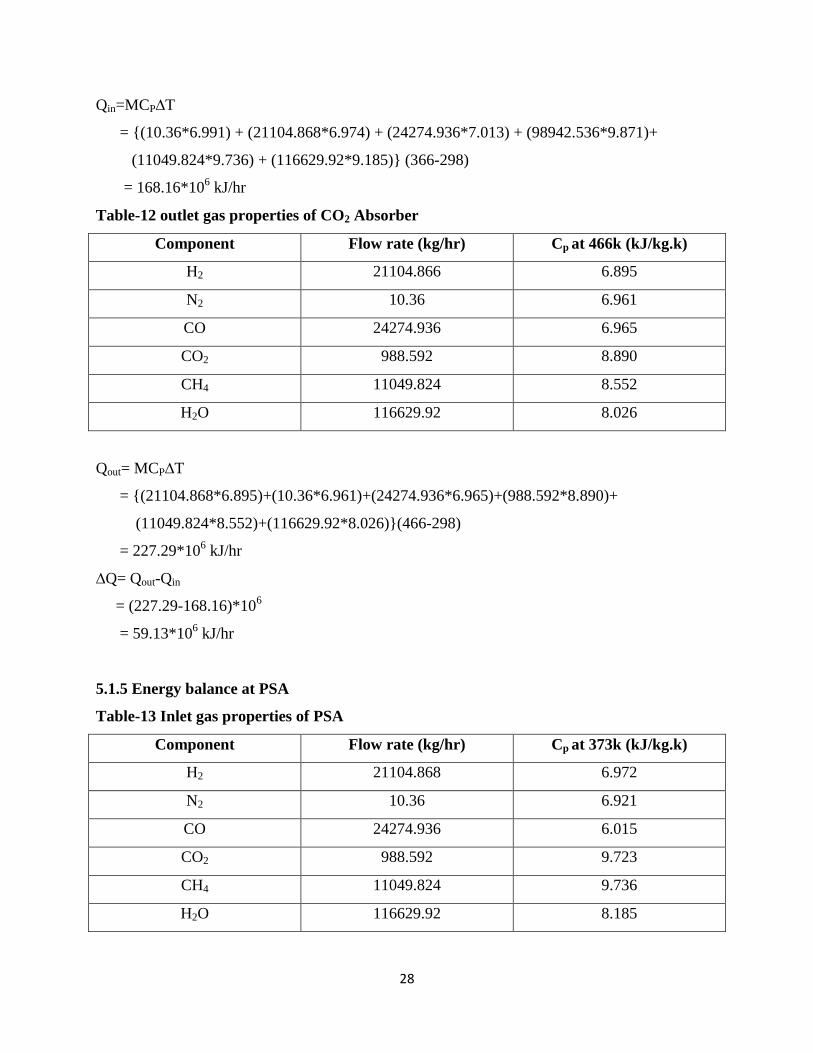
28
Qin=MCP∆T
= {(10.36*6.991) + (21104.868*6.974) + (24274.936*7.013) + (98942.536*9.871)+
(11049.824*9.736) + (116629.92*9.185)} (366-298)
= 168.16*106 kJ/hr
Table-12 outlet gas properties of CO2 Absorber
Component Flow rate (kg/hr) Cp at 466k (kJ/kg.k)
H2 21104.866 6.895
N2 10.36 6.961
CO 24274.936 6.965
CO2 988.592 8.890
CH4 11049.824 8.552
H2O 116629.92 8.026
Qout= MCP∆T
= {(21104.868*6.895)+(10.36*6.961)+(24274.936*6.965)+(988.592*8.890)+
(11049.824*8.552)+(116629.92*8.026)}(466-298)
= 227.29*106 kJ/hr
∆Q= Qout-Qin
= (227.29-168.16)*106
= 59.13*106 kJ/hr
5.1.5 Energy balance at PSA
Table-13 Inlet gas properties of PSA
Component Flow rate (kg/hr) Cp at 373k (kJ/kg.k)
H2 21104.868 6.972
N2 10.36 6.921
CO 24274.936 6.015
CO2 988.592 9.723
CH4 11049.824 9.736
H2O 116629.92 8.185
Page 39
29
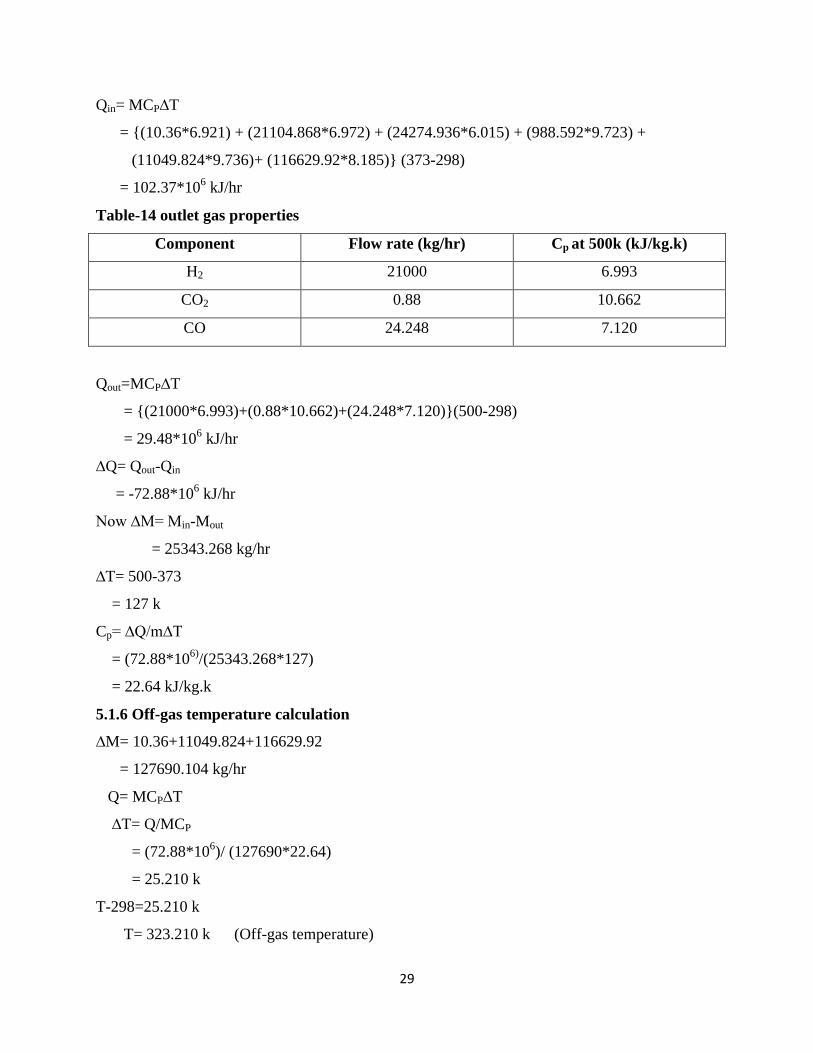
Qin= MCP∆T
= {(10.36*6.921) + (21104.868*6.972) + (24274.936*6.015) + (988.592*9.723) +
(11049.824*9.736)+ (116629.92*8.185)} (373-298)
= 102.37*106 kJ/hr
Table-14 outlet gas properties
Component Flow rate (kg/hr) Cp at 500k (kJ/kg.k)
H2 21000 6.993
CO2 0.88 10.662
CO 24.248 7.120
Qout=MCP∆T
= {(21000*6.993)+(0.88*10.662)+(24.248*7.120)}(500-298)
= 29.48*106 kJ/hr
∆Q= Qout-Qin
= -72.88*106 kJ/hr
Now ∆M= Min-Mout
= 25343.268 kg/hr
∆T= 500-373
= 127 k
Cp= ∆Q/m∆T
= (72.88*106)
/(25343.268*127)
= 22.64 kJ/kg.k
5.1.6 Off-gas temperature calculation
∆M= 10.36+11049.824+116629.92
= 127690.104 kg/hr
Q= MCP∆T
∆T= Q/MCP
= (72.88*106)/ (127690*22.64)
= 25.210 k
T-298=25.210 k
T= 323.210 k (Off-gas temperature)
Page 40
30
Chapter 6
Equipment design
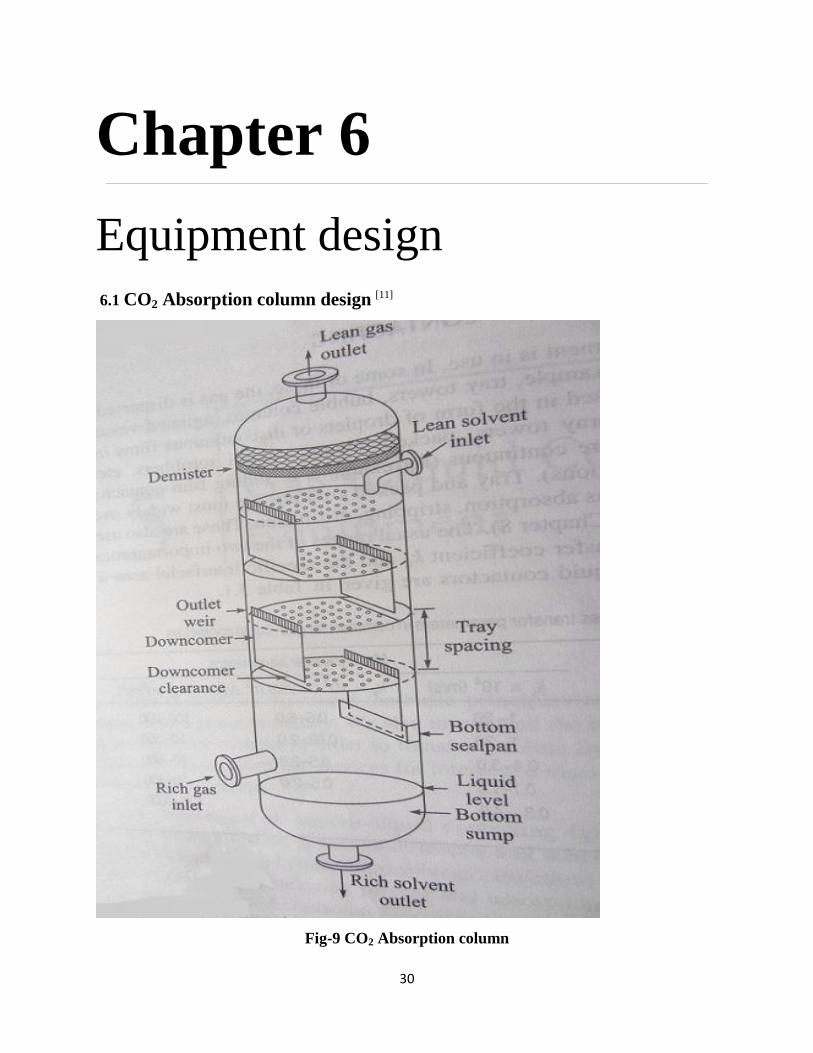
6.1 CO2 Absorption column design [11]
Fig-9 CO2 Absorption column
Page 41
31
Basis: 99% of CO2 is absorbed
The feed gas rate= 20838.513 kmol/hr
G1= 20838.513 kmol/hr
Feed concentration, y1= 0.107 mole
Y1= y1/ (1-y1)
= (0.107)/ (1-0.107)
= 0.119 mole
Feed gas rate on solute free basis (Gs) = G1* (1-y1)
= 20838.5(1-0.107)
= 18608.79 kmol/hr
CO2 gas entering = G1y1
= (20838.513)*(0.107)
= 2229.72 kmol/hr
Therefore CO2 absorbed= 2229.72*0.99
= 2207.42 kmol/hr
CO2 leaving= 22.3 kmol/hr
Concentration of Y2= 22.3/ GS
= 22.03/18608.79
= 0.0019 mole
Concentration of y2= Y2/ (1+Y2)
= 0.0019/(1+0.0019)
= 0.0018 mole
Equation of equilibrium line Y= 1.32X……………………. (6.1)
X1= Y1 /1.32
= 0.119/1.32
= 0.09
Now the material balance equation is GS (Y1-Y2) = LS(X1-X2)
18608.79(0.119-0.0019) =LS (0.09-0)
LS=24212 kmol/hr
Actual liquid rate is 1.25 times the original, LS= 1.25*24212
= 30265.12 kmol/hr
Page 42
32
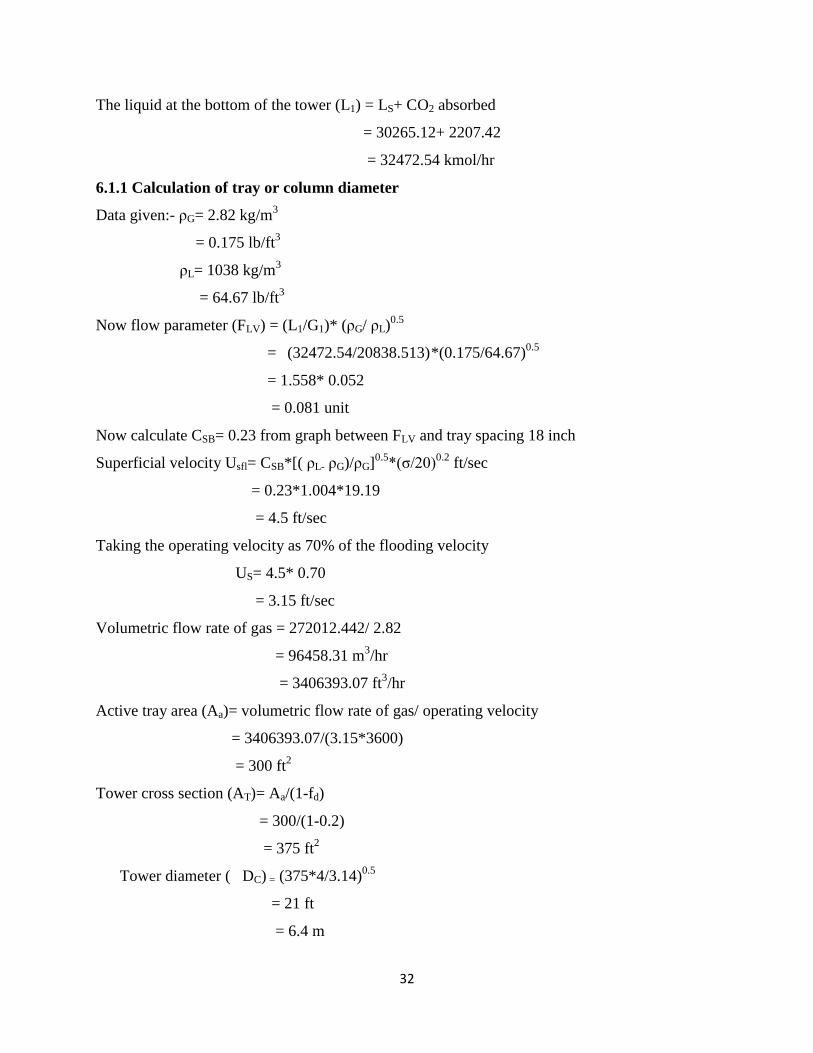
The liquid at the bottom of the tower (L1) = LS+ CO2 absorbed
= 30265.12+ 2207.42
= 32472.54 kmol/hr
6.1.1 Calculation of tray or column diameter
Data given:- ρG= 2.82 kg/m3
= 0.175 lb/ft3
ρL= 1038 kg/m3
= 64.67 lb/ft3
Now flow parameter (FLV) = (L1/G1)* (ρG/ ρL)0.5
= (32472.54/20838.513) *(0.175/64.67)0.5
= 1.558* 0.052
= 0.081 unit
Now calculate CSB= 0.23 from graph between FLV and tray spacing 18 inch
Superficial velocity Usfl= CSB*[( ρL- ρG)/ρG]0.5
*(σ/20)0.2
ft/sec
= 0.23*1.004*19.19
= 4.5 ft/sec
Taking the operating velocity as 70% of the flooding velocity
US= 4.5* 0.70
= 3.15 ft/sec
Volumetric flow rate of gas = 272012.442/ 2.82
= 96458.31 m3/hr
= 3406393.07 ft3/hr
Active tray area (Aa)= volumetric flow rate of gas/ operating velocity
= 3406393.07/(3.15*3600)
= 300 ft2
Tower cross section (AT)= Aa/(1-fd)
= 300/(1-0.2)
= 375 ft2
Tower diameter ( DC) = (375*4/3.14)0.5
= 21 ft
= 6.4 m
Page 43
33
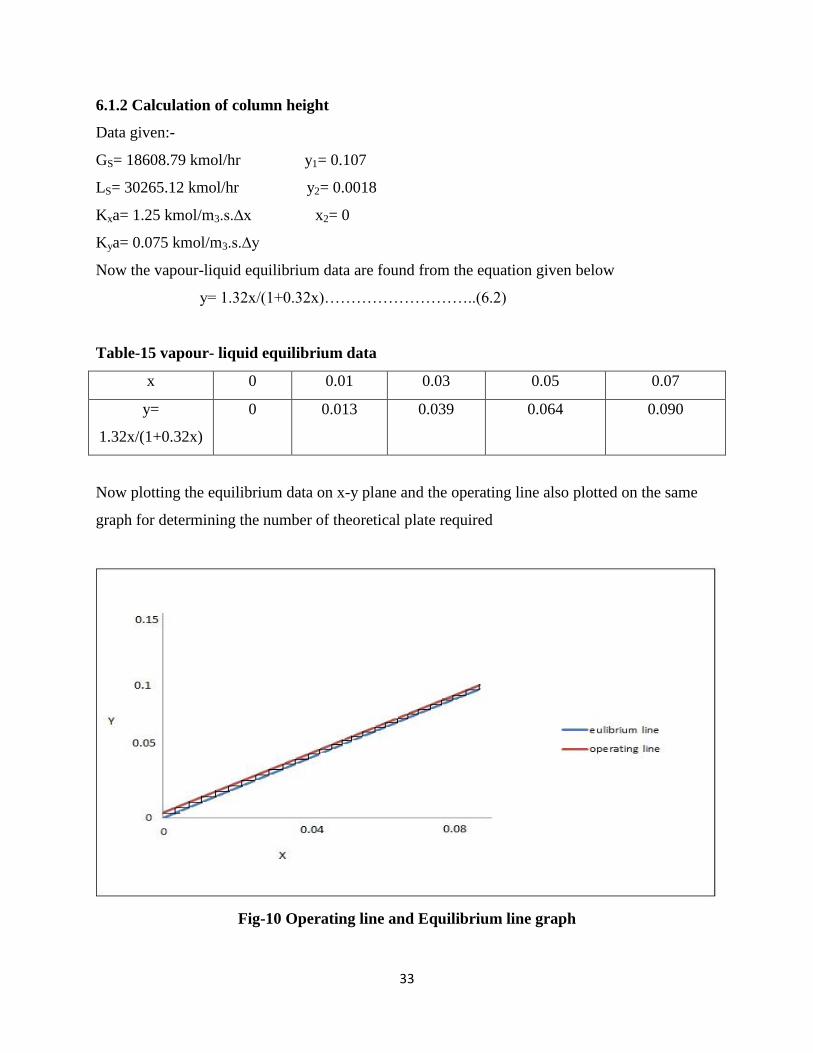
6.1.2 Calculation of column height
Data given:-
GS= 18608.79 kmol/hr y1= 0.107
LS= 30265.12 kmol/hr y2= 0.0018
Kxa= 1.25 kmol/m3.s.∆x x2= 0
Kya= 0.075 kmol/m3.s.∆y
Now the vapour-liquid equilibrium data are found from the equation given below
y= 1.32x/(1+0.32x)………………………..(6.2)
Table-15 vapour- liquid equilibrium data
x 0 0.01 0.03 0.05 0.07
y=
1.32x/(1+0.32x)
0 0.013 0.039 0.064 0.090
Now plotting the equilibrium data on x-y plane and the operating line also plotted on the same
graph for determining the number of theoretical plate required
Fig-10 Operating line and Equilibrium line graph
Page 44
34
From graph the number of ideal tray found is equal to 26
Number of real tray =
= 26/ 0.65
= 40
Now the slop –Kxa/Kya= -1.25/0.075
= - 16. 67
Now P1(x,y) = (0.0805, 0.107)
From graph P1 (xi, yi) = (0.0905, 0.103)
Slop -Kxa/Kya = - (Kxa/Kya)*(1-y) im/ (1-x)im
Now
= 0.894
= 0.914
-Kxa/Kya = - (Kxa/Kya)*(1-y) im/ (1-x) im
= -16.67*(0.894/0.914)
= -16.30
From graph P2(x,y) = (0.035, 0.050)
P2 (xi, yi) = (0.0375, 0.048)
= 0.950
Page 45
35
= 0.963
-Kxa/Kya = -16.67*(0.950/0.963)
= -16.44
From graph P3(x,y) = (0.0275,0.040)
P3(xi,yi)= (0.03, 0.038)
= 0.960
= 0.971
-Kxa/Kya= -16.67*(0.960/0.971)
= -16.48
NtG= ∫
= ∫
= Area under the graph
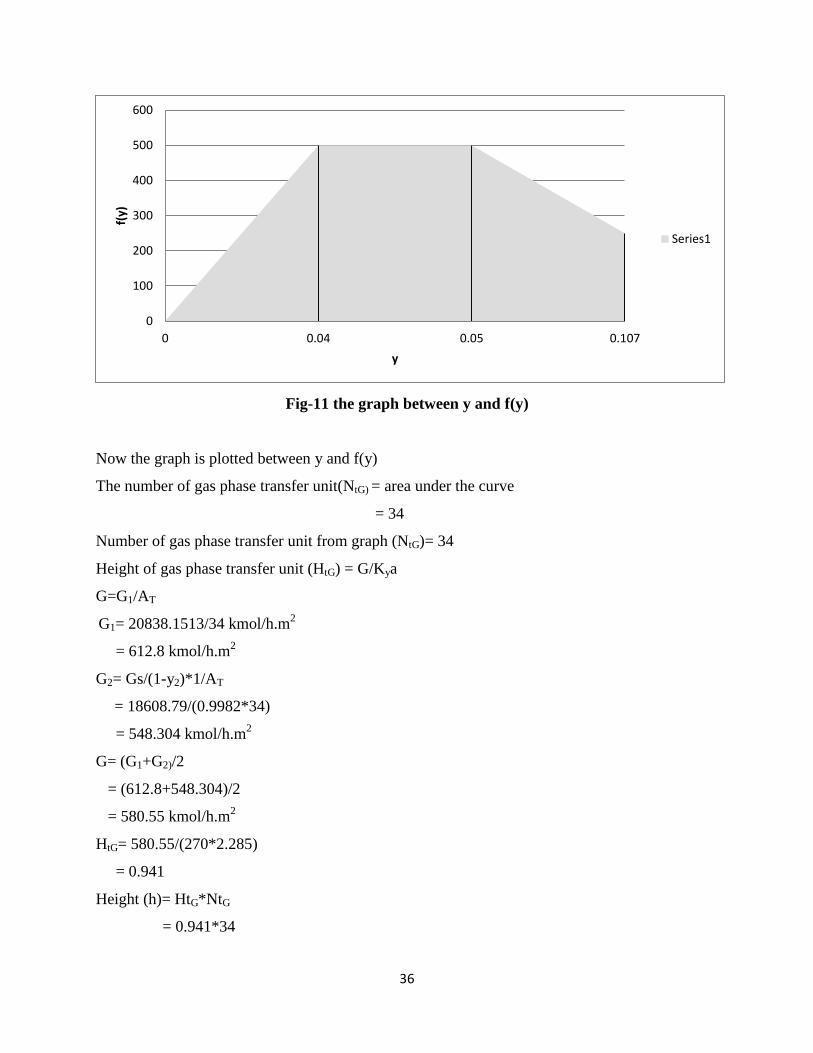
Table-16 Data of y and f(y)
y 0.107 0.050 0.040
yi 0.103 0.048 0.038
f(y) 250 500 500
Page 46
36
Fig-11 the graph between y and f(y)
Now the graph is plotted between y and f(y)
The number of gas phase transfer unit(NtG) = area under the curve
= 34
Number of gas phase transfer unit from graph (NtG)= 34
Height of gas phase transfer unit (HtG) = G/Kya
G=G1/AT
G1= 20838.1513/34 kmol/h.m2
= 612.8 kmol/h.m2
G2= Gs/(1-y2)*1/AT
= 18608.79/(0.9982*34)
= 548.304 kmol/h.m2
G= (G1+G2)/2
= (612.8+548.304)/2
= 580.55 kmol/h.m2
HtG= 580.55/(270*2.285)
= 0.941
Height (h)= HtG*NtG
= 0.941*34
0
100
200
300
400
500
600
0 0.04 0.05 0.107
f(y)
y
Series1
Page 47
37
= 32 m
Mechanical design [12]
6.1.3 Shell design
Data given:-
Diameter of the column =6.4m
Height of the column= 32m
Outside pressure is 1atm= 0.1 MN/m2
Design pressure Pd= 0.1*1.05
= 0.105 MN/m2
Shell is I.S 2825-1969
Allowable stress f= 98.1 MN/m2
Welding joint efficiency j= 0.85
Modulus of elasticity E= 1*105MN/m
2
Now DO/L= 6.4/32
= 0.2
By using DO/L ratio we can found K and M value from table given in book
Now K=0.224, M=2.54
P= K*E*(t/Do)M
0.105= 0.224*105*(t/6.4)
2.54
t= 0.051 m
= 51 mm
Checking plastic deformation:-
P= 2f*(t/Do)* )]/(*100/)/2.01(5.1[1
1
DotlDoU
Where out of roundness (U) = 1.5% for new vessel
P= 2*98.1*(0.051/6.4)* )]4.6/051.0(*100/)2.0*2.01(5.1*5.1[1
1
= 0.417 MN/m2
0.415>0.105
The shell thickness is correct
Page 48
38
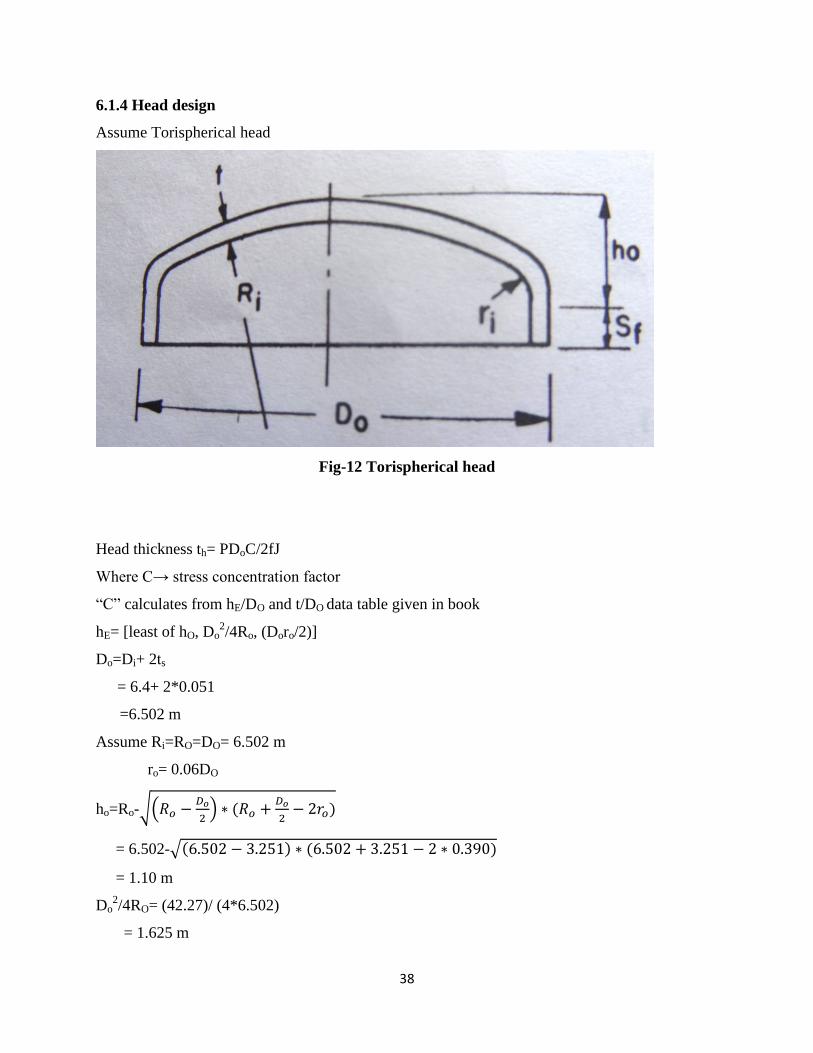
6.1.4 Head design
Assume Torispherical head
Fig-12 Torispherical head
Head thickness th= PDoC/2fJ
Where C→ stress concentration factor
“C” calculates from hE/DO and t/DO data table given in book
hE= [least of hO, Do2/4Ro, (Doro/2)]
Do=Di+ 2ts
= 6.4+ 2*0.051
=6.502 m
Assume Ri=RO=DO= 6.502 m
ro= 0.06DO
ho=Ro-√(
)
= 6.502-√
= 1.10 m
Do2/4RO= (42.27)/ (4*6.502)
= 1.625 m
Page 49
39
(Doro/2)1/2
= (6.502*0.390/2)0.5
= 1.126 m
hE=ho=1.10
hE/Do=1.10/6.502
= 0.169
t/Do= PC/2fJ
= 0.105*C/ (2*98.1*0.85)
t/Do = 0.6*10-3
C
Now C can found from t/Doand hE/Do table given in book
t/Do= 0.002
C= 4.1
th= 0.002*Do
= 0.002*6.502
= 0.013 m
= 13 mm
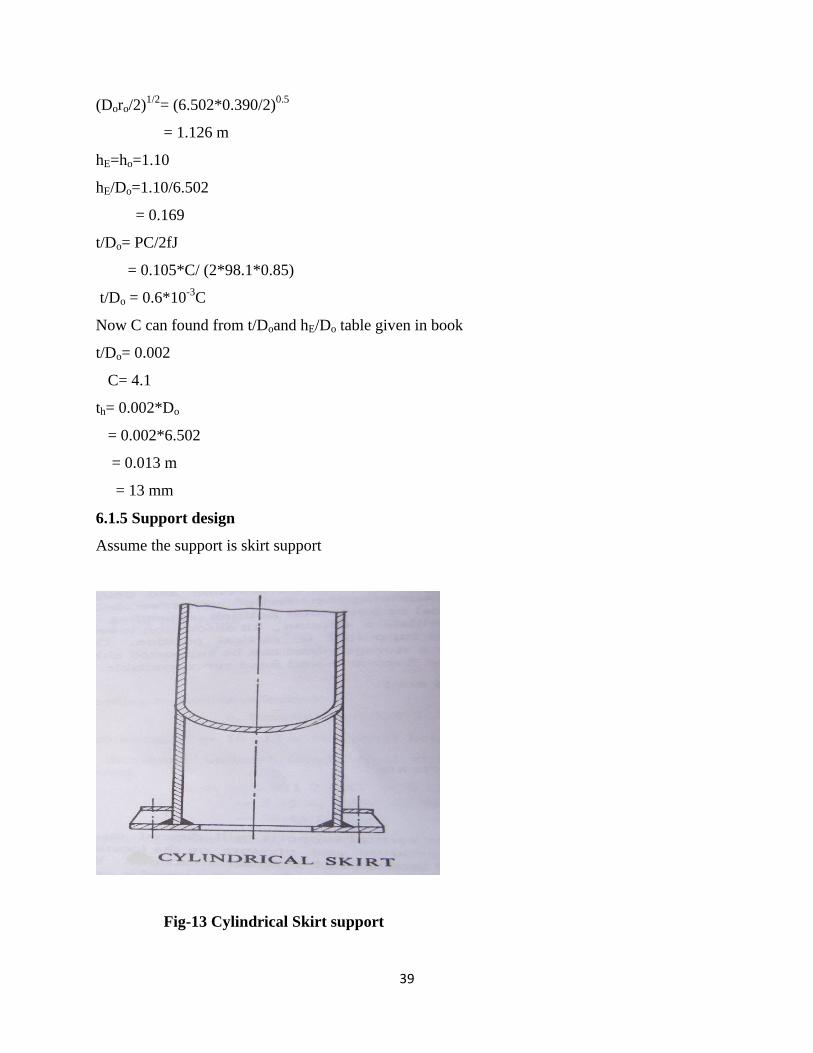
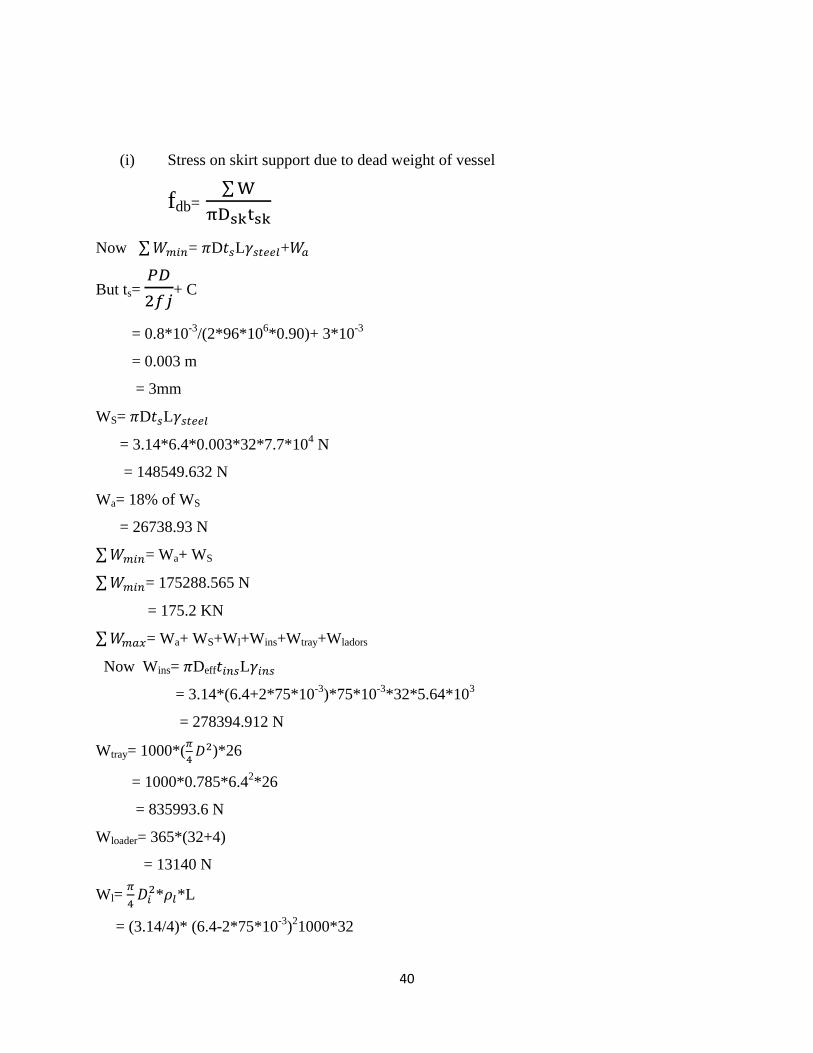
6.1.5 Support design
Assume the support is skirt support
Fig-13 Cylindrical Skirt support
Page 50
40
(i) Stress on skirt support due to dead weight of vessel
fdb= ∑
Now ∑ = D L +
But ts=
+ C
= 0.8*10-3
/(2*96*106*0.90)+ 3*10
-3
= 0.003 m
= 3mm
WS= D L
= 3.14*6.4*0.003*32*7.7*104 N
= 148549.632 N
Wa= 18% of WS
= 26738.93 N
∑ = Wa+ WS
∑ = 175288.565 N
= 175.2 KN
∑ = Wa+ WS+Wl+Wins+Wtray+Wladors
Now Wins= Deff L
= 3.14*(6.4+2*75*10-3
)*75*10-3
*32*5.64*103
= 278394.912 N
Wtray= 1000*(
)*26
= 1000*0.785*6.42*26
= 835993.6 N
Wloader= 365*(32+4)
= 13140 N
Wl=
* *L
= (3.14/4)* (6.4-2*75*10-3
)21000*32
Page 51
41
= 981250 N
∑ = 2284067.077 N
= 2284.067 KN
Now to calculate period of vibration
=6.36*10-5
(H/D)3/2
*(W/ts)1/2
= 6.35*10-5
(32/6.4)3/2
(1754.2/0.003)1/2
= 0.167 < 0.5
K2= 1
=6.36*10-5
(H/D)3/2
*(W/ts)1/2
= 6.35*10
-5(32/6.4)
3/2 (2284.067/0.003)
1/2
= 0.615 > 0.5
K2= 2
K1= 0.7 (cylindrical)
K= K1*K2
= 0.7*2
= 1.4
Now fdb (min) = ∑
=
=
KN/m
2
fdb (max) = ∑
=
=
KN/m
2
(ii) Stress due to wind load
Page 52
42
= KP1h1
= 1.4*0.8*21*6.4*10-3
= 0.150 MN
= K P2h2
= 1.4*0.8*11*6.4*10-3
= 0.07884 MN
Total banding moment =
+ *(
)
= 0.150*(21/2)+ 0.07884*32/2
= 2.836 MN
=
=
=
=
MN/m
2
(iii) Stress due to seismic load
T= 0.167 to 0.615
CS (max) = 0.02/T
= 0.02/0.615
= 0.032
CS (min) = 0.02/T
= 0.02/0.167
= `0.119
Now fsb (min) =
=
= 13.83/tsk KN/m2
Page 53
43
fsb (max)=
=
= 48.493/tsk KN/m2
Resultant tensile stress (ft) R= (fwb or fsb) greater- fdb
=
-
= 0.079/tsk MN/m2
Resultant compressive stress (fC) R= (fwb or fsb) greater+ fdb
=
-
= 0.201/ tsk KN/m2
Now (ft) R ftJ
0.079/tsk= 96*0.90
tsk= 0.0009 m
= 0.9 mm
Similarly (fC)R= 0.125*E *(tsk/D)
0.201/tsk= 0.125*2*105*tsk/6.4
tsk= 7.132 *10-3
m
= 7.132 mm
Bolting plate requirement:-
=∑
+
= l
= Do+l
=
l
l= 100 mm = 0.1 m
m= 6.4+ 0.1
= 6.5 m
Page 54
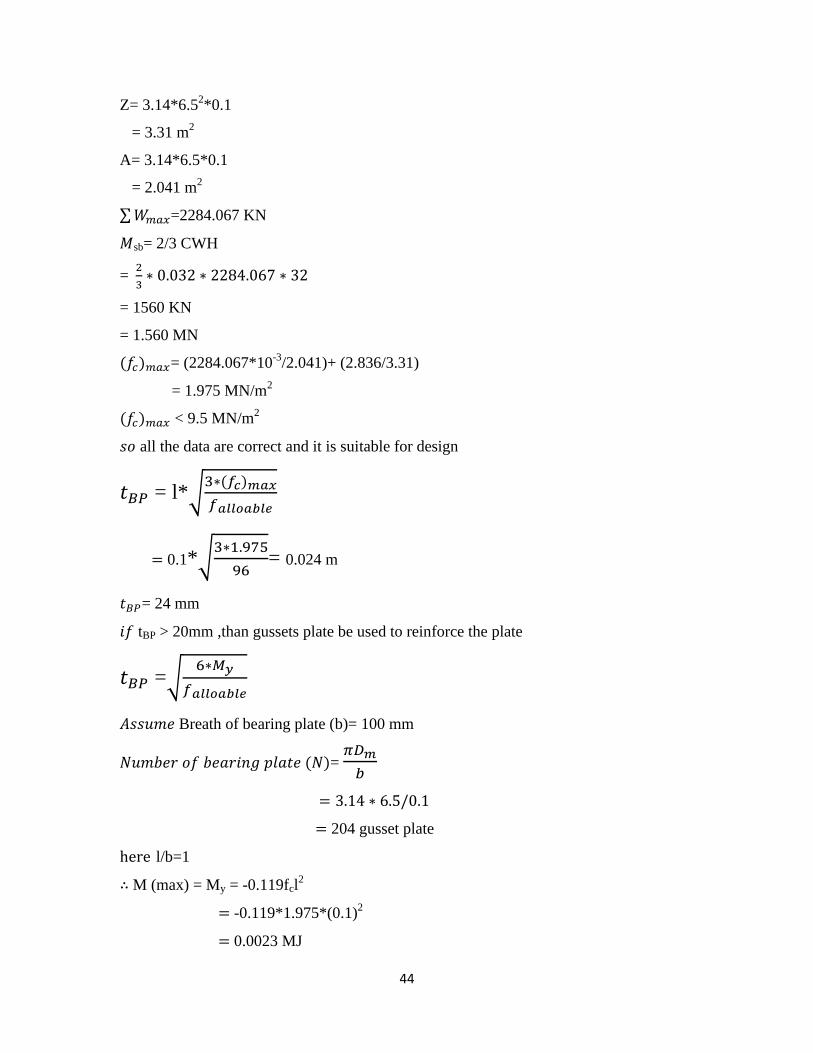
44
Z= 3.14*6.52*0.1
= 3.31 m2
A= 3.14*6.5*0.1
= 2.041 m2
∑ =2284.067 KN
sb= 2/3 CWH
=
= 1560 KN
= 1.560 MN
= (2284.067*10-3
/2.041)+ (2.836/3.31)
= 1.975 MN/m2
< 9.5 MN/m2
all the data are correct and it is suitable for design
= l*√
0.1*√
= 0.024 m
= 24 mm
tBP > 20mm ,than gussets plate be used to reinforce the plate
=√
Breath of bearing plate (b)= 100 mm
=
204 gusset plate
l/b=1
M (max) = My = -0.119fcl2
-0.119*1.975*(0.1)2
0.0023 MJ
Page 55
45
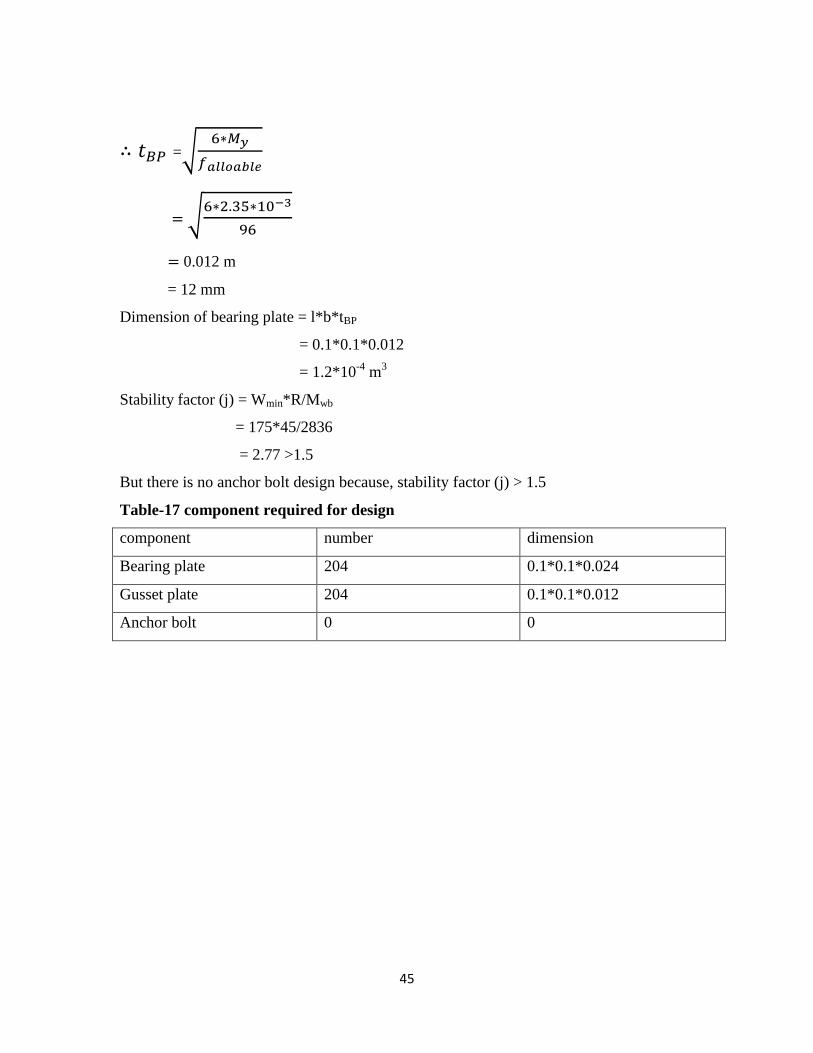
=√
√
0.012 m
= 12 mm
Dimension of bearing plate = l*b*tBP
= 0.1*0.1*0.012
= 1.2*10-4
m3
Stability factor (j) = Wmin*R/Mwb
= 175*45/2836
= 2.77 >1.5
But there is no anchor bolt design because, stability factor (j) > 1.5
Table-17 component required for design
component number dimension
Bearing plate 204 0.1*0.1*0.024
Gusset plate 204 0.1*0.1*0.012
Anchor bolt 0 0
Page 56
46
Table-18 Specification for CO2 Absorber Column
PARAMETER DESCRIPTION
Tower MOC SS304
Tower ID 6.4 m
Tower OD 6.502 m
Shell thickness 0.051 m
Head thickness 0.013
Height of tower(Without support) 32 m
Type of Head Torispherical head
Tower Support Skirt support
Skirt MOC SS304
Skirt Height 4 m
Skirt thickness 0.0009 m
Type Pall ring
MOC Metal (ss)
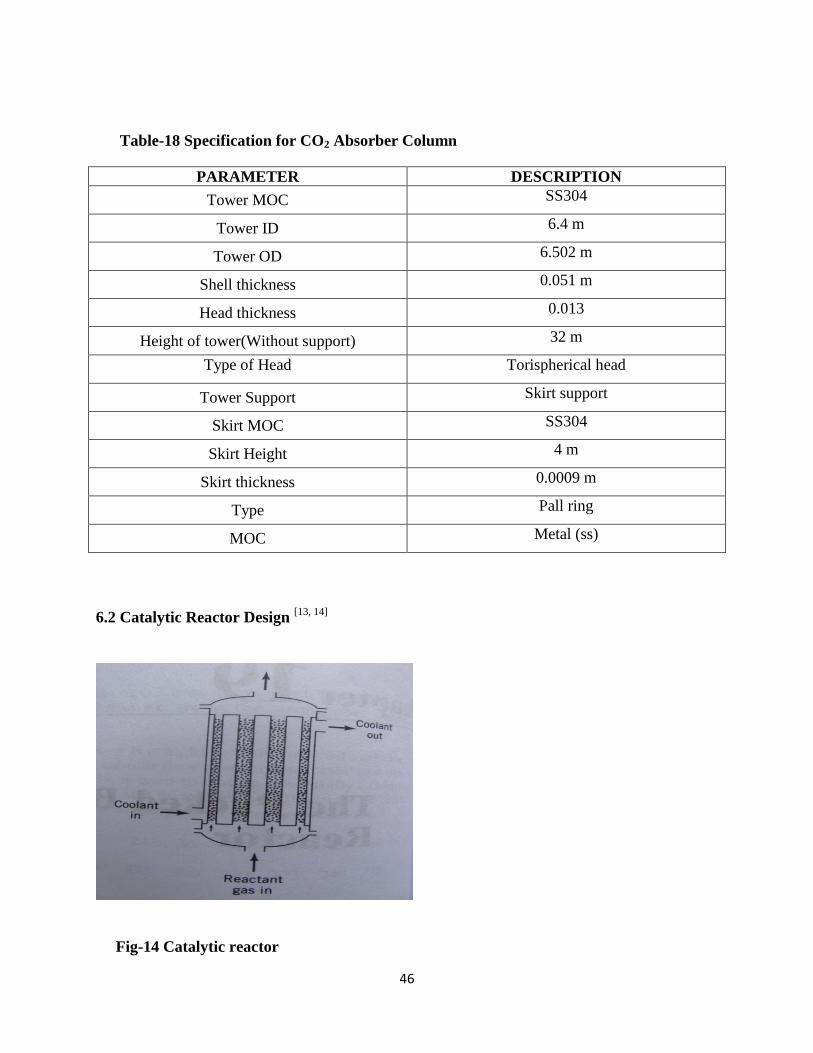
6.2 Catalytic Reactor Design [13, 14]
Fig-14 Catalytic reactor
Page 57
47
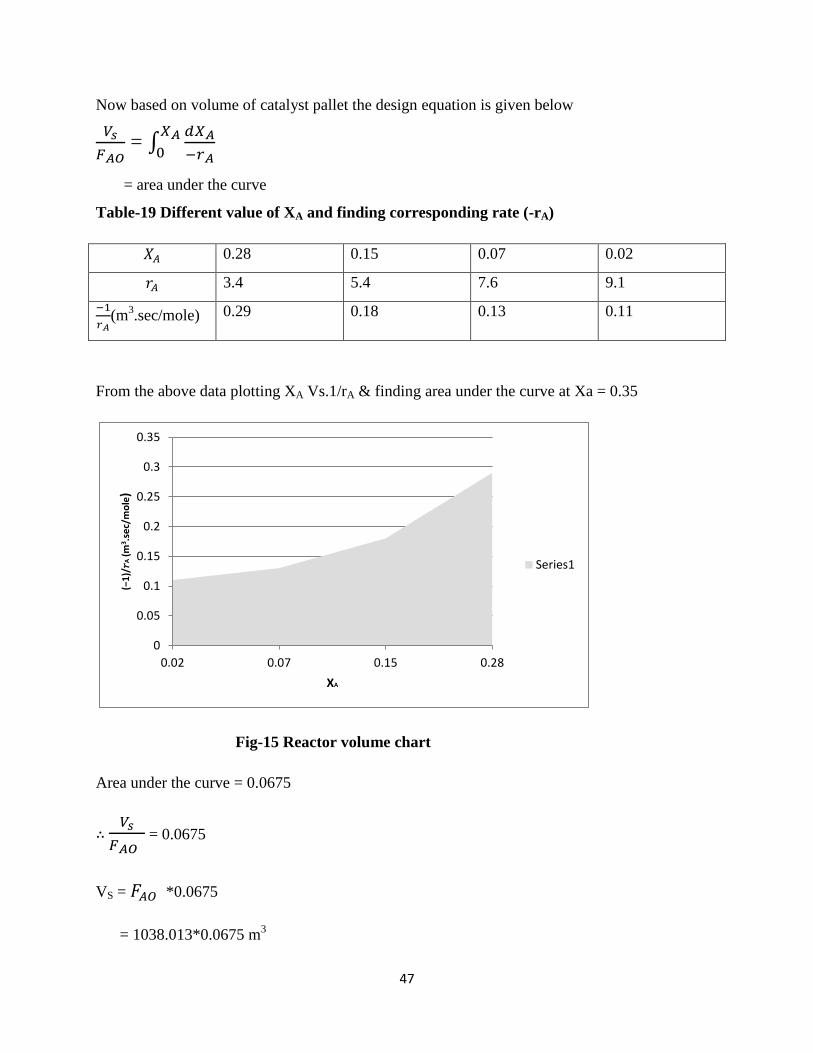
Now based on volume of catalyst pallet the design equation is given below
= ∫
= area under the curve
Table-19 Different value of XA and finding corresponding rate (-rA)
0.28 0.15 0.07 0.02
3.4 5.4 7.6 9.1
(m
3.sec/mole) 0.29 0.18 0.13 0.11
From the above data plotting XA Vs.1/rA & finding area under the curve at Xa = 0.35
Fig-15 Reactor volume chart
Area under the curve = 0.0675
= 0.0675
VS = *0.0675
= 1038.013*0.0675 m3
0
0.05
0.1
0.15
0.2
0.25
0.3
0.35
0.02 0.07 0.15 0.28
(−1)/𝑟A
(m
3 .se
c/m
ole
)
XA
Series1
Page 58
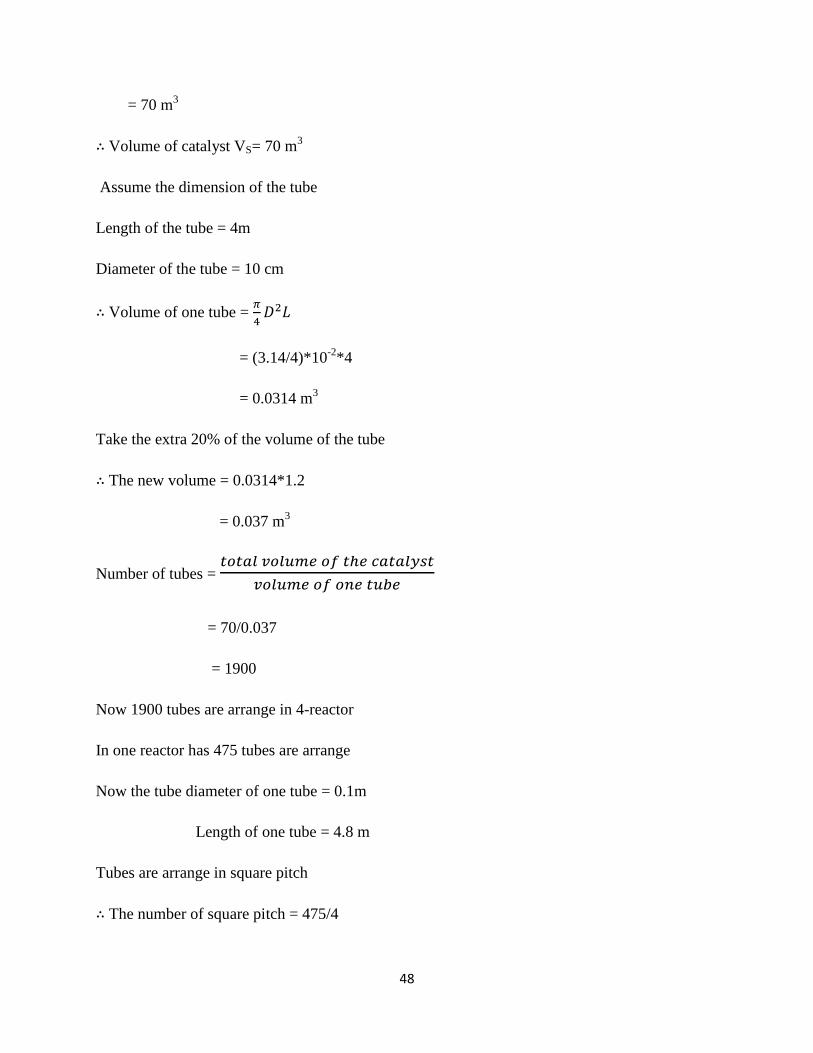
48
= 70 m3
Volume of catalyst VS= 70 m3
Assume the dimension of the tube
Length of the tube = 4m
Diameter of the tube = 10 cm
Volume of one tube =
= (3.14/4)*10-2
*4
= 0.0314 m3
Take the extra 20% of the volume of the tube
The new volume = 0.0314*1.2
= 0.037 m3
Number of tubes =
= 70/0.037
= 1900
Now 1900 tubes are arrange in 4-reactor
In one reactor has 475 tubes are arrange
Now the tube diameter of one tube = 0.1m
Length of one tube = 4.8 m
Tubes are arrange in square pitch
The number of square pitch = 475/4
Page 59
49
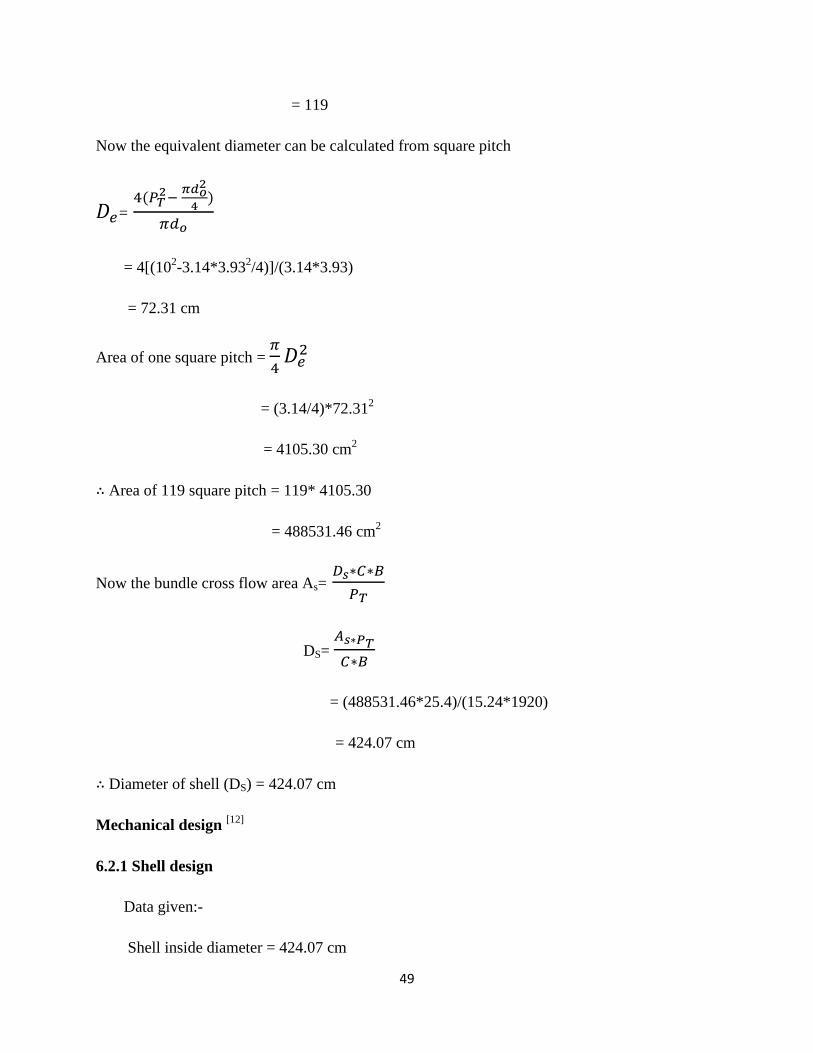
= 119
Now the equivalent diameter can be calculated from square pitch
=
= 4[(102-3.14*3.93
2/4)]/(3.14*3.93)
= 72.31 cm
Area of one square pitch =
= (3.14/4)*72.312
= 4105.30 cm2
Area of 119 square pitch = 119* 4105.30
= 488531.46 cm2
Now the bundle cross flow area As=
DS=
= (488531.46*25.4)/(15.24*1920)
= 424.07 cm
Diameter of shell (DS) = 424.07 cm
Mechanical design [12]
6.2.1 Shell design
Data given:-
Shell inside diameter = 424.07 cm
Page 60
50
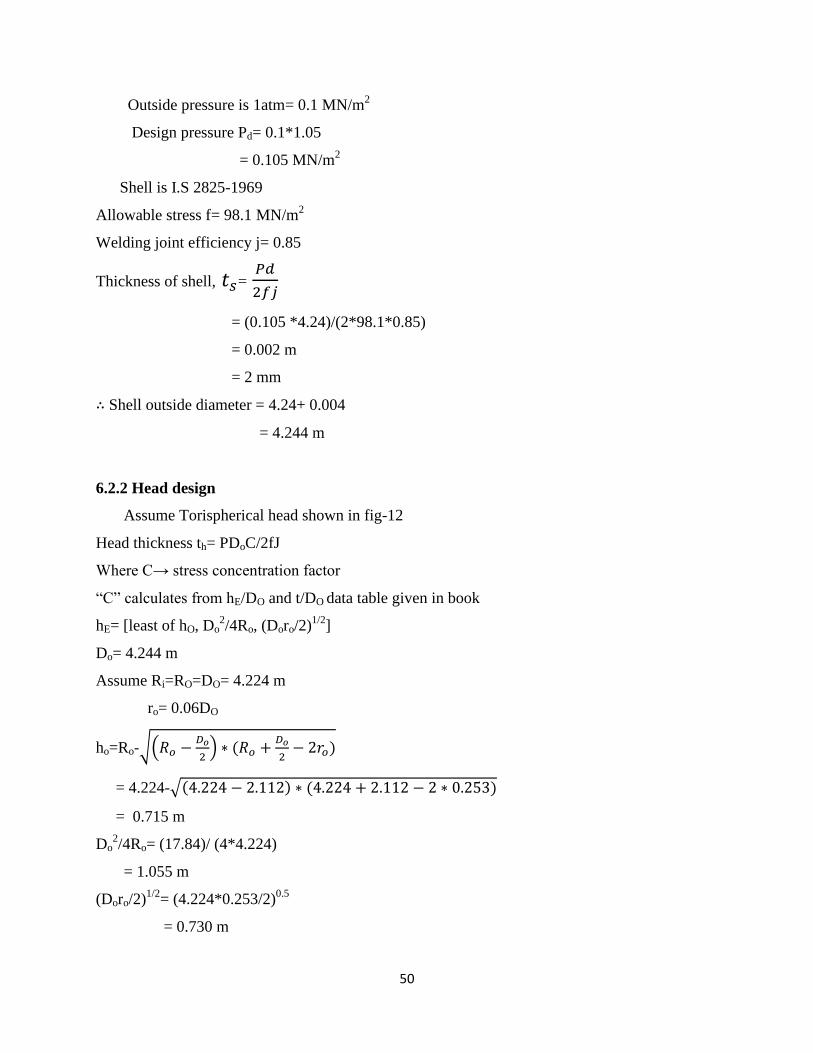
Outside pressure is 1atm= 0.1 MN/m2
Design pressure Pd= 0.1*1.05
= 0.105 MN/m2
Shell is I.S 2825-1969
Allowable stress f= 98.1 MN/m2
Welding joint efficiency j= 0.85
Thickness of shell, =
= (0.105 *4.24)/(2*98.1*0.85)
= 0.002 m
= 2 mm
Shell outside diameter = 4.24+ 0.004
= 4.244 m
6.2.2 Head design
Assume Torispherical head shown in fig-12
Head thickness th= PDoC/2fJ
Where C→ stress concentration factor
“C” calculates from hE/DO and t/DO data table given in book
hE= [least of hO, Do2/4Ro, (Doro/2)
1/2]
Do= 4.244 m
Assume Ri=RO=DO= 4.224 m
ro= 0.06DO
ho=Ro-√(
)
= 4.224-√
= 0.715 m
Do2/4Ro= (17.84)/ (4*4.224)
= 1.055 m
(Doro/2)1/2
= (4.224*0.253/2)0.5
= 0.730 m
Page 61
51
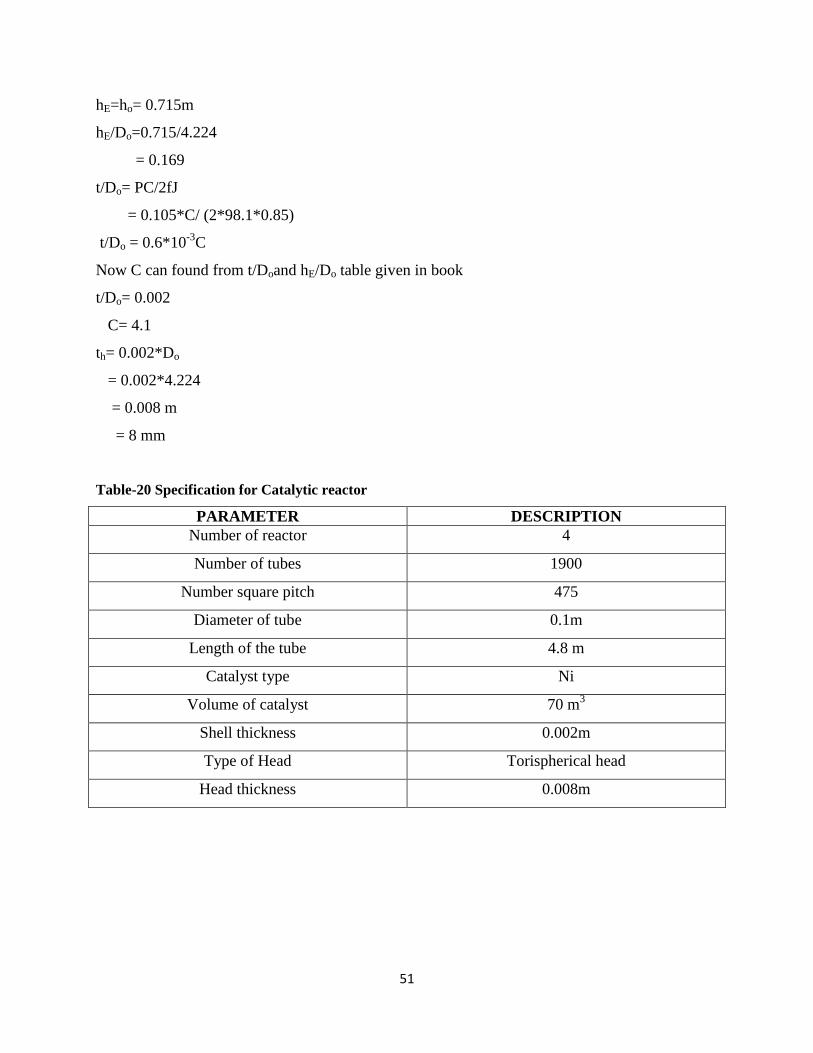
hE=ho= 0.715m
hE/Do=0.715/4.224
= 0.169
t/Do= PC/2fJ
= 0.105*C/ (2*98.1*0.85)
t/Do = 0.6*10-3
C
Now C can found from t/Doand hE/Do table given in book
t/Do= 0.002
C= 4.1
th= 0.002*Do
= 0.002*4.224
= 0.008 m
= 8 mm
Table-20 Specification for Catalytic reactor
PARAMETER DESCRIPTION
Number of reactor 4
Number of tubes 1900
Number square pitch 475
Diameter of tube 0.1m
Length of the tube 4.8 m
Catalyst type Ni
Volume of catalyst 70 m3
Shell thickness 0.002m
Type of Head Torispherical head
Head thickness 0.008m
Page 62
52
Chapter 7
Piping design and Instrumentation diagrams
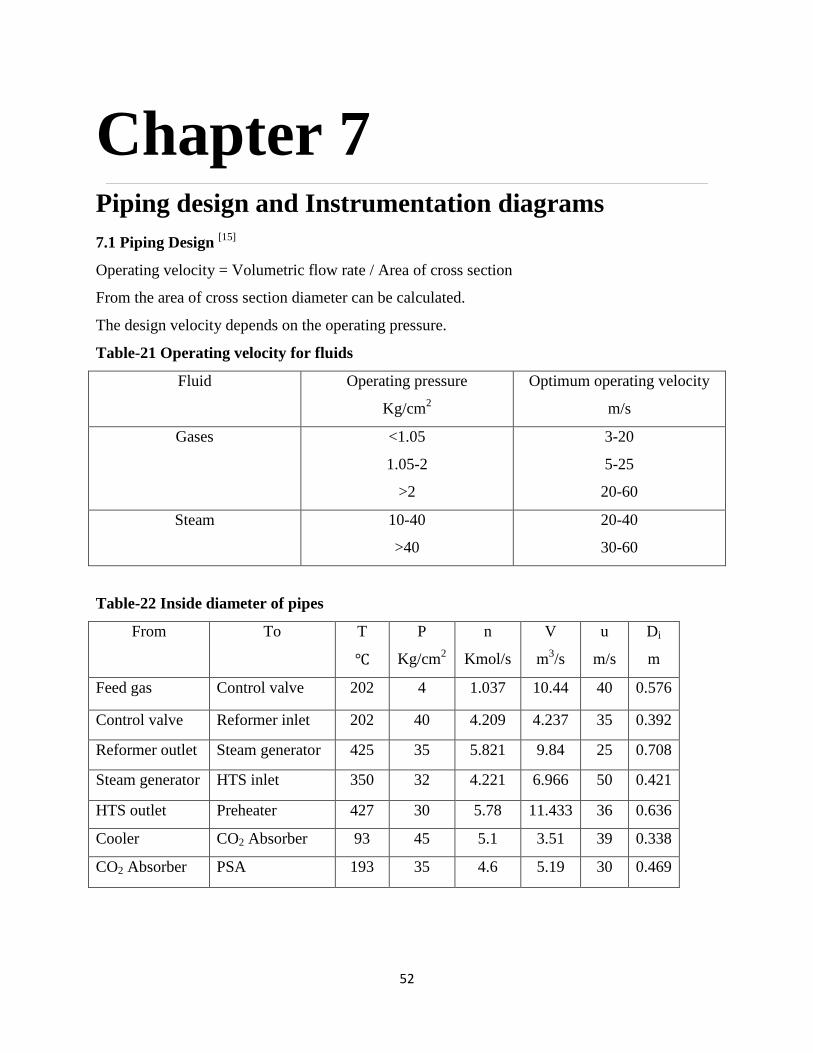
7.1 Piping Design [15]
Operating velocity = Volumetric flow rate / Area of cross section
From the area of cross section diameter can be calculated.
The design velocity depends on the operating pressure.
Table-21 Operating velocity for fluids
Fluid Operating pressure
Kg/cm2
Optimum operating velocity
m/s
Gases <1.05
1.05-2
>2
3-20
5-25
20-60
Steam 10-40
>40
20-40
30-60
Table-22 Inside diameter of pipes
From To T
P
Kg/cm2
n
Kmol/s
V
m3/s
u
m/s
Di
m
Feed gas Control valve 202 4 1.037 10.44 40 0.576
Control valve Reformer inlet 202 40 4.209 4.237 35 0.392
Reformer outlet Steam generator 425 35 5.821 9.84 25 0.708
Steam generator HTS inlet 350 32 4.221 6.966 50 0.421
HTS outlet Preheater 427 30 5.78 11.433 36 0.636
Cooler CO2 Absorber 93 45 5.1 3.51 39 0.338
CO2 Absorber PSA 193 35 4.6 5.19 30 0.469
Page 63
53
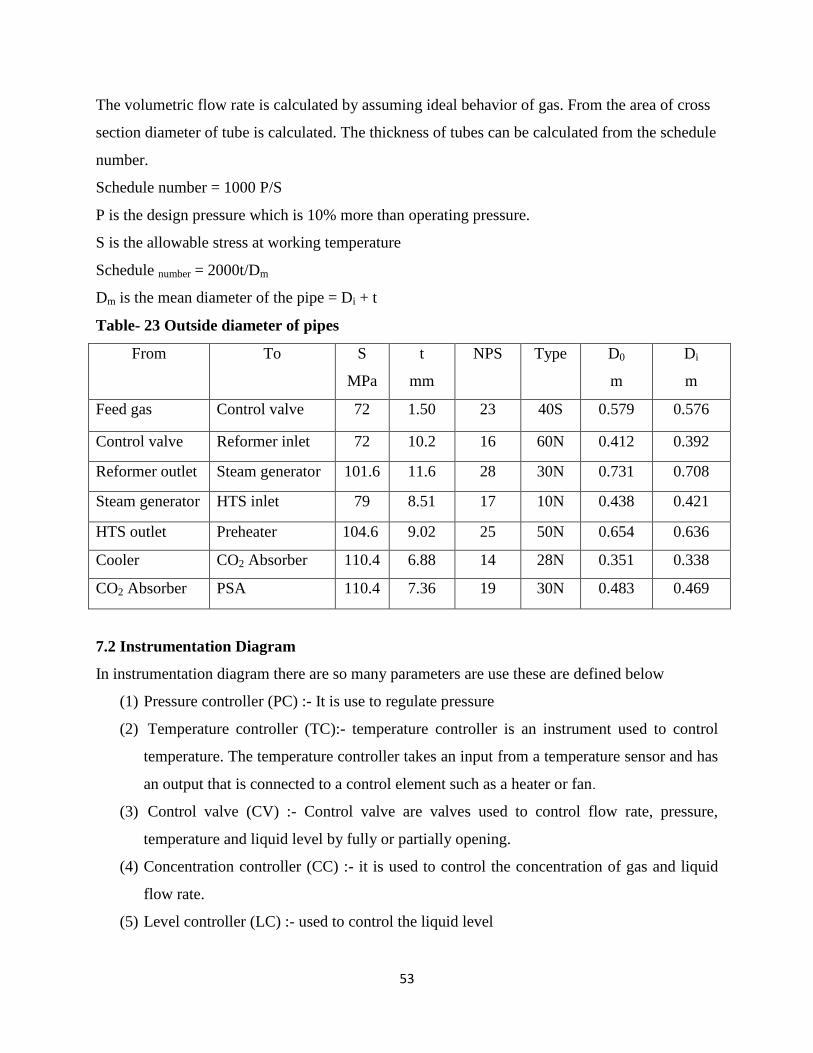
The volumetric flow rate is calculated by assuming ideal behavior of gas. From the area of cross
section diameter of tube is calculated. The thickness of tubes can be calculated from the schedule
number.
Schedule number = 1000 P/S
P is the design pressure which is 10% more than operating pressure.
S is the allowable stress at working temperature
Schedule number = 2000t/Dm
Dm is the mean diameter of the pipe = Di + t
Table- 23 Outside diameter of pipes
From To S
MPa
t
mm
NPS Type D0
m
Di
m
Feed gas Control valve 72 1.50 23 40S 0.579 0.576
Control valve Reformer inlet 72 10.2 16 60N 0.412 0.392
Reformer outlet Steam generator 101.6 11.6 28 30N 0.731 0.708
Steam generator HTS inlet 79 8.51 17 10N 0.438 0.421
HTS outlet Preheater 104.6 9.02 25 50N 0.654 0.636
Cooler CO2 Absorber 110.4 6.88 14 28N 0.351 0.338
CO2 Absorber PSA 110.4 7.36 19 30N 0.483 0.469
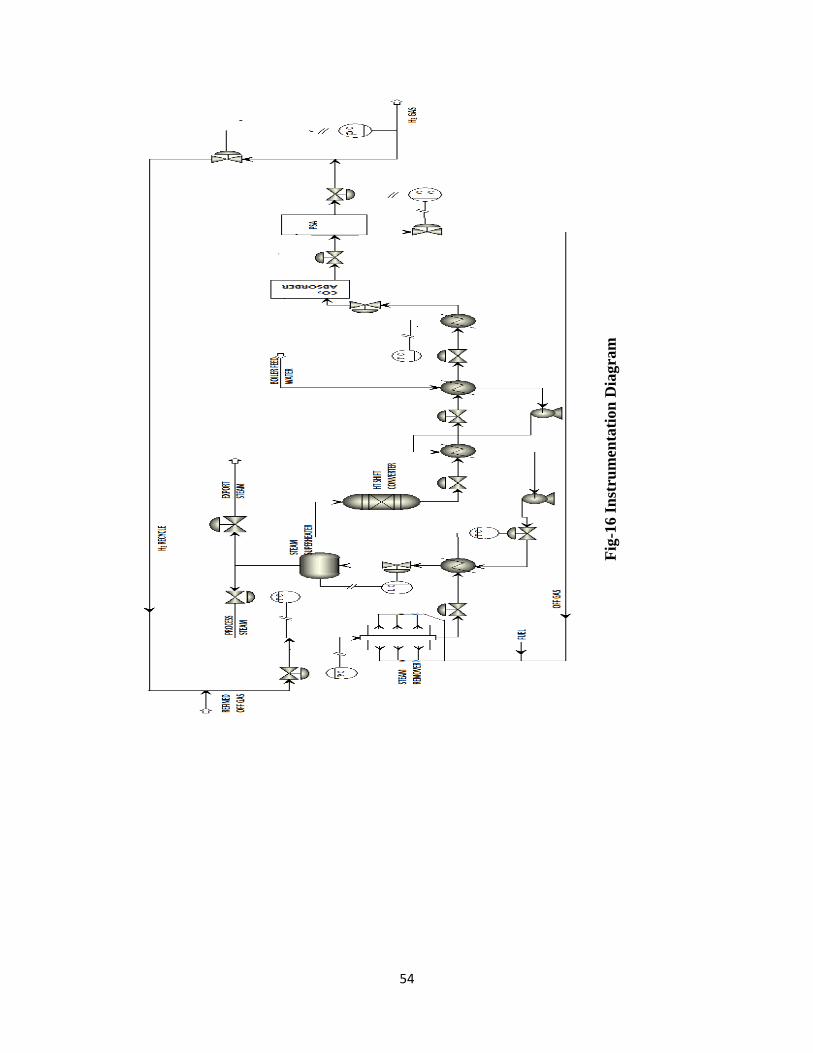
7.2 Instrumentation Diagram
In instrumentation diagram there are so many parameters are use these are defined below
(1) Pressure controller (PC) :- It is use to regulate pressure
(2) Temperature controller (TC):- temperature controller is an instrument used to control
temperature. The temperature controller takes an input from a temperature sensor and has
an output that is connected to a control element such as a heater or fan.
(3) Control valve (CV) :- Control valve are valves used to control flow rate, pressure,
temperature and liquid level by fully or partially opening.
(4) Concentration controller (CC) :- it is used to control the concentration of gas and liquid
flow rate.
(5) Level controller (LC) :- used to control the liquid level
Page 64
54
Fig
-16 I
nst
rum
enta
tion
Dia
gra
m
Page 65
55
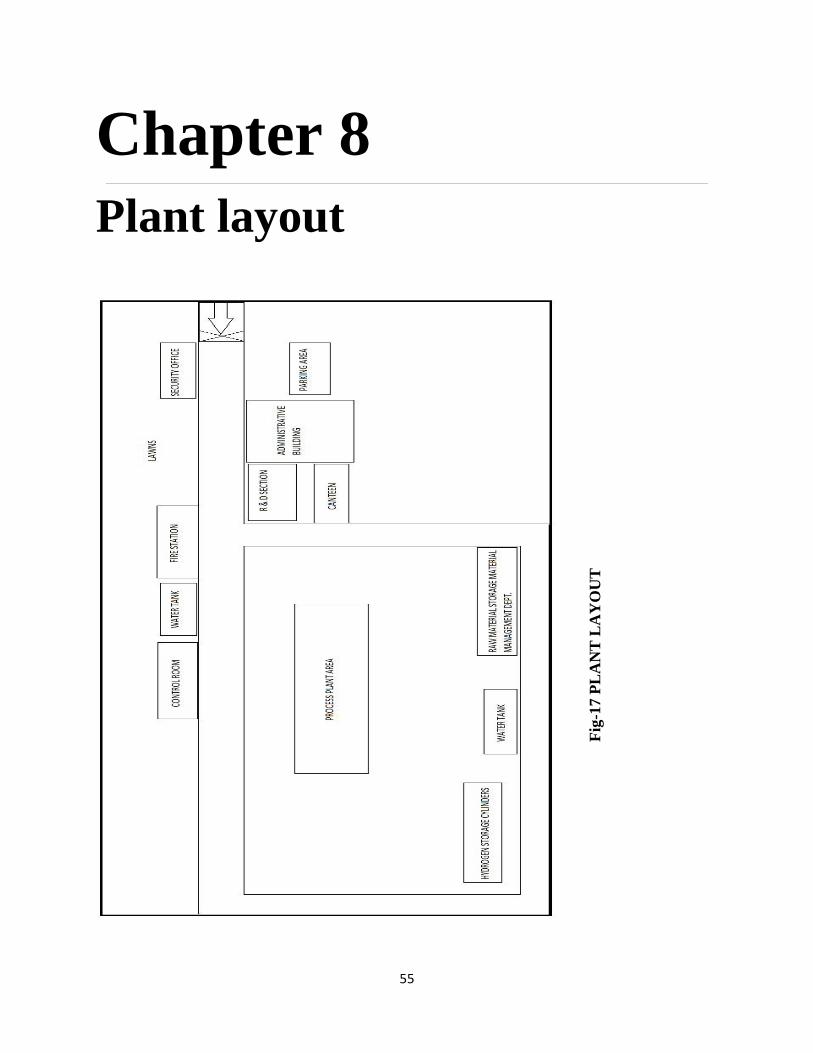
Chapter 8
Plant layout
Fig
-17 P
LA
NT
LA
YO
UT
Page 66
56
Chapter 9
Conclusion
A plant for producing 500 tons/day of H2 gas using refinery off gas is the scope of the present
work. In this regard complete material balance, energy balance, design of a few equipment’s
(CO2 Absorber and catalytic reactor),piping design and instrumentation diagram and plant layout
has been done, however due to lack of appropriate information and data cost estimation of the
process could not be done. Hydrogen being a very important gaseous product, finds its
application in the refinery itself as a fuel. Processing of off gas to produce hydrogen is a very
successful and profitable proposition. The process adapted is a highly developed and efficient are
compared to the entire process followed. Further work in this project can be carried out to
complete the design and economic analysis of this project.
Page 67
57
References
1 "Hydrogen". Van Nostrand's Encyclopedia of Chemistry. Wylie-Interscience.
2005. pp. 797–799. ISBN 0-471-61525-0.
2. Today’s Refinery, January 1995 issue.
3. 2001-Fuels usable for fuel reforming.
4. 2004-George W. Crabtree, Mildred S. Dresselhaus, and Michelle V. Buchanan,
The Hydrogen Economy.
5. www.wikipedia.org
6. The optimal design of pressure swing adsorption systems by Olive j smith,
Arthur w. westerterp j. chemical engineering science. Vol. 46 No. 12,pp. 2967-2976,1991.
7. L. Schlapbach, A. Zuttel: “Hydrogen-storage materials for mobile applications”, Nature,
414 (15 Nov. 2001), p. 353-357.
8. Oh, P. P.; Ray, A. K.; Rangaiah, G. P. Triple-Objective Optimization of an.
Industrial Hydrogen Plant. J. Chem. Eng. Jpn. 2001, 34 (11), 1341.
9. Hyman, M. H. Simulate Methane Reformer Reactions. Hydrocarbon Process. 1968, 47,131.
10. Chemical process principles- material and energy balance by O.A.Hougen,
K.M. Watson, R.A.Ragatz.
11. Mass transfer operation by Dr.B.K Dutta.
12. Equipment Design by B.C.Bhattacharya.
13. Chemical Reaction Engineering by Octave Levenspiel.
.14. Robert, H. Perry & Cecil, H. Chilton, “Chemical Engineers’ Handbook”, 5th
Edition,
McGraw-Hill Company-1973.
15. Handbook of piping design by G.K.Sahu, first edition, New age international
pub, 1997, p31-37.