RESEARCH PAPER Hydrogeological activity of lineaments in Yaounde´ Cameroon region using remote sensing and GIS techniques William Teikeu Assatse a , Philippe Njandjock Nouck a, * , Charles Tabod Tabod a,c , Joseph Martial Akame d , Georges Nshagali Biringanine a,b a Laboratory of Geophysic, University of Yaounde´ I, 812 Yaounde´, Cameroon b Department of Geology, Official University of Bukavu, 435 Cyangugu, Rwanda c Department of Physic, University of Bamenda, 39 Bambili, Cameroon d Laboratory of Petrology and Structural Geology, University of Yaounde´ I, 812 Yaounde´, Cameroon Received 17 February 2015; revised 22 December 2015; accepted 28 December 2015 Available online 21 January 2016 KEYWORDS Geostatistics; Lineaments; Remote sensing; Crystalline basement Abstract Though Yaounde´ zone is characterized by abundant rains, access to safe drinking water becomes a difficult activity, because of climate change and pollution caused by human activities. Lineament zones on the earth’s surface are important elements in understanding the dynamics of the subsurface fluid flow. However, good exposures of these features are always lacking in some areas around Yaounde´, characterized by thick alteration. During field surveys these conditions, in many cases, hinder the proper characterization of such features. Therefore, an approach that identifies the regional lineaments on remote-sensing images (Landsat Thematic Mapper and shaded digital terrain models), with its large scale synoptic coverage, could be promising. This paper aims to the structural organization of lineament network in the crystalline basement of Yaounde´ from remote sensing data and characterize them by statistical and geostatistical techniques. The results were validated on the basis of the geological maps, the hydrogeological maps and the outcrop data. Statistical analysis of the lineaments network shows a distribution along the N0–10, N20–30, N40–60 and N140–150. The correlation between the productivity of high yield wells and the closest lineament confirms that these lineaments are surface traces of regional discontinuities and act as main groundwater flow paths. Ó 2016 National Authority for Remote Sensing and Space Sciences. Production and hosting by Elsevier B.V. This is an open access article under the CC BY-NC-ND license (http://creativecommons.org/licenses/by-nc- nd/4.0/). 1. Introduction In the Yaounde´ crystalline basement area, despite strong rain- fall, the groundwater wells for feeding populations are charac- terized by very low water flow rates which are sometimes * Corresponding author. E-mail address: [email protected](P. Njandjock Nouck). Peer review under responsibility of National Authority for Remote Sensing and Space Sciences. The Egyptian Journal of Remote Sensing and Space Sciences (2016) 19, 49–60 HOSTED BY National Authority for Remote Sensing and Space Sciences The Egyptian Journal of Remote Sensing and Space Sciences www.elsevier.com/locate/ejrs www.sciencedirect.com http://dx.doi.org/10.1016/j.ejrs.2015.12.006 1110-9823 Ó 2016 National Authority for Remote Sensing and Space Sciences. Production and hosting by Elsevier B.V. This is an open access article under the CC BY-NC-ND license (http://creativecommons.org/licenses/by-nc-nd/4.0/).
Transcript
The Egyptian Journal of Remote Sensing and Space Sciences (2016) 19, 49–60
HO ST E D BYNational Authority for Remote Sensing and Space Sciences
Peer review under responsibility of National Authority for Remote
Sensing and Space Sciences.
http://dx.doi.org/10.1016/j.ejrs.2015.12.0061110-9823 � 2016 National Authority for Remote Sensing and Space Sciences. Production and hosting by Elsevier B.V.This is an open access article under the CC BY-NC-ND license (http://creativecommons.org/licenses/by-nc-nd/4.0/).
William Teikeu Assatsea, Philippe Njandjock Nouck
a,*, Charles Tabod Taboda,c,
Joseph Martial Akame d, Georges Nshagali Biringanine a,b
aLaboratory of Geophysic, University of Yaounde I, 812 Yaounde, CameroonbDepartment of Geology, Official University of Bukavu, 435 Cyangugu, RwandacDepartment of Physic, University of Bamenda, 39 Bambili, CameroondLaboratory of Petrology and Structural Geology, University of Yaounde I, 812 Yaounde, Cameroon
Received 17 February 2015; revised 22 December 2015; accepted 28 December 2015Available online 21 January 2016
KEYWORDS
Geostatistics;
Lineaments;
Remote sensing;
Crystalline basement
Abstract Though Yaounde zone is characterized by abundant rains, access to safe drinking water
becomes a difficult activity, because of climate change and pollution caused by human activities.
Lineament zones on the earth’s surface are important elements in understanding the dynamics of
the subsurface fluid flow. However, good exposures of these features are always lacking in some
areas around Yaounde, characterized by thick alteration. During field surveys these conditions,
in many cases, hinder the proper characterization of such features. Therefore, an approach that
identifies the regional lineaments on remote-sensing images (Landsat Thematic Mapper and shaded
digital terrain models), with its large scale synoptic coverage, could be promising. This paper aims
to the structural organization of lineament network in the crystalline basement of Yaounde from
remote sensing data and characterize them by statistical and geostatistical techniques. The results
were validated on the basis of the geological maps, the hydrogeological maps and the outcrop data.
Statistical analysis of the lineaments network shows a distribution along the N0–10, N20–30,
N40–60 and N140–150. The correlation between the productivity of high yield wells and the closest
lineament confirms that these lineaments are surface traces of regional discontinuities and act as
main groundwater flow paths.� 2016NationalAuthority forRemote Sensing and Space Sciences. Production and hosting byElsevier B.V.
This is an open access article under the CC BY-NC-ND license (http://creativecommons.org/licenses/by-nc-
nd/4.0/).
1. Introduction
In the Yaounde crystalline basement area, despite strong rain-fall, the groundwater wells for feeding populations are charac-terized by very low water flow rates which are sometimes
unsuccessful (Teikeu et al., 2012a,b). The remote sensingtechniques have opened a new area in the field of applied geol-ogy (Farina et al., 2005). Due to its efficiency in detecting geo-
logical structures (e.g., lineaments), the technique of digitalimage processing proved that, remote sensing is a useful toolfor mapping minerals. Other techniques were also applied to
emphasize the role of remote sensing in detecting lineaments(Corgne et al., 2010). The availability of multi-spectral andhigh-resolution data as well as the advanced capabilities of dig-
ital image processing techniques in generating enhanced andinterpretable images further enlarged the potential of remotesensing in delineating the geological structures in detail andwith better accuracy (Akame et al., 2014; Masoud and
Koike, 2006). Many geological studies have employed ShuttleRadar Topography Mission (SRTM) and Landsat ThematicMapper (LTM) to discriminate the various lithology, linea-
ments and minerals using hyperspectral laboratory (Akameet al., 2013; Tarek, 2013; Koike et al., 1998). Subsequent stud-ies confirmed their benefit for lineament mapping using the
remote sensing data and GIS techniques (Singh et al., 2013;Rashid et al., 2012). The objective of this work is to character-ize and analyze the spatial organization of lineaments from
SRTM and LTM data using statistical and geostatistical tech-niques, to determine their role in groundwater flow in bedrockaquifers in the Yaounde region.
2. Description of the study area
The study area is located in the Center of Cameroon, betweenlatitudes 3� and 5� N and longitudes 11� and 13� E (Fig. 1). It
is a slightly undulating vast forest region with thick lateriticsoil developed on a Neoproterozoic basement (Ngon-Ngonet al., 2009; Tanawa et al., 2002). It has an arborescent hydro-
graphic network, with the Mefou and Mfoundi being main riv-
Figure 1 Location ma
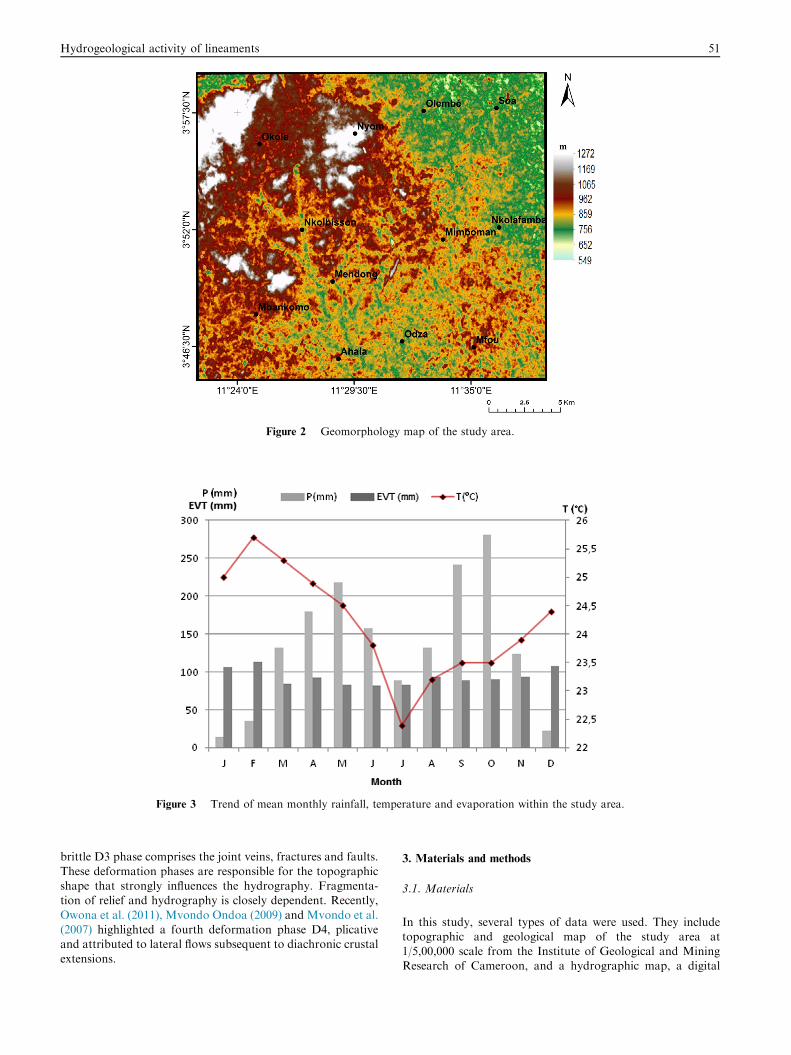
ers (Fig. 1). This hydrographic network has developed flatvalleys with different widths ranging from 50 to 150 m(Ngon-Ngon et al., 2009). The geomorphology data are
derived from the DEM. Geomorphology is influenced bylithology and structure of the underlying formations and playsa pivotal role in the occurrence and distribution of groundwa-
ter (Fashae et al., 2014). Geomorphological mapping (Fig. 2)involved the identification and characterization of variouslandforms comprising mountainous massifs (>800 m), the
Yaounde plateau (�750 m) and low swampy valleys(<700 m).
The climate is particularly hot and humid with two rainyseasons (mid-March–mid-June and mid-August–mid-
November) and two dry seasons (mid-November–mid-Marchand mid-June–mid-August).
The annual average rainfall calculated for the 1984–2012 per-
iod is 1626 mm/year and Average evaporation (EVT) of948 mm/year (Fig. 3). Average annual temperature rate is 24 �C.
Geologically, the Neoproterozoic basement (Fig. 4) is com-
posed of gneisses and migmatites (Mvondo et al., 2003;Ngnotue et al., 2000; Nzenti, 1998). Meta sedimentary rocksare the most abundant outcrop along the beds of some rivers.
The structural features in migmatites and basement gneisseswere described by Mvondo et al. (2003) and Nzenti et al.(1988). They suggest that, the study area has undergone threephases of ductile deformation, mainly corresponding to E–W
to NW–SE compressions (D1 and D3) alternating with aN–S to NE–SW extensive phase (D2). The initial phase D1is associated with prograde metamorphism culminating at high
pressure granulite conditions. On the other hand, the D2 phaserepresents the decompression phase. It is probably associatedto intense magmatic activity, the large-scale foliation and for-
mation of gneiss domes transposing D1 phase to form flatregional structures. A third non-penetrative and essentially
p of the study area.
Figure 2 Geomorphology map of the study area.
Figure 3 Trend of mean monthly rainfall, temperature and evaporation within the study area.
Hydrogeological activity of lineaments 51
brittle D3 phase comprises the joint veins, fractures and faults.
These deformation phases are responsible for the topographicshape that strongly influences the hydrography. Fragmenta-tion of relief and hydrography is closely dependent. Recently,
Owona et al. (2011), Mvondo Ondoa (2009) and Mvondo et al.(2007) highlighted a fourth deformation phase D4, plicativeand attributed to lateral flows subsequent to diachronic crustal
extensions.
3. Materials and methods
3.1. Materials
In this study, several types of data were used. They includetopographic and geological map of the study area at1/5,00,000 scale from the Institute of Geological and MiningResearch of Cameroon, and a hydrographic map, a digital
Figure 4 Geological map of study area (Champetier De Ribes and Aubargue, 1956).
52 W. Teikeu Assatse et al.
elevation model (DEM) extracted from Shuttle RadarTopography Mission (SRTM) and Landsat Thematic Mapper
(LTM) image (Scene 185-57) acquired on 02/02/1988 corre-sponding to the long dry season. These data were providedby the National Institute of Cartography of Cameroon. The
DEM is a digital representation of the earth surface terrainthat could be beneficially integrated in the structural geologyfor the identification of lineaments and fracture systems thatmay represent the surface expression of geological structures
(Abou El-Magd et al., 2010; Michaela et al., 2006). In thistopic, the results of DEM interpretation were combined byother remote sensing data such as optical multi-spectral data
(Landsat TM). The geological outcropping of the study areahas been analyzed in some sites to confirm the result of linea-ment analysis obtained from remote sensing data.
The digital image processing, thematic mapping, extractionlengths and directions of lineament were obtained using theErdas imagine 2011 and ArcGIS 10.1 software, respectively.
Statistical and geostatistical analysis of network lineamentswere performed by XLSTAT software and geostatistics pro-gram (Autogrig) developed by the Geophysical Laboratoryof the University of Yaounde I in a Matlab platform,
respectively.
3.2. Methodology
The Landsat image and DEM of the study area and its sur-rounding were geometrically registered using GIS softwarewith scanned topographic map of the study area (with a scale
of 1:5,00,000) and geodetically transformed into the UniversalTransverse Mercator (UTM) zones 32.
For the first image, two image-processing steps were pro-
posed to increase the sharpness of the Landsat image, clarifythe features and obtain more reliable information. The firststep concerned the image sharpening and was applied to theLandsat image for lineament analysis and lithological mapping
(Fig. 5a). The Principal Components Analysis (PCA) has beenperformed on bands 1, 2, 3, 4, 5, 6 and 7 of the TM image.
PCA is used in order to reduce spectral redundancy in theLandsat TM data and to represent entire spectral informationin a single RGB color combination image (PC1–PC2–PC3). To
improve the contrast of images, some information has beenenhanced with the application of color composition on TMbands 4, 5 and 7. The second step concerned application ofdirectional 7 � 7 Sobel filters in the NS, EW, NE–SW and
NW–SE direction; and the Yesou et al. (1993) gradient tochannels TM7-5-4, TM5/TM4 and PC1 help to enhance imagediscontinuities corresponding to structural lineaments. This
image had a spatial resolution of 30 m which enables the delin-eation of the geological lineaments in the study area.
The second image used for the interpretation is the SRTM
DEM having spatial resolution of 90 m. DEM data extractedfrom SRTM data were used to recognize and extract geologi-cal lineaments by calculating and interpreting DEM deriva-
tives, including shaded relief maps. The shaded relief mapwas calculated from a gray scale using an azimuth directionand input sun angles of 0, 45, 90, 135, 180, 225, 270 and 315(Fig. 5b).
The processing and filtering have accentuated and facili-tated the detection of lineament in the images, thus allowingtheir extraction by a simple visual observation.
Lineaments that show little relationship to topographic fea-tures and a Strong relationship to anthropogenic features areconsidered to be formed by anthropogenic factors. To identify
lineaments within the lineament map which were caused byinfrastructure, digitized road and the topographic maps weresuperimposed over the final lineament maps using ArcGIS 10.1.
3.3. Statistical and geostatistical analysis methods
The statistical approach of the geometric parameters (direc-tions and lengths) of lineaments is required to describe the
Figure 5a Lineament map from Landsat TM.
Figure 5b Lineament map from SRTM data.
Hydrogeological activity of lineaments 53
structure of a region. The processing of the orientation of lin-eaments, done on homogeneous geographical area if needed,
simply produces a directional diagram which shows the distri-bution of fractures by classes of 10�. The length parameter isanalyzed using a frequency histogram which is adjusted by
many statistical models (exponential, gamma, log-normal,and power). The lineament, spatial phenomenon may be sub-jected to geostatistical analysis. The geostatistical analysis is
based on the regionalized variables theory (Goovaerts, 2000),which enables one to quantify the spatial variability of the phe-nomenon based on the values observed at different measure-ment sites and depending on the distance between them
(Njandjock et al., 2013). Experimentally, its mathematical toolis the variogram c (h) given by Eq. (1)
cðhÞ ¼ 1
2N
XNðhÞ
i¼1
½ZðxiÞ � Zðxi þ hÞ�2 ð1Þ
where Z(x) and Z(xi + h) are the values of the variable Z atthe position xi and xi + h, respectively, N(h) is the number of
pairs which are distant by h.Ideally, for a point of the experimental variogram to be
considered as representative, it is necessary that N(h) P 30.
To these point values, an acceptable theoretical model of var-iogram is adjusted. The main accepted models are linear,spherical, exponential, cubic, Gaussian and logarithmic. The
description of these models depends on a number of quantiza-tion parameters such as range, bearing and nugget effect.
The choice of the variogram model is guided by the degreeof fitness between the experimental and theoretical values
(Meli’i et al., 2013). This degree of fitness can be evaluatedby the root mean square error (RMS) given by Eq. (2):
RMS ¼ 1
N
XNi¼1
ððZ�ðxiÞ � ZðxiÞÞ2" #1=2
ð2Þ
54 W. Teikeu Assatse et al.
where Z*(xi) and Z(xi) are the theoretical and experimentalvalues for the measurement points xi, respectively.
4. Results and discussion
4.1. Mapping of structural lineaments network
The detailed map from the manual extraction of lineaments(Fig. 6) was carried out through the application of the different
processing techniques.The validation of the detailed map of lineaments is a very
important step that determines the use of the map for future
hydrogeological surveys. It allows assigning the value of frac-ture to all the selected lineaments (Chaabouni et al., 2012).This important step was made from data obtained after linea-
ment operation of photo-geological, topographical, hydro-graphical and measures outcrop study area maps (Fig. 7).
4.2. Statistical analysis of the lineament network
The total length of lineaments mapped is 1883.8 km. Thelengths of lineaments mapped can be grouped into three mainclasses (Fig. 8). A main class (70.6%) which includes linea-
ments whose lengths are between 0.2 km and 1.9 km, followedby a smaller class of fracture (27.8%) have lengths between2.0 km and 4.9 km and finally, a minority class (1.5%) whose
lengths are beyond 4.9 km.The lineaments were adjusted with a non parametric statis-
tic test. The results of the adjustment tests at 1% significant
level by different laws are shown in Table 1.These laws (log-normal, gamma and exponential) do not
statistically permit the description of lineaments’ length,
Figure 6 Detailed map of l
notably at the level of small values. We then, tried to modelthis distribution by a power law. Fig. 9 shows a logarithmicdiagram of empirical distribution of the length with part of
0.22 km. On this graph, it is only the part of the curve foundbetween 1.13 km and 6.79 km that presents a comportmentwhich we access to be linear. We therefore adjusted on this
part the power law expression according to Eq. (3).
nðLÞ ¼ 140:4L�2:235 ð3ÞThe residual coefficient R2 is low (0.92) and the adjustment
tests are not conclusive. Below 1.02 km, this power law is notrespected: the slope put into evidence the resolution limitswhich exclude 27% of cumulated lineaments’ length compared
to the total. Characteristic exposure of the power law is equalto 2.24 and far away from value 3. This value is compatiblewith the literature data generally comprising between 1 and
3, which can vary from one fracture network to another as tes-tified by Lasm and Razack (2001), Bodin and Razack (1999).The a exhibition thus fits the proportion of large or great frac-
tures than the small ones. The variations of a define in partic-ular the different developmental stages or the maturity offracture networks (Lasm et al., 2008; Chiles and de Marsily,
1993; Chiles et al., 1992). This power law points out that, thefracture networks of the Yaounde region would have attendedan advanced developmental stage.
4.3. Geostatistical analysis of the lineaments
The adjustment of experimental variograms to theoreticalmodels is an important step in the identification and interpre-
tation of the regionalization parameters (Moukana and Koike,2008). For each variogram model, we note the existence of the
ineaments of study area.
Figure 7 Combination of remote sensing lineament and hydrogeological map of study area.
Figure 8 Lineaments’ length histogram.
Hydrogeological activity of lineaments 55
Table 1 Adjustment tests v2 and K–S (Kolmogorov–Smirnov) of the lineaments’ length.
Law of distribution and its parameters Calculated v2 Degree of freedom Theoretical v2 (1%) Test of K–S p < 0.01
following parameters: the range ‘‘a” mean separation distanceof two points beyond which the property values become statis-
tically independent, the sill (C + CO) value at which the vari-ogram stabilizes. Among models, only the spherical variogrammodel has been deemed admissible because its RMS values
(Table 2) are lowest.Its general expression is given by the Eq. (4):
cðhÞ ¼ Co þ C 32
ha
� �� 12
ha
� �3h iCo þ C
(h < a
h P að4Þ
The cumulative length variogram of lineaments in the maindirections N–S, E–W, NW–SE and NE–SW are adjusted to the
spherical model (Fig. 10a–d) and summarized in Table 3.The structural distance of lineament’s families along these
directions are: aN–S ¼ 5 km, aE–W ¼ 11 km and
aNW–SE ¼ 9 km and aNE–SW ¼ 4 km, respectively.The modeling relations of these variograms are represented
by the Eqs. (5)–(8):
cN–SðhÞ ¼1:2þ 6:4 3
2h5
� �� 12
h5
� �3h i1:2þ 6:4
(h < 5 km
h P 5 kmð5Þ
cE–WðhÞ ¼0:4þ 1:3 3
2h11
� �� 12
h11
� �3h i0:4þ 1:3
(h < 11 km
h P 5 kmð6Þ
Table 2 RMS misfit to theoretical model.
Family of lineament N–S E–W
Variogram model sph exp sph exp
Root mean square (RMS) 2.4 4.1 2.2 3.0
Where sph and exp are the spherical and exponential variogram model,
cNW–SEðhÞ ¼3:1þ 2:3 3
2h9
� �� 12
h9
� �3h i3:1þ 2:3
(h < 9 km
h P 9 kmð7Þ
cNE–SWðhÞ ¼6:0þ 1:3 3
2h4
� �� 12
h4
� �3h i6:0þ 1:3
(h < 4 km
h P 4 kmð8Þ
These range values are different from a statistical point of
view, indicating that lineaments behave differently along thedifferent spatial directions (Lasm et al., 2008). Beyond this dis-tance, there is no correlation between the different points.
The variogram of global lineaments shows a particular
behavior characterized by four sill levels. This may be an indi-cation of several interlocking structures at different scales(Lasm et al., 2008). The global lineament in the total length
is therefore characterized by a quadruple regionalization.Regionalization parameters are adjusted to spherical models(Fig. 11). The equations of the four elementary variograms
are given by the expressions (9)–(12):
c1ðhÞ ¼0:3þ 2:8 3
2h1:6
� �� 12
h1:6
� �3h i0:3þ 2:8
(h < 1:6 km
h P 1:6 kmð9Þ
c2ðhÞ ¼4:5 3
2h3:5
� �� 12ð h3:5Þ3
h i4:5
(h < 3:5 km
h P 3:5 kmð10Þ
c3ðhÞ ¼5:6 3
2h5:8
� �� 12
h5:8
� �3h i5:6
(h < 5:8 km
h P 5:8 kmð11Þ
c4ðhÞ ¼6:8 3
2h9:6
� �� 12
h9:6
� �3h i6:8
(h < 9:6 km
h P 9:6 kmð12Þ
The modeled global variogram of lineaments (Eq. (13)) cor-responds to the sum of elementary variograms
cðhÞ ¼ c1ðhÞ þ c2ðhÞ þ c3ðhÞ þ c4ðhÞ ð13ÞThe nugget effect represents 9.67% of the lineaments total
dispersion in all directions; this value is 15.79%, 23.53%,57.40% and 0.82% for N–S, E–W, NW–SE and NE–SW group
of lineaments, respectively. In general, these variograms exhibita very low dispersion, except along the NE–SW direction. This
NW–SE NE–SW All azimuth
sph exp sph exp sph exp
2.4 3.3 2.6 4.1 1.7 2
respectively.
Figure 10 Variogram of the lineaments in direction: (a) N–S, (b) E–W, (c) NW–SE and (d) NE–SW.
Table 3 Regionalisation parameters of lineaments determined
from the spherical model.
Direction of lineament a (km) CO (km) C + CO (km)
N–S 5 1.2 7.6
E–W 11 0.4 1.7
NW–SE 9 3.1 5.4
NE–SW 4 6 7.3
All azimuth 9.6 0.3 7.1
Figure 11 All trends of lineament variogram.
Hydrogeological activity of lineaments 57
can come from various sources such as measurement errors andthe presence of a microstructure associated with a range lowerthan the distance between two close observations.
The global variogram of lineaments is multi structured with
four ranges, determined, respectively at distancesa1 ¼ 1:6 km;a2 ¼ 3:5 km; a3 ¼ 5:8 km and a4 ¼ 9:6 km. The maximumrange is 9.6 km.
The presence of different parameters in variograms suggeststhat, the lineaments are spatially structured and the groundwa-ter flow in the crystalline basement, do not occur randomly,but rather in spatially organized manner.
4.4. Confrontation of fracture networks with structural geology
Our work has produced a lineament map of the study area,
where we have only few known fractures. It counts hundredsof lineaments of which the reality is strongly probable andwhich was not known, neither was it even suspected so far.
Significant contribution of this map to structural geologistsand hydrogeologist adds a new document to verify some ofthese hypotheses.
The map of the network fractures reveals a high density ofdiscontinuities in all the study area. This density of lineamentsgives evidence of tectonic movements which have affected thecrystalline base in the course of geological times.
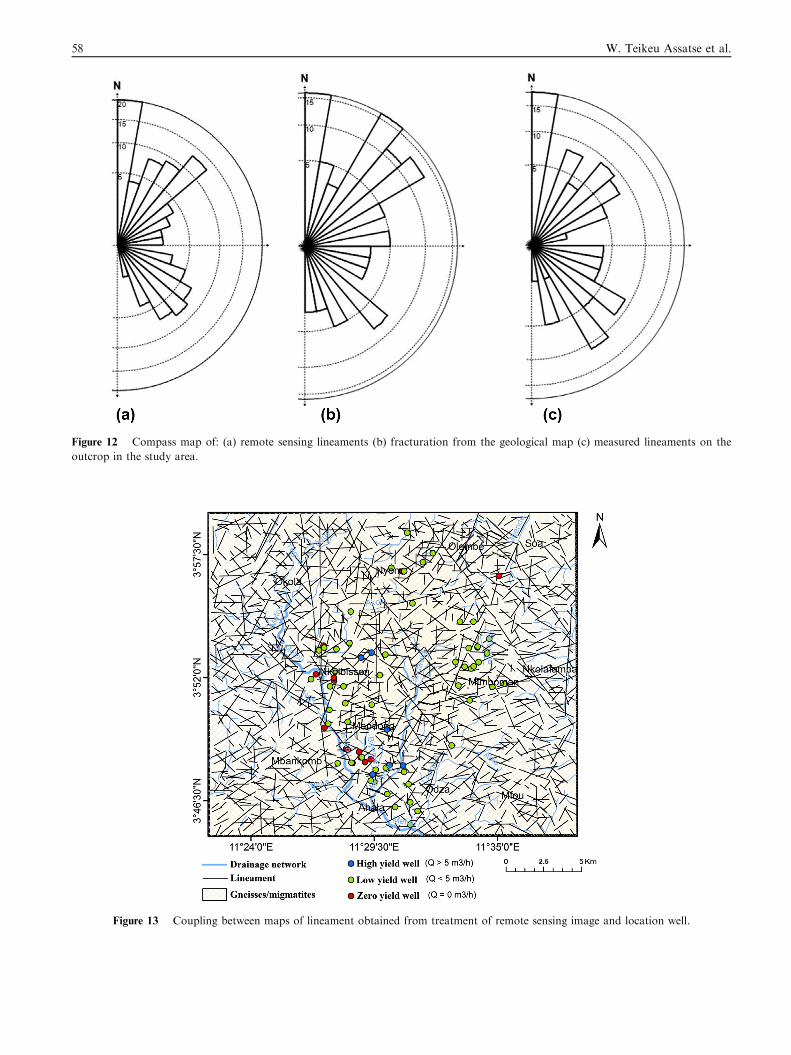
Network analysis of lineament of the study area obtainedafter analysis of various satellite images, geological maps andfield measurement allows highlighting of the orientation of lin-
eaments. The directional lineaments’ diagram extracted fromthe satellite image (Fig. 12a) shows that, a certain group of lin-eaments stand out from others; that is N0–10; N20–60 and
N110–150 which can be regarded as major because they exceed
Figure 12 Compass map of: (a) remote sensing lineaments (b) fracturation from the geological map (c) measured lineaments on the
outcrop in the study area.
Figure 13 Coupling between maps of lineament obtained from treatment of remote sensing image and location well.
58 W. Teikeu Assatse et al.
Hydrogeological activity of lineaments 59
5%. Other groups of lineaments, nearly homogeneous in gen-eral can be considered as minor, which are N10–20, N50–110and N150–180 groups.
Directional lineaments after the geological map (Fig. 12b)show that, the directions N0–10, N30–60 and N130–140 arethe most represented. However, classes N70–80; N120–130
and N140–150 are non-existent on the geological map.Directional lineaments measured on outcrop (Fig. 12c)
show that the directions N0–10; N20–30; N40–60; N120–130
and N140–150 are the most numerous. We also note the dis-parity between N10–20 and N80–90 classes.
The compass card obtained from the detailed map of linea-ments from the satellite image, the geological map and the
outcrop measurements indicate major lineament directions(N0–10, N20–30, N40–60 and N140–150). The balancebetween the main directions of lineaments identified on the
satellite image, the geological map and the outcrop observa-tions, confirms that the lineaments identified are most likelyassociated with fracturing. These main orientation NS,
NW–SE and NE–SW correspond to the fourth phase of regio-nal deformation compatible with the stress field D3 (MvondoOndoa, 2009; Mvondo et al., 2007). These fractures within the
post-orogenic relaxation of constraints are reactivated in theneo tectonic context. The deformation of rocks is subjectedto a constraint function of the lithology and particularly theorientation of principal stress with respect to the fracture.
The opening and closing of fractures are conditioned by theinterplay of tectonic movements (compression ordecompression).
4.5. Role of lineaments in underground circulations
Coupling of the lineament networks map and the map of spa-
tial repartition of wells is illustrated by Fig 13. This couplingshows a concordance between the two entities. In fact, the dif-ferent points representing the yield well are aligned to different
cartographic lineaments. This result shows that the mostimportant yield obtained in this region are linked to linea-ments. On the contrary, zero yields do not present particularorganization with respect to lineaments.
It should be noted that, in certain zones where high yieldwells have been identified, drilling without yield are present;this tends to demonstrate that productivity of wells is localized
and not associated to a stretched base zone, in which under-ground circulations and productivity are almost generalized(Koita et al., 2010).
In view of high yield exploitation observed at the level ofwells, we can retain that these lineaments are hydrologicallyactive. Important yields (Q > 5 m3/h) were registered at thelevel of certain lineaments (Fig. 13). These yields were regis-
tered onto the group of lineament NW–SE and NE–SW whichconstitute the groups of lineaments signify interest of thehydrogeological point of view. The fracture nodes and the high
fracture sizes are favorable zones for great yield. Research con-ducted on these fractures becomes a priority in the hydrogeo-logical prospection.
5. Conclusion
This study was conducted to characterize and to analyze the
spatial organization of lineaments from SRTM and LTM data
using statistical and geostatistical techniques in determiningtheir role in groundwater flow in bedrock aquifers areas. Theremote sensing provides a very useful tool for lineament anal-
ysis in areas like Yaounde (Cameroon) where the rock unitsare not well exposed. The use of different digital image pro-cessing algorithms together with controlled field studies
allowed extracting and characterizing most of the linear fea-tures and their tectonic implications in the study area.Although local variations in trends exist due to the scale of
observation, outcrop measurements of lineaments generallyreveal orientations similar to those obtained from remote sens-ing analysis. The geostatistical analysis shows that the linea-ment network is unambiguously a regionalized variable. The
space geometry of these networks does not occur randomlybut in a structured and organized manner. This structure ishowever not isotropic. Finally, the results of the present work
could be applicable in the different geologic and environmentalaspects based on a good understanding of the genetic and spa-tial relationships of lineaments systems. These aspects encom-
pass exploration for mineralization and groundwater
Conflict of interest
No conflict of interest.
Acknowledgments
The authors are thankful to the University of Yaounde I and
National Institute of Cartography of Cameroon for providingthe necessary facilities to carry out this work. The authors alsothank the reviewers for their comments that improved the
quality of this paper.
References
Abou El-Magd, I., Hermas, E., El-Bastawesy, M., 2010. GIS-
modeling of the spatial variability of flash flood hazard in Abu
Dabbab catchment, Red Sea Region, Egypt. Egypt. J. Remote
Sens. Space Sci. 13, 81–88.
Akame, J.M., Mvondo-ondoa, J., Olinga, J.B., Essono, J., Mbih, P.
K., 2013. Application of (MNT) SRTM numeric field models for
mapping structural lineaments: application to the Mezesse
Archean, East of Sangmelima (South Cameroon). Geo-Eco-Trop