HYDROGEOLOGY AND WATER QUALITY NEAR A SOLID- AND HAZARDOUS-WASTE LANDFILL, NORTHWOOD, OHIO By Jeffrey T. de Roche and Kevin J. Breen U.S. GEOLOGICAL SURVEY Water-Resources Investigations Report 88-4093 Reprinted 1989 Prepared in cooperation with the CITY OF NORTHWOOD, OHIO Columbus, Ohio 1989
Transcript
HYDROGEOLOGY AND WATER QUALITY NEAR A SOLID- AND HAZARDOUS-WASTE LANDFILL, NORTHWOOD, OHIO
By Jeffrey T. de Roche and Kevin J. Breen
U.S. GEOLOGICAL SURVEY Water-Resources Investigations Report 88-4093
Reprinted 1989
Prepared in cooperation with the CITY OF NORTHWOOD, OHIO
Columbus, Ohio 1989
DEPARTMENT OF THE INTERIOR
MANUEL LUJAN, JR., SecretaryU.S. GEOLOGICAL SURVEY
Dallas Peck, Director
For additional information Copies of this report canwrite to: be purchased from:
District Chief U.S. Geological SurveyU.S. Geological Survey Books and Open-File Reports975 W. Third Avenue Box 25425, Federal CenterColumbus, OH 43212-3192 Building 810
Denver, CO 80225
CONTENTS
Abstract 1 Introduction 2
Purpose and scope 2Location and setting 2Description of the landfill 4Previous investigations 5Methods of study 5Acknowledgments 9
Hydrogeology 9Unconsolidated deposits 9Bedrock 12Ground-water levels and flow 14
Water quality 25Ground water 25
Chemical reactions in grouted wells 31 Controls on native ground-water quality 34 Water quality and landfill leachate 40 Oxygen and hydrogen stable isotopes 44
Surface water 51 Summary and conclusions 56 References cited 58
ILLUSTRATIONS
Figure 1. Map showing location of study area 32. Map showing data-collection network and location of geologic section X-X13. Generalized geologic section X-X1 104. Map showing altitude and configuration of bedrock surface 135. Potentiometric surface in the dolomite aquifer, February 27-28, 1985 166. Maps showing ground-water-level changes in the study area:
(A) Rise of ground-water levels from December 1984 through February 1985 17
(B) Decline of ground-water levels from February 1985 through March 1985 18
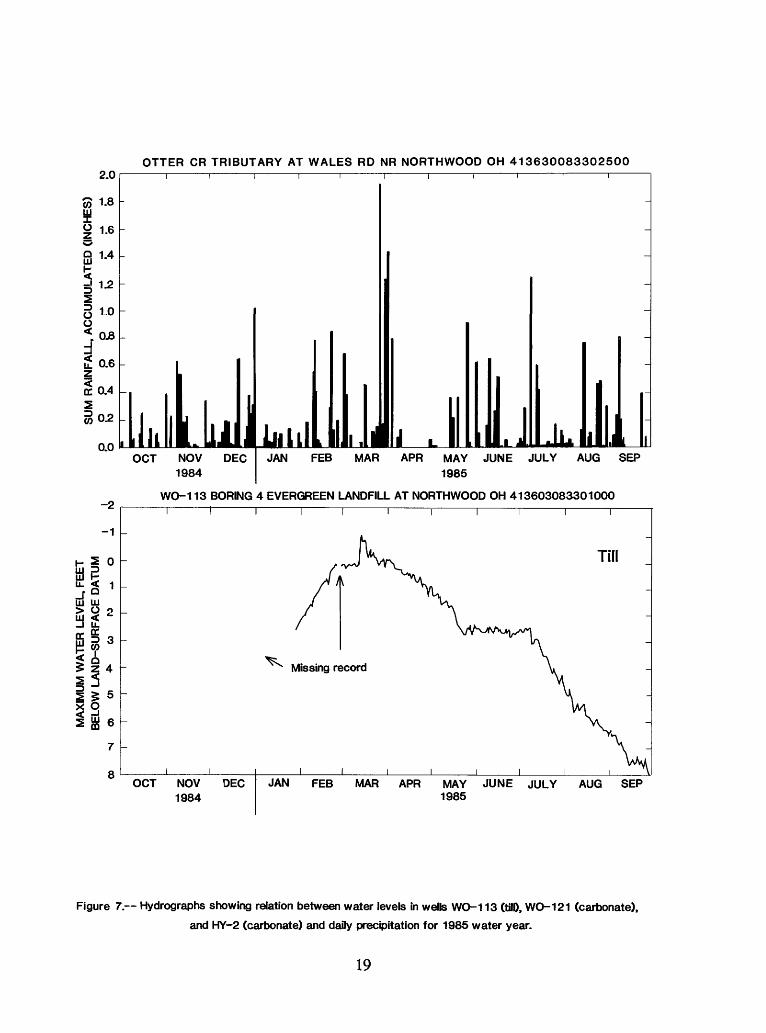
7. Hydrographs showing relation between water levels in wells WO-113 (till), WO-121 (carbonate), and HY-2 (carbonate), and daily precipitation for the 1985 water year 19
8. Graph showing effect of atmospheric-pressure fluctuation on water levels in well WO-121 22
in
ILLUSTRATIONS Continued
Figure 9. Hydrogeologic section X-X* showing head relations between the landfill, till, and dolomite aquifer 24
10. Map showing location of sites where water-quality samples were collected 2611. Trilinear diagram showing chemical character and cation/anion groupings
of ground water at Northwood, Ohio 3012. Map showing distribution of boron in ground water, surface water, and
leachate in the study area 4113. Map showing distribution of total dissolved solids in ground water and
leachate in the study area 4314. Map showing hydrogen and oxygen isotope composition of ground water,
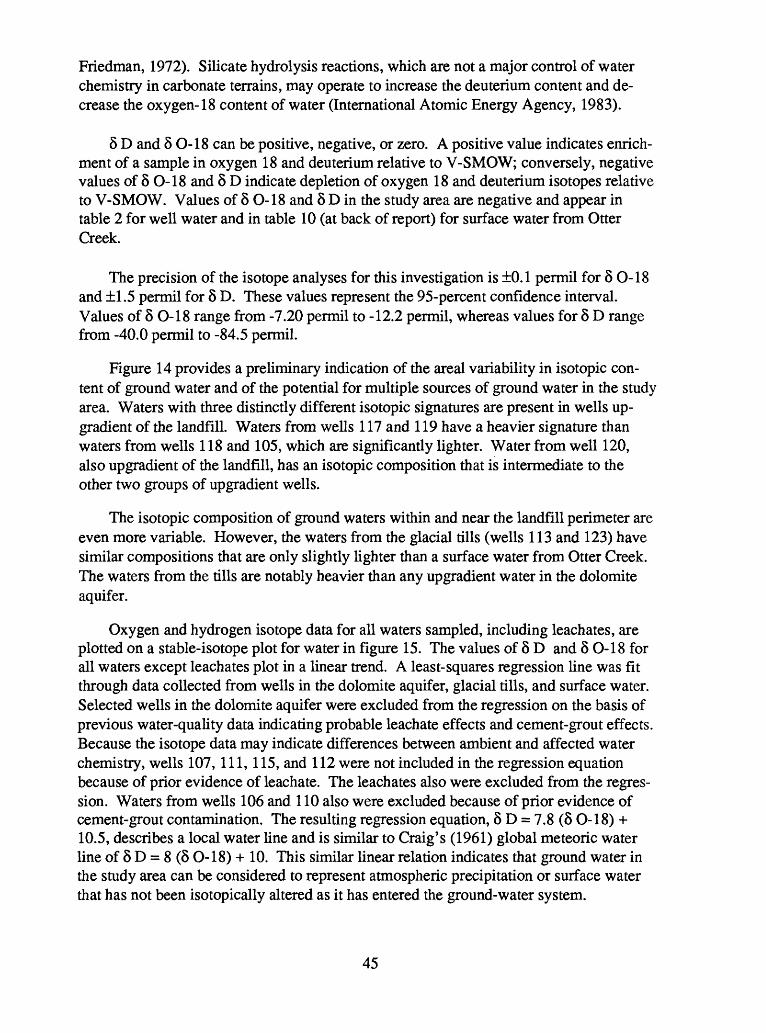
surface water, and leachate in the study area 4615. Graph showing local water line and oxygen and hydrogen isotope content of
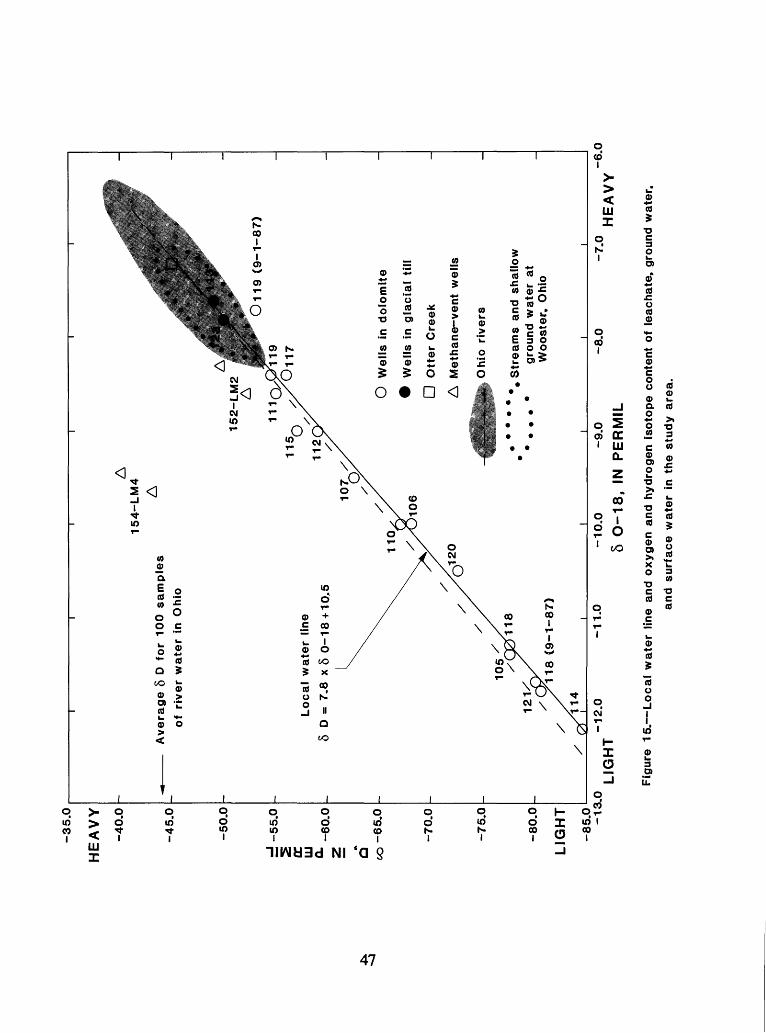
leachate, ground water, and surface water in the study area 4716. Graph showing the concept of end-member reservoirs and mixing line as
shown by the relation between oxygen and hydrogen isotope ratios 5017. Map showing surface-water sites at which stream water-quality and sediment
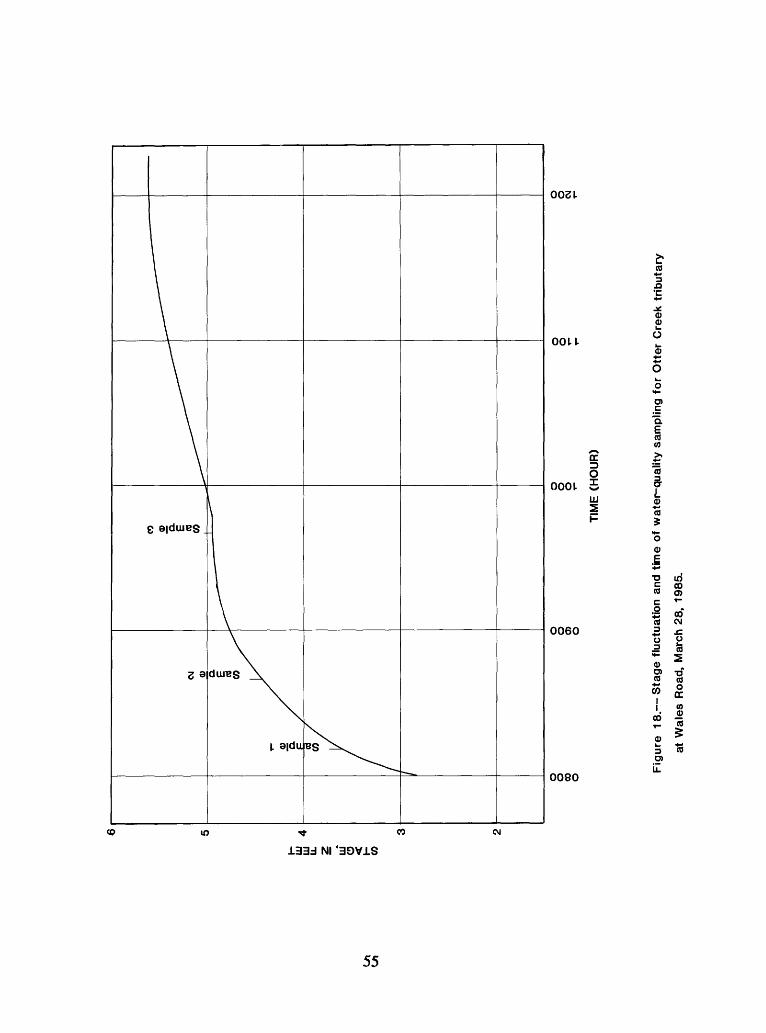
samples were collected 5218. Hydrograph showing stage fluctuation and time of water-quality sampling
for Otter Creek tributary at Wales Road, March 28,1985 55
TABLES
Table 1. Records of selected wells near Northwood, Ohio 72. Water-quality analyses of ground water near Northwood, Ohio 643. Statistical summary of ground-water-quality data for wells in the dolomite
aquifer 274. Organic compounds analyzed for in water from selected wells and stream
sites near Northwood, Ohio 285. Chemical changes and plausible reactions in a grouted well at Northwood,
Ohio 326. Chemical analyses of samples of Greenfield and Lockport Dolomites
reported in the literature for selected sites in northwestern Ohio 357. Logarithms of pCO2 and saturation indices for selected mineral phases
in well waters at Northwood, Ohio 368. Minerals and solubility control of selected constituent concentrations in well
waters at Northwood, Ohio 389. Calciumrmagnesium mole ratios in selected carbonate rocks in northwestern
Ohio and in ground waters at Northwood, Ohio 3910. Analyses of surface-water quality and sediments near Northwood, Ohio 70
IV
CONVERSION FACTORS AND ABBREVIATIONS
For the convenience of readers who may prefer to use metric (International System) units rather than the inch-pound units used in this report, values may be converted by using the following factors:
Multiply inch-pound unit By To obtain metric unit
inch (in.) 25.4 millimeter (mm)foot (ft) 0.3048 meter (m)foot of water (ft of water) 22.4 millimeter of mercury (mm
Hg)foot per day (ft/d) 0.3048 meter per day (m/d)foot per day (ft/d) 0.000353 centimeter per second (cm/s)mile (mi) 1.609 kilometer (km)foot per mile (ft/mi) 0.1894 meter per kilometer (m/km)foot squared per day (ft2/d) 0.0929 meter squared per day (m2/d)foot squared per day (ft2/d) 0.01075 centimeter squared per
second (cm2/s)square mile (mi2) 2.590 square kilometer (km2)cubic foot per second (ft3/s) 28.32 liter per second (L/s)gallon per minute per foot 40.74 liter per minute per meterper foot ([(gal/min)/ft]/ft) per meter ([(L/min)/m]/m)
Concentrations of chemical constituents and temperatures of air and waters are given in metric units. Concentration is given in milligrams per liter (mg/L) or micrograms per liter (|U,g/L). Milligrams per liter is a unit expressing the concentration of chemical con stituents in solution as weight (milligrams) of solute per unit volume (liter) of solution (water). One thousand micrograms per liter is equivalent to one milligram per liter. For concentrations of dissolved solids less than 7,000 mg/L, the numerical value is, for practical purposes, the same as for concentrations in parts per million.
Water and air temperature is given in degrees Celsius (°C), which can be converted to degrees Fahrenheit (°F) by the following equation:
°F = 1.8(°C) + 32
Sea level: In this report "sea level" refers to the National Geodetic Vertical Datum of 1929 (NGVD of 1929) a geodetic datum derived from a general adjustment of the first- order level nets of both the United States and Canada, formerly called "Sea Level Datum of 1929."
HYDROGEOLOGY AND WATER QUALITY NEAR A SOLID- AND HAZARDOUS-WASTE LANDFILL, NORTHWOOD, OHIO
By Jeffrey T. de Roche and Kevin J. Breen
ABSTRACT
Hydrogeology and water quality of ground water and selected streams were evalu ated near a landfill in northwestern Ohio. The landfill is used for codisposal of solid and hazardous waste. Water-level and geologic data were collected from 36 wells and 3 surface-water sites during the period November 1983 to November 1985. Water- quality samples were collected from 18 wells and 3 surface-water sites during this same period.
The primary aquifers in the area are the Greenfield Dolomite and underlying Lock- port Dolomite of Silurian age. These bedrock carbonates are overlain by two clay tills of Wisconsinan age. The tills are capped by a glacial lake clay. The tills generally are satu rated, but do not yield sufficient water to be considered an aquifer. Two wells in the study area yield water, in part, from discontinuous deposits of outwash sand and gravel at the lower till-bedrock interface.
Regional ground-water flow is from southwest to northeast; local flow is influenced by a ground-water mound centered under the northernmost cells of the landfill. Water levels in wells penetrating refuse within the landfill and the presence of leachate seeps indicate that the refuse is saturated. Head relations among the landfill, till, and dolomite aquifer indicate a vertical component of flow downward from the landfill to the dolomite aquifer. Water levels near the landfill fluctuate as much as 14 feet per year, in contrast to fluctuations of less than 3 feet per year in wells upgradient of the landfill.
Ground waters from wells completed in the dolomite aquifer and glacial till were found to have major-ion concentrations controlled, in large part, by reaction with calcite, dolomite, and other minerals in the aquifers. Only minor departures from equilibrium mineral saturation were noted for ground water, except in wells affected by cement/grout contamination. Molal ratios of calciumimagnesium in ground water suggest a similar chemical evolution of waters throughout the dolomite aquifer in the study area. Stable- isotope ratios of oxygen and hydrogen indicate the source of water in the till unit and dolomite aquifer is atmospheric precipitation.
Elevated levels of total dissolved solids, boron, ammonia, and iron in the leachate and in wells downgradient of the landfill may indicate mixing of ground water with leachate. Oxygen and hydrogen stable-isotope ratios were used to differentiate waters from the glacial till and dolomite aquifer. Isotope ratios also show a shift off the local
mixing line for leachate and for a well just downgradient from the landfill. This shift to heavier values of 8 D in the well water may be indicative of leachate mixing with ground water.
The effect of this mixing denoted by hydrologic, isotopic, and chemical-quality data is limited mostly to elevated levels of the common ions. Analysis did not indicate signifi cant levels of toxic metals or organic contaminants except phenol, which was present at concentrations of from 1 to 5 micrograms per liter in six wells. Analysis of water-quality data from nearby streams suggests that surface leaching from the landfill does not signifi cantly affect stream-water quality, but may contribute to higher levels of trace metals in the streambed sediments.
INTRODUCTION
Ground water is an important resource for rural residents near Northwood, Ohio. The presence of a solid- and hazardous-waste landfill near Northwood and a lack of current ground-water data for the surrounding area created a need for a study of the hydrogeology and water quality. This study was conducted in cooperation with the City of Northwood, Ohio, and presents findings from data collected from November 1983 through November 1985.
Purpose and Scope
The purpose of this report is to describe the hydrogeology and the chemical quality of ground water and surface water near the landfill. The evaluation was made by (1) review of available hydrogeologic and chemical-quality data; (2) mapping of the glacial overburden and underlying dolomite aquifer from well logs and geologic borings; (3) measurement of hydraulic head in the glacial overburden and dolomite aquifer; (4) collection and analysis of water-quality data from the landfill, glacial overburden, and dolomite aquifer; and (5) collection and analysis of water- and sediment-quality data from local streams.
Location and Setting
The project area (fig. 1) is located in Wood County in northwestern Ohio and en compasses an area of approximately 10 mi2 (square miles). The area includes parts of the City of Northwood (population 6,000) and the Village of Walbridge (population 3,000). Land use in the area is a mixture of light and heavy industry, transportation, housing, and open areas used for agriculture.
The climate is temperate. Average annual temperature for the 1951-80 period was 10.8 °C (51.5 °F). For the same period, monthly average precipitation ranged from a
83
° 3
2'3
0*
83",
30
'
41"
37'-
41"
35'
Base
fr
om
U
.S.
Geolo
gic
al
Surv
ey
Ro
ssfo
rd
Qu
ad
ran
gle
1-2
4,0
00,
1980
and
Wa
lbrld
ge
Q
ua
dra
ng
le
1:2
4,0
00
, 1980
EX
PL
AN
AT
ION
La
nd
fill
boun
dary
La
nd
fill
cell
and
num
ber
Fig
ure
1. Location o
f st
udy
area
.
high of 3.50 in. (inches) for June to a low of 1.81 in. for February. The 30-year average annual precipitation was 32.29 in. (National Oceanic and Atmospheric Administration, 1982).
Topography in the area is flat and nearly featureless. Drainage is provided by roadside ditches, Otter Creek, and Dry Creek. Most soils belong to the Toledo soil association (U.S. Department of Agriculture, 1966) and are developed in lake-deposited silts and clays.
Description of the Landfill
The landfill site (fig. 1) covers approximately 160 acres and is primarily used for disposal of municipal and commercial refuse. The northern part of the landfill is divided into five separate excavations, or cells. Before construction of the landfill, a railroad switching station known as Outer Yard occupied much of the site. Most of the track has been removed since landfilling started on the original 20-acre site in 1972.
Records indicate that cells 1 through 4 use the local natural clay deposit as liner material and contain primarily municipal and commercial refuse (Waste Management, Inc., written commun., no date). However, a Resource Conservation and Recovery Act (RCRA), Part B application indicates that past landfilling included disposal of wastes now defined as hazardous (Dames and Moore, 1983). The excavation depth below grade for pits 1 through 4 is reported to be 35 to 40 feet (John Barbush, Waste Management, Inc., oral commun., 1984).
Cell 5, which was permitted to receive hazardous waste, also uses the local clay till as a liner. Depth of fill below grade is 35 feet. Site delivery records for 1982 and 1983 indicate the hazardous-waste cell contains primarily heavy-metal sludges, wastewater- treatment sludges from electroplating operations, and air-pollution-control sludges or dust. Records also show soluble cyanide salts, DDT, toluene, 1,1,1,- trichloroethane, and 2,4-D were deposited in the hazardous-waste cell.
Cells 1 through 5 have all been filled and completed and are covered with clay caps. Cells 1, 2, and 4 are equipped with methane-venting wells that may be used for leachate observation. Cell 5 is equipped with a leachate collection and monitoring system.
Landfilling of solid waste expanded into the southern section of the site during the early 1980's. Currently, disposal in the southern section is limited to solid waste; no hazardous wastes are permitted. The investigation centers primarily on the northern section of the site because cells have been in place longer and because of the nature of the waste in cell 5.
Previous Investigations
Most publications on the hydrogeology of Wood County are regional or countywide in scope and provide minimal information on water quality. The regional subsurface geology has been investigated and summarized by Kahle and Floyd (1972) and Janssens (1977). Reports relating geology to land-use planning for Wood County have been done by Forsyth (1968) and Nielsen (1977).
Studies by the Ohio Department of Natural Resources (1970), Norris and Fidler (1969, 1971a, 1971b), and Norris (1974) discuss the regional hydrogeology of northwest ern Ohio. A report by Glaze (1972) provides information on the hydrogeology of north ern Wood County, and a subsequent study by Paulson (1981) reviews the ground-water resources of Wood County. A recent synopsis of ground-water resources in northwestern Ohio and southern Michigan by the Toledo Metropolitan Area Council of Governments (1982) provides information on the hydrogeology of selected northwestern Ohio counties.
Site-specific reports on the landfill area have been prepared by Bowser-Morner Testing Laboratories (1980) and Dames and Moore (1983, 1984). These reports address the area's geology and ground-water occurrence but provide only minimal information on ground-water quality.
Methods of Study
The data-collection network (fig. 2, table 1) consisted of 36 wells and 3 surface- water sites. Two wells were equipped with hourly water-level recorders, and a continu ous precipitation recorder was installed on site. Water-level measurements were obtained bimonthly from the well network. Additional hydrologic and geologic information was obtained from logs and laboratory tests of 27 borings (Bowser-Morner Testing Laborato ries, 1980; Dames and Moore, 1983,1984).
Of the 36 wells, 22 are domestic or commercial wells that are cased into bedrock and are open hole below. Ten are specially constructed monitoring wells cased into bedrock, screened and sandpacked in the upper zones of bedrock, and grouted with a cement or cement/bentonite mixture. Two piezometers (113 and 123) 1 are cased, grouted, and screened and sandpacked in the overlying till, and two wells (152 and 154) are finished within the northern cells of the solid-waste landfill to vent methane gas.
Chemical-quality data were collected from April 4, 1984, through July 11, 1985, from three surface-water sites and 17 ground-water wells. Water samples were analyzed
^or the sake of simplicity, the county prefix"WO" has been omitted from local well numbers in the text and many of the illustrations in this report. Local numbers are given in full in the tables.
83"
32'3
0
»////
-r-0
,1
! tT
ffi*
* i
, i
11 i
t !
*'
> ' -
*41
" 3
5'-
i1
/'//
////
''
I I
ft fill
I
Base
fr
om
U
.S.
Ge
olo
gic
al
Su
rve
y I
Ro
ssfo
rd
Quadra
ngle
1:2
4,0
00,
19
80
and
Wa
lbrid
ge
Q
ua
dra
ng
le
1:2
4.0
00
, 1980
-JE
XP
LAN
AT
ION
A
10
0
®
Ob
serv
atio
n w
ell
- -
L
an
dfil
l boundary
Surf
ace
-wate
r si
te :
A
Ott
er
Cre
ek t
ributa
ry a
t W
ale
s R
oad
B
Ott
er
Cre
ek
trib
uta
ry a
t W
hitm
ore
Ya
rd
X X
* Loca
tion o
f g
eo
log
ic s
ect
ion
C
Dry
Cre
ek
at E
ast
Bro
adw
ay
Fig
ure
2. D
ata
-colle
ction n
etw
ork
and
loca
tion
of
geol
ogic
sec
tion
X-X
' (t
he c
ou
nty
-co
de
pre
fix "
WO
-"
has
been
om
itted
fro
m w
ell
num
bers
).
Table 1. Records of selected wells near Northwood, Ohio
[Producing zone: D, dolomite; T, till. Casing type: S, steel; P, PVC. Dashes indicate data not available or not applicable.]
Well number
WO-100WO-101WO- 102WO- 103WO-104
WO-105WO-106WO-107WO-108WO-109
WO-110WO- 111WO- 112WO- 113WO-114
WO- 115WO-116WO- 117WO- 118WO-119
WO-120WO- 121WO-122WO- 123WO-124
WO-125WO- 12 6WO-128WO- 12 9WO-130
WO- 131WO- 132WO- 133WO-134WO-152 1WO-1541
Latitude
41°35 I 12"41°36'31"41°36'35"41° 35 '51"41°36'20"
41° 35 '32"41°36 I 04"41°36'26"41° 36 '25"41° 36 '16"
for water characteristics, major ions, trace constituents, nutrients, base/ neutral- and acid- extractable organic compounds, volatile organic compounds, and stable isotopes of oxygen and hydrogen. In addition, streambed materials were analyzed for trace metals and base/neutral- and acid-extractable organic compounds. Blanks, spikes, and duplicate samples were submitted to the laboratory for quality assurance and quality control. Water and sediment samples were analyzed by U.S. Geological Survey National Water Quality Laboratory. Isotope samples were analyzed by the U.S. Geological Survey's Isotope Fractionation group in Reston, Va.
Sampling procedures for observation wells were designed to obtain a representative sample from the aquifer and to minimize the introduction of any foreign substance that might affect ambient or native water quality. All observation wells were pumped until a minimum of three casing volumes was purged from the well. Domestic wells were pumped until the volume of the pressure tank plus three casing volumes had been purged. During purging, pH, conductance, temperature, and dissolved oxygen were monitored by use of a flow chamber. After purging the wells, samples were collected when readings became stable.
Most of the monitoring wells within the landfill perimeter were installed by the landfill's contractor and are of PVC construction equipped with dedicated submersible pumps and PVC lift lines. Wells outside of the landfill generally were domestic wells cased with steel and open hole into the dolomite aquifer. In wells not equipped with a dedicated pump, a Johnson-Keck2 SP-81 submersible pump with interchangeable EPDM and Viton stators was used for sampling. When sampling for inorganic constituents, 10 percent acetone solution and distilled water were used to clean the pump. The acetone solution was pumped through the pump and sample lines, and was followed by distilled water to flush the acetone. The power line, pump housing, and exterior of the sample line also were cleaned before being lowered into the well.
When sampling for base/neutral- and acid-extractable organic compounds, a solution of 75 percent hexane and 25 percent alcohol was used to clean the interior and exterior parts of the sampling pump. Pump materials for organic sampling were limited to Teflon, Viton, and stainless steel. For all observation-well sampling, the pump was cleaned before it was lowered into the well and immediately after it was removed. For sampling of volatile organic compounds, a Teflon bladder pump was used. A detergent wash and distilled-water rinse were used to clean the pump before and after use.
Bed material was obtained from local streams and analyzed for organic constituents and trace metals. To increase the recovery of fine sediments, pools and low-velocity reaches of the streams were chosen as sampling sites. Streambed penetration during sampling was generally 4 in. or less.
2Use of firm, brand, or trade names in this report is for identification purposes only and does not constitute endorsement by the U.S. Geological Survey.
Bed-material samples for trace-metal analysis were collected with a U.S. Geological Survey RBM80 sampler or a plastic scoop. All sampling equipment and containers were cleaned with a 10 percent nitric acid solution, followed by distilled water, and then by a native-water rinse. Samples were separated after freeze drying, and the less-than-25-|im (micrometer) fraction was analyzed.
Bed-material samples for organic constituents were collected with an RBM80 sampler, a stainless-steel scoop, and stainless-steel sieves. All sampling equipment was cleaned with a 75 percent hexane and 25 percent alcohol solution, followed by distilled water and native-water rinses. Samples were wet sieved in the field through 90- and 63-|U.m sieves, and the less-than-63-|im fraction (medium silts and smaller) was analyzed.
Analysis of organic constituents in water and sediments was done by gas chromatog- raphy/mass spectrometry. Samples were analyzed quantitatively for base/neutral- and acid-extractable organic compounds and qualitatively for all other methylene-chloride- extractable organics. All samples were analyzed at the U.S. Geological Survey National Water-Quality Laboratory.
Acknowledgments
The authors are grateful for the information and assistance provided by Wood County Health Department, Toledo Metropolitan Area Council of Governments, the City of Northwood, and Waste Management, Inc. Appreciation is expressed also to Bihn Well Drilling and to the private landowners and homeowners who offered their wells for water-level measurement and chemical-quality sampling. In the interpretation of isotopic results, the assistance of Carol Kendall, U.S. Geological Survey, Reston, Va., also is gratefully acknowledged.
HYDROGEOLOGY
Unconsolidated Deposits
The unconsolidated deposits in the study area (fig. 3) consist of a glacial-lake clay deposit underlain by two tills of Wisconsinan age. The upper till, into which the landfill cells are excavated, is rich in clay, whereas the lower till contains a relatively high per centage of sand and pebbles (Forsyth, 1968). Underlying the lower till is a detrital or broken-rock zone composed of sand, gravel, boulders, rock fragments, and clay. This characteristic layering of the unconsolidated deposits has been correlated over much of northern Ohio by Forsyth (1960).
UJ UJ
560
g 540D
520
500
Lower till
Detrital zone
Dolomite
0 1000 2000 3000 4000 5000 6000
Vertical scale greatly exaggerated
DISTANCE, IN FEET
EXPLANATION
Geologic contact dashed where
approximately located.
Figure 3. Generalized geologic section X-X'.
10
Examination of test borings (Bowser-Morner Testing Laboratories, 1980; Dames and Moore, 1983, 1984) shows the glacial lake deposit is a dark-brown silty clay containing traces of sand and gravel that ranges from 6 to 15 ft in thickness. This horizon is oxi dized and mottled, and exhibits vertical fractures that extend into the underlying upper till. A seasonal water table is present in this layer.
The upper till, formally called the Hayesville Till (White, 1961), is an olive-gray clay containing silt, sand, and traces of gravel. This horizon ranges from 35 to 42 ft in thickness and contains occasional thin seams (0 to 2 ft) of sand or sand and gravel. Sand or gravel zones generally are saturated; however, yields are not sufficient to constitute a usable water supply.
Values of vertical hydraulic conductivity from triaxial chamber tests (Bowser Morner Testing Laboratories, 1980) performed on two samples were 8.5 x 10"5 ft/d (feet per day). Examination of two core samples of upper till taken on site (Dames and Moore, 1984) revealed vertical fractures at a depth of 45 ft, which is within 10 ft of the upper-till/ lower-till contact (R. Pavey, Ohio Department of Natural Resources, Division of Geo logical Survey, oral commun., 1986). Because of the high resistance of low-K soils to ground-water flow, the effects of nonuniformities such as stratified permeable sand layers, fractures, and fissures become very important, as these provide the low-resistance path to leachate flow (Mixon and others, 1987). During cell excavation (fig. 3) the upper till is removed to within 10 to 15 ft of the contact with the lower till.
The lower or Millbrook Till (White, 1961) is a 15- to 25-ft-thick section of gray clay with silt, sand, and gravel. In situ and laboratory testing (Bowser-Morner Testing Labo ratories, 1980; Dames and Moore, 1983) indicates that vertical hydraulic conductivity of the lower till is in the range of 8.5 x 10'5 to 1.2 x lO^ft/d. The contact between the upper and lower tills is characterized by sand and gravel zones, mottling, and increased water content. Zones of sand and (or) gravel are found throughout the entire thickness of the lower till and range in thickness from 0.08 to 1.7 ft (Dames and Moore, 1984). The lower till and associated sand zones generally are saturated, but do not yield sufficient water to be considered an aquifer. The composition of the sand zones is variable and ranges from silty/clayey sand to clean sand in composition and from fine to coarse in texture. There are no data to suggest that the zones of sand and gravel are laterally continuous in the sense of a readily identifiable bed or horizon; however, their prevalence and relatively higher permeability than the surrounding clay till may allow these sand zones to act as pathways for lateral and vertical flow and recharge to the underlying dolomite aquifer.
Samples of upper and lower clay till from cores collected during drilling of well 115 were analyzed for mineralogic composition by X-ray diffraction. The samples, which represent 39- to 40.5-ft and 59- to 60.5-ft depths, were found similar in mineralogy and
11
consisted of muscovite, chlorite, quartz, calcite, ankeritic dolomite, and feldspar. The tills produce carbon dioxide gas when reacted with hydrochloric acid, and, therefore, may be termed calcareous clay tills.
The contact between the lower till and the underlying dolomite aquifer is character ized by discontinuous deposits of outwash sand and gravel and rock fragments. These deposits, which typically range in thickness from 2 to 29 ft, commonly are found in preglacial drainage valleys (Paulson, 1981), and, where saturated, are a good source of water for small domestic supplies (Forsyth, 1968). This zone commonly is noted by local drillers and identified as broken rock or gravel. The maximum thickness of this deposit noted in the study area is 18 ft in boring CB-23 (Dames and Moore, 1984). The deposit consists of clay, sand, gravel, and rock fragments and is located in a preglacial drainage valley just east of the landfill.
Bedrock
The study area is underlain by the Greenfield Dolomite of Silurian age. Underlying the Greenfield and also of Silurian age is the Lockport Dolomite. The landfill lies near the gradational contact between the Greenfield Dolomite and the Lockport Dolomite.
The Greenfield Dolomite is considered to be a biohermal and biostromal facies of the Lockport (Janssens, 1977). The Greenfield Dolomite is characterized as being brown, microcrystalline, medium-bedded, and stromatolitic, with solution channels, bituminous partings, and stylolites. The Lockport is a gray to blue-gray vuggy dolomite. Although the dolomites underlying the landfill have characteristics of both the Lockport and Green- field, they generally are assigned to the Greenfield Dolomite based upon the presence of stromatolites and stylolites. Because of the facies changes, the contact between the Lockport and Greenfield is considered to be gradational, and the units cannot be differen tiated easily in the subsurface (Janssens, 1977). Wells within the study area most likely produce water from both units.
The complex geology is a result of the Silurian reef complex located in northern and central Wood County (Mesolella, 1978). The Silurian reef complex is greatly variable in thickness and exhibits many changes in facies between adjacent strata, which reflects deposition in an environment that fluctuated between supratidal and intertidal. Evidence of repeated subaerial exposure an important factor influencing the porosity of carbonate rocks has been noted in local quarries where the Greenfield and Lockport Dolomites are exposed (Kahle and Floyd, 1972; Kahle, 1978).
The bedrock surface in the vicinity of the landfill (fig. 4) is that of a ridge and a valley trending northeast. Joints and fractures in the carbonate rocks are avenues for carbonate solution and have influenced the present position of bedrock valleys.
12
Ba
se
fro
m
U.S
. G
eo
log
ica
l S
urv
ey
Ro
ssfo
rd
Quadra
ngle
1
:24
.00
0,
19
80
an
d W
alb
nd
ge
Q
ua
dra
ng
le
1 2
4,0
00
, 1
EX
PL
AN
AT
ION
.54
0_
__
L
ine
of
equa
l a
ltitu
de
of
bedro
ck s
urf
ace
; dash
ed w
here
unc
erta
in.
Inte
rval
, 5
feet
Dat
um,
Nat
iona
l G
eode
tic V
ert
ical
Dat
um o
f 1929.
ru=
-^
Land
fill
boun
dary
.
°
Ob
serv
atio
n w
ell
Fig
ure
4.-
-Altitude a
nd c
onfig
ura
tion o
f bedro
ck s
urfa
ce.
Rowland and Kunkle (1970) reported that northeast-trending joints are particularly permeable. Borings near the landfill indicate the presence of joints and fractures (both sealed and open), solution vugs, and cavities or voids.
Permeability in the Greenfield Dolomite is predominantly the result of secondary openings joints, fractures, and solution cavities. The high degree of aquifer heterogene ity caused by differing depositional environments, subaerial erosion, and formation of secondary openings produces a wide range of water-yielding characteristics. Specific capacity per foot of aquifer penetration ranges from 0.0028 to 0.3103 [(gal/min)/ft]/ft (gallons per minute per foot per foot) for domestic and small commercial wells in the study area. This range of values compares with the median value for "Area 3" of 0.0038 [(gal/min)/ft]/ft (Ohio Department of Natural Resources, 1970). Area 3 includes the entire eastern half of Wood County, including the Northwood area. Wells having the highest specific capacities either produce water from the lower till-bedrock interface, or, because of their greater depth, may encounter a greater number of fractures.
Ground-Water Levels and Flow
Assuming isotropic conditions within an aquifer, ground water generally moves from areas of high hydraulic head to areas of low hydraulic head along paths perpendicu lar to potentiometric contours. Because flow in the dolomite aquifer is by means of secondary openings, conditions within the aquifer are not isotropic and, therefore, differ with direction.
If fracture spacing is sufficiently dense, flow in fractured media may resemble flow in a granular porous media. If fracture spacings are irregular in a given direction, the media will exhibit spatial trends in heterogeneity (Freeze and Cherry, 1979). Thirteen out of 15 bedrock cores indicate the presence of highly fractured and vuggy zones in the upper bedrock at depths of 70 to 80 ft below land surface. Deeper cores indicate that highly fractured zones also are present from 80 to 100 ft deep.
Most monitoring wells near the landfill are screened in these highly fractured zones. Reported transmissivities (H. B. Eagon, Jr., Eagon and Associates, Inc., oral commun., November 19, 1985) range from 0.83 ft2/d (feet squared per day) to 14.34 ft2/d, with a mean value of approximately 5 ft2/d. These values were obtained from eight wells that penetrate only the upper 20 to 30 ft of the dolomite aquifer and are not corrected for partial penetration. Core logs indicate that the fractured zone is widespread and may react like a porous medium; however, the range in transmissivities would indicate that conditions are heterogeneous, and that certain areas can transmit water at a higher rate than others.
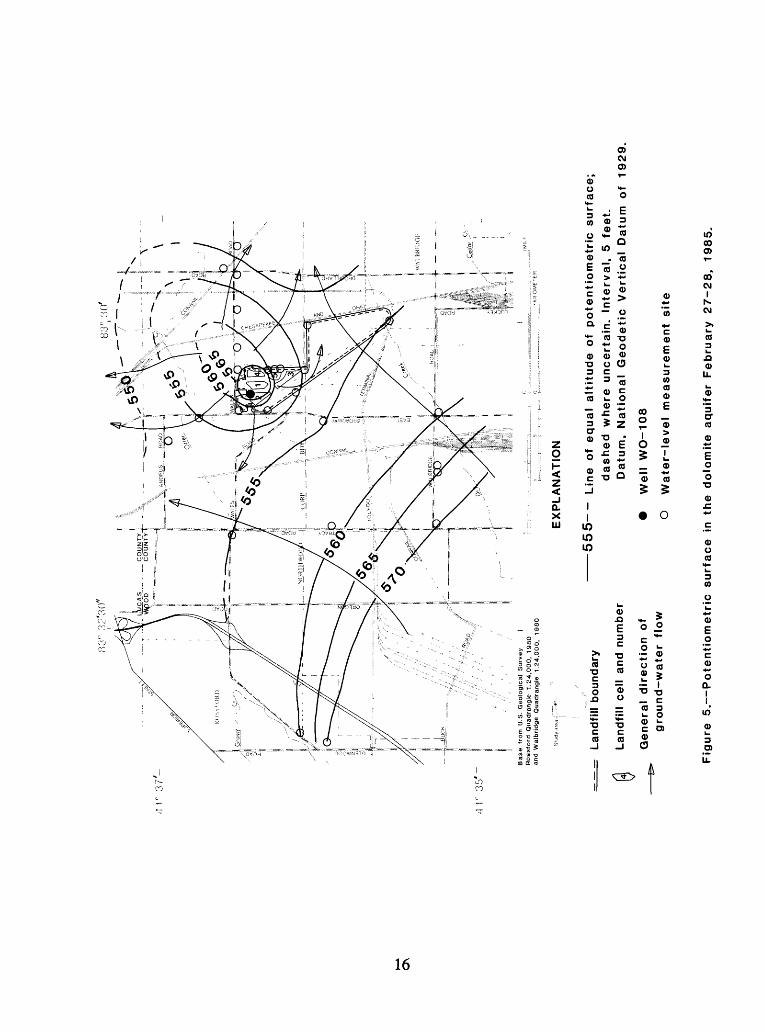
In the study area, regional ground-water flow in the confined dolomite aquifer is primarily from southwest to northeast, as shown by the potentiometric map. The potenti-
14
ometric map (fig. 5) may be viewed as showing the sum of many possible directions of ground-water flow through the various interconnected joints and solution channels.
The dominant local feature on the potentiometric map (fig. 5) is the ground-water mound centered under the northern section of the landfill. The mound was first noted in March 1984. Subsequent water-level measurements confirmed that it is persistent and fluctuates seasonally. The mound appears to extend asymmetrically in the direction of regional flow in the dolomite aquifer. The geometry of the surface suggests that the area of recharge is approximately centered on landfill cell 1.
The potentiometric map shows aquifer reaction to recharge by snowmelt and by 1.26 in. of precipitation that occurred during the preceding 5-day period. Weather condi tions, combined with constricted drainage in Otter Creek where it enters a culvert under Wales Road, caused surface flooding in the area. The restricted surface waters rose to an altitude of approximately 613.3 ft, as indicated by high-water marks on the surface casings of wells 112 and 115. Flooding was localized and confined to overtopping of natural and manmade drainages near the landfill as opposed to a large area of inundation. The surface waters receded over a 12-day period.
As a result of flooding, surface waters rose to 0.7 ft above the top of the protective casing of well 108. Similar flooding occurred in April 1985, and well 108 again was submerged. The flooding of well 108 may have contributed to the ground-water mound; however, the magnitude of the effect is not known.
Ground-water levels near the northernmost landfill cells fluctuate as much as 14 ft per year (figs. 6A and 6B), in contrast to fluctuations of less than 3 ft per year in wells upgradient from the landfill. Reaction to precipitation and snowmelt is much more pronounced near the landfill, as shown by water-level increases from December 1984 to February 1985 (fig. 6A). Water-level fluctuations (fig. 6B) during the period February to March 1985 show the general decrease in water levels as the mound dissipates. The high permeability of landfilled wastes, the proximity of the cell base to the fractured till zone near the upperAower till contact, and the fractured nature of the dolomite surface are factors likely contributing to the large water-level fluctuations near the center of the northernmost landfill cells.
Figure 7 shows the relation between precipitation and water levels in wells com pleted in the till and underlying confined aquifer. Well 113 is screened, sand packed (25 to 49 ft below land surface), and grouted in the upper-till/lower-till interface, whereas well 121 is cased in the dolomite and is open hole below. Well HY-2 is located approxi mately 29 miles southeast of the study area, is cased in the dolomite aquifer, and is open hole below. All wells were equipped with water-level gages and digital recorders that recorded water level on an hourly basis.
15
o\
Base
fr
om
U
.S.
Ge
olo
gic
al
Surv
ey
Ross
ford
Q
ua
dra
ng
le
1.2
4,0
00,
19
80
and
Wa
lbn
rig
e
Qua
dran
gle
1.2
4,0
00
, 1980
=^=
L
andf
ill b
ound
ary
Lan
dfill
cel
l an
d nu
mbe
re
Ge
ne
ral
dir
ec
tio
n
of
gro
un
d-w
ate
r fl
ow
EX
PL
AN
AT
ION
555--
Lin
e
of
eq
ua
l a
ltitu
de
of
pote
ntiom
etr
ic su
rfa
ce
;
da
sh
ed
w
he
re u
nce
rta
in.
Inte
rva
l,
5 fe
et.
D
atu
m,
National
Geo
de
tic V
ert
ica
l D
atu
m
of
1929.
Well
WO
-10
8
O
Wate
r-le
vel
me
asu
rem
en
t site
Fig
ure
5
. P
ote
ntio
me
tric
surf
ace
in th
e dolo
mite a
qu
ife
r F
eb
rua
ry 27-2
8,
19
85
.
83
° 3
2'3
(f
41"
37
_ _ _
_
_
I'j_
_ N
OR
HI\
U)O
p _
!|j
CO
RP
[i :|j
~ ~
" ~
~"
ain.
oa
Base
fr
om
U
.S.
Geolo
gic
al
Su
rve
y I
Ro
ssfo
rd Q
ua
dra
ng
le
1:2
4,0
00
, 1980
and
Wa
lbrid
ge
Q
uadra
ngle
1
:24
,00
0,
19
80
EX
PL
AN
AT
ION
1.0
8
®
Gro
und-w
ate
r-le
vel
measu
rem
ent
site a
nd
magnitu
de o
f w
ate
r-le
vel
change i
n fe
et.
+ In
dic
ate
s a
rise
in
wa
ter-
leve
l.
I
ndic
ate
s a
de
clin
e i
n w
ate
r-le
ve
l.
- 4
L
ine
of
equa
l rise
of
gro
un
d-
wa
teM
eve
ls in
feet, d
ashe
d
wh
ere
ap
pro
xim
ate
.
Fig
ure
6A
. R
ise
of
gro
und-w
ate
r le
vels
in
stu
dy
are
a f
rom
Dece
mber
1984 t
hro
ugh F
eb
rua
ry 1
985.
oo
41.5
0
Base
fr
om
U
.S.
Ge
olo
gic
al
Surv
ey
Ro
ssfo
rd
Qu
ad
ran
gle
1-2
4,0
00,
1980
and
Walb
ridge
Qua
dran
gle
1:2
4,0
00
, 1980
EX
PL
AN
AT
ION
-1.1
3®
G
rou
nd
-wa
ter-
leve
l m
ea
sure
me
nt
site
and
mag
nitu
de o
f w
ate
r-le
vel
chan
ge i
n fe
et
+ I
ndic
ates
a r
ise
in w
ate
r-le
vel.
- In
dica
tes
a de
clin
e in
wa
ter-
leve
L
4
L
ine
of
equa
l de
clin
e of
g
rou
nd
-wa
ter-
leve
ls
in f
eet,
dash
ed w
here
appr
oxim
ate.
Figu
re 6
B.
De
cli
ne
of
gro
un
d-w
ater
lev
els
in s
tudy
are
a fr
om F
ebru
ary
1985
thr
ough
Mar
ch 1
985.
n
(5* § N
'l I $ a. i i
MA
XIM
UM
WA
TE
R L
EV
EL
, F
EE
T
BE
LO
W L
AN
D-S
UR
FA
CE
DA
TU
MS
UM
RA
INF
AL
L,
AC
CU
MU
LA
TE
D (
INC
HE
S)
-r
w
?
?
3
S1
s- § !
9
s
Qt3
A
<p
S"!
I 3T
S I
§ s-
00
^£ f? 5>
05"^
o
«< 0> sf ro _i S*
55
56
I- 2 57
^ Q 58
UJ UJ> O 59UJ <_J u.CC § 60
| Q 61
3 3 62
2 3 632 m
0 64
65
15
16
I- 5 17UJ DUJ h-
"; S is_jUJ UJS g 19 -J u.
S DC D 20
I ^ 21
I ^ 22
x Q< UJ 23^2 QQ
24
25
WO-121 SHOOK 6585 WALES RD AT NORTHWOOD OH 413629083304400\ \ \ r
HY-2 JOHNSON 1 Ml SW OF McCLURE OH 412123083574000ii i i i i ^ I 1 T
Carbonate
J_____I
JAN FEB MAR APR MAY JUNE JULY AUG SEPOCT NOV DEC
1984 1985
Figure 7. Hydrographs showing relation between water levels in welte WO-113 (tflO, WO-121 (carbonate), and
HY-2 (carbonate) and daily precipitation for 1985 water year Continued.
20
Water levels in well 113 (Boring B-4, Bowser Morner Testing Laboratories, 1980) reached a maximum of 0.96 ft above land surface on March 15,1985, in response to precipitation on an already saturated surface. The high water levels reflecting periods of recharge from January through May are replaced by downward-trending water levels during summer and fall that reflect the moisture deficit in the overlying clays and tills. The reaction of well 113 to precipitation indicates communication between the surface and the upper/lower till, perhaps by means of fractures, sand seams, or other permeable deposits.
By comparing the hydrographs of confined wells HY-2 and 121, it is possible to match up a series of barometric fluctuations, even though HY-2 was affected by pumping from October through December 1984 and June through September 1985. Aside from the effects of pumping, the most significant event is the rise in water level from February through March 1985. Water levels rose 2.91 ft in well 121, as compared with 1.05 ft in HY-2. Records of wells LU-1 and S-3, located in confined dolomite aquifers in adjacent Lucas and Sandusky Counties, show increases of less than 0.5 ft for this same period (Shindel and others, 1986), which indicates that water-level increases in 121 are abnor mal. Climatological data (National Oceanic and Atmospheric Administration, 1985) indicate that precipitation is comparable for all these areas.
Long-term fluctuations also may be seen in the hydrograph comparison of 121 and HY-2. After spring recharge the hydrograph of well 121 shows a sustained higher water level as compared with well HY-2. Because of this transient response, it is likely that the net water-level increase of approximately 2 ft reflects an increase in storage in the aquifer due to recharge.
Water-level rises in a confined aquifer do not necessarily indicate an increase in storage, and may be caused by atmospheric pressure fluctuations. As atmospheric pres sure increases, the water levels in wells tapping confined aquifers are lowered. The ratio of water-level changes in the well to the inverse of water-level changes in a water ba rometer is called the barometric efficiency (BE) of the aquifer (Walton, 1970).
The BE of the dolomite aquifer underlying the landfill was calculated (fig. 8) from barometric and water-level data collected during the period January 25 to 26,1985. If the barometric efficiency of an aquifer is known, the barometric pressure needed to cause a corresponding increase in water levels within the aquifer can be calculated using the equation:
ABp =BE
where BE is barometric efficiency of aquifer, in percent;
AW is change in water level resulting from a change in atmospheric pressure, in ft; and
ABp is change in atmospheric pressure, in ft of water.
21
to
to
CD co 'l I m K h <D
O O ro
WO
-12
1
SH
OO
K 6
58
5 W
AL
ES
RD
AT
N
OR
TH
WO
OD
OH
M
AX
IMU
M W
AT
ER
LE
VE
L,
FE
ET
BE
LO
W
LA
ND
-SU
RF
AC
E D
AT
UM
O)
O)
O)
O)
!*
NW
S S
ITE
94
83
0 A
T T
OL
ED
O O
H 4
13
60
00
83
48
00
00
ME
AN
BA
RO
ME
TR
IC P
RE
SS
UR
E (
IN H
G) - -
WO
-12
1
SH
OO
K 6
585 W
AL
ES
RD
AT
N
OR
TH
WO
OD
OH
M
AX
IMU
M W
AT
ER
LE
VE
L,
FE
ET
BE
LO
W
LA
ND
-SU
RF
AC
E D
AT
UM
D CJ
O
O
) O
) 0)
o r1
r1
r1
r*
-1
3
bo
b)
4*
ro
b
i co r
o
ro _i o
01 ro _
i
- <o o
co
cn oo o
01 i -i
roro
cn
\
co p o
ro
co
cn
10
CD
o10
co
cnro
oo bN
WS
SIT
E 9
48
30
AT
TO
LE
DO
O
H 4
13600083480000
ME
AN
BA
RO
ME
TR
IC P
RE
SS
UR
E (
IN H
G)
Using 81 percent as the calculated BE of the aquifer and the water-level increase of 2.91 ft in well 11 during February 1985, an impossible barometric-pressure change of 26.5 ft of water or 594 mm (millimeters) Hg would have been required to cause a 2.91-ft water-level fluctuation. Considering normal yearly barometric fluctuations for the study area are usually less than 3.4 inches of water (6.35 mm Hg), it is likely that water-level increases in the study area are a result of recharge to the aquifer, not barometric-pressure changes.
Vertical head gradients near the landfill (fig. 9) indicate that water is moving down ward from the landfill to the dolomite aquifer through a continuously saturated section of till. Wells 113 and 123, which are completed in the upper/lower till and the lower till, respectively, have consistently higher heads than 112, which is completed in the dolo mite. The direction of ground-water flow is from high head to low head; thus, the flow near the landfill is downward toward the dolomite aquifer.
Downward vertical flow toward the dolomite aquifer also is indicated by head conditions in the landfill's northern solid-waste cells. Fluid levels in the methane-venting wells were measured twice and showed a rise similar to that in other wells in the study area.
Well
WO-152
WO- 154
Date
1-29-85 4-03-85
1-29-85 4-03-85
Altitude of fluid level (ft above sea level)
614.67 615.21
610.37 611.12
Although it is possible that these fluid levels represent perched zones within the refuse, the presence of seepage zones at the edge of the landfill would indicate that the fluid surface is fairly uniform. A leachate seep emerges at an altitude of 614 ft above sea level at the landfill toe near well 107, and there is a seepage face at an approximate altitude of 614 ft along the eastern boundary of the landfill.
These measurements indicate a fluid level within the landfill at or near the original land surface of 615 ft above sea level very similar to levels in well 113. Comparison of fluid levels within the landfill with wells 123 and 112 indicates a downward hydraulic gradient from the landfill to the till and to the dolomite aquifer. The position of the potentiometric mound (fig. 9) suggests that the landfill is the area of recharge (downward flow) and the cause of the mound.
Water levels in wells 113 and 123 indicate that parts of both the upper and lower till are saturated. Similar conditions likely exist beneath the landfill. Rapid transmission of
Potentiometric surface in dolomite aquifer, February 27, 1985
Water level in selected observation wells, date
Geologic contact, dashed where approximately located.
Vertical leakage
6000
Figure 9. Hydrogeologic section X-X' showing head relations between the landfill,
till, and dolomite aquifer.
24
recharge to the dolomite aquifer may be encouraged by desiccation cracks formed by drying and shrinkage of clays and by fractures within the till.
WATER QUALITY
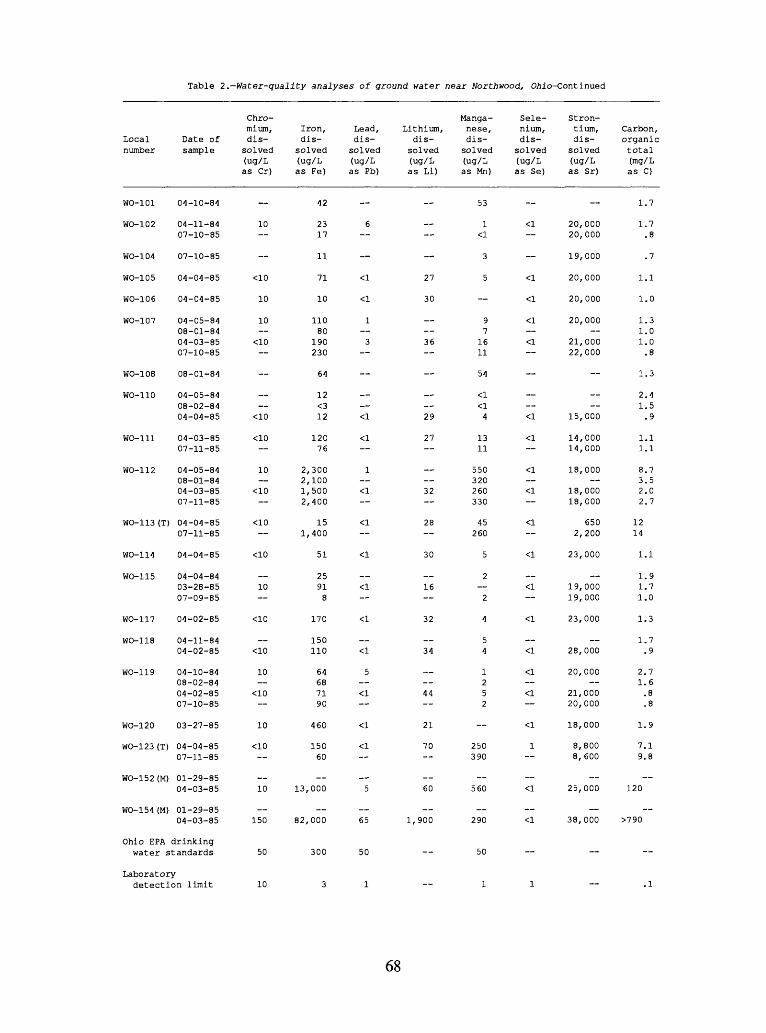
The water-quality sampling program was designed to assess the current water quality in the study area and to determine if the landfill was affecting ground-water quality or surface-water quality. Water-quality samples (fig. 10) were collected from 18 wells, 3 surface-water sites, and 2 methane-venting wells. To assess seasonal water-quality variations, several wells were sampled more than once during the period April 1984 to July 1985. Water samples were analyzed for physical properties; major, minor, and trace constituents; nutrients; organic constituents; and stable isotopes. In addition, streambed sediments were analyzed for trace metals and base/neutral- and acid-extractable organic compounds. Table 2 (at back of report) presents results of analyses of the ground water.
Ground Water
The chemical composition of ground water in the dolomite aquifer differs considera bly throughout the study area, as seen from the wide range in concentration of many individual constituents (table 3). Ground water from the dolomite aquifer is very hard, has a median pH of 7.55 and a median specific conductance of 1,025 [j,S/cm (micro- siemens per centimeter at 25 °C). The most abundant anions are sulfate and bicarbonate, with median values of 425 mg/L (milligrams per liter) and 141 mg/L, respectively. The major cations are calcium, with a median concentration of 100 mg/L, and magnesium, with a median concentration of 41 mg/L. Chloride concentrations range from 3.3 to 26 mg/L, with a median value of 10 mg/L. Sodium has a median concentration of 61 mg/L. Potassium is present in amounts ranging from 1.9 to 3.6 mg/L.
Iron and manganese range widely in concentration, kon from 3 to 2,400 [ig/L (micrograms per liter), and manganese from 1 to 550 [Ig/L. Ground water in well 112 exceeds the Ohio Envkonmental Protection Agency (1978,1980) drinking-water standard (table 2) for both kon and manganese. The dominant nitrogen species is ammo nia, with a median concentration of 0.4 mg/L. Total organic carbon ranges from 0.7 to 8.7 mg/L, with a median concentration of 1.3 mg/L.
Phenols with concentrations ranging from 1 to 5 [Ig/L were detected in four wells. Waters in wells 107 and 111 exceed the Ohio Envkonmental Protection Agency drink ing-water standards for phenol. In all other wells tested, no organic constituents were above detection levels. Analysis of ground-water samples for 26 VOCs (volatile organic compounds), 43 base/neutral-extractable compounds, and 11 acid-extractable organic compounds (table 4) detected 2 [ig/L of di-n-butyl phthalate in well 107 and 8 [ig/L of 2-ethylhexyl phthalate in well 112.
25
to
45"
37'
41"
35"
Ba
se
fro
m
U.S
. G
eolo
gic
al
Surv
ey
Ro
ssfo
rd Q
uadra
ngle
1:
24,O
OO
, 1980
and
Wa
lbrid
ge
Q
uadra
ngle
1:2
4,0
00,
19
80
EX
PL
AN
AT
ION
-
Landfill
boundary
®
Wate
r-quality
site
,
till (1
13
, 123)
0
Wa
ter-
qu
ality
site
, surf
ace w
ate
r
B
A
Wate
r-quality
site,
meth
ane-
venting w
ell
(15
2,
15
4)
O
Wate
r-quality
site
, dolo
mite
aquifer
Fig
ure
1
0.
Location of
site
s w
here
wa
ter-
qu
ality
sam
ple
s w
ere
co
llecte
d.
(Th
e co
un
ty co
de
p
refix W
O-
has
be
en
de
lete
d f
rom
w
ell
num
bers
.)
Tab
le 3.
Sta
tisti
cal
sum
mar
y of
gro
und-w
ate
r-quali
ty d
ata
fo
r w
ell
s in
th
e dolo
mit
e aquif
er
[Das
hes
in
dic
ate
v
alu
e
not
calc
ula
ted
.]
to
Cons
titu
ents
or
properties
Alka
lini
ty,
fiel
d (a
s Ca
COS)
Nitrogen,
N02
+ N03, di
ssol
ved
(as
N)
Nitr
ogen
, am
moni
a +
orga
nic,
dissolved
(as
N)
r\U
Sulf
ide,
total
(as
S)
Soli
ds,
resi
due
at 18
0 deg. C,
di
ssol
ved
Number
of
obse
r-
va-
Unit
tions
mg/L
mg/L
mg/L
mg/L
mg/L
mg/L
mg/L
mg/L
mg/L
mg/L
mg/L
pg/L
pS/cm
mg/L
mg/L
mg/L
mg/L
mg/L
ug/L
mg/L
pg/L
mg/L
mg/L
mg/L
mg/L
mg/L
ug/L
mg/L
pg/L
pg/L
pg/L
pg/L
pg/L
mg/L
pg/L
pg/L
pg/L
m/-r/T
32
32 11
19
27
27
27
27
27
27
32
32
15
32
29
27
27
32
32
32
32
29
27
27
24
27
27
23
32
16
12
20
16
16
32
16
12
16 1 Q
Number
of
dete
c
tions
32
32 0 19 3 1
27
27
27
27
17
32 4 32
10
27
27
32
32
32
32
29
27
27
24
27
27
23
32 7 12
16 6 4 32 5 12 0
1 ^
Mean
159 1.68 .03
.01
.42
.98
.57
.54
.9
7.7
1.7
1,097 11.0
1.4
462
301
335 43
58 2.6
804
841 9.
6 69
19
,565
443 10
482 54 1 2
107 1 29 1 d
Median
116 1.3 .02
.01
.4
.7
.31
.52
.3
7.55
1 1,
025 .5
10 1.6
440
290 73.5
41 5 2.5
740
786 8.
5 61
20,000
425 10
415 20 1 1
100 1 30 14
Mini
mum
value
30 .7 .0
1 .0
1 <0
.1
.28
.30
.00
.36
<0.1
6.
6 1
667
<0.5
3.
3 .2
220 35 3 2 1 1.9
500
546 3.
8 27
14,0
00
200 10
240 10 1 1
56 1
16 1 n
Maxi
mum
value
492 8.
7 .07
.05
.16
.63
6.20
5.80
.8
1 3.
9 11.5
5 1,
560 .6
26 2.1
730
550
2,40
0 82
550 3.6
1,20
0 1,
250 20
130
28,000
750 10
830
300 1 16
170 6 44 Td
Table 4. Organic compounds analyzed for in water from selected wells and stream sites near Northwood, Ohio
1Analyses for selected purgeable organic compounds were performed on ground water from wells WO-102, WO-104, WO-107, WO-111, WO-112, WO-113, WO-115, WO-119, and WO-123. The detection level for purge- able organic compounds is 3 pg/L. (Analysis by gas chromatograph with mass-specific detector.)
2Analyses for selected base/neutral- and acid-extractable organic compounds were performed on ground water from wells WO-102, WO-107, WO-112, and WO-119. Surface water and bottom material from sites A, B, and C were also analyzed for organic compounds. Detection levels for acid-extractable compounds were 1 pg/L and 20 pg/kg in water and bottom material, respectively. Base-neutral-extractable organic compounds were detectable at concentrations greater than 1 pg/L in water and greater than 10 pg/kg in bottom material.
28
The phthalate esters detected are commonly used as plasticizers, and low levels of these compounds are considered to be widespread in the environment (Mayer and others, 1972). Phthalate esters also may appear as artifacts in organics analysis because of low- level contamination of items used in the laboratory process. Because of these factors, the organic compounds detected cannot be considered significant in terms of denoting or ganic contamination.
The differences in relative concentrations of the common ions are easily seen by means of a trilinear diagram (fig. 11), which graphically compares ground waters on the basis of percentage of total cation and anion charge in a water sample. Water types in the dolomite aquifer range from calcium-magnesium sulfate to calcium-magnesium-sodium sulfate. Upon visual inspection of the cation and anion triangles of the diagram, the well waters may be qualitatively separated into groups:
In the case of sample 152, the cause of the distinct group is high percentages of bicarbonate and chloride and a relatively low percentage of sulfate. However, the cause of other groups is not so obvious and is due to well construction, aquifer mineralogy, or degraded water quality.
Waters in wells 113 and 123 are chemically different from wells in the dolomite aquifer because they produce water only from the upper/lower and lower till, respec tively. They also differ appreciably from each other because of the anomalously high concentration of sodium in 123. A plausible source for the elevated concentration of sodium is sodium-montmorillonite clay, commonly used in bentonite grout and the bentonite plug found above the well screen sand pack in well 123.
There are also significant differences between the April 1985 and July 1985 samples from till well 113. Elevated concentrations of dissolved oxygen, low temperature, and low concentrations of iron, strontium, and manganese (table 2) may indicate that rela tively recent recharge affected water quality in April 1985. In contrast, values for the July 1985 sample show much higher concentrations of iron, strontium, and manganese and low dissolved oxygen (table 2). As would be expected from geologic, mineralogic, and permeability data, waters from the till are more mineralized than waters from the dolomite aquifer. Because of the calcareous nature of the till and because the surface- area-to-volume ratio is greater in fine-grained aquifer materials, more minerals may be
29
118
112
110 (Grout effect)
152
Ca CATIONS
Cation groups
1. WO-110 (Grout effect)
2. WO-119
3. WO-113
4. WO-123 (Till),WO-115
5. WO-152 (Methane venting)
6. All other wells
EXPLANATION
Anion groups
1. WO-110 (Grout effect)
2. WO-107, WO-113 (Till), WO-119
3. WO-123 (Till)
4. WO-112
5. WO-152 (Methane venting)
6. WO-111
7. All other wells
Figure 11. Chemical character of ground water and cation and anion groupings of waters at Northwood, Ohio
(data in percentages of meq/L: the county-code prefix WO- has been deleted from well numbers).
30
dissolved into solution. As a result of the differing environment, the ground water from the tills is chemically very different from water in the dolomite aquifer; thus, compari sons between till and bedrock waters can be made only after careful consideration of the individual constituents.
Wells 117 and 119, although finished in the dolomite, also may produce water from the overlying till. The log of well 119 indicates the casing penetrates only 1.5 ft into the bedrock, and the owner reports recurring problems with turbidity during spring recharge and periods of heavy precipitation (Wendell Bihn, Bihn Well Drilling, oral commun., 1984). The log of well 117 indicates that the casing stops 15 ft short of the lower till/ bedrock contact.
Well 118, although not depicted in a separate cation or anion group on the trilinear diagram, has higher concentrations than other dolomite aquifer wells of almost all cations and anions. Because the cations and anions are present in the same relative percentages as other wells in the main group, the more mineralized nature of water from well 118 is not evident. There is no evidence to suggest that the well produces water from the over lying till, and well records indicate a higher specific capacity than most wells in the study area. The more highly mineralized water in well 118 may be related to the geologic strata penetrated.
Waters from well 110 and, to a lesser extent, well 106, are affected by leaching of cement grout and by chemical reactions between the grout and well water in the aquifer near the well screen. Because of the interactions between grout and ground water, many constituent concentration levels are not truly representative of native water quality in the aquifer.
Chemical Reactions in Grouted Wells
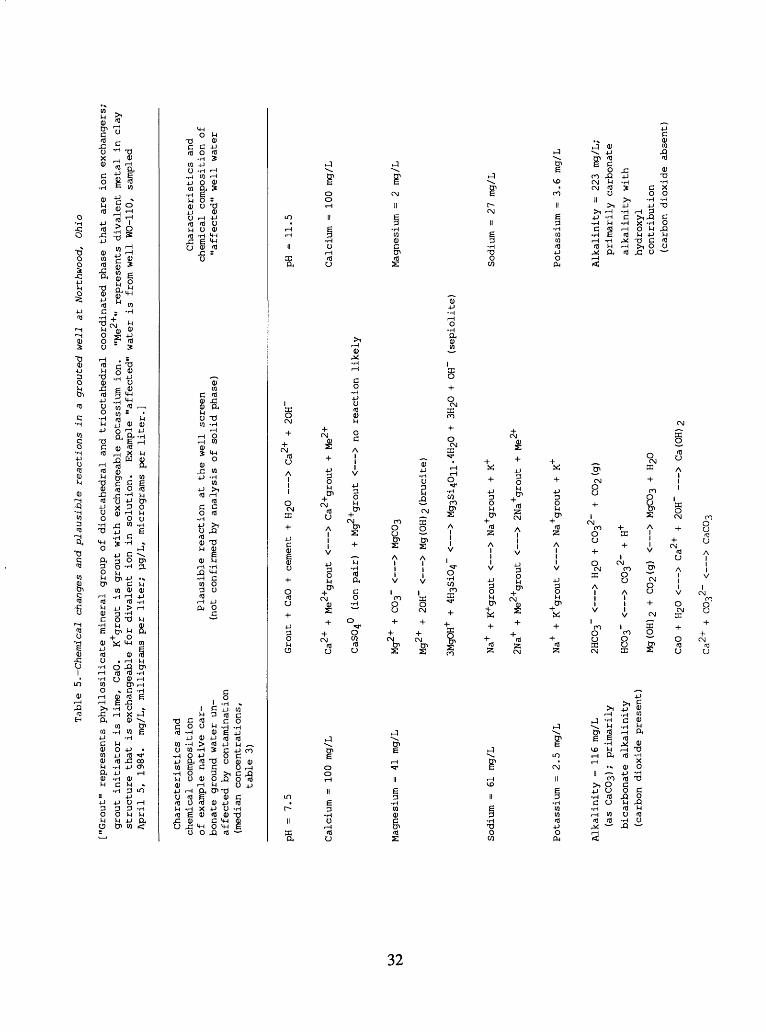
Barcelona and Helfrich (1986) have noted that cement-grout contamination in monitoring wells can have dramatic effects on water chemistry. These researchers found pH values greater than 12 and alkalinity dominated by hydroxyl ion in cement-grouted wells. As mentioned previously, two of the monitoring wells at the landfill show the effects of grout contamination. Examples of shifts in constituent concentrations that occurred in a well with elevated pH appear in table 5, as well as some plausible chemical reactions that may have contributed to the changes observed. The table illustrates that complex sequences of chemical reactions are likely taking place around the screen of an improperly grouted well. For this reason, water-quality data obtained from such wells (110, 106) should be interpreted with caution.
31
Table 5. Chemical changes and plausible reactions in a
grouted we
ll at
No
rthw
ood,
Ohio
["Gr
out"
represents phyllosi
lica
te mi
nera
l group
of dioctahedral and
trio
ctah
edra
l coordinated
phas
e th
at ar
e ion
exch
ange
rs;
grou
t in
itia
tor
is li
me,
CaO.
K+gr
out
is gr
out
with exchangeable p
otassium ion.
"Me2+
" represents divalent me
tal
in clay
structure
that
is exchangeable for
diva
lent
io
n in so
luti
on.
Exam
ple
"affected" water
is fr
om well
WO-1
10,
samp
led
April
5, 1984.
mg/L,
mill
igra
ms per
liter; ug/L,
micrograms per
lite
r.]
Char
acte
rist
ics
and
chem
ical
co
mpos
itio
n of
ex
ampl
e na
tive
car
bona
te ground wat
er un
affected by contamination
(med
ian
conc
entr
atio
ns,
tabl
e 3)
Plau
sibl
e reaction at th
e well sc
reen
(n
ot co
nfir
med
by analysis of solid
phas
e)
Char
acte
rist
ics
and
chemical co
mpos
itio
n of
"aff
ecte
d" well water
PH =
7.5
Grou
t +
CaO
+ ce
ment
+ H2
0 > Ca
2+ +
20H
pH =
11.5
to
Calc
ium
= 100
mg/L
Magnesium =
41
mg
/L
Ca2+
+
Me2+grout < > Ca
2+gr
out
+ Me
.2+
CaS0
4 (i
on pa
ir)
+ Mg
grou
t < > no reaction li
kely
Mg2
"1" +
C03~ < > MgC03
Mg2+
+
20H~
< > Mg
(OH)
2(brucite)
3MgOH+
+ 4H
3Si0
4~ < > Mg
3Si40
11.4
H20
+ 3H
20 +
OH"
(sep
ieli
te)
Calc
ium
= 100 mg/L
Magn
esiu
m =
2 mg/L
Sodi
um = 61
mg
/LNa
+ + K+g
rout
< > Na
+grout + K+
2Na+
+ Me
2+gr
out < > 2Na+grout +
Me2+
Sodium =27 mg/L
Potassium =2.5 mg/L
Na+
+ K+gro
ut < > Na
+gro
ut + K+
Potassium =3.6 mg/L
Alkalinity =
116 mg/L
(as
CaC0
3>;
primarily
bica
rbon
ate
alkalinity
(car
bon
diox
ide
pres
ent)
2HC0
3~
< > H20 + C032
~C0
2 (g)
H
Mg(O
H)2
+ C0
2(g
) < >
MgC0
3 +
H20
2+CaO
+ H2
0 < > Ca
9-1-
9Ca^+
+ C0^~ <
20H~ > Ca
(OH)
2
Alkalinity =
223
mg/L
; primarily
carbonate
alka
lini
ty with
hydr
oxyl
contribution
(car
bon di
oxid
e ab
sent
)
Tabl
e 5.
Chemical
chan
ges
and plausible
reac
tion
s in
a
grou
ted
well at
Northwood, Ohio-Continued
Characteristics
and
chemical co
mpos
itio
n of ex
ampl
e native car
bonate ground water un
af
fect
ed b
y co
ntam
inat
ion
Plausible
reaction at
th
e well screen
(not confirmed
by analysis of
solid
phas
e)
Characteristics
and
chem
ical
co
mpos
itio
n of
"aff
ecte
d" well water
Sili
ca ^8.5 mg/L (a
sSi (OH
) 4
+ OH
" < > H3Si0
4~ +
H20
3MgO
H+ +
< >
Mg3 Si
4011 '4^0 +
3H20
+
OH~
(sepiolite)
~ 4 mg
/L
Aluminum <
20 pg
/L
Sulf
ate
= 42
5 mg/L
Al(O
H)3a
m +
OH" < > A1
0H4~
(aq)
Ca2+
+
SO/,
2*
d i ow£
CaS04°(aq)
Sr2+ + SOV
> CaS04
Mg2+
(celestite)
Aluminum ~
300
ug/L
Sulf
ate
~ 20
0 mg/L
Stro
ntiu
m =
20 mg
/LSr
2+ + Me
2+gr
out
< >
Sr2+
grou
t + Me
Sr2+ +
S042
~ < >
SrS0
4 (celestite)
2+
Sr2+
Strontium ̂
15
mg/L
(4-4-85)
Iron ~
73.5 pg
/LFe
2+ +
20H
< > Fe(OH)
2Iron =12 pg/L
Controls on Native Ground-Water Quality
The chemistry of ground water is controlled, in part, by the rocks and minerals with which the waters are in contact. The presence and solubility of certain mineral phases may control the concentration of constituents in natural-water systems.
The general chemical composition of the carbonate rocks (primarily the Lockport Dolomite) of northwestern Ohio has been characterized by studies conducted at quarries in Wood County and adjacent Sandusky and Ottawa Counties. Stout (1941) presented numerous chemical analyses of the carbonates of northwestern Ohio. Turner (1977) lists analyses of the Greenfield Dolomite in Lucas County and the Lockport in Lucas and Sandusky Counties. Stith (1983) lists a single analysis of the Lockport Dolomite from Sandusky County. The chemical results for Greenfield and selected samples from the Lockport appear in table 6, and show that the rocks are dolomites containing silica, aluminum, strontium, sodium, potassium, iron, manganese, and sulfur.
Mineralogically, the rocks are comprised of calcite (CaCO3) and dolomite (CaMg(CO3)2). Fluorite (CaF2), celestite (SrSO4), and strontianite (SrCO3) have been recognized in Lockport rocks of Sandusky County (Carlson, 1986) and Ottawa County (Morrison, 1935). Much of the silica in the carbonate rocks of the midwestern United States is present as chert or chalcedony in layered nodules or bands (Weiner and Koster Van Groos, 1976). Gypsum (CaSO4 21^0) and anhydrite (CaSO4) also have been observed in the Lockport Dolomite and the younger Salina Formation of Silurian age (Carlson, 1986; Janssens, 1977).
The equilibrium chemical model WATEQF (Plummer and others, 1976) was used to compute saturation indices for mineral phases recognized in carbonate rocks of the region, as well as for several related phases including quartz, amorphous silica (silica gel precipitate), and amorphous silica (glass), which has an intermediate solubility between amorphous silica gel and the crystalline-SiO2 polymorphs, quartz, and chalcedony.
Mineral-equilibria calculations on well waters at Northwood that had cation-to-anion imbalances of less than 5 percent appear as saturation indices in table 7. This form of the saturation index also has been termed the "disequilibrium index." Jenne and others (1980) observed an increase in the variance of disequilibrium indices about the equilib rium (zero) value as the magnitude of the solubility value increased for a solid phase. A value of 5 percent of the log of the solid's solubility product (±0.05 (log K)) was found to represent a useful error band for equilibrium with the solid.
Waters with saturation-index values within the error limit are in a state of chemical equilibrium with respect to those minerals. While in this state, there is no tendency for precipitation of a mineral from, or dissolution of a mineral by, these waters. Table 7 also shows the log K values and associated 5-percent limits for selected mineral phases at a temperature of 11 °C, which is generally representative of the ground-water system.
34
Ul
Table
6. C
hemi
cal
anal
yses of sam
ples
of Greenfield
and
Lock
port
Dolomites
reported i
n the
literature fo
r selected si
tes
in northwestern Ohio
[Das
hes
indi
cate
da
ta not
available
or not
appl
icab
le]
C ounty /q
ua r ry
Greenfield Do
lomi
te
Lucas/Maumee St
one
(average of
11 an
alys
es)
Lockport Do
lomi
te
Sand
usky
/Ma
rtin
Ma
riet
ta,
Wood
vill
e (average of
11
analyses)
Lucas/Maumee Stone
(average of
4 analyses)
Sand
usky
/Oh
io Li
me
Ottawa/U.S.
Gyps
um
Sand
usky
/Woodville
Lime Pr
oduc
ts
Wood
/Pel
t on
Wood
/She
rman
Wood/Owens Pi
t
Wood/Wood St
one,
Bo
wlin
g Gr.
Wood/Wood St
one,
Bo
wlin
g Gr
.
Wood
/Luc
key
Weig
ht pe
rcen
t Reference
CaC03
MgC03
Si02
F&
2°3
Mn°
K2°
Na2°
Turn
er,
1977
54
.37*
44.67*
Turn
er,
1977
55.0
9*
44.15*
(Guelph)
Turn
er,
1977
54.7
1*
44.46*
(Guelph)
Stith, 19
83
54.5
44
.6
0.38
0.060
0.006
0.031
0.030
Stou
t, 19
41
52.42
44.1
7 .1
4 .02
.03
.02
<.01
Stou
t, 19
41
53.72
45.3
8 .10
.02
.025
<.01
<-
01
Stou
t, 19
41
53.7
6 45.42
.14
.12
.02
<.01
<.01
Stou
t, 19
41
53.6
7 45
.28
.19
.20
.02
<.01
<.
01
Stou
t, 1941
53.7
0 45
.34
.20
.10
.02
<.01
<.
01
Stou
t, 19
41
53.7
9 44.96
.20
.14
.025
<.01
<.01
Stou
t, 19
41
53.85
44.8
2 .30
.12
.025
<-01
<.01
Stou
t, 19
41
54.0
4 45
.65
.17
.02
.015
<.01
<.01
SrO
A120
3
" "
" "
0.00
6 0.
068
1.59
.04
.35
.02
<.01
.0
5
<.01
.14
<.01
.04
<.01
.14
<.01
.16
<.01
.0
2
S __ "
0.02
1
.50
.12
.01
.01
.01
.16
.22
<.01
*App
roxi
mate
d from m
ole
perc
enta
ges.
Tab
le
7.
Lo
ga
rith
ms
of
pCO
2 an
d sa
tura
tio
n i
ndic
es
for
sele
cte
d m
iner
al
phase
s in
w
ell
wate
rs at
Nor
thw
ood,
O
hio
[Pro
duci
ng
zone:
D
, dolo
mit
e;
T,
till
]
Wel
l
WO
-102
WO
-104
WO
-105
WO
-106
WO
-107
WO
-110
WO
-111
WO
-112
WO
-113
WO
-114
WO
-115
WO
-117
WO
-118
WO
-119
WO
-120
WO
-123
log
Kn
c
Perc
ent
Pro
- cati
on (
+)/
d
ue-
anio
n(-
) lo
g
ing
imbal
- pC
O2
zone
Dat
el
ance
(a
tm)
D 7
-10
D 7
-10
D 4
-04
D 4
-04
D 7-1
0
D 4
-04
D 7
-11
D 7-
11
T 4
-04
D 4
-04
D 7-0
9
DT
4-0
2
D 4
-02
DT
7-1
0
D 3-2
7
T 7
-11
>C
+1.1
-1.9
+1.7
+3.4
-1.7
-.9
+1.2
+ .7
+2.2
+3
.5
+ .3
+4.4
+ .0
-1.0
+3
.5
+5.4
-2.6
0
-2.7
7
-2.9
3
-3.9
9
-2.4
3
-2.2
5
-3.0
8
-1.2
2
-2.0
2
-2.8
5
-3.0
8
-2.4
2
-2.3
1
-2.1
6
-2.6
7
-2.5
8
5%lo
gK e
rro
r li
mit
(a
bso
lute
val
ue)
Cal-
cit
e
-0.1
2
-.08
+ .1
0
+ .9
9
+ .0
6
+ .7
6
+ .0
8
-.13
+ .2
3
+ .0
5
+ .2
5
-.09
-.15
+ .0
0
+ .0
1
+ .1
9
-8.4
1
.42
Do
lo
mit
e
-0.4
4
-.35
-.02
+1
.71
-.11
+1.1
7
-.06
-.51
-.05
-.12
+ .3
6
-.38
-.44
-.14
-.16
+ .2
5
-16.7
5
.84
Flu
o-
rite
+0
.09
+ .0
3
+ .0
9
-.03
+ .0
4
-.24
-.16
-.33
-1.4
8
+ .1
2
-.19
-.10
+ .0
7
-.04
+ .0
2
-.99
-11.1
3
.56
Cele
s-ti
te
-O.n
g
-.08
-.10
-.05
-.04
-.18
-.11
-.19
-1.4
8
-.03
-.11
-.03
+ .1
2
-.09
-.14
-.32
-6.6
0
.33
Str
on-
tianit
e
-0.3
3
-.34
-.04
-.87
-.12
+ .5
0
-.47
-.63
-1.9
4
-.11
+ .1
8
-.30
-.35
-.31
-.24
-.60
-9.2
9
.46
Gyp
sum
-0.9
9
-.95
-1.0
7
-1.0
4
-.98
-1.0
3
-.68
-.81
-.40
-.98
-1.1
9
-.94
-.79
-.90
-1.0
0
-.67
-4.6
2
.23
Anh
y
dri
te
-1.3
7
-1.3
2
-1.4
5
-1.4
3
-1.3
5
-1.4
2
'-1
.06
-1.1
9
-.8
5
-1.3
7
-1.5
1
-1.3
2
-1.1
8
-1.2
9
-1.3
9
-1.0
0
-4.2
3
.21
Qu
artz
+0
.37
+ .3
0
+ .3
1
+ .3
7
+ .3
9
+ .1
1
+ .4
1
+ .7
5
+ .5
3
+ .3
5
+ .2
9
+ .4
1
+ .3
7
+ .4
9
+ .3
2
+ .3
9
-4.2
3
.21
Ch
al
ced
on
y
-0.1
7
-.24
-.2
3
-.1
7
-.1
5
-.43
-.13
+ .2
1
-.0
3
-.19
-.23
-.13
-.1
7
-.0
5
-.2
2
-.32
-3.6
9
.18
Sil
ica
gla
ss,
amor
ph
ou
s
-0.6
8
-.7
5
-.7
4
-.6
8
-.66
-.9
4
-.64
-.3
0
-.5
5
-.70
-.74
-.65
-.6
8
-.56
-.73
-.65
-3.1
8 .16
Sil
ica
gel,
am
or
ph
ou
s
-0.9
6
-1.0
3
-1.0
2
-.96
-.9
4
-1.2
2
-.92
-.5
8
-.8
1
-.98
-1.0
4
-.92
-.96
-.84
-1.0
1
-.94
-2.9
0
.14
LMo
nth
-day
. A
ll d
ate
s are
fo
r 1
98
5.
Negative index values greater than the 5-percent error indicate conditions of undersatura- tion. Under these conditions, mineral phases should be dissolving. Positive index values greater than the 5-percent error indicate conditions of oversaturation. There is a thermo- dynamic tendency for mineral phases to precipitate from oversaturated waters. From these data, conclusions can be drawn about the controls on water chemistry operating in the native ground-water system. The conclusions are listed in table 8, and selected points are further addressed below.
The chemical characteristics of ground water in carbonate-rock aquifers often are controlled by chemical processes far more complicated than equilibrium mineral solubil ity. Back and others (1983) explain that as ground water flows in a carbonate-rock aquifer, the water initially dissolves calcite, dolomite, and gypsum or anhydrite at varying rates. Chemical equilibrium (saturation) is first established with calcite and dolomite. The chemistry of the ground-water system is altered by the continued dissolution of gypsum, which increases calcium and sulfate concentrations. Increased calcium and sulfate concentrations lead to the incongruent dissolution of more dolomite accompanied by the formation of calcite. Calcite precipitation removes calcium ion from the ground water and effectively keeps the water undersaturated with respect to gypsum. The net result of this process is to alter calcium:magnesium concentration ratios and increase the concentration of sulfate. A process of this type may well account for the elevated sulfate concentrations and distinct gypsum undersaturation found in waters of the dolomite aquifer near Northwood.
Ratios of chemical-constituent concentrations such as calcium:magnesium are helpful for indicating similar chemical processes and controls in waters taken from different wells. For this reason and because the carbonate rocks of the study area are not pure mineral phases, the molal ratios of calcium and magnesium were compared between well waters and those determined by chemical analyses of carbonate rocks from selected localities near the Northwood site (table 9). The calciumrmagnesium molal ratios appear in table 9, and show that the ratios in the carbonate rocks differ to a slight degree depend ing on sample location and formation. CarMg ratios in the Greenfield of Lucas County (Turner, 1977) range from 1.015 to 1.043, with an average of 1.025. In the Lockport Dolomite, for which a greater number of samples and sample localities are reported, the Ca:Mg ratio ranges from 0.998 to 1.052. The ground waters in the Northwood area show distinctly higher Ca:Mg molal ratios that range between 1.21 and 1.64 for wells in the dolomite aquifer thought to be unaffected by well grout.
The higher values of Ca:Mg in well waters relative to the rock analyses is likely a result of (1) preferential dissolution and precipitation of calcium carbonate and calcium sulfate mineral phases in the fractures and vugs within the aquifer, or (2) a lack of chemi cal data for carbonate rocks at the Northwood site, which may indicate higher Ca:Mg mole ratios do exist in the bulk carbonate rocks or in minerals found in vugs and fractures in the dolomite at Northwood. In either case, the carbonate well waters show consistent Ca:Mg ratios, which indicates similar chemical processes and conditions are operating to control native ground-water quality.
37
Table
8. Selected minerals and solubility control of selected constituent concentrations in well waters
at Northwood
f Ohio
Mine
ral
Chemical fo
rmul
aConclusions
abou
t solubility control
oo
Calcite
Dolo
mite
Fluorite
Celestite
Stro
ntia
nite
Gypsum
Anhydrite
Quar
tz
Chalcedony
Amorphous silica
glas
s
Sili
ca ge
l
CaMg
(C03
)2
CaF2
SrS04
CaS04
2H
20
CaSC>4
Si02
Si02
SiC>
2 (am)
Si02
(am)
All
wate
rs in
eq
uili
briu
m ex
cept
at
wells
106
and 11
0 (cement
grout
effects);
calcite
cons
ider
ed as
control
for
calcium c
once
ntra
tion
s.
All
wate
rs in
eq
uili
briu
m ex
cept
those
with
gr
out
effe
cts.
Do
lomi
te
cons
ider
ed a
co
ntro
l on magnesium co
ncen
trat
ions
.
Fluo
rite
is in
eq
uili
briu
m and
is the
controlling
phase
for
fluoride
concentration, ex
cept
in
waters from til
l wells
113
and
123,
wh
ich
are
unde
rsat
urat
ed.
All
wate
rs in eq
uili
briu
m ex
cept
at we
ll 113; celestite
is a
like
ly
control
for
strontium and
a source of
su
lfat
e ion.
All
wate
rs in
equilbrium exc
ept
till
water
and
grout-affected
well
wa
ter.
If th
e mi
nera
l is
present, po
ssib
ly co
ntri
bute
s to
the
cont
rol
of strontium
concentration.
All
wells
extr
emel
y undersaturated.
Gypsum is so
urce
for
(but
no
t a di
rect
solubility control
of)
calcium o
r sulfate.
Same
as
gypsum abo
ve,
if present.
All
over
satu
rate
d.
Quar
tz un
like
ly,
but
possible,
solubility
cont
rol
for
silica.
All
in eq
uili
briu
m ex
cept
at wells
104,
10
5, 10
7, 11
4, 115, and 12
0,
where
slight undersaturation
exis
ts.
Like
ly control
for
sili
ca
conc
entr
atio
ns.
All
well
wa
ter
undersaturated;
not
considered solubility control
for
sili
ca,
presence is
unlikely.
Extreme
unde
rsat
urat
ion,
si
lica
co
ntro
l un
like
ly.
Table 9. Calcium:magnesium mole ratios in selected carbonate rocks in northwestern Ohio and in ground waters at Northwood, Ohio
Ratios in water are from analyses from analyses in table 6.
2Grout contamination likely.
used for table 7; in rock are
39
Although only two wells were sampled, the Ca:Mg molal ratio showed a much higher value in 123 than in 113, which compared favorably with water from the dolomite aquifer. The Ca:Mg ratio in till wells is 1.44 and 2.39 for 123 and 113, respectively.
The till waters have sulfate concentrations nearly double those in the dolomite aquifer waters, and an explanation for this is not readily forthcoming. X-ray-diffraction analyses did not indicate gypsum or other sulfur-bearing phases to be present in the tills at an abundance greater than 5 percent by weight.
Plausible sources of the sulfate are: (1) gypsiferous material in the till matrix; (2) pyrite or other sulfide minerals; (3) hydrogen sulfide gas, which has been oxidized by waters recharging the till; and (or) (4) sulfate retained by anion exclusion processes within the till matrix.
Water Quality and Landfill Leachate
Two samples of leachate were obtained from each of the methane-venting wells, 152 and 154. These wells are finished in the waste material in order to prevent buildup and migration of methane gas. They also provide access to the leachate being produced by the waste material. Both leachates are highly mineralized (table 2), with concentrations of total dissolved solids (TDS, residue at 180 °C) of 3,170 mg/L for 152 and 26,300 mg/L for 154. Although most chemical constituents are typically elevated in a solid- waste leachate, data indicate that boron, iron, ammonia, and total dissolved solids are the most reliable indicators of ground-water pollution by landfill leachate (Clark and Piskin, 1977). Total hardness also is a reliable indicator in this instance because of high concen trations (2,500 mg/L and 12,000 mg/L) in the leachates as compared with native ground water.
The highest concentrations of boron in the study area (fig. 12) are seen in the leachate and in water from wells 107,115, 111, and 112. All of these wells are located immediately downgradient from the landfill. The concentrations of boron range from 650 to 830 jig/L in these wells, compared with a median value of 415 |ig/L for all wells in the dolomite aquifer in the study area.
Boron is a reliable indicator of ground-water contamination by leachate, perhaps because of its conservative nature. The more important dissolved-boron species are anionic or uncharged; therefore, they are not extensively adsorbed on other mineral surfaces (Hem, 1985). Sources of boron in refuse are the common cleaning agent borax and borosilicate glass.
Levels of iron in well 107 appear elevated compared to nearby wells 104 and 108. Concentrations of dissolved iron in well 112 (1,500 to 2,400 |ig/L) are highly elevated in
40
Ba
se
fro
m
U.S
. G
eolo
gic
al
Su
rve
yR
oss
ford
Q
ua
dra
ng
le
1.2
4,0
00
, 1
98
0an
d W
alb
ndge
Quadra
ngle
1
,24
.00
0,
19
80
EX
PL
AN
AT
ION
O
Ob
se
rva
tio
n w
ell,
boro
n c
on
ce
ntr
ati
on
in
ug
/L.
11
0
®
Su
rface w
ate
r sit
e,
boro
n c
on
ce
ntr
ati
on
in
u
g/L
.1
,90
0
A
Me
tha
ne
ve
nti
ng
w
ell
, bo
ron
co
ncen
trati
on
in
u
g/L
.
La
nd
fill
b
ou
nd
ary
Figu
re 1
2. D
istr
ibu
tio
n o
f bo
ron
in g
roun
d w
ater
, su
rfac
e w
ater
, an
d le
ac
ha
te i
n th
e st
ud
y a
rea
.
comparison to other carbonate wells (median concentration, 74 mg/L). The high iron concentration, coupled with near neutral pH, and sufficient carbon dioxide, may encour age the growth of iron-oxidizing bacteria, which may cause the precipitation of iron in 112. Iron bacteria are ubiquitous in the environment, but evidence of their metabolic activities is not normally encountered unless the proper conditions for their growth are present. Rust-red-colored precipitates (ferric hydroxide3) were present on the inner walls of the PVC well casing of 112. Evidence for existence of the precipitate was its presence on the cables of water-level measuring devices used on well 112.
The highest levels of ammonia found are as ammonium ion (NH4+) in the dolomite aquifer downgradient of the landfill. Ammonium ion is a useful indicator of leachate because large amounts of ammonia (NHy are produced from the microbial degradation of organic compounds in landfill refuse. The concentration of ammonium ion (NH4+) in the leachate ranges from 43 to 930 mg/L as NH4. Ammonium ion has a median concentra tion of 0.52 mg/L in the dolomite aquifer and is found in all wells in the dolomite aquifer. Concentrations in downgradient wells 107 and 112 are slightly elevated and range from 0.52 to 0.81 mg/L as NH4.
The relative age of a leachate may be inferred by its organic N and NH4 load. In this case, well 152 is more mature because of the lower organic N and NH4 load. Also, 152 is located in the oldest solid-waste cell in the landfill, and microbial degradation and subse quent migration of leachate has been occurring longer, which has resulted in decreased values of nitrogen compounds. On the other hand, 154 is located in the most recent solid- waste cell, therefore, it has the highest organic N and NH4 load and is still actively undergoing decomposition. The temperature of the leachate is 5 °C higher for 154 in January 1985, perhaps indicating a higher rate of microbial activity.
All ground waters in the study area exceed the OEPA drinking-water standard (table 2) for TDS. The highest concentration of TDS in the dolomite aquifer is in wells 111 and 112 (fig. 13) located directly downgradient of the landfill. Concentrations also are somewhat elevated in well 107. The TDS in the leachate ranges from 3,170 to 26,300 mg/L. Leachates characteristically have high concentrations of TDS as compared with native ground water because of the degradation of refuse, which supplies a varied and concentrated source of chemical constituents. As the concentration of dissolved components in leachate increases (TDS), the density of that leachate becomes greater than that of the native ground water. The increased density of the leachate compared with native ground water (as measured by TDS) initiates movement of the leachate downgradient. It is not necessary to have a hydraulic-head difference (the ground-water mound) for movement of the leachate away from the landfill to occur.
3Not confirmed by X-ray diffraction analysis.
42
U)
Ba
se
fro
m
U.S
. G
eolo
gic
al
Surv
ey
jR
oss
ford
Q
uadra
ngle
1
:24
,00
0,
19
80
and
Walb
ndge
Quadra
ngle
1
,24
,00
0,
19
80
EX
PL
AN
AT
ION
O 8
67
Ob
serv
ati
on
wel
l, n
um
ber
of
anal
yses
ove
r m
ean
co
nce
ntr
atio
n o
f to
tal
dis
solv
ed s
olid
s, r
esid
ue
at
180°
Cel
siu
s.
V3170
Me
tha
ne
-ve
nti
ng
wel
l
-----
Lan
dfi
ll b
ou
nd
ary
Fig
ure
13. D
istr
ibut
ion
of
tota
l d
isso
lved
so
lids
in g
roun
d w
ate
r an
d l
each
ate
in t
he
stu
dy
area
.
The significance of increased hardness may result from the displacement of calcium and magnesium from cation-exchange positions on clays exposed to landfill leachate (Griffen and others, 1976). Concentration of hardness ranges from 2,500 to 12,000 mg/L in the leachates, compared with a median value of 440 for wells in the dolomite aquifer. Consistently higher values of hardness (580 to 730 mg/L) are seen in well 112, and slightly elevated values of hardness (580 mg/L) are present in well 111, and, in one analysis, 550 mg/L for well 107.
In summary, water from wells 107, 111, 112, and 115 contains elevated concentra tions of certain constituents that suggest mixing of leachate with native ground water. The data, although suggestive of leachate migration, are not conclusive because of the variability of ground-water quality in the study area. However, data on geology, ground- water flow, landfill construction, and surface-water flooding indicate sources and prob able routes of leachate migration. In an attempt to qualify and further explain water quality and hydrogeologic data, analyses of oxygen and hydrogen-stable isotope ratios of ground water were used.
Oxygen and Hydrogen Stable Isotopes
Water samples for analysis of oxygen and hydrogen stable isotopes were collected from 2 till wells, 12 dolomite-aquifer wells, and 1 surface-water site. In conjunction with the isotope samples, water also was analyzed for major, minor, and trace constituents and nutrients. Samples were collected after a period of intense precipitation in spring 1985, which caused surface-water flooding and ground-water-level increases of more than 8 ft in the vicinity of the landfill.
Isotopes are atoms of the same element whose nuclei contain the same number of protons but a different number of neutrons. The heavier isotopes are almost always less abundant, and the notation "R" refers to the ratio O-18:O-16 or to the ratio D:H where deuterium (D) is a heavier, less common isotope of hydrogen (H). Isotopic compositions are reported as parts per thousand (permil) differences of rare to common relative to a standard known as V-SMOW or Vienna-Standard Mean Ocean Water. This relative difference is called the delta value (5) and is defined for hydrogen and oxygen as:
V-SMOW is a water standard with an isotopic composition close to the average ocean water; therefore, it is used in hydrologic investigations. Stable isotopes of O and H are considered to be ideal water-source indicators or chemical tracers because concentra tions neither decay with time nor are the isotopes known to be removed from water by exchange processes during movement through most aquifer materials (Winograd and
44
Friedman, 1972). Silicate hydrolysis reactions, which are not a major control of water chemistry in carbonate terrains, may operate to increase the deuterium content and de crease the oxygen-18 content of water (International Atomic Energy Agency, 1983).
8 D and 8 O-18 can be positive, negative, or zero. A positive value indicates enrich ment of a sample in oxygen 18 and deuterium relative to V-SMOW; conversely, negative values of 8 O-18 and 8 D indicate depletion of oxygen 18 and deuterium isotopes relative to V-SMOW. Values of 8 O-18 and 8 D in the study area are negative and appear in table 2 for well water and in table 10 (at back of report) for surface water from Otter Creek.
The precision of the isotope analyses for this investigation is ±0.1 perrnil for 8 O-18 and ±1.5 perrnil for 8 D. These values represent the 95-percent confidence interval. Values of 8 O-18 range from -7.20 perrnil to -12.2 perrnil, whereas values for 8 D range from -40.0 permil to -84.5 permil.
Figure 14 provides a preliminary indication of the area! variability in isotopic con tent of ground water and of the potential for multiple sources of ground water in the study area. Waters with three distinctly different isotopic signatures are present in wells up- gradient of the landfill. Waters from wells 117 and 119 have a heavier signature than waters from wells 118 and 105, which are significantly lighter. Water from well 120, also upgradient of the landfill, has an isotopic composition that is intermediate to the other two groups of upgradient wells.
The isotopic composition of ground waters within and near the landfill perimeter are even more variable. However, the waters from the glacial tills (wells 113 and 123) have similar compositions that are only slightly lighter than a surface water from Otter Creek. The waters from the tills are notably heavier than any upgradient water in the dolomite aquifer.
Oxygen and hydrogen isotope data for all waters sampled, including leachates, are plotted on a stable-isotope plot for water in figure 15. The values of 8 D and 8 O-18 for all waters except leachates plot in a linear trend. A least-squares regression line was fit through data collected from wells in the dolomite aquifer, glacial tills, and surface water. Selected wells in the dolomite aquifer were excluded from the regression on the basis of previous water-quality data indicating probable leachate effects and cement-grout effects. Because the isotope data may indicate differences between ambient and affected water chemistry, wells 107, 111, 115, and 112 were not included in the regression equation because of prior evidence of leachate. The leachates also were excluded from the regres sion. Waters from wells 106 and 110 also were excluded because of prior evidence of cement-grout contamination. The resulting regression equation, 8 D = 7.8 (8 O-18) + 10.5, describes a local water line and is similar to Craig's (1961) global meteoric water line of 8 D = 8 (8 O-18) + 10. This similar linear relation indicates that ground water in the study area can be considered to represent atmospheric precipitation or surface water that has not been isotopically altered as it has entered the ground-water system.
45
41"
:vf'-
Base
fr
om
U.S
. G
eolo
gic
al
Su
rve
yR
oss
ford
Q
ua
dra
ng
le
1-2
4,0
00,
19
80
and
Wa
lbn
dg
e
Quadra
ngle
1
24
,00
0,
19
80
EX
PL
AN
AT
ION
O
^5
Ob
se
rva
tio
n w
ell,
up
per
n
um
ber
is
6 D
, in
p
erm
it.
f.
oto
we
r n
um
ber
is
5 O
-18,
in
per
mit
;
^f~
2 S
urf
ac
e w
ate
r s
ite
, u
pp
er n
um
ber
is
6 D
, in
per
mit
;lo
wer
nu
mb
er i
s 5
O-1
8,
in p
erm
it;
,T^5
~ M
eth
ane
ven
tin
g w
ell,
up
per
nu
mb
er i
s a
ve
rag
e o
f re
su
lts
of
two
an
alys
es o
f 5
D,
in p
erm
it;
low
er n
um
ber
is
av
era
ge
of
resu
lts
of
two
an
aly
se
s o
f 5
O-1
8,
in p
erm
it.
Figu
re 1
4.
Hyd
roge
n an
d ox
ygen
iso
tope
com
posi
tion
of g
roun
d w
ater
, sur
face
wat
er, a
nd l
each
ate
in th
e st
udy
area
.
-35
.0
HE
AV
Y
-40
.0
-45.0
-50.0
d -
55.0
2 GC LU °" -
60
.0
O to -
65.0
-70
.0
-75
.0
-80.0
LIG
HT
-85
.0
-13
,0
A
Avera
ge §
D fo
r 1
00
sam
ple
s
of
river
wa
ter
in O
hio
154-L
M4
A
O1
19
(9
-1-8
7)
Local
wate
r lin
e
5 D
= 7
,8 x§ 0
-18
41
0,5
'118 (9
-1-8
7)
O
We
lls i
n d
olo
mite
Wells
in g
lacia
l till
D
Ott
er
Cre
ek
A
Meth
ane-v
ent
we
lls
Oh
io rive
rs
.
*
Str
eam
s
an
d s
ha
llow
*
gro
und w
ate
r at
Wooste
r, O
hio
LIG
HT
-12
.0-1
1-0
-1
0.0
-9
.0
5 O
-18,
IN
PE
RM
IL
-8.0
-7.0
-6
.0H
EA
VY
Fig
ure
15. Local
wa
ter
line
a
nd
oxyg
en
an
d h
ydro
ge
n i
so
top
e c
onte
nt
of
lea
cha
te,
gro
un
d w
ate
r,
and s
urf
ace
wate
r in
the s
tud
y are
a.
In an attempt to better understand the time variations in isotopic content of ground water in the Northwood area, wells 118 and 119 were resampled for isotopic analysis on September 1,1987. These additional data are plotted in figure 15 with date identifiers. These data indicate that variations of 3 permil in 8 D and 0.5 permil in 8 O-18 might be expected due to analytical precision of isotope analyses and natural variability in waters from a single well.
The recent seasonal variation in the isotopic compositions for river waters in Ohio as determined on a preliminary basis during the 1984-87 water years (Carol Kendall, U.S. Geological Survey, oral commun., 1988) is shown by the stippled elliptical area at the heavy (upper right) part of the figure. These data plot along an "Ohio water line" that is dashed into the part of the plot with lighter isotopic compositions. The average 8 D for 100 samples of river water in Ohio is -44 permil. Additional data for seasonal variations in isotopic composition of ground water and surface water from a stream-aquifer system near Wooster in northeastern Ohio (J. E. Dysart, U.S. Geological Survey, oral commun., 1986) also are shown by a dotted ellipse to further illustrate the seasonal variability in recent meteoric water in Ohio. The waters from the till wells (113,123) and Otter Creek have compositions consistent with a recent meteoric water source. Few waters from the dolomite aquifer (wells 111,117,119) approach the isotopic composition of recent meteoric waters.
The isotopic data provide information on generation of leachate in the landfill, which produces waters of anomalous isotopic content. Leachate samples for isotopic analysis were collected from two methane-venting wells, 152 and 154. Both leachates are charac terized by elevated concentrations of many common and trace constituents as compared with other wells sampled. Well 154 yields the more concentrated leachate of the two, with a mean specific conductance of 27,900 }J,S/cm. Leachate from well 152 has a mean specific conductance of 5,400 }j,S/cm.
Baedecker and Fisher (1977), Baedecker (1979), and Baedecker and Back (1979) studied the chemical and isotopic signatures of landfill leachate and waters affected by leachate. These studies showed that one result of the chemical reactions that produce leachate is an isotopic shift to values 0 to 10 permil heavier and 10 permil heavier for 8 O-18 and 8 D, respectively, in leachate relative to native ground waters. All leachate samples are heavier in deuterium and oxygen-18 than native ground water from the dolomite aquifer.
Each of the leachate wells was sampled twice, so the data (table 2) also provide some information on time variations in isotopic content. The leachate wells were first sampled in January 1985, then resampled in April 1985 after a period of intense precipi tation. Both wells indicate a depletion of deuterium and oxygen-18 in recharge water between January and April 1985. The lightest compositions of river water in Ohio often occur in March or April due to light precipitation (Carol Kendall, U.S. Geological Sur vey, oral commun., 1988). Lighter recharge water may explain the lighter leachate composition in April as compared with January.
48
The most noticeable difference isotopically between leachate and ground water is the shift of the leachate composition to the left of the local water line. In comparing the two leachates, it appears that the more concentrated the leachate is, the greater the shift to the left of the local water line. The shift indicated on figure 16 may be a composite of two separate shifts, a 8 D shift off the water line to heavier values and also a 8 O-18 shift to lighter values. The shift to heavier 8 D has been noted by Baedecker and coworkers and is considered to be characteristic of landfill leachate. A shift to lighter 8 O-18, if present, is possibly related to interactions between refuse and water, but these effects are not well documented in the scientific literature pertaining to landfills.
Figure 16 shows two isotopically distinct bodies of ground water along the local water line:
1. A reservoir of water in the dolomite aquifer, which is presumed to be relatively old, is removed from direct contact with recent precipitation, and is characterized by light isotopic content of oxygen and hydrogen.
2. A reservoir of ground water in the glacial tills which has been recharged relatively recently by precipitation and is characterized by a heavy isotopic signature for oxygen and hydrogen.
The concept of a leaky till reservoir of isotopically heavy water in the tills hydrauli- cally above the dolomite aquifer may help explain some of the variability in isotopic content observed for waters in wells completed in the dolomite aquifer. A simple mixing of till waters with lighter waters from the dolomite aquifer would produce intermediate waters with compositions along the local water line. By applying this mixing concept, the group of waters from the dolomite aquifer that have the highest proportion of till water are from wells 119, 111, 117, 115,112, and 107.
Wells 117 and 119, although upgradient of the landfill, show a large component of till water. The isotopic data support earlier conclusions regarding the construction of these wells. It appears that wells 117 and 119 both have fairly good access to the lower till-bedrock contact, which previous reports indicate may be a source of small domestic supplies. As a consequence of this mixing, the chemistry of wells 117 and 119 is not truly representative of the dolomite aquifer or the till, and shows characteristics of both.
Other wells in the dolomite aquifer having large proportions of till water are 107, 111, 112, and 115. These wells are directly downgradient of the northernmost landfill cells. Geologic and water-level data presented earlier suggest that these wells have the greatest potential for showing the effects of increased recharge or leakage from the landfill. Water-quality data from these wells showed elevated levels of constituents that are indicators of leachate-affected ground waters. The relatively heavy isotopic signature
49
-35
.0
HE
AV
Y
-40
.0
-45.0
-50
.0
-I
-55
.0
I
DC
UJ * -6
0.0
z a" to ~
65.0
-70
.0
-75
.0
-80.0
LIG
HT
-85
.0J
-13.0
Wat
ers
rep
rese
nti
ng
g
laci
al t
ill
Q119 (9
-1-8
7)
11
4Wate
rs r
epre
sentin
g
dolo
mite
aquifer
Wate
rs r
epre
sentin
g m
ixtu
res
of
wate
r fr
om
gla
cia
l till
and
dolo
mite
aquife
r
O W
ells
in
do
lom
ite
W
ells
in
gla
cia
l till
D O
tter
Cre
ek
A M
eth
ane-v
ent
wells
-12.0
LIG
HT
-11
.0-8
.0-7
.0
-6.0
H
EA
VY
-10
.0
-9.0
5 O
-18,
IN P
ER
MIL
Fig
ure
1
6.
Th
e c
on
cep
t o
f en
d-m
emb
er r
eser
voir
s an
d m
ixin
g l
ine
as s
how
n b
y th
e re
lati
on
b
etw
een
oxy
gen
an
d h
ydro
gen
iso
top
e ra
tio
s
in water from these wells supports the idea that the dolomite aquifer receives more recharge from overlying strata in the vicinity of the landfill than in other parts of the study area.
The local water line provides a snapshot of isotopic compositions in the ground- water systems of the study area and represents waters unaffected by leachate. Well 115 shows a shift off the line (fig. 15) in the direction of the leachates. Two interpretations are possible based on existing data: (1) the shift is characteristic scatter (3-permil range for 6 D, 0.5-permil range for 6 O-18) from natural variability in 6 D and 6 O-18, or (2) the shift is preliminary evidence of a hydrologic process involving mixing of landfill leachate with ground water beneath the landfill. In the second case, the process would involve three-component mixing of till water, ground water from the dolomite aquifer, and landfill leachate. The isotopic ratios are not shifted to the left of the local water line a significant amount in three of the four wells having other chemical irregularities that indicate leachate is present. The shift to heavier values of 6 D (deuterium enrichment) is considered a preliminary indicator of the presence of landfill leachate in well 115, but more detailed study of seasonal variations in isotopic composition is required to resolve this question of leachate in the dolomite aquifer.
Of the constituents mentioned previously as leachate indicators, boron, because of its conservative chemical characteristics, is a particularly reliable indicator of leachate- affected ground water. Ground waters in four wells (107, 111, 112, and 115) in the dolomite aquifer all have boron concentrations above the level of 415 |ig/L, which is considered the background level of this study. Water from well 115 also plots to the left of the local isotopic mixing line. These observations are consistent in suggesting a leachate component exists in the dolomite aquifer.
Isotopic and chemical-quality data indicate that the water quality of the till is dis tinctly different from that of the dolomite aquifer. In addition, water-quality data indicate major chemical differences between well 113, which is finished in the upper/lower till, and well 123, which is finished in the lower till. Because of these differences, plus the limited amount of water-quality information available on the till, it is not possible to determine if water quality in the till has been affected by the landfill. However, the prox imity of the landfill base to the fractures and sand zones near the upper till/lower till contact may allow preferential downward flow to the dolomite aquifer as opposed to lateral flow into the tills.
Surface Water
Samples were collected from three stream sites (fig. 17) during April 1984 and July 1985. Dry Creek at East Broadway just south of Walbridge Road was selected as a control site away from the influence of the landfill. Two sites were chosen on Otter Creek, at Whitmore Yard upstream of the landfill and at Wales Road downstream of the landfill. Results of water-quality analyses are presented in table 10 (at back of report).
51
83°,
30
'
to
lA)C
AS
__C
OU
NT
'. ,_
\Spb
o "
CO
'UN
TYT"
Ba
se
fro
m
U.S
. G
eolo
gic
al
Su
rve
y |
Ro
ssfo
rd
Qu
ad
ran
gle
1:2
4,0
00,
19
80
and
Walb
ridge
Quadra
ngle
1
:24
,00
0,
19
80
EX
PL
AN
AT
ION
A
®
Ott
er
Cre
ek tr
ibu
tary
at
Wale
s R
oad
®
Ott
er
Cre
ek tr
ibu
tary
at
Whitm
ore
Y
ard
@c
Dry
C
reek
at
East
Bro
adw
ay
=.
La
nd
fill
boundary
Fig
ure
1
7.
Site
s at
wh
ich
str
ea
m w
ate
r-qualit
y an
d se
dim
en
t sa
mp
les
we
re c
olle
cte
d.
Dry Creek is a perennial stream with a streambed composed of gravel, cobbles, and clay. Otter Creek, in this part of its reach, is an intermittent stream and has no flow during periods of sustained dry weather. The composition of the streambeds at both sites on Otter Creek is primarily clay. Observations made while sampling show both Dry Creek and Otter Creek at Whitmore Yard support aquatic plants and animals; no such aquatic life was observed at the Wales Road site.
During April 1984, when flow at all sites was estimated at 1.0 ft3/s (cubic feet per second) or less, water quality in Dry Creek and Otter Creek at Whitmore Yard was com parable. Concentrations of most constituents were slightly higher at the Whitmore Yard site, except for nitrogen, sodium, and chloride, which were elevated in Dry Creek. Otter Creek at Wales Road, downgradient of the landfill, had consistently higher values of most constituents.
Streambed sediments were sampled and analyzed for trace metals and organic compounds. Sediment from the Wales Road site contained the highest concentrations of arsenic and chromium, whereas sediment in Dry Creek contained the highest amount of mercury. All toxic metals detected were at trace levels, that is, less than 10 (ig/g (micro- grams per gram of bed material).
Organic compounds detected in sediment from the Whitmore Yard site on Otter Creek were: benzo-b-fluoranthene, 180 (ig/kg (micrograms per kilogram of bed mate rial); benzo-a-anthracene, 170 fig/kg; fluoranthene, 68 fig/kg; and pyrene, 90 |J.g/kg. Fluoranthene (100 M-g/kg) and pyrene (70 M-g/^g), as well as phenanthrene (110 M-g/kgX were detected in sediments at the Otter Creek site at Wales Road. None of these com pounds were detected in sediments from Dry Creek. These compounds are polynuclear aromatic hydrocarbons (PAHs), which are ubiquitous in the environment and result from the burning of fossil-based fuels.
Phenol ranging in concentrations from 1 to 7 (ig/L was present in the streams. It is possible that the presence of phenol and PAHs is related to the railway transportation facilities, which since have been removed.
Chemical-quality analyses from the streams during low-flow conditions in July 1985 show that water from Dry Creek contained higher levels of most constituents than did water from the Otter Creek sites. As in the 1984 analyses, Otter Creek at Wales Road showed higher levels of most constituents than did the Whitmore Yard site. Although concentrations of individual constituents increased during low flow in Dry Creek, most constituents at both Otter Creek sites decreased. This suggests that water quality in Otter Creek is more influenced by runoff than by interactions of stream water with streambed materials or ground water.
To determine if compounds in water that runs off the landfill surface were entering Otter Creek, a series of water-quality samples were collected at the Wales Road site
53
during a storm on March 28,1985. In addition to the landfill, which is the closest drain age area that could contribute to runoff, a waste-hauling business is located just northwest of well 107 and also may affect stream quality. Heavy overland flow was observed entering Otter Creek during the storm, and the stage increased rapidly during the first hour (fig. 18). Values of specific conductance increased from 480 to 520 |iS/cm during the first 40 minutes, reached a peak of 555 |iS/cm 160 minutes after the storm began, and then declined.
Most chemical constituents reached their peak concentration 40 minutes after the storm, then declined as the stage in the stream rose further. The first sample was ob tained after the stream had risen 0.6 ft in approximately 15 minutes; therefore, the con centrations are more indicative of an initial "flush" than of ambient conditions. After an initial "flush" of constituents into a stream, the water chemistry typically becomes more dilute because relatively unmineralized precipitation enters the channel directly and as runoff from adjacent areas. An increase after the initial flush and subsequent dilution may indicate a second source. The change of sodium and chloride concentrations seems to support this conclusion. Because of road salting in winter periods, levels of sodium and chloride generally are higher in streams. The probable reaction to a runoff event would be an increase in these levels during the initial flushing and then a decrease as dilution occurs. Sodium, chloride, silica, and fluoride concentrations indicate this effect and show a further increase, perhaps indicating an additional source.
Constituent concentration on March 28,1985 Sample 1 Sample 2 Sample 3
Specific conductance (|j.S/cm)Calcium (mg/L)Magnesium (mg/L)Sulfate (mg/L)
Iron (m/L)Alkalinity (mg/L as CaCO^Hardness (mg/L as CaCO3)Potassium (mg/L)
3334
8.8.3
4804615
120
1377
1802.7
1526
2.5.2
5205317
130
1581
2003.2
20382.8
.4
5505215
120
1480
1903.3
Calcium, magnesium, sulfate, iron, alkalinity, and hardness remained relatively stable during the event. The only constituent that steadily increased during the storm was potassium, which increased from 2.7 to 3.3 mg/L. Potassium is normally a very conser vative constituent and is not subject to great variation. The increasing concentrations are likely due to leaching of potassium from dead vegetation adjacent to the stream channel.
54
UJ
O CO
o
o 00 o
o
o 0> o
o
o
oo
o
o
o CM
TIM
E (
HO
UR
)
Fig
ure
1
8.
Sta
ge
flu
ctua
tion
and
time
of w
ate
r-q
ua
lity
sam
plin
g fo
r O
tte
r C
reek
trib
uta
ry
at W
ales
Roa
d, M
arch
28,
198
5.
Potassium ions assimilated by plants become available for resolution when the plants mature and die (Hem, 1985). As part of the natural cycle, potassium is leached into the soil by rains during the dormant season, and some contribution to runoff would be ex pected.
The contribution of dissolved solids to Otter Creek during extreme runoff conditions is not very large, although results are not conclusive because of the limitations of one set of storm samples. In terms of concentration, the largest increase was 10 mg/L for sulfate. From the minimal increases seen in constituents during the storm, it does not appear that there is a significant decline in water quality of Otter Creek at high flow from sources upstream from Wales Road.
SUMMARY AND CONCLUSIONS
Hydrogeology and water quality near a landfill in northwestern Ohio were evaluated. The landfill, located near Northwood, Ohio, in Wood County, is used for disposal of solid and hazardous waste. Land use in the area is a mixture of heavy industry, transportation, housing, and agriculture.
A thick sequence of clays and tills of Wisconsinan age covers dolomites of Silurian age throughout the entire study area. The landfill cells are excavated into the upper till and extend to within 10 ft of the upper-till/lower-till contact, which is characterized by sand and gravel zones, mottling, and increased water content. Saturated seams of sand and gravel are found throughout both tills but are more prevalent in the lower till. There are no data to suggest the zones of sand or gravel are continuous; however, their preva lence and relatively higher permeability than the surrounding clay till may allow the zones to act as pathways for recharge to the underlying dolomite aquifer.
The primary aquifers are the Greenfield Dolomite and underlying Lockport Dolo mite of Silurian age, which produce water by means of secondary openings such as fractures, solution channels, and voids. The dolomite aquifer is separated from the overlying tills by a thin veneer of glacial outwash, which locally produces small amounts of water.
Water-level measurements in wells completed in the northernmost landfill cells indicate that the refuse is saturated to near land surface. Water-level data indicate that parts of both the upper and lower tills are saturated. Vertical head relations between the landfill, upper till, lower till, and carbonate aquifer indicate that water is flowing down ward from the landfill to the dolomite aquifer.
Potentiometric maps of the dolomite aquifer show a ground-water mound centered under the landfill and elongated in the direction of regional ground-water flow. Ground-
56
water levels adjacent to the landfill near the center of the mound fluctuate as much as 14 ft per year, in contrast to fluctuations of less than 3 ft per year in upgradient wells. These factors may indicate that the landfill is a source of recharge to the underlying dolo mite aquifer.
The chemical composition of ground water differs considerably throughout the study area. Native ground water is very hard, with a median pH of 7.55. The water type ranges from calcium-magnesium sulfate to calcium-magnesium-sodium sulfate. The composi tion of native ground water in the dolomite aquifer is controlled by chemical interaction between ground water and minerals occurring naturally in the aquifer. The effects of cement/grout contamination produced a distinctive water chemistry in selected monitor ing wells characterized most notably by pH values of 8.9 or greater.
The chemistry of waters from wells completed in the calcareous glacial till was consistent with carbonate-mineral saturation. However, low levels of fluoride and stron tium in till waters create conditions of undersaturation for fluorite, celestite, and stron- tianite that differ markedly from dolomite waters. Sulfate concentrations in till waters are nearly double the concentrations in water from the dolomite aquifer. Two possible sources for the elevated concentrations of sulfate in till waters are: (1) dissolution of gypsum in the till, and (2) oxidation of sulfide minerals or hydrogen sulfide gas by oxygen dissolved in water recharging the till.
All ground waters in the study area exceed the OEPA drinking-water standards for total dissolved solids. Elevated concentrations of boron, iron, ammonia, total dissolved solids, and hardness were detected in leachate and in several wells downgradient of the landfill. These constituents are considered to be the most reliable indicators of ground- water contamination by landfill leachate. Downgradient wells 107, 111, 112, and 115 contained concentrations of boron ranging from 650 to 830 mg/L, as compared with a median concentration of 415 |ig/L for all wells in the dolomite aquifer. Wells 107 and 111 exceed the OEPA water-quality standard for phenolic compounds. Well 112 exceeds OEPA standards for iron and manganese.
Analysis of stable-isotope data shows that waters from wells 107, 111, 112, and 115 have heavy isotopic signatures of hydrogen and oxygen. This indicates that they have recently received recharge from overlying strata. Wells completed in the dolomite aquifer directly downgradient of the landfill show the highest proportion of water from the till.
Infiltration of water into the landfill and subsequent chemical reactions in the refuse produces a leachate having an anomalous isotopic content. Well 115 shows a shift off the local mixing line in the direction of the leachate composition. The shift to heavier values of 8 D may be an indication of the presence of leachate in this well.
57
A comparison of observations and stream-water quality at three sites indicates the absence of aquatic life in Otter Creek near Wales Road and increased levels of most constituents downstream from the landfill. The concentration of arsenic, chromium, iron, and manganese in streambed sediments also is higher downstream from the landfill. Analysis of water-quality samples taken during a period of high overland runoff suggests that surface runoff from the landfill does not significantly affect instream water quality.
Analysis of hydrogeologic, isotopic, and chemical-quality data suggests that the landfill is affecting ground-water flow and quality in the dolomite aquifer. Water-quality changes downgradient from the landfill are limited to increased levels of common ions, trace metals, and selected organic compounds. Additional or greater changes, if present, may not have been detected because of well placement or the nature of ground-water flow characteristics in the lower till and dolomite aquifer.
REFERENCES CITED
Back, William, Hanshaw, B.B., Plummer, L.N., Rahn, P.H., Rightmire, C.T., and Rubin, M., 1983, Process and rate of dedolomitization Mass transfer and C-14 dating in a regional carbonate aquifer: Geological Society of America Bulletin, v. 94, p. 1415- 1429.
Baedecker, M.J., 1979, Generation of gases and fractionation of stable isotopes inlandfills [abstract]: EOS Transactions of the American Geophysical Union, v. 60, no. 18, p. 258.
Baedecker, M.J., and Back, William, 1979, Hydrogeological processes and chemical reactions at a landfill: Groundwater, v. 17, no. 5, p. 429-437.
Baedecker, M.J., and Fisher, D.W., 1977, Decomposition of organic material in landfill leachate and its effect on the chemistry and isotopic composition of ground water [abstract]: Geological Society of America Abstracts with Programs, v. 9,
Barcelona, M.J., and Helfrich, J.A., 1986, Well construction and purging effects on ground-water samples: Environmental Science and Technology, v. 20, no. 11, p. 1179-1184.
Carlson, E.H., 1986, Localization of Sr-F-Zn-Pb mineralization in Lockport mound structures, northwestern Ohio: Kent, Ohio, Geological Society of America, North Central Section, Field Trip Guidebook, 25 p.
58
Clark, T.P., and Piskin, R., 1977, Chemical quality and indicator parameters for monitor ing landfill leachate in Illinois: Environmental Geology, v. 1, p. 329-339.
Craig, H., 1961, Standard for reporting concentrations of deuterium and oxygen-18 in natural water: Science, v. 133, p. 1833-1834.
Dames and Moore, 1983, RCRA Part B permit application for Evergreen Landfill, Ohio Waste Systems, Waste Management, Inc., North wood, Ohio.
1984, Drilling report and preliminary geologic interpretation LOF property investigation for Waste Management, Inc.: Job no. 07722-053-17.
Forsyth, J.L., 1960, Correlation of tills exposed in Toledo Edison dam cut, Ohio: Ohio Journal of Science, v. 60, no. 2, p. 94-100.
1968, A study of physical features for the Toledo regional area: Toledo RegionalArea Plan for Action, Regional Report 8.2, 111 p.
Freeze, R.A., and Cherry, J.A., 1979: Groundwater, Englewood Cliffs, New Jersey, Prentice-Hall, 604 p.
Glaze, M.V., 1972, A hydrogeologic study of northern Wood County: Toledo, Ohio, University of Toledo, unpublished master's thesis, 83 p.
Griffen, R.A., and others, 1976, Attenuation of pollutants in municipal landfill leachate by clay minerals; Part 1, column leaching and field verification: Illinois State Geological Survey Environmental Geology Note 78, 34 p.
Hem, J.D., 1985, Study and interpretation of the chemical characteristics of natural water: U.S. Geological Survey Water-Supply Paper 2254, 263 p.
International Atomic Energy Agency, 1983, Guidebook on nuclear techniques in hydrol ogy: Vienna, 439 p.
Janssens, Adriaan, 1977, Silurian rocks in the subsurface of northwest Ohio: Ohio Geological Survey Report of Investigations 100,96 p.
Jenne, E.A., Ball, J.W., Burchard, J.M., Vivit, D.V., and Barks, J.H., 1980, Geochemical modeling apparent solubility controls on Ba, Zn, Cd, Pb, and F in waters of the Missouri tri-state mining area, in Hemphill, D.D. (editor), Trace substances in envi ronmental health: XIV, University of Missouri, Columbia, Missouri, p. 353-361.
Kahle, C.F., 1978, Subaerial exposure of Silurian shelf margin reefs, northwestern Ohio: American Association of Petroleum Geologists Bulletin, v. 62, no. 3, p. 528.
59
Kahle, C.F., and Floyd, J.C., 1972, Geology of Silurian rocks, northwestern Ohio: Co lumbus, Ohio, Eastern section, American Association of Petroleum Geologists and Ohio Geological Society, Guidebook for first annual meeting, 91 p.
Mayer, F.L., Stalling, D.L., and Johnson, J.L., 1972, Phthalate esters as environmental contaminants: Nature, v. 238, p. 411-413
Mesolella, K.J., 1978, Paleogeography of some Silurian and Devonian reef trends, Cen tral Appalachian Basin: American Association of Petroleum Geologists Bulletin, v. 62, no. 9, p. 1607.
Mixon, P.O., Damle, A.S., Truesdale, R.S., Alien, C.C, 1987, Effect of capillarity and soil structure on flow in low permeability saturated soils at disposal facilities: USEPA, EPA/600/S2-87/029, Cincinnati, Ohio.
Morrison, R.B., 1935, The occurrence and origin of celestite and fluorite at Clay Center, Ohio: American Mineralogist, v. 20, p. 780-790.
National Oceanic and Atmospheric Administration, 1982, Monthly normals of tempera ture, precipitation, and heating and cooling degree days, 1951-80, Ohio: Asheville, NC, 17 p.
1985, Climatological data, Ohio: (published monthly), 24 p.
Nielsen, D.M., 1977, Environmental geology for land-use planning in Wood County, Ohio: Bowling Green, Ohio, Bowling Green State University, unpublished master's thesis, 96 p.
Norris, S.E., 1974, Regional flow system and ground-water quality in western Ohio: U.S. Geological Survey Journal of Research, v. 2, no. 5, p. 527-531.
Norris, S.E., and Fidler, R.E., 1969, Correlation of carbonate rock units in northwestOhio by natural gamma logging: U.S. Geological Survey Professional Paper 650-B, p.B158-B161.
197 la, Availability of ground water from limestone and dolomite aquifers in north west Ohio and its relation to geologic structure: U.S. Geological Survey Profes sional Paper 750-B, p. B229-B235.
1971b, Carbonate equilibria distribution and its relation to an area of high ground- water yield in northwest Ohio: U.S. Geological Survey Professional Paper 750-C, p. C202-C206.
60
Ohio Department of Natural Resources, Division of Water, 1970, Ground water for planning in northwest Ohio: Ohio Water Plan Inventory Report 22, 63 p.
Ohio Environmental Protection Agency, 1978, Rules and regulations, public watersystems, primary contaminant control, water quality standards: Chapter 3745.81 of the Ohio Administrative Code.
1980, Rules and regulations, public water systems: secondary contaminant control,water quality standards: Chapter 4745.82 of the Ohio Administrative Code.
Paulson, J.D., 1981, Ground-water resources of Wood County, Ohio: Toledo, Ohio, University of Toledo, unpublished master's thesis, 178 p.
Plummer, L.N., Jones, B.F., and Truesdell, A.H., 1976, WATEQF: A FORTRAN IV version of WATEQ, a computer program for calculating chemical equilibrium of natural waters: U.S. Geological Survey Water-Resources Investigations 76-13, 66 p.
Rowland, M.R., and Kunkle, G.R., 1970, Cones of influence developed in the Silurian- Devonian aquifer, Maumee River basin, Ohio: Ground Water, v. 18, no. 3, p. 37-44.
Shindel, H.L., and others, 1986, Water Resources Data Ohio, Water Year 1985: U.S. Geological Survey Water Data Report OH-85-2, v. 2, 281 p.
Stith, D.A., 1983, Physical properties of carbonate aggregate from Ohio: Ohio Geologi cal Survey Report of Investigations 121, 17 p.
Stout, Wilber, 1941, Dolomites and limestones of western Ohio: Ohio Geological Survey Bulletin 42, 468 p.
Toledo Metropolitan Area Council of Governments, 1982, Ground water baseline report: Toledo, OH, Contract report to the U.S. Environmental Protection Agency.
Turner, W.S., 1977, A geochemical study of some Silurian dolomites in northwestern Ohio: Toledo, Ohio, University of Toledo, unpublished master's thesis, 82 p.
U.S. Department of Agriculture, 1966, Soil survey of Wood County, Ohio: 96 p.
Walton, W.C., 1970, Groundwater resource evaluation: New York, McGraw-Hill, 664 p.
Weiner, W.F., and Koster Van Groos, A.F., 1976, Petrographic and geochemical study of the formation of chert around the Thornton reef complex, Illinois: Geological Society of America Bulletin, v. 87, p. 310-318.
61
White, G.W., 1961, Classification of glacial deposits in the Killbuck lobe northeast- central Ohio: U.S. Geological Survey Professional Paper 424-C, p. C71-C73.
Wmograd, I.J., and Friedman, L, 1972, Deuterium as a tracer of regional ground-water flow, southern Great Basin, Nevada and California. Geological Society of America Bulletin, v. 83, p. 3691-3708.
62
WATER-QUALITY DATA
63
Table 2. Water-quality analyses of ground water near Northwood, Ohio
[pS/cm, microsiemens per centimeter at 25 degrees Celsius; mg/L, milligrams per liter; pg/L, micro- grams per liter. A dash indicates "data not obtained" or "not applicable." ND indicates con stituent not detected. (T), till wells; (M), methane-venting wells.]
Local Date ofnumber sample
WO-101 04-10-84
WO-102 04-11-8407-10-85
WO-104 07-10-85
WO-105 04-04-85
WO-106 04-04-85
WO-107 04-05-8408-01-8404-03-8507-10-85
WO-108 08-01-84
WO-110 04-05-8408-02-8404-04-85
WO-111 04-03-8507-11-85
WO-112 04-05-8408-01-8404-03-8507-11-85
WO-113(T) 04-04-8507-11-85
WO-114 04-04-85
WO-115 04-04-8403-28-8507-09-85
WO-117 04-02-85
WO-118 04-11-8404-02-85
WO-119 04-10-8408-02-8404-02-8507-10-85
WO-120 03-27-85
WO-123(T) 04-04-8507-11-85
WO-152(M) 01-29-8504-03-85
WO-154 (M) 01-29-8504-03-85
Ohio EPA drinkingwater standards
Laboratorydetection limit
Specificconduc
tance(uS/cm)
1,010
984985
950
860
950
971912
1,1901,130
1,260
1,040667825
1,4001,500
1,5601,3601,3201,440
1,6201,800
925
979950940
975
1,5301,230
1,1001,0601,0501,080
975
1,8501,980
4,9505,850
28,00027,800
PH(standardunits)
7.4
7.47.6
7.7
7.9
8.9
7.87.47.57.6
7.4
11.59.49.1
7.97.9
6.76.66.86.8
7.37.1
7.8
7.77.98.1
7.5
7.07.4
7.07.07.47.4
7.7
7.77.7
6.86.7
5.85.8
7.0-10.5
Temperature,air,
(deg. C)
13.0
15.020.0
20.0
12.0
10.0
10.035.010.025.0
35.0
10.025.08.0
12.0
10.024.010.025.0
10.027.0
8.0
11.015.032.0
8.0
16.010.0
12.025.08.0
25.0
11.0
14.022.0
-4.015.0
-4.012.0
Temperature,water(deg. C)
11.0
11.512.5
12.5
11.5
11.0
11.012.512.012.0
12.0
11.012.010.5
11.011.5
11.011.511.011.5
6.516.5
11.0
11.012.016.0
11.0
11.011.0
11.012.011.013.0
11.0
15.0
12.019.0
17.018.0
Barometricpressure(mmofHg)
~
743
743
740
740
_ 735743
_
740
740749
735743
740743
740
745
745
745
745743
740
740
750735
750735
Oxygendemand,
Oxygen, chem-dis- ical
solved (high(mg/L) level)
(mg/L)
<0.1
<.l.7 12
<.l <10
2.8 10
2.4 14
1.71.21.2 341.5 11
3.9
1.92.43.6 14
<.l 102.2 15
<.l<.l<.l 18<.l 15
10.4 42.8 48
1.0 19
<.l<.l 17.6 <10
<.l <10
<.l<.l 14
<.l<.l.4 15.2 <10
.8 14
5489
__2.6 390
__.8 41,000
.1 10
Hardness(mg/Las
CaC03 )
410
400420
440
370
340
350310550430
440
260220330
580580
730580620700
1,1001,100
440
230270280
490
710620
560510610570
440
580600
2,500
12,000
~~
64
Table 2. Water-quality analyses of ground water near Northwood, Ohio-Continued
Local Date of number sample
WO-101 04-10-84
WO-102 04-11-8407-10-85
WO-104 07-10-85
WO-105 04-04-85
WO-106 04-04-85
WO-107 04-05-8408-01-8404-03-8507-10-85
WO-108 08-01-84
WO-110 04-05-8408-02-8404-04-85
WO-111 04-03-8507-11-85
WO-112 04-05-8408-01-8404-03-8507-11-85
WO-113 (T) 04-04-8507-11-85
WO-114 04-04-85
WO-115 04-04-8403-28-8507-09-85
WO-117 04-02-85
WO-118 04-11-8404-02-85
WO-119 04-10-8408-02-8404-02-8507-10-85
WO-120 03-27-85
WO-123 (T> 04-04-8507-11-85
WO-152(M) 01-29-8504-03-85
WO-154 (M) 01-29-8504-03-85
Ohio EPA drinkingwater standards
Laboratorydetection limit
Hard
ness, noncar-
bonate (mg/L as CaC03 )
290
290320
340
260
250
240200370270
250
35190290
500510
230170300290
800760
350
130160170
360
550480
370330440380
320
390460
650
6,100
Calcium, dis
solved (mg/L) as Ca)
99
8996
98
83
80
7671
14098
110
1006783
140140
170140150170
300310
100
565861
110
150130
120110130120
97
130140
460
3,100
Magne-
, sium, dis
solved (mg/L as Mg)
39
3739
41
33
29
33324438
40
2.01325
5253
68565563
7679
41
232425
47
8263
57566460
43
5959
310
1,100
Potas-
Sodium, sium, dis- dis
solved solved (mg/L (mg/L as Na> as K)
56
5761
59
64
89
68
8181
27
58
130130
69 8979
1434
46
100110110
44
5958
29
3230
48
220250
400
3,300
2.1
2.22.4
2.1
2.0
2.6
1.9
3.12.5
3.6
3.4
2.52.6
2.8
2.82.9
4.24.5
2.1
2.62.42.9
2.4
2.32.4
2.4
2.62.6
3.4
7.87.4
44
1,500
Alka- Carbon linity dioxide, field dis- (mg/L solved as (mg/L
CaC03 ) as C02 )
119
108105
89
99
85
109108181157
192
2233038
7972
492413324410
266340
96
107106106
128
168133
187175174186
114
188140
1,6301,800
7,1906,200
9.2
8.35.1
3.4
2.4
.2
3.38.3
117.6
15
.0
.0
.0
1.91.7
19020199
126
2652
2.9
4.12.61.6
7.8
3310
36341314
4.4
7.25.4
500695
22,10019,000
Sulfide, total (mg/L as S)
ND
ND.6
<.5
ND
ND
<.5
NDND
.5NDND
NDND
<.5
ND<.5
ND.8
ND
<.5ND.5
ND
NDND
ND<.5ND<.5
ND
ND<.5
1.7
130
.5
65
Table 2.-Hater-quality analyses of ground water near Northttood, Ohio-Continued