64
Hydrogeology of th e Karst of Puerto Ric o By ENNIO V . GIUST I GEOLOGICAL SURVEY PROFESSIONAL PAPER 101 2 UNITED STATES GOVERNMENT PRINTING OFFICE, WASHINGTON : 1978
Hydrogeology of theKarst of Puerto RicoBy ENNIO V. GIUSTI
GEOLOGICAL SURVEY PROFESSIONAL PAPER 101 2
UNITED STATES GOVERNMENT PRINTING OFFICE, WASHINGTON : 1978

HYDROGEOLOGY OF THEKARST OF PUERTO RICO
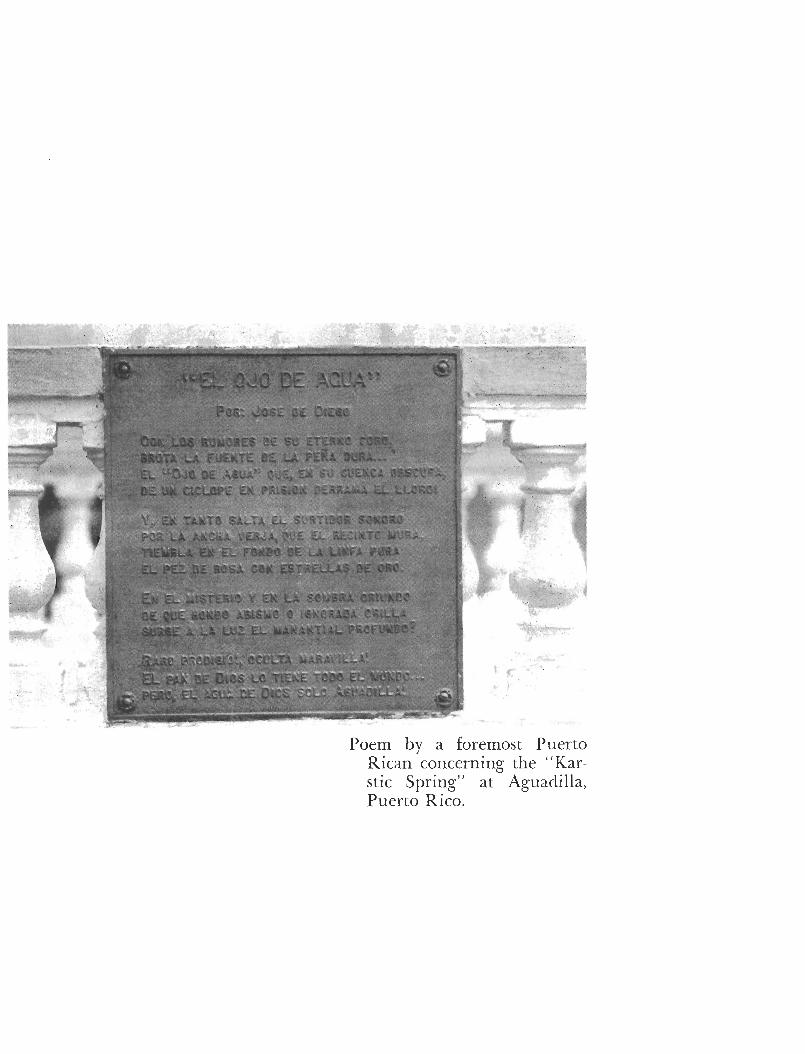
Poem by a foremost Puert oRican concerning the "Kar-stic Spring" at Aguadilla ,Puerto Rico .

Hydrogeology of theKarst of Puerto RicoBy ENNIO V. GIUSTI
GEOLOGICAL SURVEY PROFESSIONAL PAPER 101 2
UNITED STATES GOVERNMENT PRINTING OFFICE, WASHINGTON : 1978
UNITED STATES DEPARTMENT OF THE INTERIOR
CECIL D. ANDRUS, Secretary
GEOLOGICAL SURVEY
V. E. McKelvey, Director
Library of Congress Cataloging in Publication Dat aGiusti, Ennio VHydrogeology of the karst of Puerto Rico .(Geological Survey professional paper ; 1012 )Bibliography : p .Supt . of Does . no . : I 19 .16 :101 2t . Water, Underground—Puerto Rico . 2 . Karst—Puertó Rico. 3. Geology—Puerto Rico. I . Title . II Series :
United States . Geological Survey. Professional paper ; 1012 .GB1055 .G58 551 .4'9'097295 76—26183
For sale by the Superintendent of Documents, U .S . Government Printing Offic e
Washington, D .C . 20402Stock Number 024-001-03031-4
CONTENT S
Page Page
AbstractIntroduction
Data available and previous investigations
112
Hydrology —Continued
2 2Ground water—Continue d
Artesian zonesThe limestone areas of Puerto Rico 2 Permeability distribution and ground-wate r
flow 2 3Geology 2 ----------------------------------- -
2 5Volcanic basement 2 Ground-water flow patternsArtesian flow patterns 2 5Limestones 2 2 8
San Sebastián FormationLares Limestone
55
Water-table flow patterns 3 0Springs
Cibao Formation _________________________ 5 Streamflow and water budget 3 1Base flow 3 4
Aguada Limestone 5 ------------------------------- -Aymamón Limestone ______________________ 5 Direct runoff 3 6
Geochemistry 3 6Camuy Formation 5 ------------------------------------ -Unconsolidated deposits 6 The limestones , 3 6
_ ______________________ _Blanket sands 6 The water 4 2
Quaternary deposits __________________________ 6 Rainfall 4 2Lakes ---------------------------------- - 43
Structure 67
12
SpringsGround waterRivers
434 343
Landforms—the karstStream networkDrainage areas 15 4 5The solution processOther landforms 16 Carbonate equilibria 4 7
Climate --- - 16 Reconstruction of the geologic and hydrologic history 4 8Rainfall, temperature, and wind 16 Historical development of the Puerto Rican karst 5 5Evapotranspiration 17 Factors of karstification 5 8
Hydrology 22 Summary and conclusions 6 1Ground wate r
Water-table levels2 222
ReferencesIndex
6 467
ILLUSTRATIONS
Page
PLATE 1 . Map showing hydrologic stations, drainage areas, and water-table configuration in north coast lime -stone belt In pocket
2 . Cross sections of the north coast limestones In pocket
FIGURE 1 . Map showing location of the limestone areas (slightly modified from Briggs and Akers, 1965) 32. Map showing geologic formations of the north coast limestone area (adapted from Briggs an d
Akers, 1965) 43. Histograms showing north coast limestone dips and orientations 64. Graph showing the dip of the limestones decreases in a seaward direction 75. Section showing the north coast limestone belt through longitude 66°43' (adapted from Shurbe t
and Ewing, 1956) 76. Sketch showing the karst is a highly pitted surface lapping against the central volcanic core of th e
island 87. Photograph showing rounded depressions that mark the bottom of the karst 88. Map showing karst development of the north coast limestone belt 99. Photograph showing the Cibao topography is one of rolling hills—no karst . Aguada karst in back
ground 1 010. Photograph showing rolling topography of the Quebrada Arenas Limestone Member of the Ciba o
Formation11. Frequency diagram showing distribution surface of karst areas
V
VI CONTENTS
Pag e
FIGURE 12 . Map showing average altitude of land surface, stream network, and major springs of the lime -stone belt 1 3
13. Map showing northwest-southeast alinement of the sinkholes in the Lares Limestone southeast o fLago de Guajataca _ 1 4
14. Sketch showing cave of the Río Guajataca 1 515. Photograph showing the Río Grande de Manatí and its well developed flood plain 1 6
16. Photograph showing the flood plain (foreground) of the Río Grande de Arecibo where the riveremerges from the canyon 1 7
17. Map showing example of criteria used to delineate drainage boundaries in karst terrane 1 818. Photograph showing coastline west of Arecibo 1 919. Photograph showing sea caves on Aymamón Limestone cliffs, west of Arecibo 1 9
20-23 . Graphs showing :20. Mid-monthly theoretical solar radiation in equivalent evaporated water for Puerto Rico 2 0
21. Variation of fractional radiation (ratio of observed to theoretical solar radiation) wit hrainfall, annual values 2 0
22. Evaporation to net solar radiation ratio as a function of rainfall in Puerto Rico 2 1
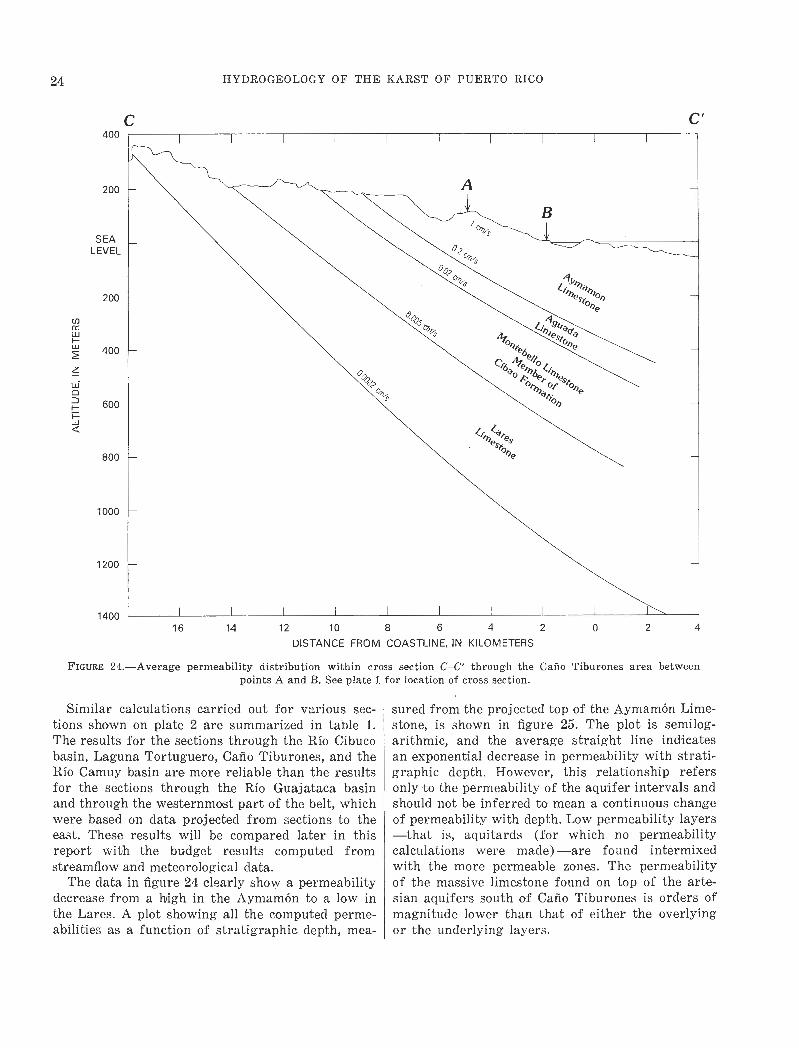
23. Potential and actual evaporation and their ratio as a function of rainfall 2 124. Section showing average permeability distribution within section C—C' through the Caño Tiburones
area between points A and B 2 4
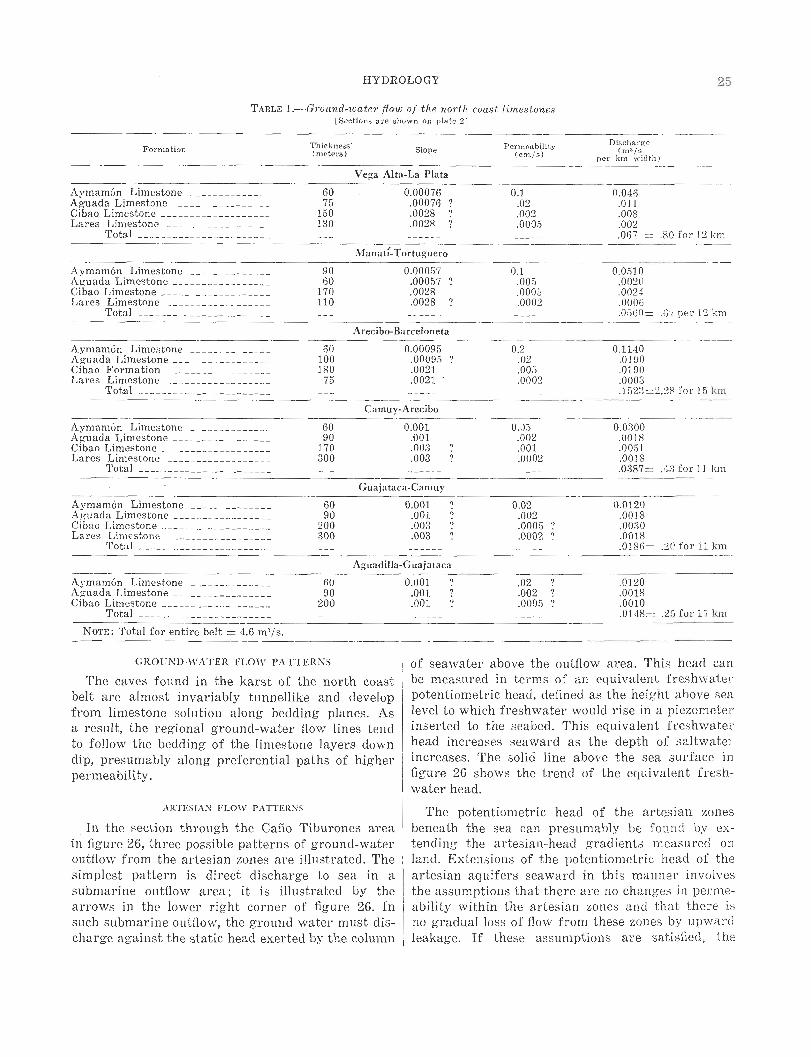
25. Graph showing variability of permeability with stratigraphic depth from projected top of Ayma món Limestone 2 6
26. Section showing possible patterns of ground-water flow in the Caño Tiburones area 2 727. Section showing ground-water flow pattern in the Tortuguero area (Bennett and Giusti, 1972) 2 9
28-32 . Photograph showing :28. Small spring (cancora) in the Caño Tiburones area 3 029. Large spring at the south end of Caño Tiburones 3 030. Salto Collazo spring, from the Lares Limestone, discharges southward to the Río Cule
brinas drainage system 3 031. Spring El Chorro to Río Grande de Arecibo 3 132. Spring in flood plain of Río Grande de Arecibo 3 1
33-36 . Graphs showing :33. Streamflow versus differences between precipitation and evapotranspiration 3 334. An example of base-flow separation by computer 3 435. Ratio of base flow to total flow versus discharge per unit area . 3 536. Downstream direct runoff versus upstream direct runoff for those streams that begin in th e
volcanic terrane and cross the limestone belt 3 737. Map showing rock sample sites 2 8
38. Map showing water-sampling sites . . 3 9
39. Graph showing relation between silica and insoluble residue 4 3
40. Photograph showing evidence of recrystallized limestone 4 4
41. Photograph showing recrystallization of limestone (close up of figure 40) 4 4
42-47 . Graphs showing :42. Relation between CaC O,concentration and discharge (instantaneous values) 4 543. Rating curve used to compute the equivalent freshwater discharge of Caño Tiburones 4 544. Relation between ó of equation 30 and ionic strength and temperature 4 845. Correlation between field and laboratory determinations of pH and bicarbonate concentra
tion 4 946. Relation between calcium concentration and ionic strength and between calcium concentra
tion and bicarbonate concentration 5 047. Saturation of water with respect to calcite as a function of calcium concentration and pH 5 1
48. Map showing saturation ratio of waters from north coast limestone and volcanics 5 2
49. Sections north-south through the limestone belt with projected original surface of the Camuy Forma tion 5 3
50. Photograph showing secondary permeability developed on chalky Aymamón Limestone 5 451. Photograph showing secondary permeability developed on Aguada Limestone 5 4
52. Photograph showing limestone knobs left as residuals on top of volcanic rocks by downcutting o fthe Rio Grande de Arecibo 5 6
53. Map showing a view of the north coast belt 3 .8 million years ago 56
FIGURE
TABLE
CONTENTS
Pag e
54. Graph showing distribution of stream channel orientations in the north coast limestones 555. Photograph showing a cut through a mogote of Lares Limestone 3 856. Photograph showing small cave in Aguada Limestone 5 957. Diagram showing spatial distribution of dolines 6 058. Photograph showing Montebello Limestone Member of Cibao Formation at entrance of Arecibo
Astronomical Observatory (photograph by Rafael da Costa) 61 59. Map showing flow patterns and drainage areas of the north coast limestone 6 3
TABLES
1 . Ground-water flow of the north coast limestone s2 . Water-budget results of the north coast limestone belt for the period November 1969–October 197 03 . Base flow of limestone basins during period November 1969–October 1970 __ . .4. Chemical and physical data of north coast limestone . .5. Miscellaneous chemical and physical data on water from north coast limestone 6. Chemical and physical data from ground water of the north coast limeston e7 . Average values of dissolved constituents and of physical properties of surface water in the nort h
coast limestone bel t8. Solution rates (in millimeters per year) and times (in million years) since solution bega n9. Chi-square test of doline orientation
CONVERSION FACTORS
Pag e
2 53 2
4 041.4:'
4 25 56 1
Conrcrsio nfactor
Foot-pou Ord-rrron dunits H'-marl s
Mr tris.unit s
meter (m )millimeter (mm )kilometer (km )square kilometer (km- )degree Celsius (° C )liter per second (Lis )kilogram per square centimete rcentimeter per second (cm/ s )cubic meter per second (n'/s )milligram per liter mg/L )gram per cubic centimeter (g/cm' )gram (g )tonne per year (t/yr )
NoTE :—Multiply units in first column by the conversion factor to ob-tain units of third column . The order of the units shown follows that usedin the report .
foot (ft )inch (in . )mile (mi )square mile (mi- )degree Farenheit (° F) add 17 .8 t ogallon per minute (gal/min )pound per square inch (lb/in' )foot per day (ft/d )cubic foot per second (ft"/s )parts per million (ppm) for dilute solution spound per cubic foot (lb/ft )pound (lb )short ton per year (ton /yr )
3 .2 8.039.6 2.38 6
1 . 815 . 9
(kg/cm') 14.2 22,85 0
35 .4

HYDROGEOLOGY OF THE KARST OF PUERTO RICO
By ENNIO V . GIUST I
ABSTRACTAbout one-fifth of Puerto Rico is covered by a tropica l
karst formed on a series of six limestone formations rangin gin age from middle-Oligocene to middle Miocene . These for-mations strike east to west and crop out over the northcoast of the island . Structurally, the rocks form a simpl ewedge abutting southward against a mountain chain o fvolcanic origin and thickening northward to about 1,40 0meters by the seashore . All stages of karstification arepresent : from the incipient, found at the western end of th ebelt to the residual, found at the eastern end . Maximumdevelopment of sinkholes occurs on the Aguada Limeston eand upper part of the Aymamón Limestone. These forma-tions have a CaCO:, content range from about 85 to 95'percent . The semi-impermeable Cibao Formation has de-veloped a fluvial drainage . An analysis of stream channelorientations indicates that the present topographic drainag eoriented toward the northeast is superimposed on a forme rdrainage system oriented toward the northwest . Transitionfrom the northwestern to the northeastern drainage orienta-tion is ascribed to Pleistocene eastward tilting of the Puert oRican platform. This tilt is thought to have affected the sub-terranean drainage pattern as well, so that springs ar efound mainly on the western wall of northward-oriente dvalleys. Estimates of the water budget indicate that th ekarstic stream basins behave on an annual basis much a sother stream basins that are not on limestone terrane . Aver-age incoming solar radiation (expressed as evaporatedwater) and rainfall (2,900 mm and 1,750 mm, respectively )result in an evapotranspiration of about 1,100 mm (milli-meters) annually and a discharge of 650 mm . This dis-charge is accommodated fluvially in areas underlain by th eCibao Formation and by the lower part of the Lares Lime -stone and subterraneally through the karst elsewhere .
Base flow of streams in limestone in Puerto Rico is les sthan in streams in volcanic terrane, owing to fast disposalof rainfall through networks of subterranean solution chan-nels. Ground water is found under water-table conditions inthe Aymamón and Aguada and under artesian conditionsin parts of the Cibao and the Lares . The unconfined ground-water discharges along a strip near the shoreline intoswamps and lagoons ; the artesian water discharges throug ha submarine face an unknown distance from the coast an dpossibly, in part, along a presumed fault near the coast . Inthe western part of the belt, ground water discharges throug hthe sea bottom, possibly as springs . Permeability is found t odecrease exponentially with stratigraphic depth .
Except for lake waters resting on terra rossa, most watersof the limestone belt are saturated or supersaturated with
respect to calcite, and as much as 86 percent of the solutionis computed to arise mainly from enrichment of rainwate rwith CO_ in the soil from the decomposition of organic acids .The denudation rate of the limestone belt through solutio nis computed as 0.070 mm per year with some evidence thatabrasion may increase the denudation rate locally by as muchas 40 ,percent. Calculations based on a projected initia llimestone surface and the computed solution rate revea lthat the limestone belt emerged from the sea about 4 millio nyears ago and that the eastward tilt of the Puerto Ricanplatform, reported in the literature, occurred about 1 millio nyears ago . Of the factors pertinent to karst development ,aquifer permeability, both vertical and lateral, and primar yrock porosity are thought to be the basic control for th eexistence and morphology of the karst. Assuming sufficient-ly pure limestone, climate is considered of secondary impor-tance .
INTRODUCTIONMost men of science of ancient times thought
that all the water about them originated from largeunderground caverns, perennially replenished bythe sea or by condensation of moist air . This view ,along with most scientific theories prevailing at tha ttime, was the legacy of Aristotelian thinking ; andit is interesting, within the context of this report ,to speculate that only a karst land—the Grecianone, in this instance—could have been responsibl efor fostering such a theory . Only the karst develop sunderground rivers, and only carbonate and othe rsoluble rock terranes develop karst . However, notall limestone terranes become karst, and not al lkarsts contain underground rivers . A great range o fconditions occur in many limestone regions ; someareas show little effects of solutional erosion, where -as other areas show advanced stages of karst de-velopment . A limestone area can occupy any inter -mediate position within these two limiting condi-tions ; one of the objectives of this report is to plac ethe north coast limestone area of Puerto Rico withi nsuch a perspective . The main purpose is to describethe hydrologic and geologic conditions of the kars tterrane of the north coast of Puerto Rico .
1
2 HYDROGEOLOGY OF THE KARST OF PUERTO RICO
The writer appreciates the cooperation of th ePuerto Rico Aqueduct and Sewer Authority for pro-viding data on well logs and pumpage and for pro-viding a crew to drill holes in well casings to mea-sure water levels .
DATA AVAILABLE AND PREVIOUS INVESTIGATION S
Areal photographs are available for the area, an dtopographic quadrangle maps may be obtained a tthe scale of 1 :20,000 with contour intervals of5—10 m in regions of high relief, and of 1 m i nregions of low relief . Geologic maps, also at a scal eof 1 :20,000, have been published for each quad-rangle in the region . Meteorological data includ erecords from about 25 daily rainfall stations scat-tered throughout the north coast limestone belt andthe nearby mountain slopes, and records from 5evaporation sites at different altitudes in the area .Hydrologic data available prior to this study wer elimited to monthly water levels from a skeleto nnetwork of 5 wells, and miscellaneous low-flow dis-charge measurements from 20 sites . In addition tothese hydrologic data from the limestone are aproper, data were available from three long-term .(more than 10 year of record), and two short-term(2 years of record) streamflow stations located i nthe volcanic area near the contact of the limeston ebelt. Chemical analyses of ground and surface wate rhave been published in basic-data reports .
Reports on the limestone belt include geologicmapping, principally by Monroe (1962, 1968a ,1969a), Briggs (1961, 1966), and Briggs and Aker s(1965) and the excellent studies of the karst morph-ology by Monroe (1964, 1966, 1968b, 1969b) . De-tailed work on a portion of the area but with con-clusions significantly applicable to the limeston ebelt in general can be found in Williams (1965) .Older and rnore general works, such as those o fLobeck (1922), Meyeroff (1933), and Zapp andothers (1948), yield much useful information onthe geology and geomorphology of the limestones .The coastal features and shoreline investigation ofKaye (1959), and various geophysical investiga-tions such as the gravity work of Myers (1955) an dShurbet and Ewing (1956), provide information fo ra better understanding of the three-dimensionalboundaries of the limestone belt.
An investigation of the hydrogeology of PuertoRico, which includes a comprehensive study of th eground-water conditions of the north coast lime -stone area, was made by McGuinness (1948) . Birotand others (1967) present a quantitative evalua-tion of the water budget of a karst stream basin,
and field-analyzed chemical data of karstic water .Bennett and Giusti (1972) evaluated the hydrolog yof the Laguna Tortuguero area ; Diaz (1973 mappedthe chemical quality at the Caño Tiburones ; andJordan (1970) reported on ground-water movemen tin the upper Río Tanamá basin .
THE LIMESTONE AREAS OF PUERTO RIC O
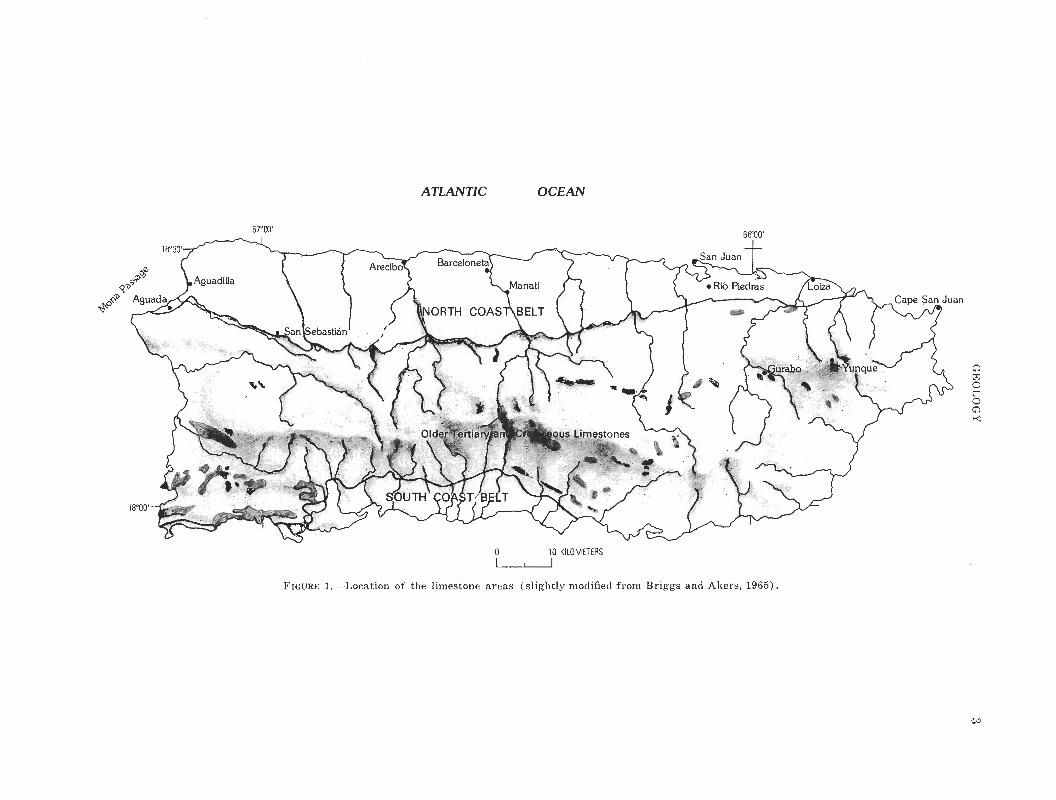
The limestones of Puerto Rico are found scatteredthroughout the island as caps of mountains or asbelts draped over the north and south coasts . These,limestones (see fig . 1) range in age from earlyCretaceous (Briggs and Akers, 1965), the oldes tof the patches being found in the interior, to middl eMiocene and perhaps as young as middle Pliocene(G. Seiglie, oral commun ., 1969), the youngest pro -posed age for the youngest formation found in th enorth coast belt . The limestones of the interior rep-resent the remnants of reefs that fringed the Cre-taceous volcanoes of Puerto Rico (Meyerhoff, 1933) ,whereas the north and south belts, were depositedlater over the eroded volcanic core, in shallow clear -water environments with open circulation, on agenerally stable shelf .
The limestones of the north coast cover an areaabout 125 km (kilometers) in length from Aguadato Loiza and as much as 22 km in width nea rArecibo, encompassing about 1,600 km', or one-fift hof the land area of Puerto Rico . The altitude of thenorth coast belt is about 400 m (meters) at th econtact with the volcanic core and decreases north -ward to sea level .
The discussion in this report is confined to thenorth coast belt west of the Río de la Plata becauseit contains important aquifers ; moreover, it is th eonly area that has developed prominent karst top-ography .
GEOLOGYVOLCANIC BASEMENT
The limestones of the north coast belt rest uncon-formably on a faulted and folded volcanic base tha tis no younger than Eocene in age (Briggs, 1961) .The surface of the volcanic rocks beneath the lime -stone is highly irregular as evidenced by the vari-ability of the angles of the dips and their azimuthsreported from seismic reflection work carried out inthe search for oil structures (Myers, 1955) .
LIMESTONES
The limestones on the north coast were depositedin shallow clear water with open circulation, on a
ATLANTIC OCEAN
o0a Aguada +;NCIRTH CnAS RFI T ~~ , ~, y Cape San Jua n
07°00' ssro0 '
0 10 KILOMETER S
FIGURE 1 .-Location of the limestone areas (slightly modified from Briggs and Akers, 1965) .
-------
67°00' 66°45 ' 66°30 '
ATLANTIC OCEAN
18°30'
18°15' EXPLANATIO N
O w >)F- z d Qw w z
y z ~ óÓ Ó Alluvium and blanket sands Q w
á Postulated faul t
Camuy Formation ~O f + Crest of anticline showing directio n
of plung e Aymamón Limeston e
Aguada Limestone >cc
Cibao Formation F
_ wZLi)UO
-aw— wzwUOCD
Cibao Formation Montebello Limestone Membe r
Lares Limeston e
San Sebastian Formation
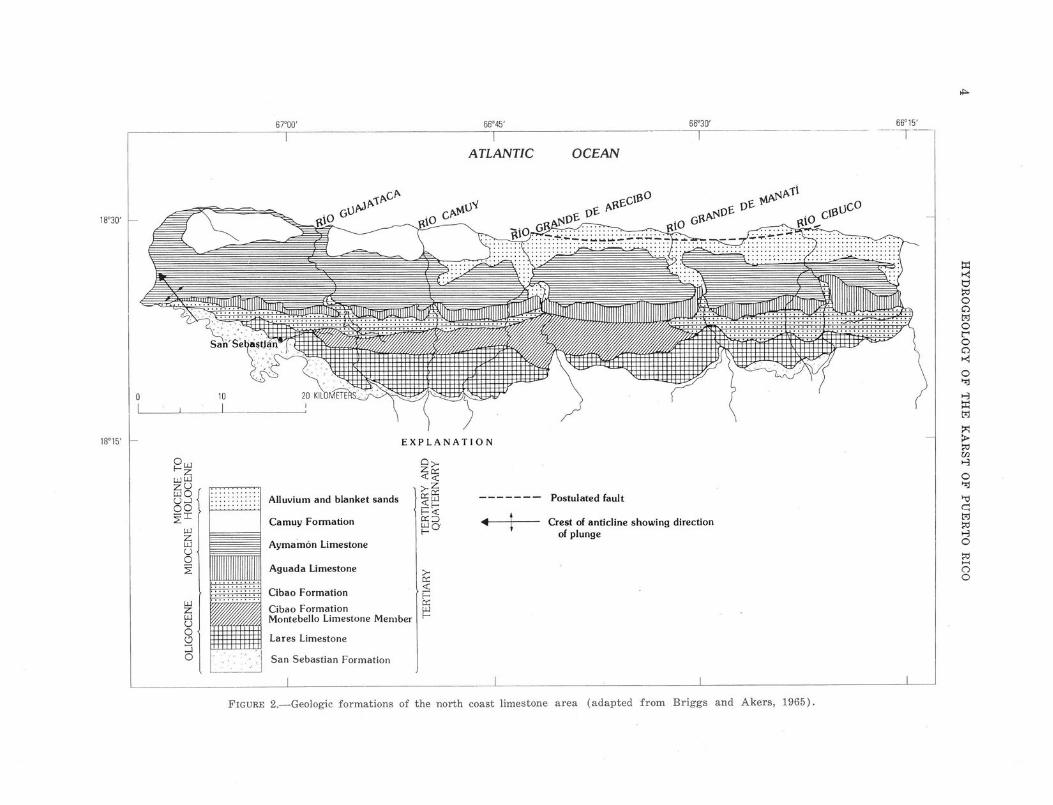
FIGURE 2 .-Geologic formations of the north coast limestone area (adapted from Briggs and Akers, 1965) .
GEOLOGY 5
generally stable shelf, and have undergone littl epostdepositional structure changes . Most investi-gators consider the age of the limestones to rang efrom middle Oligocene to middle Miocene .
Above the volcanic base, six formations are recog-ized (fig. 2) ; these are described herewith fromoldest to youngest (lithology of the rocks units ar eadapted from the several reports of Briggs an dMonroe.) .
SAN SEBASTIAN FORMATIO N
Essentially the Formation is a poorly cemente dshaly bedded claystone, but contains layers of silt -stone, sandstone, conglomerate, and locally haslenses of limestone and lignite . The thickness rangesfrom zero in the middle part of the belt to about300 m near the town of San Sebastián . The age i scontroversial . Most investigators consider it to b eof middle Oligocene age ; Gordon (1959), however ,believes that no rock of the north coast Tertiarysequence is older than Miocene . Generally the SanSebastián is too impermeable to serve as a sourc eof ground water and acts as a confining bed in mostof the area. In the vicinity of San Juan, however ,conglomerate and sandstone zones form part of a nimportant aquifer .
LARES LIMESTON E
The Lares gradationally overlies the San Sebas-tián . It is a thin-bedded limestone at the base,changing upward to a thick-bedded and massiv edense limestone . In the center of the belt it is a verypure limestone about 300 m thick ; but it thins botheastward and westward and eventually pinches outat the margins of the belt. The age controversy o fthe San Sebastián applies to the Lares, but mostinvestigators consider it to be of middle and lateOligocene age . The Lares is a poor aquifer where itcrops out because of low permeability ; however, i nthe center of the belt where it is overlain by younge rrocks it becomes an important aquifer because ofhigh potentiometric head .
CIBAO FORMATIONThe Cibao is the most variable formation of th e
north coast, to the extent that at least two membersare recognized : The Montebello Limestone Memberand the Quebrada Arenas Member.
Generally the Cibao is an interbedded sequenceof marl, chalk, limestone, sand, and clay as muchas 230 m thick . In the eastern and western parts ofthe belt, elastics are predominant . In the middlepart, limestones are predominant .
The Cibao Formation acts either as a confiningbed or as an aquifer, depending upon the lithology .In the San Juan area, an artesian aquifer capped byclays that are in turn overlain by water-bearin glimestones are all part of the Cibao Formation .
The Quebrada Arenas and the Montebello Mem-bers are present in the middle of the belt . Thesemembers are thick-bedded to massive finely crystal-line to granular limestones . The Montebello Member ,which is chalky in some places, is among the pures tlimestones of the north coast . The Montebello Mem-ber at depth is an important artesian aquifer in th emiddle part of the limestone belt . .
The Cibao Formation ranges from Oligocene toMiocene in age, or, according to Gordon (1959), isentirely Miocene .
AGUADA LIMESTONE
The Aguada consists of hard thick-bedded tomassive calcarenite, locally rubbly to finely crystal -line, alternating with beds of clayey limestone .Maximum thickness is about 90 m . The age is earlyMiocene . Water-bearing properties of the Aguadaare considered to range from poor to fair, reflectingdifferences in lithology .
AYMAMÓN LIMESTON E
The basal part of the Aymamón is a massive tothick-bedded limestone, finely crystalline, about 70m in thickness . The middle and upper parts are verypure chalky limestone, riddled with solution chan-nels . Total thickness is about 300 m ; the age is earlyMiocene . The basal part of the Aymamón is simila rto the Aguada in its water-bearing properties . Themiddle and upper parts of the limestone are highlypermeable .
CAMUY FORMATION
The youngest limestone formation of the northcoast belt is areally extensive only west of Arecibo .The lithology of the rock unit varies from a cal-carenite to a limestone conglomerate in a clayeymatrix. Some parts of the Camuy are quartz sand-stone. Maximum thickness is about 200 m. The ageis middle Miocene according to most investigatorsbut may be as young as Pliocene according to micro-paleontological work by G . A. Seiglie of the Uni-versity of Puerto Rico, (oral commun., 1969) . Ingeneral, the Camuy is not an aquifer because it i sabove the water table .
6 HYDROGEOLOGY OF THE KARST OF PUERTO RICO
UNCONSOLIDATED DEPOSITS
BLANKET SAND S
Overlying the limestone formations are the so -called blanket sands . A sandy-silty-clayey mixture ,they fill most depressions of the north coast bel tsurface to an average depth of about 10 m, thoug han infill of 30 m is not uncommon nearer the coast .There are some debatable points concerning thei rformation—some workers attribute them to a re -working of marine sediments (Monroe, 1969b) ;others (Briggs, 1966) favor a fluvial origin . Thelatter view appears to be more plausible (Williams ,1965) in view of the fact that no fossils have beenfound in the blanket sands. Briggs believes theblanket sands to be contemporary with arching ofthe Puerto Rican platform, being therefore th edeposits of the first rivers flowing from the newl yrisen island. These deposits were later augmente dby the insoluble residues of solution of the limestoneformations (especially the clastic Camuy) . The ageof the blanket sands would range, therefore, fro mlate Miocene (or Pliocene) to the present. Theblanket sands are important as recharge media, bu tinsignificant as aquifers .
QUATERNARY DEPOSIT S
The Quaternary deposits of the north coast bel tinclude the alluvium of the river flood plains, a mix-ture of unconsolidated sand, gravel, and clay rang-ing in thickness from 0 to about 100 m . Locally thealluvium is a good aquifer. Other Quaternary de -posits include the carbonaceous muck in lagoon sand swampy areas, some landslide material at th efoot of limestone escarpments, cemented sand dune salong the coast, and recent beach deposits. Some ofthem, especially the cemented sand dunes, provid eimportant clues to the geologic past of the island(Kaye, 1959) . Except for the swamps, which mar kareas of ground-water discharge, none of these de -posits are involved materially in the hydrogeologyof the north coast limestone belt. The geologic mapof figure 2 shows the most important unconsolidate ddeposits .
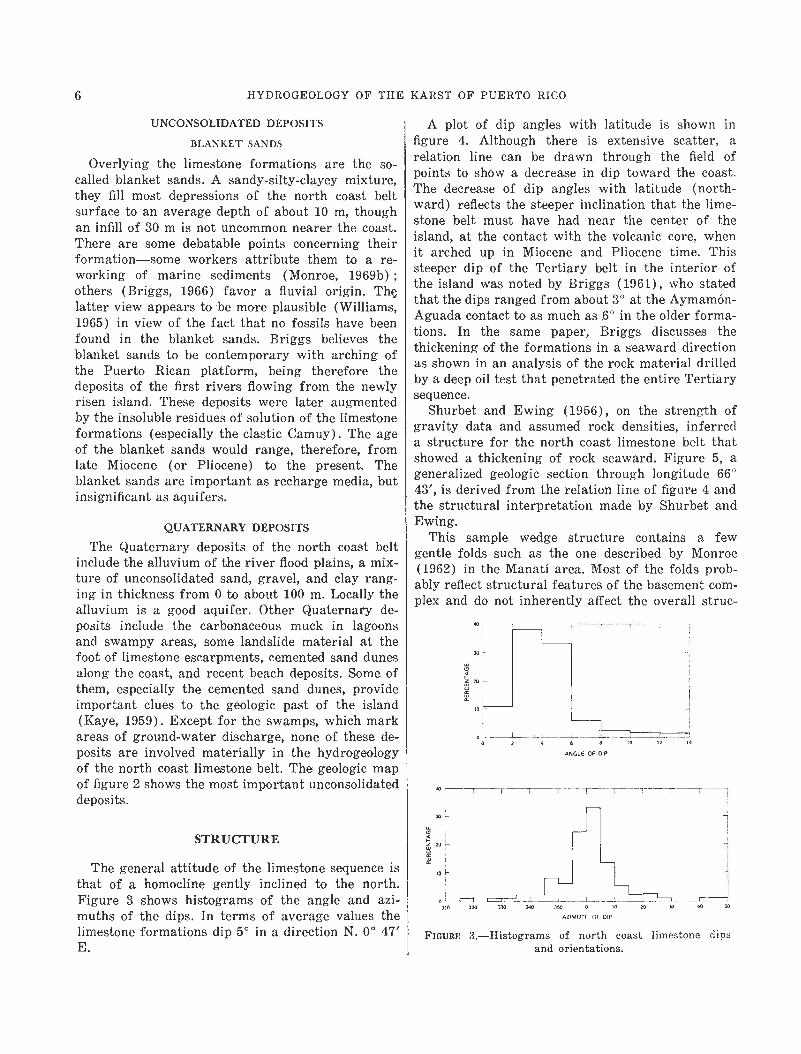
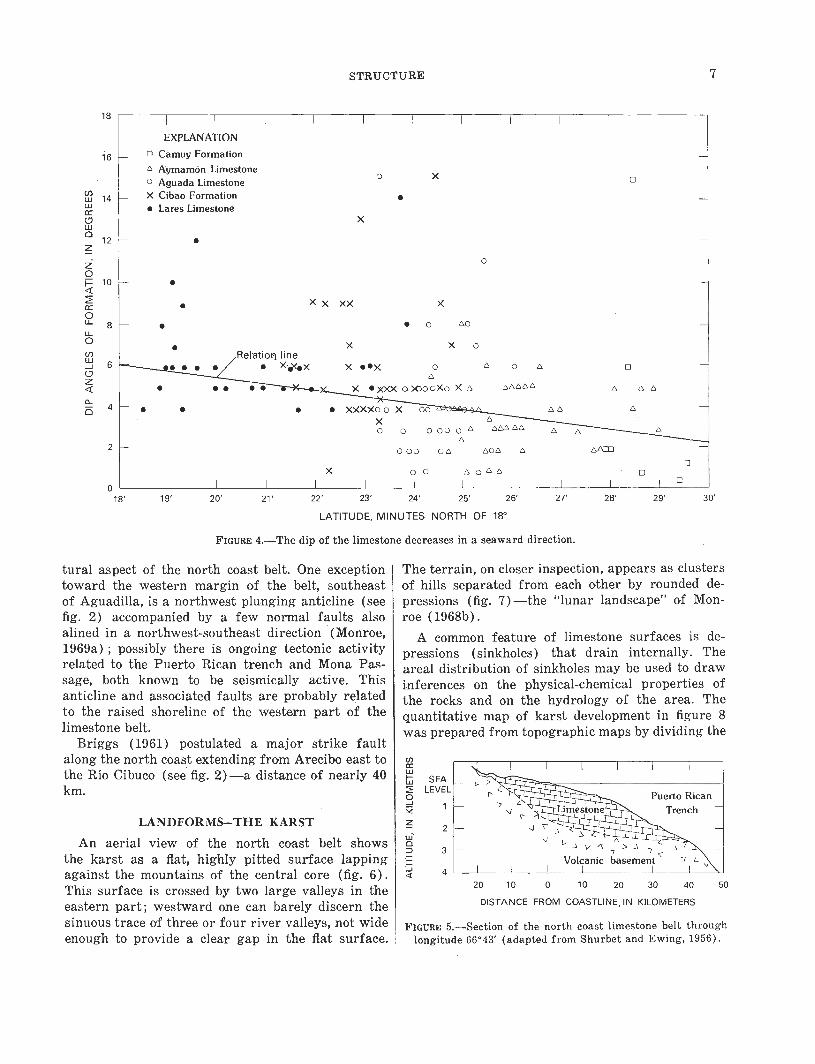
A plot of dip angles with latitude is shown i nfigure 4. Although there is extensive scatter, arelation line can be drawn through the field o fpoints to show a decrease in dip toward the coast .The decrease of dip angles with latitude (north -ward) reflects the steeper inclination that the lime -stone belt must have had near the center of th eisland, at the contact with the volcanic core, whe nit arched up in Miocene and Pliocene time . Thissteeper dip of the Tertiary belt in the interior ofthe island was noted by Briggs (1961), who state dthat the dips ranged from about 3° at the Aymamón -Aguada contact to as much as .6° in the older forma-tions. In the same paper, Briggs discusses th ethickening o,f the formations in a seaward directio nas shown in an analysis of the rock material drille dby a deep oil test that penetrated the entire Tertiar ysequence .
Shurbet and Ewing (1956), on the strength o fgravity data and assumed rock densities, inferreda structure for the north coast limestone belt tha tshowed a thickening of rock seaward. Figure 5, ageneralized geologic section through longitude 66 °43', is derived from the relation line of figure 4 an dthe structural interpretation made by Shurbet an dEwing .
This sample wedge structure contains a fewgentle folds such as the one described by Monro e(1962) in the Manatí area. Most of the folds prob-ably reflect structural features of the basement com-plex and do not inherently affect the overall struc -
C O
30 , -
00ANGLE OF OI P
30 1-
STRUCTURE
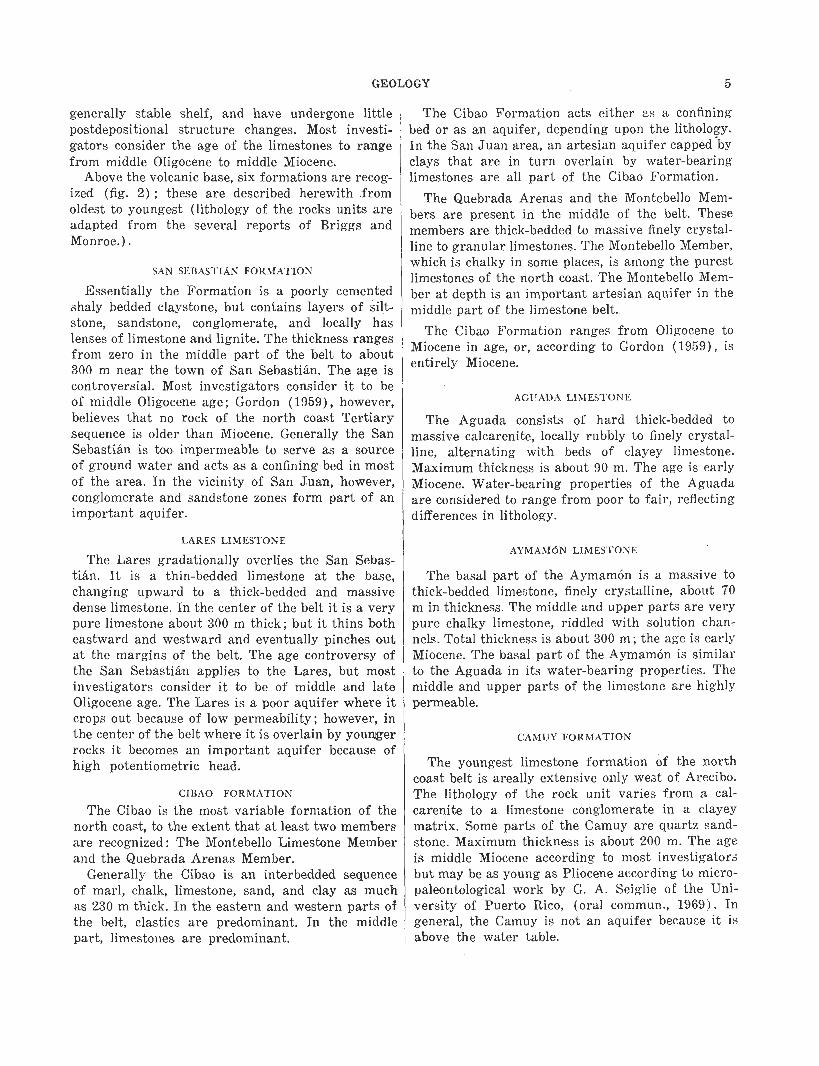
The general attitude of the limestone sequence i sthat of a homocline gently inclined to the north .Figure 3 shows histograms of the angle and azi-muths of the dips . In terms of average values th elimestone formations dip 5° in a direction N . 0° 47 'E .
3oj -
10 k
310 330 330 340 350 0 1 0
AZIMUTH OF DIP
FIGURE 3 .-Histograms of north coast limestone dip sand orientations .
30 40 50
STRUCTURE 7
EXPLANATIO Nq Camuy Formation• Aymamón Limeston eq Aguada Limeston eX Cibao Formation• Lares Limestone
o x
•q
X
1 8
1 6
w 1 4wCCUw0
12
o
• XOLL 8aO
mWJC7zQa- 40 • • • XXXXo o X 00 - 0 G 0
2 0 00 00 000 0 0 Am
0 0
24'
0 0 0 A
I I25' 26'
q
q
l q
27' 28' 29' 30 '
x
o I I I18 ' 19 ' 20' 21 ' 22' 23 '
LATITUDE, MINUTES NORTH OF 18°
FIGURE 4.-The dip of the limestone decreases in a seaward direction .
tural aspect of the north coast belt . One exception Itoward the western margin of the belt, southeas tof Aguadilla, is a northwest plunging anticline (se efig. 2) accompanied by a few normal faults alsoalined in a northwest-southeast direction (Monroe ,1969a) ; possibly there is ongoing tectonic activityrelated to the Puerto Rican trench and Mona Pas-sage, both known to be seismically active . Thisanticline and associated faults are probably relate dto the raised shoreline of the western part of th elimestone belt.
Briggs (1961) postulated a major strike faul talong the north coast extending from Arecibo east t othe Rio Cibuco (see fig . 2)—a distance of nearly 40km .
LANDFORMS —THE KARST
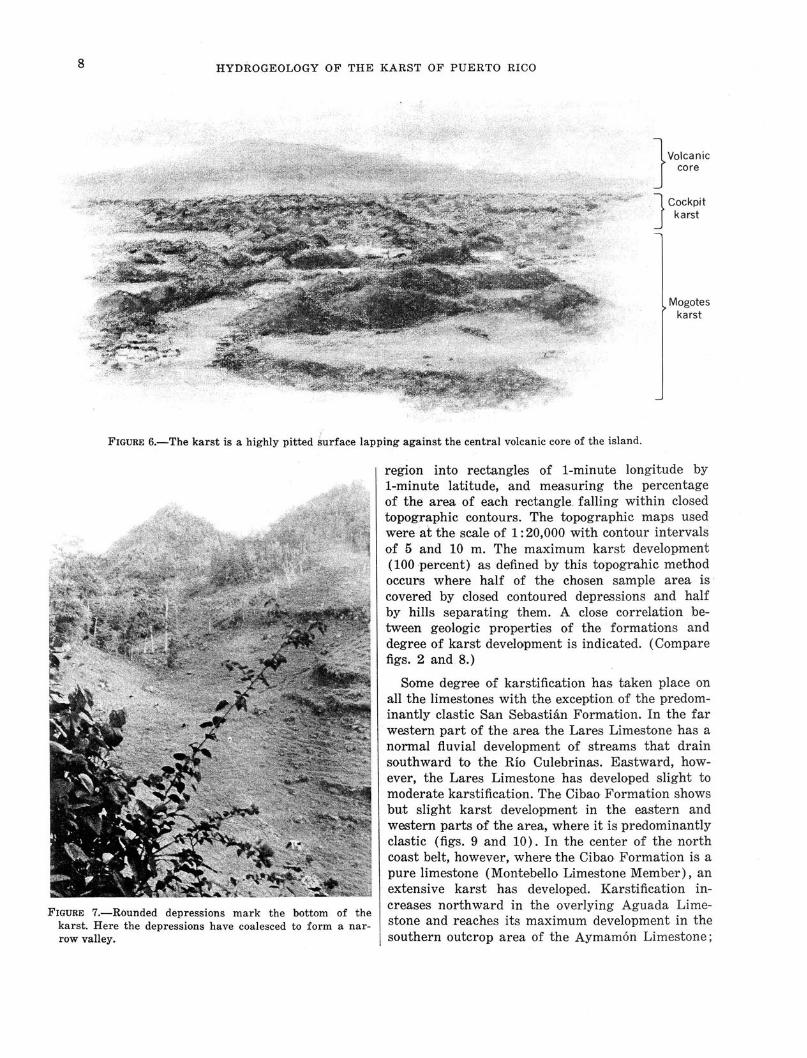
An aerial view of the north coast belt show sthe karst as a flat, highly pitted surface lappin gagainst the mountains of the central core (fig . 6) .This surface is crossed by two large valleys in th eeastern part ; westward one can barely discern thesinuous trace of three or four river valleys, not wid eenough to provide a clear gap in the flat surface .
The terrain, on closer inspection, appears as cluster sof hills separated from each other by rounded de-pressions (fig . 7) —the "lunar landscape" of Mon -roe (1968b) .
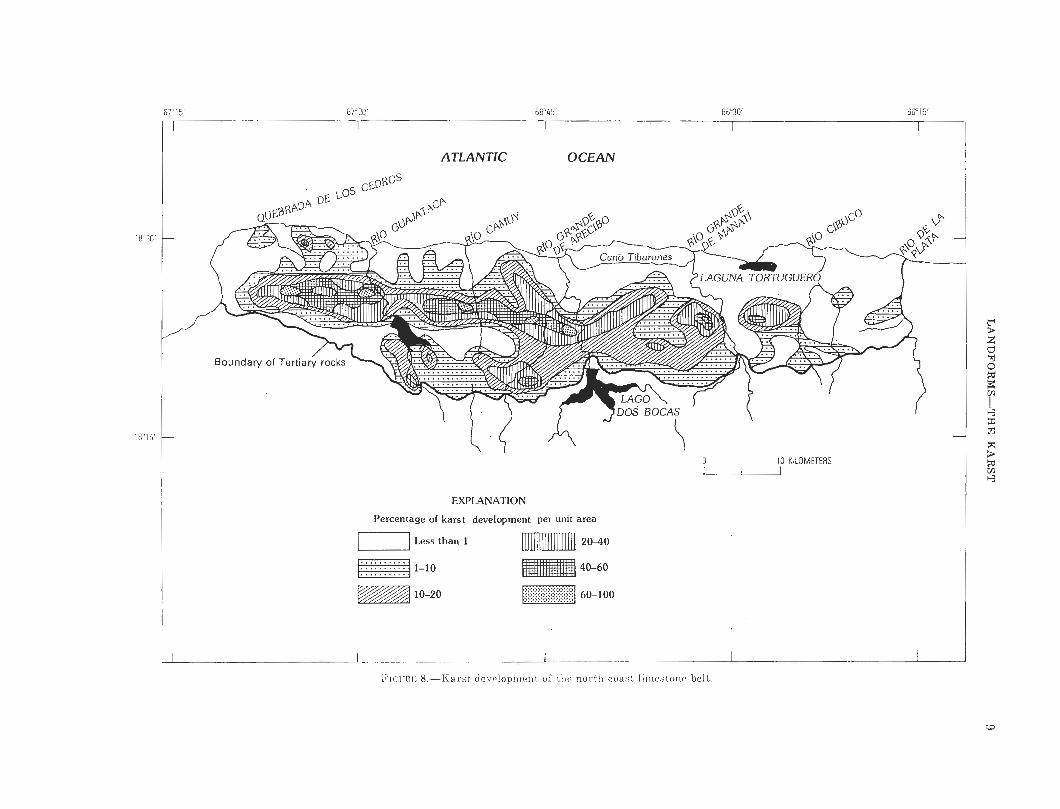
A common feature of limestone surfaces is de-pressions (sinkholes) that drain internally . Theareal distribution of sinkholes may be used to drawinferences on the physical-chemical properties o fthe rocks and on the hydrology of the area. Thequantitative map of karst development in figure 8was prepared from topographic maps by dividing th e
SEALEVE L
2
3
4
DISTANCE FROM COASTLINE , IN KILOMETER S
FIGURE 5 .-Section of the north coast limestone belt throughlongitude 66°43' (adapted from Shurbet and Ewing, 1956) .
10 20 30
8 HYDROGEOLOGY OF THE KARST OF PUERTO RICO
1 Cockpi t
karst
FIGURE 6 .-The karst is a highly pitted surface lapping against the central volcanic core of the island .
region into rectangles of 1-minute longitude by 1-minute latitude, and measuring the percentag e of the area of each rectangle falling within close d topographic contours . The topographic maps used were at the scale of 1 :20,000 with contour intervals of 5 and 10 m. The maximum karst development (100 percent) as defined by this topograhic metho d occurs where half of the chosen sample area i s covered by closed contoured depressions and hal f by hills separating them. A close correlation between geologic properties of the formations an d degree of karst development is indicated . (Compar e figs. 2 and 8. )
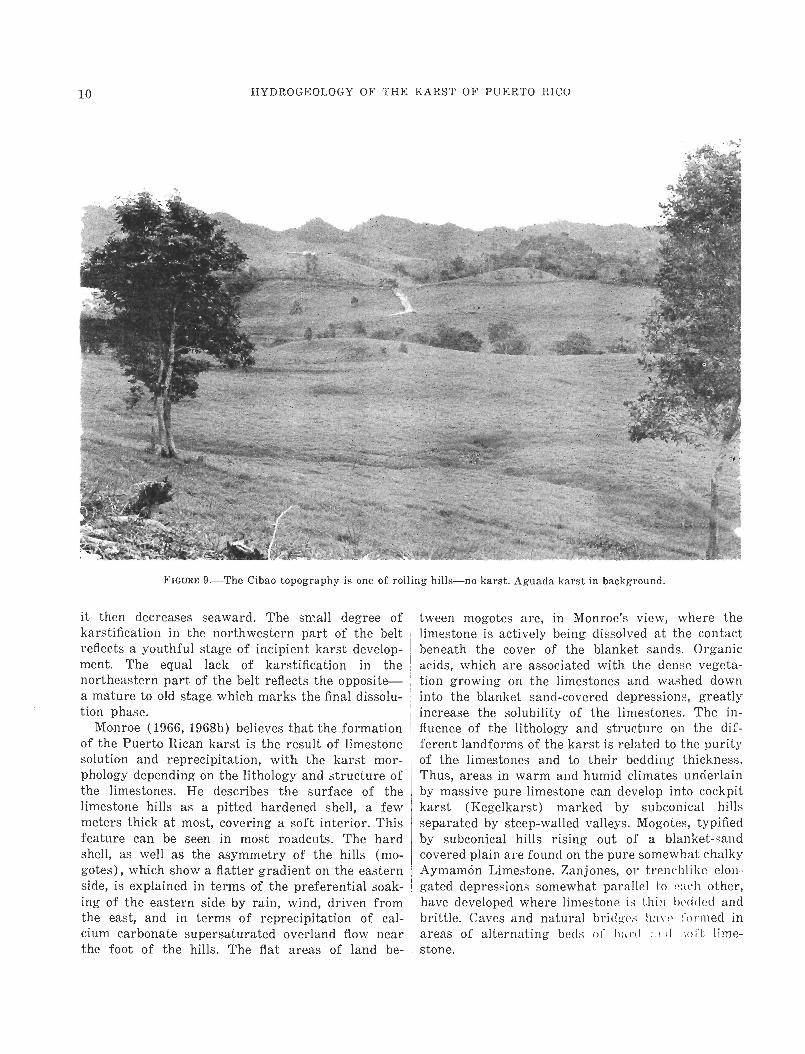
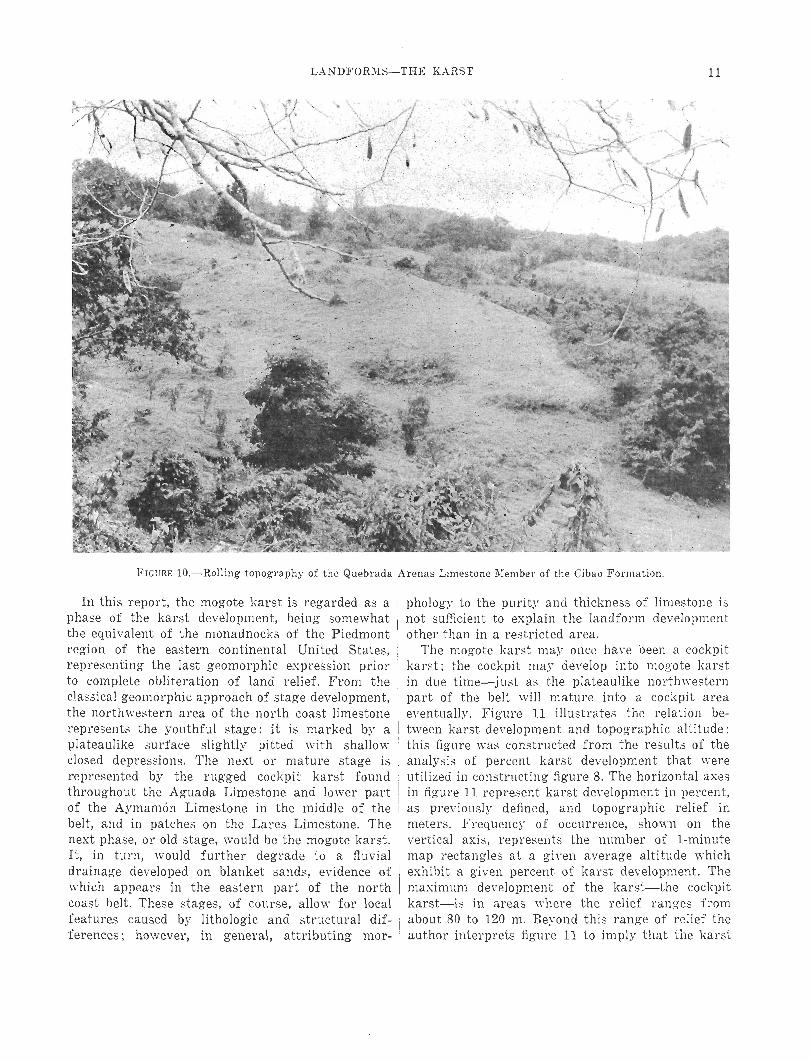
Some degree of karstification has taken place on all the limestones with the exception of the predominantly clastic San Sebastián Formation. In the far western part of the area the Lares Limestone has a normal fluvial development of streams that drain southward to the Rio Culebrinas . Eastward, how ever, the Lares Limestone has developed slight to moderate karstification . The Cibao Formation show s but slight karst development in the eastern and western parts of the area, where it is predominantl y clastic (figs . 9 and 10) . In the center of the nort h coast belt, however, where the Cibao Formation is a pure limestone (Montebello Limestone Member), a n extensive karst has developed. Karstification in
FIGURE 7.-Rounded depressions mark the bottom of th e creases northward in the overlying Aguada Lime
karst. Here the depressions have coalesced to form a nar- stone and reaches its maximum development in th e row valley . southern outcrop area of the Aymamón Limestone ;
67°15' 67°00' 66°45' 66°30' 66°15'
EXPLANATION
Percentage of karst development per unit area
FIGURE 8 . Karst development of the north coast limestone belt .
20—40
40—6 0
60—10 0
Ii::
cp
10 HYDROGEOLOGY OF THE KARST OF PUERTO RIC O
FIGURE 9 .—The Cibao topography is one of rolling hills—no karst. Aguada karst in background .
it then decreases seaward. The small degree o fkarstification in the northwestern part of the bel treflects a youthful stage of incipient karst develop-ment. The equal lack of karstification in th enortheastern part of the belt reflects the opposite —a mature to old stage which marks the final dissolu-tion phase .
Monroe (1966, 1968b) believes that the formationof the Puerto Rican karst is the result of limestonesolution and reprecipitation, with the karst mor-phology depending on the lithology and structure o fthe limestones . He describes the surface of thelimestone hills as a pitted hardened shell, a fe wmeters thick at most, covering a soft interior . Thisfeature can be seen in most roadcuts . The hardshell, as well as the asymmetry of the hills (mo-gotes), which show a flatter gradient on the easternside, is explained in terms of the preferential soak-ing of the eastern side by rain, wind, driven fro mthe east, and in terms of reprecipitation of cal-cium carbonate supersaturated overland flow nea rthe foot of the hills. The flat areas of land be-
tween mogotes are, in Monroe's view, where thelimestone is actively being dissolved at the contactbeneath the cover of the blanket sands . Organicacids, which are associated with the dense vegeta-tion growing on the limestones and washed downinto the blanket sand-covered depressions, greatl yincrease the solubility of the limestones . The in-fluence of the lithology and structure on the dif-ferent landforms of the karst is related to the purityof the limestones and to their bedding thickness .Thus, areas in warm and humid climates underlai nby massive pure limestone can develop into cockpitkarst (Kegelkarst) marked by subconical hillsseparated by steep-walled valleys . Mogotes, typifiedby subconical hills rising out of a blanket-san dcovered plain are found on the pure somewhat chalk yAymamón Limestone. Zanjones, or trenchlike elon-gated depressions somewhat parallel to each other ,have developed where limestone is thin bedded an dbrittle. Caves and natural brill c,, have formed inareas of alternating beds of Iced .end ,oft lime -stone .
LANDFORMS—THE KARST 1 1
FIGURE 10 .—Rolling topography of the Quebrad a
In this report, the mogote karst is regarded as aphase of the karst development, being somewhatthe equivalent of the monadnocks of the Piedmon tregion of the eastern continental United States ,representing the last geomorphic expression prio rto complete obliteration of land relief . From theclassical geomorphic approach of stage development ,the northwestern area of the north coast limeston erepresents the youthful stage : it is marked by aplateaulike surface slightly pitted with shallowclosed depressions. The next or mature stage i srepresented by the rugged cockpit karst foun dthroughout the Aguada Limestone and lower partof the Aymamón Limestone in the middle of th ebelt, and in patches on the Lares Limestone. Thenext phase, or old stage, would be the mogote karst .It, in turn, would further degrade to a fluvialdrainage developed on blanket sands, evidence ofwhich appears in the eastern part of the nort hcoast belt . These stages, of course, allow for loca lfeatures caused by lithologic and structural dif-ferences ; however, in general, attributing mor-
Arenas Limestone Member of the Cibao Formation .
phology to the purity and thickness of limestone i snot sufficient to explain the landform developmen tother than in a restricted area .
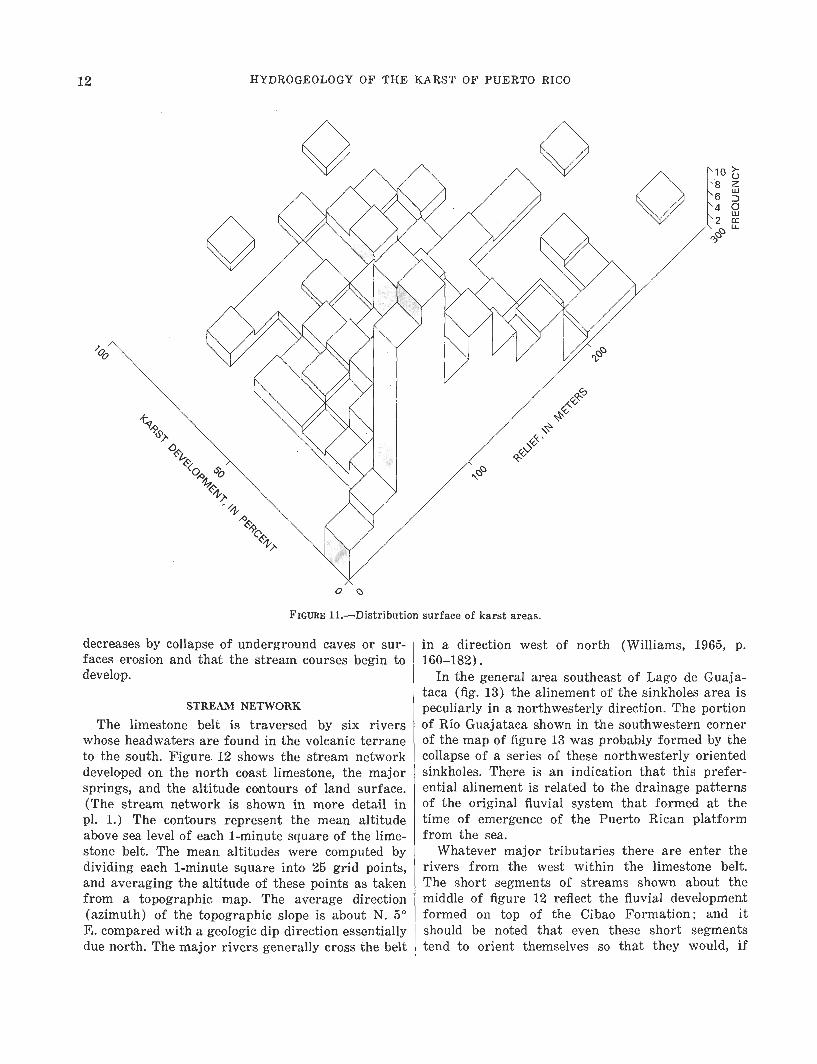
The mogote karst may once have been a cockpi tkarst ; the cockpit may develop into mogote kars tin due time—just as the plateaulike northwester npart of the belt will mature into a cockpit are aeventually. Figure 11 illustrates the relation be-tween karst development and topographic altitude ;this figure was constructed from the results of th eanalysis of percent karst development that wer eutilized in constructing figure 8 . The horizontal axe sin figure 11 represent karst development in percent ,as previously defined, and topographic relief i nmeters . Frequency of occurrence, shown on thevertical axis, represents the number of 1-minutemap rectangles at a given average altitude whic hexhibit a given percent of karst development . Themaximum development of the karst—the cockpi tkarst—is in areas where the relief ranges fro mabout 80 to 120 m . Beyond this range of relief th eauthor interprets figure 11 to imply that the karst
12 HYDROGEOLOGY OF THE KARST OF PUERTO RIC O
FIGURE 11 .-Distribution surface of karst areas .
decreases by collapse of underground caves or sur -faces erosion and that the stream courses begin todevelop.
STREAM NETWORK
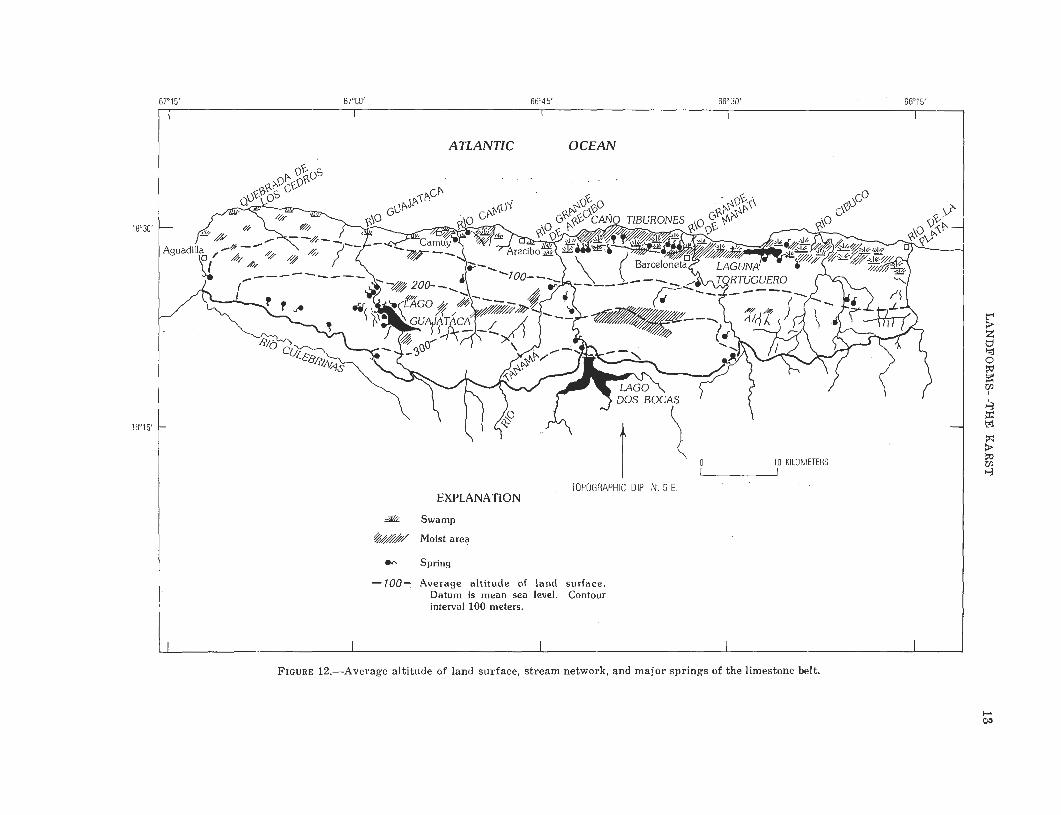
The limestone belt is traversed by six river swhose headwaters are found in the volcanic terran eto the south . Figure. 12 shows the stream networ kdeveloped on the north coast limestone, the majo rsprings, and the altitude contours of land surface .(The stream network is shown in more detail i npl . 1.) The contours represent the mean altitud eabove sea level of each 1-minute square of the lime-stone belt . The mean altitudes were computed bydividing each 1-minute square into 25 grid points ,and averaging the altitude of these points as takenfrom a topographic map . The average direction(azimuth) of the topographic slope is about N . 5°E. compared with a geologic dip direction essentiall ydue north. The major rivers generally cross the belt
in a direction west of north (Williams, 1965, p .160-182) .
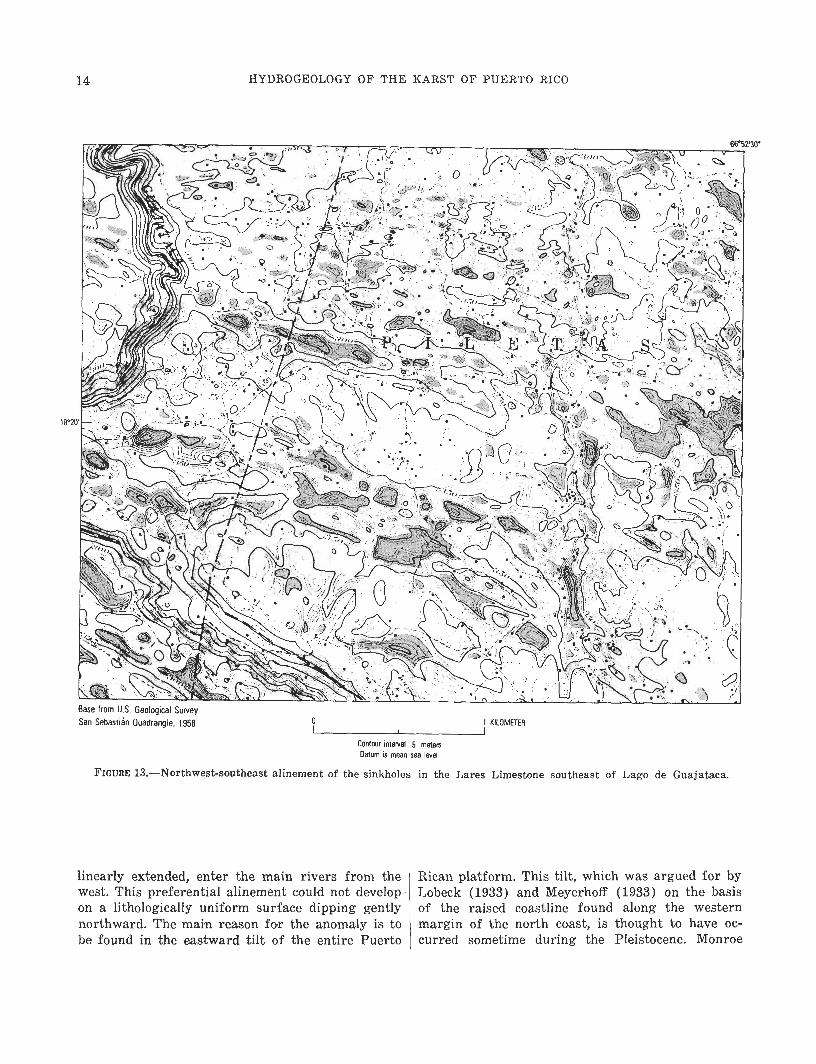
In the general area southeast of Lago de Guaja -taca (fig . 13) the alinement of the sinkholes area i speculiarly in a northwesterly direction . The portionof Río Guajataca shown in the southwestern corne rof the map of figure 13 was probably formed by thecollapse of a series of these northwesterly orientedsinkholes . There is an indication that this prefer-ential alinement is related to the drainage patternsof the original fluvial systeem that formed at thetime of emergence of the Puerto Rican platformfrom the sea.
Whatever major tributaries there are enter th erivers from the west within the limestone belt .The short segments of streams shown about th emiddle of figure 12 reflect the fluvial developmentformed on top of the Cibao Formation ; and itshould be noted that even these short segment stend to orient themselves so that they would, if
18°30 '
18°l5'
67°15' 67°00' 66°45' 66°30' 66°15'
FIGURE 12 .—Average altitude of land surface, stream network, and major springs of the limestone belt .
ATLANTIC OCEAN
TOPOGRAPHIC DIP N 5 EEXPLANATION
iii Swamp
///// Moist area
M Sprin g
-100- Average altitude of land surface .Datum is mean sea level . Contou rinterval 100 meters .
-0200-- 4
1
14 HYDROGEOLOGY OF THE KARST OF PUERTO RICO
0 1 KILOMETERI I
Contour interval 5 meter sDatum is mean sea level
FIGURE 13 .-Northwest-southeast alinement of the sinkholes in the Lares Limestone southeast of Lago de Guajataca.
Base from U .S . Geological SurveySan Sebastián Quadrangle, 1958
linearly extended, enter the main rivers from th ewest. This preferential alinement could not developon a lithologically uniform surface dipping gentlynorthward. The main reason for the anomaly is tobe found in the eastward tilt of the entire Puerto
Rican platform. This tilt, which was argued for byLobeck (1933) and Meyerhoff (1933) on the basi sof the raised coastline found along the wester nmargin of the north coast, is thought to have oc-curred sometime during the Pleistocene . Monroe
1 5LANDFORMS—THE KARST
(1968a) found terraces at altitudes of 40 to 7 0m on top of the raised limestone platform in th ewest, which he dates from the Pleistocene, thoughhe favors eustatic rather than tectonic movement sto explain the existence of the raised beach deposits .
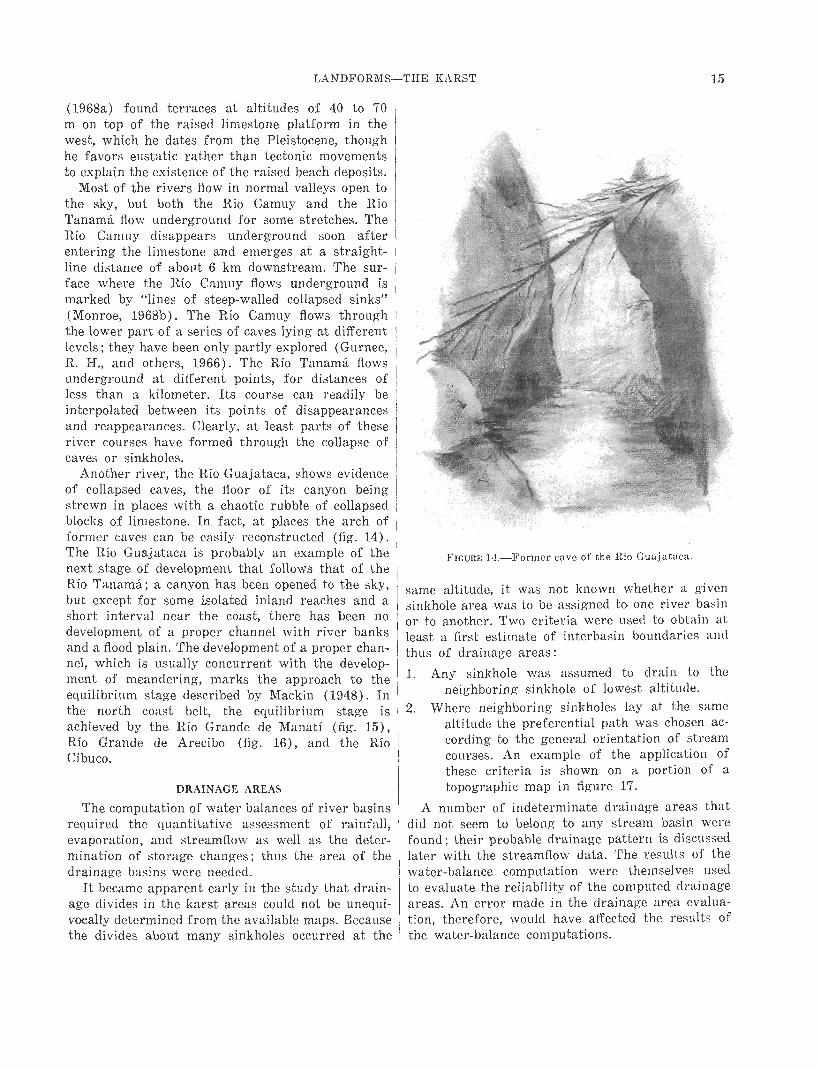
Most of the rivers flow in normal valleys open tothe sky, but both the Río Camuy and the RíoTanamá flow underground for some stretches . TheRío Camuy disappears underground soon afterentering the limestone and emerges at a straight -line distance of about 6 km downstream . The sur-face where the Río Camuy flows underground i smarked by "lines of steep-walled collapsed sinks "(Monroe, 1968b) . The Río Camuy flows throughthe lower part of a series of caves lying at differen tlevels ; they have been only partly explored (Gurnee ,R. H., and others, 1966) . The Río Tanamá flowsunderground at different points, for distances o fless than a kilometer . Its course can readily b einterpolated between its points of disappearance sand reappearances . Clearly, at least parts of theseriver courses have formed through the collapse o fcaves or sinkholes .
Another river, the Río Guajataca, shows evidenc eof collapsed caves, the floor of its canyon bein gstrewn in places with a chaotic rubble of collapse dblocks of limestone . In fact, at places the arch offormer caves can be easily reconstructed (fig . 14) .The Río Guajataca is probably an example of thenext stage of development that follows that of th eRío Tanamá ; a canyon has been opened to the sky ,but except for some isolated inland reaches and ashort interval near the coast, there has been n odevelopment of a proper channel with river bank sand a flood plain . The development of a proper chan-nel, which is usually concurrent with the develop-ment of meandering, marks the approach to th eequilibrium stage described by Mackin (1948) . Inthe north coast belt, the equilibrium stage i sachieved by the Río Grande de Manatí (fig. 15) ,Río Grande de Arecibo (fig. 16), and the RíoCibuco .
DRAINAGE AREAS
The computation of water balances of river basin srequired the quantitative assessment of rainfall ,evaporation, and streamflow as well as the deter-mination of storage changes ; thus the area of th edrainage basins were needed .
It became apparent early in the study that drain -age divides in the karst areas could not be unequi-vocally determined from the available maps . Becaus ethe divides about many sinkholes occurred at the
FIGURE U.—Former cave of the Río Guajataca .
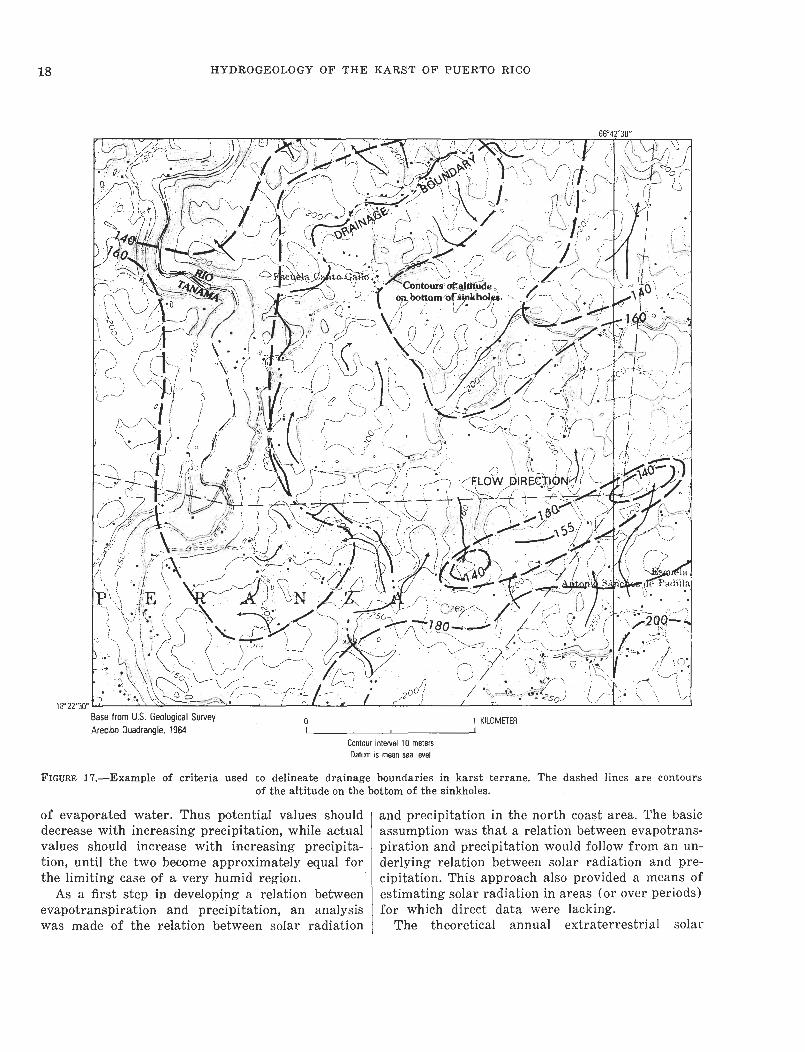
same altitude, it was not known whether a give nsinkhole area was to be assigned to one river basi nor to another . Two criteria were used to obtain a tleast a first estimate of interbasin boundaries andthus of drainage areas :
1 . Any sinkhole was assumed to drain to theneighboring sinkhole of lowest altitude .
2 . Where neighboring sinkholes lay at the samealtitude the preferential path was chosen ac-cording to the general orientation of streamcourses . An example of the application o fthese criteria is shown on a portion of atopographic map in figure 17 .
A number of indeterminate drainage areas tha tdid not seem to belong to any stream basin werefound ; their probable drainage pattern is discusse dlater with the streamflow data . The results of thewater-balance computation were themselves usedto evaluate the reliability of the computed drainag eareas. An error made in the drainage area evalua-tion, therefore, would have affected the results o fthe water-balance computations .
16 HYDROGEOLOGY OF THE KARST OF PUERTO RIC O
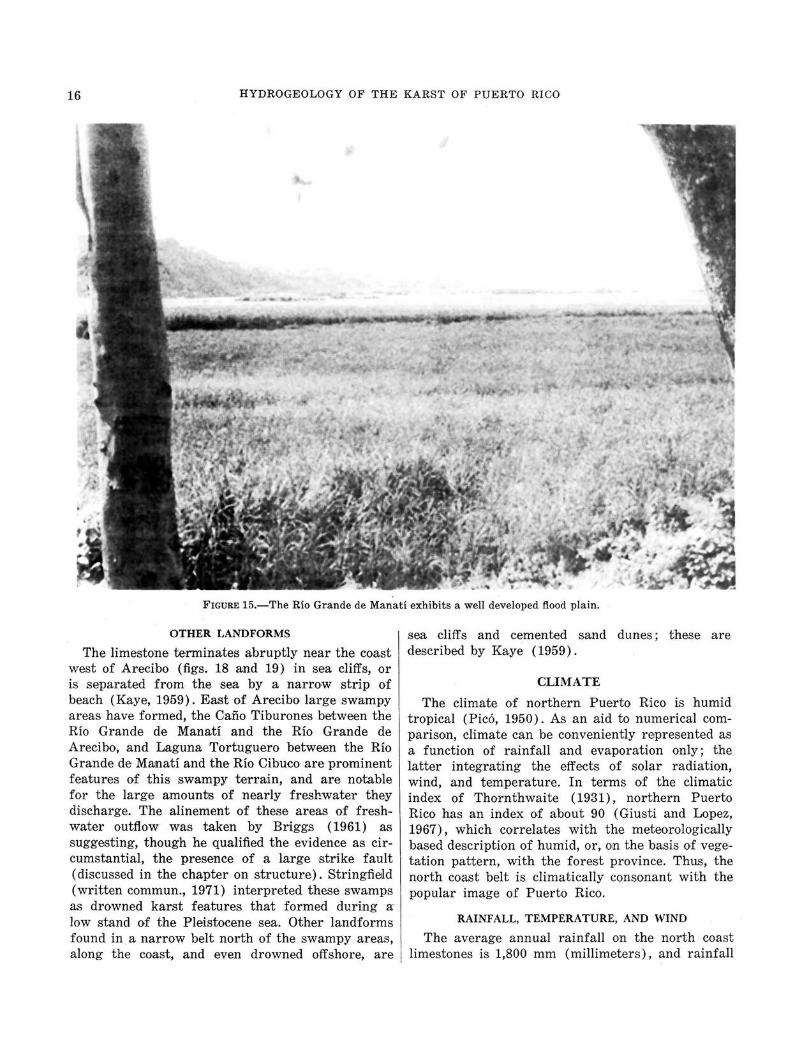
FIGURE 15.-The Río Grande de Manatí exhibits a well developed flood plain .
OTHER LANDFORMS
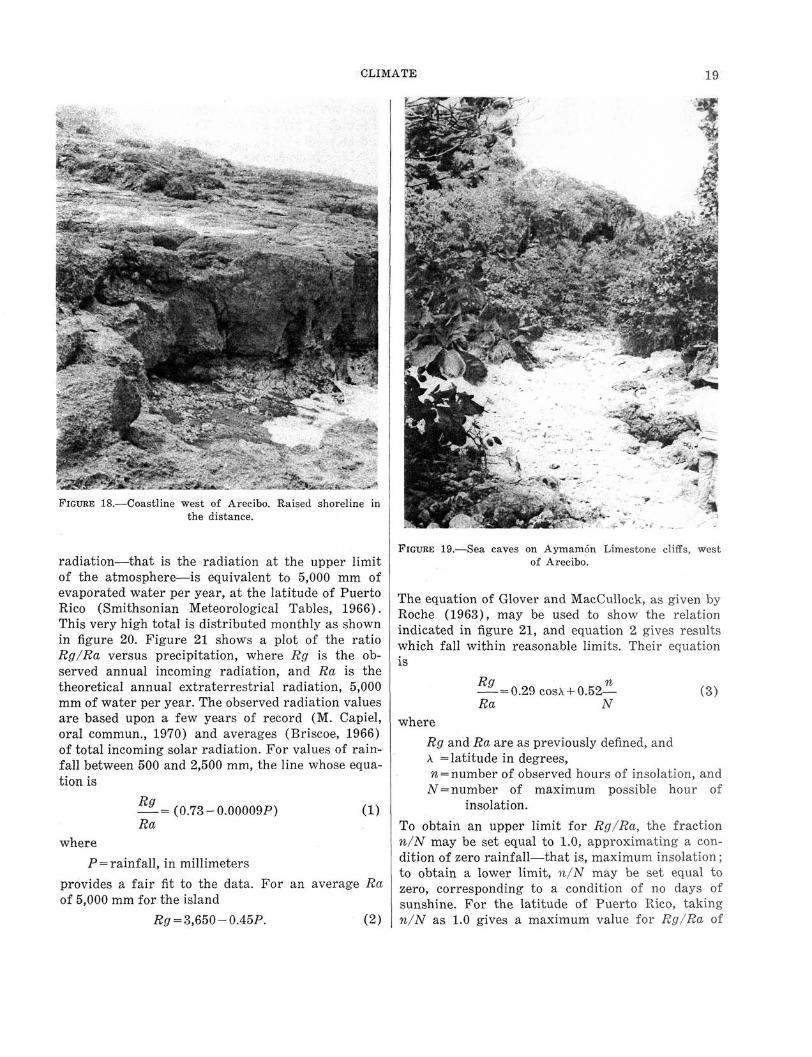
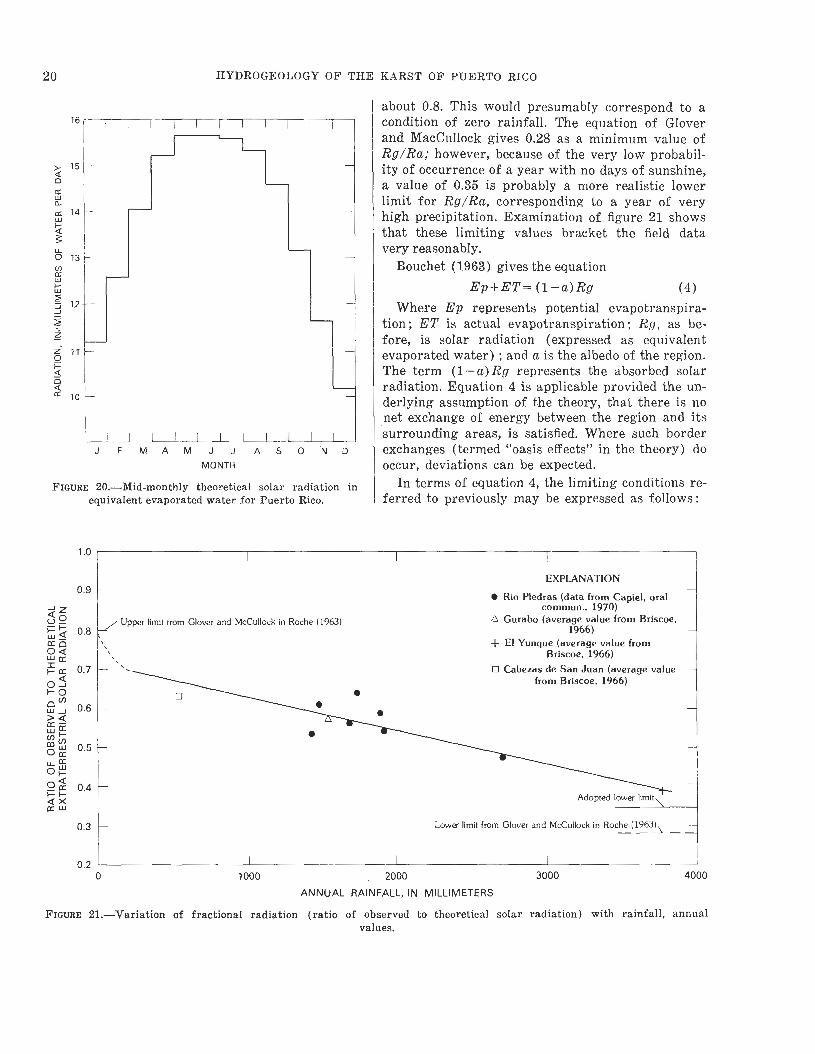
The limestone terminates abruptly near the coast west of Arecibo (figs . 18 and 19) in sea cliffs, or is separated from the sea by a narrow strip o f beach (Kaye, 1959) . East of Arecibo large swampy areas have formed, the Caño Tiburones between the Río Grande de Manatí and the Río Grande de Arecibo, and Laguna Tortuguero between the Río Grande de Manatí and the Río Cibuco are prominent features of this swampy terrain, and are notabl e for the large amounts of nearly freshwater they discharge. The alinement of these areas of fresh water outflow was taken by Briggs (1961) as suggesting, though he qualified the evidence as circumstantial, the presence of a large strike faul t (discussed in the chapter on structure) . Stringfiel d (written commun ., 1971) interpreted these swamp s as drowned karst features that formed during a low stand of the Pleistocene sea . Other landforms found in a narrow belt north of the swampy areas , along the coast, and even drowned offshore, are
sea cliffs and cemented sand dunes ; these are described by Kaye (1959) .
CLIMATE
The climate of northern Puerto Rico is humi d tropical (Picó, 1950) . As an aid to numerical comparison, climate can be conveniently represented as a function of rainfall and evaporation only ; the latter integrating the effects of solar radiation , wind, and temperature. In terms of the climati c index of Thornthwaite (1931), northern Puerto Rico has an index of about 90 (Giusti and Lopez , 1967), which correlates with the meteorologically based description of humid, or, on the basis of vegetation pattern, with the forest province. Thus, the north coast belt is climatically consonant with th e popular image of Puerto Rico .
RAINFALL, TEMPERATURE, AND WIN D
The average annual rainfall on the north coas t limestones is 1,800 mm (millimeters), and rainfall
CLIMAT E
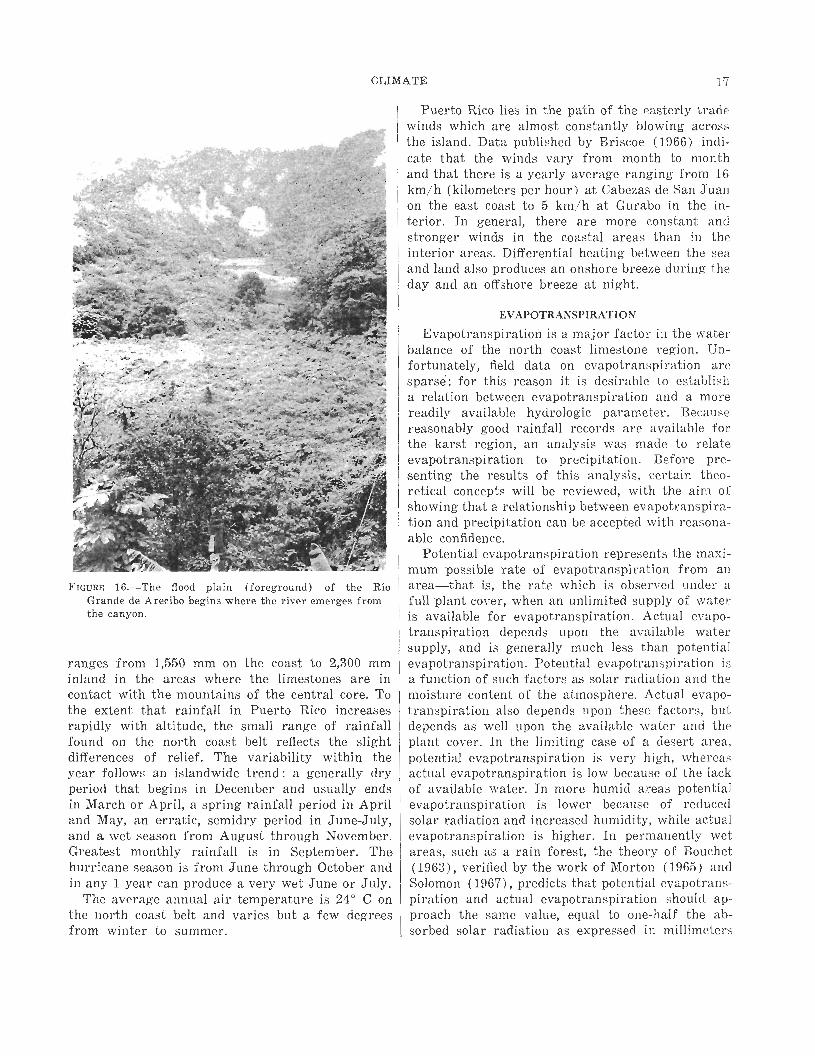
FIGURE 16.-The flood plain (foreground) of the Ri oGrande de Arecibo begins where the river emerges fromthe canyon .
ranges from 1,550 mm on the coast to 2,300 m minland in the areas where the limestones are i ncontact with the mountains of the central core . Tothe extent that rainfall in Puerto Rico increase srapidly with altitude, the small range of rainfal lfound on the north coast belt reflects the slightdifferences of relief . The variability within th eyear follows an islandwide trend : a generally dryperiod that begins in December and usually end sin March or April, a spring rainfall period in Apri land May, an erratic, semidry period in June-July ,and a wet season from August through November .Greatest monthly rainfall is in September . Thehurricane season is from June through October andin any 1 year can produce a very wet June or July .
The average annual air temperature is 24° C onthe north coast belt and varies but a few degree sfrom winter to summer .
1Puerto Rico lies in the path of the easterly trade
winds which are almost constantly blowing acrossthe island. Data published by Briscoe (1966) indi-cate that the winds vary from month to mont hand that there is a yearly average ranging from 1 6km/h (kilometers per hour) at Cabezas de San Juanon the east coast to 5 km/h at Gurabo in the in-terior. In general, there are more constant an dstronger winds in the coastal areas than in th einterior areas. Differential heating between the se aand land also produces an onshore breeze during th eday and an offshore breeze at night .
EVAPOTRANSPIRATIO N
Evapotranspiration is a major factor in the waterbalance of the north coast limestone region . Un-fortunately, field data on evapotranspiration ar esparse ; for this reason it is desirable to establisha relation between evapotranspiration and a mor ereadily available hydrologic parameter . Becausereasonably good rainfall records are available fo rthe karst region, an analysis was made to relat eevapotranspiration to precipitation . Before pre-senting the results of this analysis, certain theo-retical concepts will be reviewed, with the aim o fshowing that a relationship between evapotranspira-tion and precipitation can be accepted with reasona-able confidence.
Potential evapotranspiration represents the maxi -mum possible rate of evapotranspiration from anarea—that is, the rate which is observed under afull plant cover, when an unlimited supply of wate ris available for evapotranspiration . Actual evapo-transpiration depends upon the available wate rsupply, and is generally much less than potentia levapotranspiration . Potential evapotranspiration i sa function of such factors as solar radiation and th emoisture content of the atmosphere . Actual evapo-transpiration also depends upon these factors, bu tdepends as well upon the available water and th eplant cover . In the limiting case of a desert area ,potential evapotranspiration is very high, wherea sactual evapotranspiration is low because of the lackof available water. In more humid areas potentialevapotranspiration is lower because of reducedsolar radiation and increased humidity, while actualevapotranspiration is higher . In permanently wetareas, such as a rain forest, the theory of Bouche t(1963), verified by the work of Morton (1965) an dSolomon (1967), predicts that potential evapotrans-piration and actual evapotranspiration should ap-proach the same value, equal to one-half the ab -sorbed solar radiation as expressed in millimeters
18 HYDROGEOLOGY OF THE KARST OF PUERTO RICO
66°42 ' 30"
( SO \ / c
72 2 ' 30 "
Base from U .S . Geological Survey 0 1 KILOMETE RArecibo Quadrangle, 1964 I I
Contour interval 10 meter sDatum is mean sea leve l
FIGURE 17 .-Example of criteria used to delineate drainage boundaries in karst terrane . The dashed lines are contoursof the altitude on the bottom of the sinkholes .
of evaporated water . Thus potential values shoul ddecrease with increasing precipitation, while actualvalues should increase with increasing precipita-tion, until the two become approximately equal fo rthe limiting case of a very humid region .
As a first step in developing a relation betweenevapotranspiration and precipitation, an analysi swas made of the relation between solar radiation
and precipitation in the north coast area . The basi cassumption was that a relation between evapotrans-piration and precipitation would follow from an un-derlying relation between solar radiation and pre-cipitation . This approach also provided a means ofestimating solar radiation in areas (or over periods )for which direct data were lacking .
The theoretical annual extraterrestrial sola r
CLIMATE 19
. t— 4
FIGURE 18.-Coastline west of Arecibo . Raised shoreline in the distance.
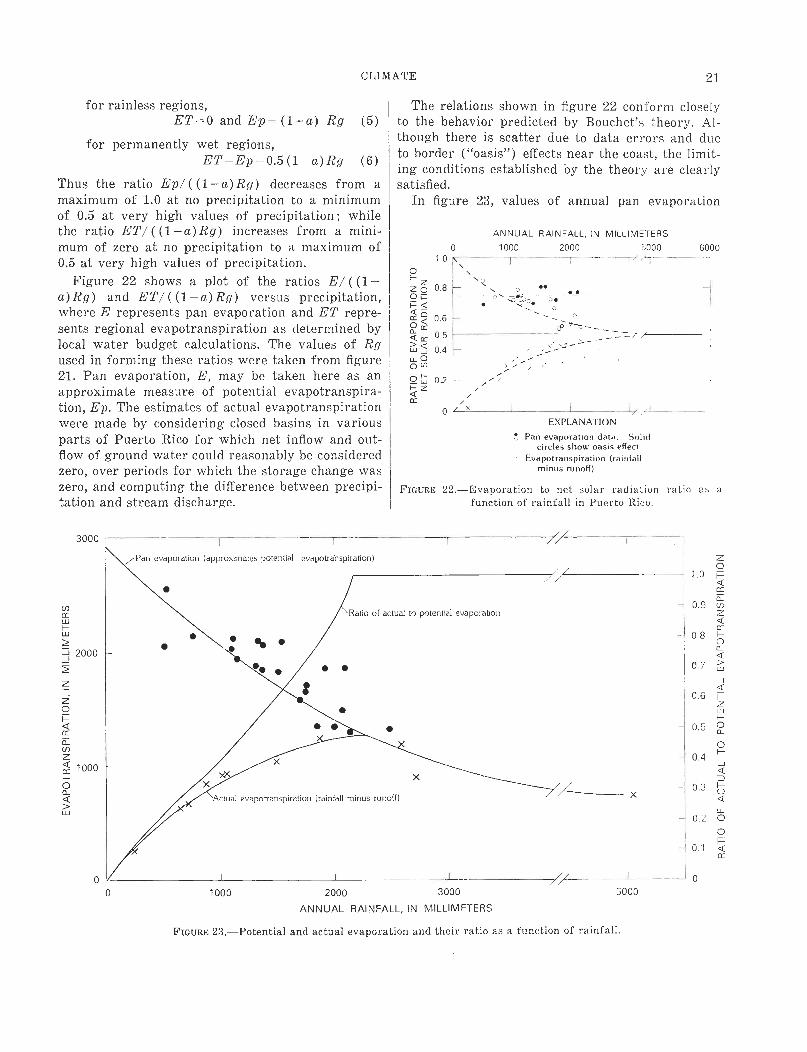
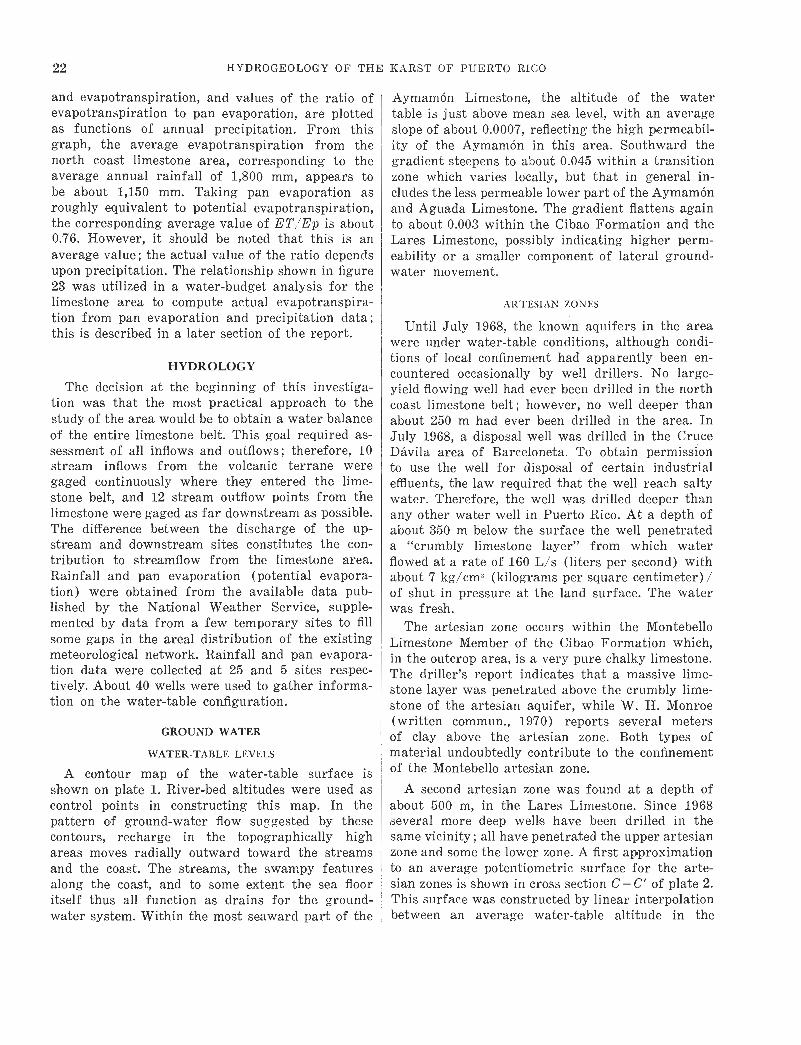
radiation—that is the radiation at the upper limit of the atmosphere—is equivalent to 5,000 mm o f evaporated water per year, at the latitude of Puerto Rico (Smithsonian Meteorological Tables, 1966) . This very high total is distributed monthly as show n in figure 20. Figure 21 shows a plot of the rati o Rg/Ra versus precipitation, where Rg is the observed annual incoming radiation, and Ra is the theoretical annual extraterrestrial radiation, 5,00 0 mm of water per year . The observed radiation values are based upon a few years of record (M . Capiel , oral commun., 1970) and averages (Briscoe, 1966 ) of total incoming solar radiation . For values of rainfall between 500 and 2,500 mm, the line whose equa tion is
Rg = (0.73–0.00009P)
Ra where
P=rainfall, in millimeter s
(1)
provides a fair fit to the data . For an average Ra of 5,000 mm for the islan d
Rg = 3,650– 0 .45P . (2)
FIGURE 19 .-Sea caves on Aymamón Limestone cliffs, wes t of Arecibo .
The equation of Glover and MacCullock, as given by Roche (1963), may be used to show the relatio n indicated in figure 21, and equation 2 gives result s which fall within reasonable limits . Their equatio n is
Rg n --=0.29 cosx +0.52— (3) Ra N
where
Rg and Ra are as previously defined, an d A =latitude in degrees , n=number of observed hours of insolation, an d N=number of maximum possible hour o f
insolation .
To obtain an upper limit for Rg/Ra, the fractio n n/N may be set equal to 1 .0, approximating a condition of zero rainfall—that is, maximum insolation ; to obtain a lower limit, n/N may be set equal to zero, corresponding to a condition of no days o f sunshine . For the latitude of Puerto Rico, taking n/N as 1 .0 gives a maximum value for Rg/Ra of
20 HYDROGEOLOGY OF THE KARST OF PUERTO RICO
10'
L 1111111111J F M A M J J A S O N D
MONTH
FIGURE 20 .-Mid-monthly theoretical solar radiation i nequivalent evaporated water for Puerto Rico .
about 0 .8. This would presumably correspond to acondition of zero rainfall . The equation of Glove rand MacCullock gives 0 .28 as a minimum value o fRg/Ra; however, because of the very low probabil-ity of occurrence of a year with no days of sunshine ,a value of 0 .35 is probably a more realistic lowerlimit for Rg/Ra, corresponding to a year of ver yhigh precipitation . Examination of figure 21 showsthat these limiting values bracket the field dat avery reasonably .
Bouchet (1963) gives the equation
Ep+ET= (1—a)Rg (4 )
Where Ep represents potential evapotranspira-tion ; ET is actual evapotranspiration ; Rg, as be-fore, is solar radiation (expressed as equivalentevaporated water) ; and a is the albedo of the region .The term (1— a) Rg represents the absorbed sola rradiation. Equation 4 is applicable provided the un-derlying assumption of the theory, that there is n onet exchange of energy between the region and it ssurrounding areas, is satisfied . Where such borderexchanges (termed "oasis effects" in the theory) dooccur, deviations can be expected .
In terms of equation 4, the limiting conditions re-ferred to previously may be expressed as follows :
1 6
1 5
1 4
13I-
1 .0
EXPLANATION
0 .3 Lower limit from Glover and McCullock in Roche (1963
0 .9
0 .8Upper limit from Glover and McCullock in Roche (1963)
• Río Piedras (data from Capiel, ora lcommun ., 1970 )
• Gurabo (average value from Briscoe ,1966)
+ El Yunque (average value fro mBriscoe, 1966 )
q Cabezas de San Juan (average valuefrom Briscoe, 1966 )
0 .2 01000 2000 300 0
ANNUAL RAINFALL, IN MILLIMETERS
400 0
FIGURE 21.-Variation of fractional radiation (ratio of observed to theoretical solar radiation) with rainfall, annua lvalues .
CLIMATE 21
for rainless regions ,ET=0 and Ep= (1-a) Rg (5 )
for permanently wet regions ,ET=Ep=0.5(1-a)Rg (6 )
Thus the ratio Ep/ ((1- a) Rg) decreases from amaximum of 1 .0 at no precipitation to a minimu mof 0 .5 at very high values of precipitation ; whilethe ratio ET/( (1-a) Rg) increases from a mini -mum of zero at no precipitation to a maximum o f0.5 at very high values of precipitation .
Figure 22 shows a plot of the ratios E/ ((1 -a) Rg) and ET/( (1- a) Rg) versus precipitation ,where E represents pan evaporation and ET repre-sents regional evapotranspiration as determined bylocal water budget calculations. The values of Rgused in forming these ratios were taken from figur e21. Pan evaporation, E, may be taken here as a napproximate measure of potential evapotranspira-tion, Ep. The estimates of actual evapotranspirationwere made by considering closed basins in variousparts of Puerto Rico for which net inflow and out -flow of ground water could reasonably be considere dzero, over periods for which the storage change waszero, and computing the difference between precipi-tation and stream discharge .
The relations shown in figure 22 conform closel yto the behavior predicted by Bouchet's theory . Al-though there is scatter due to data errors and dueto border ("oasis") effects near the coast, the limit-ing conditions established by the theory are clearlysatisfied .
In figure 23, values of annual pan evaporation
ANNUAL RAINFALL, IN MILLIMETER S0 1000 2000 5000 600 0
1 .0 11 -I — -- r
o I ~ ~~ zz o0.s :-
sc,o F-2 - - --Q
_sss so, . -~ •< Q
o0 .6 1
O . \ .c ~ —Q¢ 0 .5w Q 0. 4LL OO u)ów 0.z L- -<
EXPLANATIO N
Pan evaporation data . Soli dcircles show oasis effect
- Evapotranspiration (rainfal lminus runoff)
FIGURE 22 .-Evaporation to net solar radiation ratio as afunction of rainfall in Puerto Rico .
~o 'f-
3000
Pan evaporation (approximates potential evapotranspiration )
Actual evapotranspiration (rainfall minus runoff )
0 1000 2000 3000 500 0
ANNUAL RAINFALL, IN MILLIMETER S
FIGURE 23 .-Potential and actual evaporation and their ratio as a function of rainfall .
22 HYDROGEOLOGY OF THE KARST OF PUERTO RIC O
and evapotranspiration, and values of the ratio o fevapotranspiration to pan evaporation, are plotte das functions of annual precipitation . From thisgraph, the average evapotranspiration from th enorth coast limestone area, corresponding to th eaverage annual rainfall of 1,800 mm, appears tobe about 1,150 mm. Taking pan evaporation asroughly equivalent to potential evapotranspiration ,the corresponding average value of ET/Ep is about0.76. However, it should be noted that this is a naverage value ; the actual value of the ratio dependsupon precipitation . The relationship shown in figur e23 was utilized in a water-budget analysis for th elimestone area to compute actual evapotranspira-tion from pan evaporation and precipitation data ;this is described in a later section of the report .
HYDROLOGY
The decision at the beginning of this investiga-tion was that the most practical approach to th estudy of the area would be to obtain a water balanceof the entire limestone belt. This goal required as-sessment of all inflows and outflows ; therefore, 1 0stream inflows from the volcanic terrane weregaged continuously where they entered the lime-stone belt, and 12 stream outflow points from th elimestone were gaged as far downstream as possible .The difference between the discharge of the up-stream and downstream sites constitutes the con-tribution to streamflow from the limestone area .Rainfall and pan evaporation (potential evapora-tion) were obtained from the available data pub-lished by the National Weather Service, supple-mented by data from a few temporary sites to fil lsome gaps in the areal distribution of the existin gmeteorological network. Rainfall and pan evapora-tion data were collected at 25 and 5 sites respec-tively. About 40 wells were used to gather informa-tion on the water-table configuration .
GROUND WATER
WATER-TABLE LEVEL S
A contour map of the water-table surface i sshown on plate 1. River-bed altitudes were used ascontrol points in constructing this map . In thepattern of ground-water flow suggested by thes econtours, recharge in the topographically hig hareas moves radially outward toward the stream sand the coast. The streams, the swampy feature salong the coast, and to some extent the sea floo ritself thus all function as drains for the ground -water system. Within the most seaward part of the
Aymamón Limestone, the altitude of the wate rtable is just above mean sea level, with an averageslope of about 0 .0007, reflecting the high permeabil-ity of the Aymamón in this area . Southward thegradient steepens to about 0 .045 within a transitio nzone which varies locally, but that in general in-cludes the less permeable lower part of the Aymamó nand Aguada Limestone. The gradient flattens agai nto about 0 .003 within the Cibao Formation and th eLares Limestone, possibly indicating higher perm-eability or a smaller component of lateral ground -water movement .
ARTESIAN ZONE S
Until July 1968, the known aquifers in the areawere under water-table conditions, although condi-tions of local confinement had apparently been en -countered occasionally by well drillers . No large-yield flowing well had ever been drilled in the northcoast limestone belt ; however, no well deeper thanabout 250 m had ever been drilled in the area. InJuly 1968, a disposal well was drilled in the CruceDávila area of Barceloneta . To obtain permissionto use the well for disposal of certain industria leffluents, the law required that the well reach saltywater . Therefore, the well was drilled deeper tha nany other water well in Puerto Rico . At a depth ofabout 350 m below the surface the well penetrate da "crumbly limestone layer" from which waterflowed at a rate of 160 L/s (liters per second) wit habout 7 kg/cm' (kilograms per square centimeter) /of shut in pressure at the land surface . The waterwas fresh.
The artesian zone occurs within the Montebell oLimestone Member of the Cibao Formation which ,in the outcrop area, is a very pure chalky limestone .The driller's report indicates that a massive lime -stone layer was penetrated above the crumbly lime -stone of the artesian aquifer, while W. H. Monro e(written comanun., 1970) reports several meter sof clay above the artesian zone. Both types ofmaterial undoubtedly contribute to the confinementof the Montebello artesian zone .
A second artesian zone was found at a depth ofabout 500 m, in the Lares Limestone. Since 1968several more deep wells have been drilled in th esame vicinity ; all have penetrated the upper artesia nzone and some the lower zone . A first approximationto an average potentiometric surface for the arte-sian zones is shown in cross section C— C' of plate 2 .This surface was constructed by linear interpolationbetween an average water-table altitude in the
HYDROLOGY 23
Cibao-Lares outcrop area, and an average stati chead in the artesian wells at Cruce Dávila .
Drilling in the Tortuguero area in 1972 confirmedthe existence of a very limited artesian zone in theCibao in that area, together with a thick . and well-defined artesian zone in the Lares . However, onlyin the east-central part of the limestone belt, be-tween Río Grande de Arecibo and Río Cibuco, has i tbeen proved that ground water flows under wate rtable conditions within the Aymamón and possibly influence is probably small .the Aguada Limestones, and under artesian head appears in the logarithm, an error in K of only 10 0within the Montebello Member of the Cibao Forma-tion and the Lares Limestone. Elsewhere there isonly indirect evidence to indicate probable path sof flow.
Q= well discharge, in cubic meters per second ;S = drawdown, in meters ;
AI= screened or open intervals of the well, i nmeters ;
re = the radius of a plan view of the cone o fdepression, in meters, taken arbitraril yas 150 meters in all cases ; and
rw=radius of casing, in meters .
The error involved in using an assumed radius o fBecause the term re a
PERMEABILITY DISTRIBUTION AND GROUND-WATE RFLOW
To compute the ground-water flow requires aknowledge of the permeability of the aquifer, a swell as information on the head gradient and thecross-sectional area of the flow . These factors areutilized in Darcy's Law to compute the rate o fground-water flow, under the assumption that th eflow approximates uniform movement through aporous medium when considered on aregionalscale. Because of the possibility that in limestonethe flow may be concentrated locally in "pipes" oralong bedding planes or through fractures, Darcy' sLaw may not be applicable in a local sense . How-ever, at the scale of regional flow it is assume dthat the networks of solution pipes, fractures, an dbedding planes are interconnected and spaced so a sto approximate flow through a porous medium. Thedegree to which results from the application o fDarcy's Law agree with the water-budget evalua-tion will give an indication of the reasonableness ofthese assumptions.
Estimates of permeability for the water-pro-ducing intervals of the rocks were obtained usin gspecific capacity data from all wells in the north-coast limestone area for which information onlithology and well construction was available . Themethod of estimation was based on Thiem's equa-tion for steady-state radial flow to a pumping well ,and thus again involved the assumption that Darcy' sLaw was applicable in a general sense over the are aof influence of the well . The equation used wa s
K=37 log ie (7)SM rw
where
K= permeability, in centimeters per second ;
percent is introduced when re is in error by 1,00 0percent.
The permeability values computed in this wayranged from less than 10 —_1 cm/s (centimeter pe rsecond) to about 1 cm/s . The estimated averag epermeability south of Caño Tiburones is shown infigure 24. An estimate of the ground-water flo wthrough the area south of Caño Tiburones can bemade substituting the values for permeabilities fro mfigure 24 and the gradients from plate 2 in th eequation for Darcy's Law . For 1-kilometer widthofaquifer :
Q =10 K I t (8 )where
Q= discharge, in cubic meters per second ;K=permeability, in centimeters per second ;I = head gradient, dimensionless ; andt= thickness of aquifer, in meters .
For the Aymamón and Aguada Limestones, thehead gradient was taken as the water-table gradi-ent ; for the Cibao and Lares formations, the gradi-ent was taken as the difference between the aver -age water-table altitude in the Cibao-Lares outcro parea and the average artesian level in the wells a tCruce Dávila, divided by the distance of flow . Thedischarges for the various aquifers are as follows :
AymamónQ= 10x0 .2x0 .00095 x 60 = 0.11 mj/s
AguadaQ=10x0.02x0.00095x100=0 .02 m s
Cibao (Montebello Limestone Member )Q=10x0.005x0.0021x180=0 .02 m'/ s
LaresQ=10 x 0 .0002 x 0.0021x 75 = 0 .0003 m s /s
The flow through the entire limestone sectio nsouth of Caño Tiburones, calculated using a widthof 15 km (derived from the flow pattern shown o nplate 1), amounts to about 2.3 m/s or 0.15 m3 / sper kilometer width .
24 HYDROGEOLOGY OF THE KARST OF PUERTO RIC O
C C '
12 10 8 6 4 2
DISTANCE FROM COASTLINE, IN KILOMETERS
2 4
400
20 0
SEALEVEL
1000
1200
1400
20 0
40 0
60 0
800
FIGURE 24 .—Average permeability distribution within cross section C—C' through the Caño Tiburones area betweenpoints A and P . See plate 1 for location of cross section .
Similar calculations carried out for various sec-tions shown on plate 2 are summarized in table 1 .The results for the sections through the Río Cibucobasin, Laguna Tortuguero, Caño Tiburones, and theRío Camuy basin are more reliable than the result sfor the sections through the Río Guajataca basinand through the westernmost part of the belt, whichwere based on data projected from sections to th eeast . These results will be compared later in thi sreport with the budget results computed fromstreamflow and meteorological data.
The data in figure 24 clearly show a permeabilitydecrease from a high in the Aymamón to a low i nthe Lares . A plot showing all the computed perme-abilities as a function of stratigraphic depth, mea-
sured from the projected top of the Aymamón Lime -stone, is shown in figure 25 . The plot is semilog-arithmic, and the average straight line indicate san exponential decrease in permeability with strati -graphic depth . However, this relationship refersonly to the permeability of the aquifer intervals andshould not be inferred to mean a continuous changeof permeability with depth . Low permeability layer s—that is, aquitards (for which no permeabilit ycalculations were made)—are found intermixedwith the more permeable zones . The permeabilityof the massive limestone found on top of the arte-sian aquifers south of Caño Tiburones is orders ofmagnitude lower than that of either the overlyin gor the underlying layers .
HYDROLOG Y
TABLE 1 .-Ground-water flow of the north coast limestone s[Sections are shown on plate 2 1
Slop eFormation Thickness(meters)
Permeabilit y(cm/s)
Discharg e(m(/ s
per km wiath )
Vega Alta-La Plata
Aymamón Limestone 60 0 .00076 0 .1 0 .04 6Aguada Limestone 75 .00076 ? .02 .011Cibao Limestone 150 .0028 ? .002 .008Lares Limestone 130 .0028 ? .0005 .002
Total -- - ______ .067 .80 for 12 km
Manati.-Tortuguer o
Aymamón Limestone 90 0 .00057 0 .1 0 .051 0Aguada Limestone 60 .00057 ? .005 .002 0Cibao Limestone 170 .0028 .0005 .002 4Lares Limestone 110 .0028 ? .0002 .000 6
Total ------ .050_ 07 per 12 km
Arecibo-Barceloneta
Aymamón Limestone 60 0 .00095 0 .2 0 .114 0Aguada Limestone 100 .00095 ? .02 .019 0Cibao Formation 180 .0021 .005 .019 0Lares Limestone __________________ 75 .0021 " .0002 .00 0
Total -- - .1523=2 .28 for 16 km
Camuy-Arecib o
Aymamón Limestone 60 0 .001 0 .05 0 .0300Aguada Limestone 90 .001 .002 .001 8Cibao Limestone 170 .003 ° .001 .005 1Lares Limestone 300 .003 ? .0002 .001 8_________________ _
Total -- - .0387= .43 forL km
Guajataca-Camu y
Aymamón Limestone 60 0 .001 0 .02 0 .01 .2 0Aguada Limestone 90 .001 .002 .001 8Cibao Limestone 200 .003 .0005 ? .000 0Laves Limestone 300 .003 .0002 ? .001 8
Total .0180= _ .26 for ]_1 1 _t _
Aguadilla-Guajatac a
Aymamón Limestone 60 0 .001 .02 ? .012 0Aguada Limestone 90 .001 .002 ? .001 8Cibao Limestone 200 .001 ? .0005 ? .001 0
Total .0148_- .25 for 1i
NOTE : Total for entire belt = 4 .6 m'/s .
CROUND-WATER FLOW PATTERN S
The caves found in the karst of the north coas tbelt are almost invariably tunnellike and develo pfrom limestone solution along bedding planes . Asa result, the regional ground-water flow lines ten dto follow the bedding of the limestone layers dow ndip, presumably along preferential paths of highe rpermeability .
ARTESIAN FLOW PATTERN S
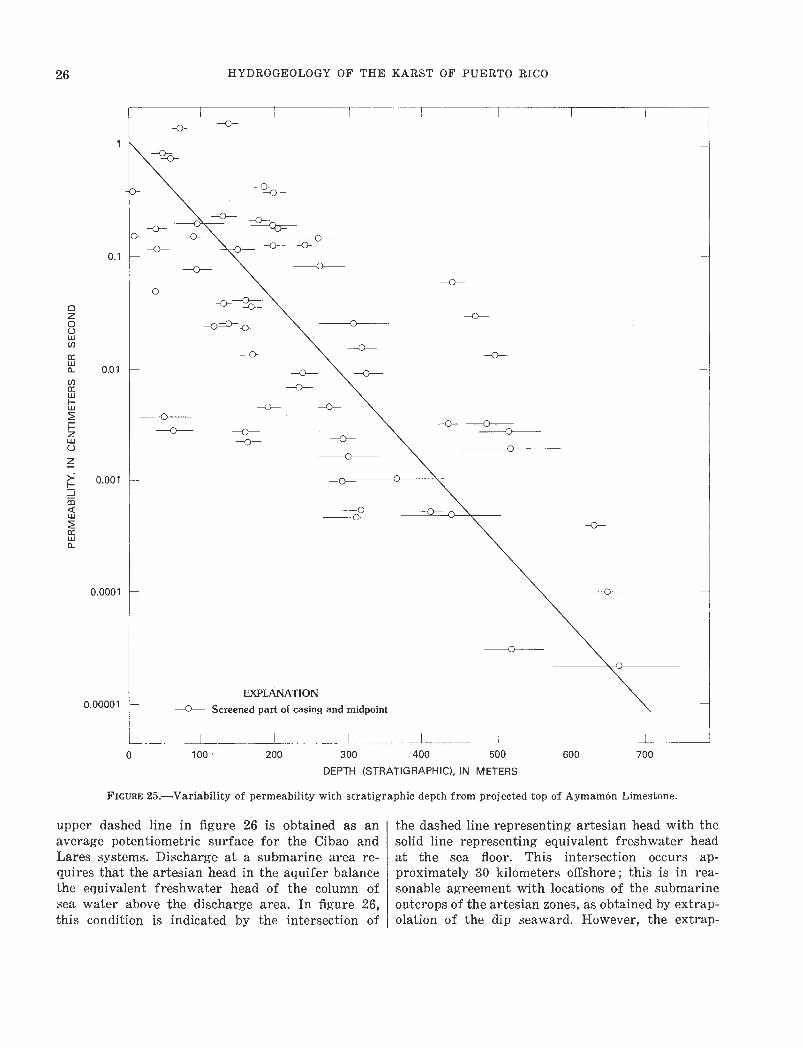
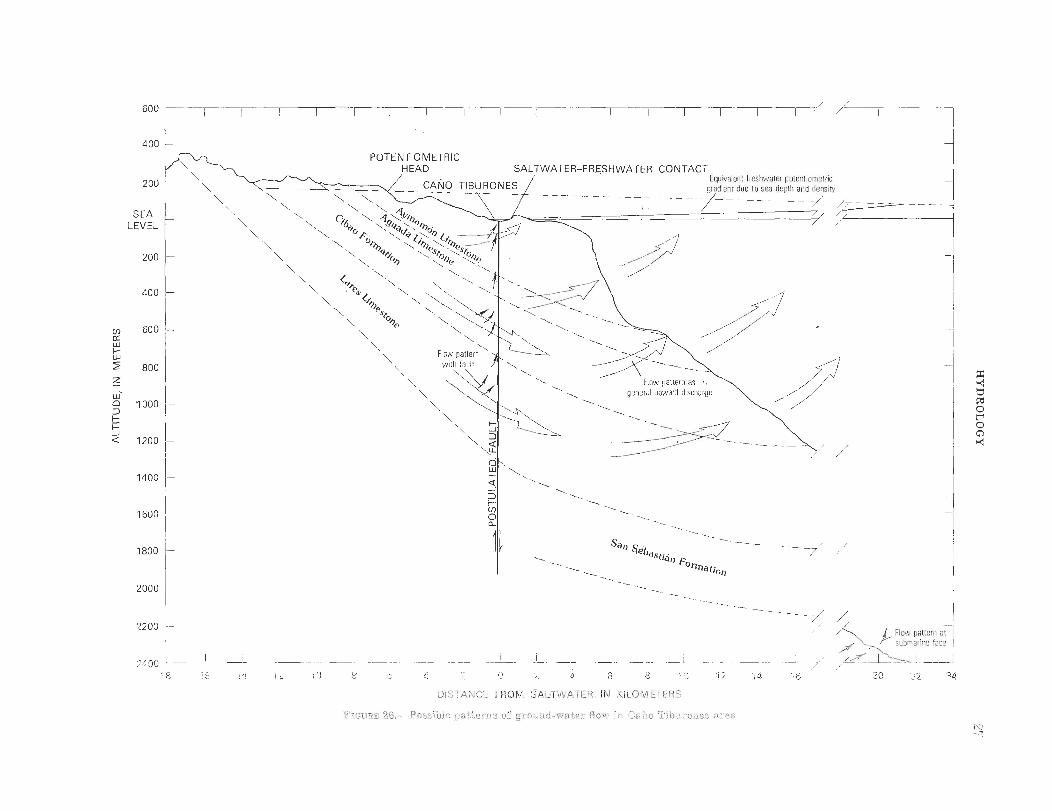
In the section through the Caflo Tiburones areain figure 26, three possible patterns of ground-wateroutflow from the artesian zones are illustrated . Thesimplest pattern is direct discharge to sea in asubmarine outflow area ; it is illustrated by thearrows in the lower right corner of figure 26 . Insuch submarine outflow, the ground water must dis-charge against the static head exerted by the column
of seawater above the outflow area. This head canbe measured in terms of an equivalent freshwate rpotentiometric head, defined as the height above se alevel to which freshwater would rise in a piezomete rinserted to the seabed. This equivalent freshwate rhead increases seaward as the depth of saltwate rincreases . The solid line above the sea surface i nfigure 26 shows the trend of the equivalent fresh -water head .
The potentiometric head of the artesian zonesbeneath the sea can presumably be found by ex -tending the artesian-head gradients measured o nland. Extensions of the potentiometric head of th eartesian aquifers seaward in this manlier involvesthe assumptions that there are no changes in perme-ability within the artesian zones and that there i sno gradual loss of flow from these zones by upwar dleakage. If these assumptions are satisfied, th e
26 HYDROGEOLOGY OF THE KARST OF PUERTO RIC O
-o-
-o-o
o -o-~
o -0--o- o
-o-
o
oo o
oo
o o
oe!,
o-o-
o
-o- o
0 . 1
<w
w
0.0001
o —o-o
-o -
o
EXPLANATION0 .00001 -0— Screened part of casing and midpoint
500 600 700
DEPTH (STRATIGRAPHIC), IN METER S
FIGURE 25 .-Variability of permeability with stratigraphic depth from projected top of Aymamón Limestone .
oI I L
100 200 300 40 0
upper dashed line in figure 26 is obtained as anaverage potentiometric surface for the Cibao andLares systems. Discharge at a submarine area re -quires that the artesian head in the aquifer balanc ethe equivalent freshwater head of the column ofsea water above the discharge area . In figure 26 ,this condition is indicated by the intersection of
the dashed line representing artesian head with th esolid line representing equivalent freshwater hea dat the sea floor . This intersection occurs ap-proximately 30 kilometers offshore ; this is in rea-sonable agreement with locations of the submarineoutcrops of the artesian zones, as obtained by extrap -olation of the dip seaward. However, the extrap-
60 0
400
V A \N NN
\\ \ q \y~hd\ CEdo \g~dQ\ pióo\ \ A£ r
N Nor~ \ é\`hes
\ \ d~~o s'to4loo p
\ \\ •Ps, \
\ ¿% N\ ~PS~ N\ 0e N
\ \ N
\\ Row patternwith fault
Flow pattern asgeneral upward discharg e
~00 0
1200
1400
1600--
Sal). 4eb ~~as tian Fonglatio n
200 0
20 0
SEALEVE L
20 0
400
ROTENTIOMETRI CHEAD SALTWATER—FRESHWATER CONTACT
CAÑO TIBURONESEquivalent freshwater posen lometri c
gradient due to sea depth and densit
N
60 0
80 0
180 0
2200
2.400
Flow pat :i : •'i-hn
e 8
TER IN KILOiVIET" R
28 HYDROGEOLOGY OF THE KARST OF PUERTO RIC O
olation of head gradients and geologic dips fo rtens of kilometers is questionable, and this agree-ment may be no more than fortuitous .
A second possible pattern of ground-water dis-charge is shown by the large arrows in figure 26 .
If the permeability of the artesian zones decreasesseaward, the head gradient in the aquifer canno tbe linear, and the above extrapolation of head swould not be valid. Rather, the loss in head pe rkilometer would increase seaward, and the artesianhead would be dissipated much closer to shore tha n30 km. If a permeability decrease were gradualwith distance and with the stratigraphic depth, th eresult would probably be a widespread upward dis-charge of ground water through the confining bed s(large arrows of figure 26) . Some of this upwardseepage would probably escape through the se afloor and some through discharge areas on land .
A third possible pattern of discharge is relatedto the faulting postulated by Briggs (1961) in theCaño Tiburones area. Such faulting would presum-ably have thrown rock of low permeability agains tthe artesian zones, and the barrier so created woul dblock or impede flow seaward and force dischargeupward. It is possible that fracturing associatedwith the postulated faulting could have produceda zone of high vertical permeability along the faul ttrace, creating conditions favorable to vertical out-flow. The pattern of ground-water flow that migh tresult from these conditions is shown by the smal lsolid arrows in figure 26.
WATER-TABLE FLOW PATTERN S
Throughout the limestone area, but particularl yeast of Arecibo, ground water under water-tableconditions discharges through springs and by area lseepage, either directly to sea or to the swampyareas along the coast . These swampy areas dis-charge, in turn, by evapotranspiration or by sur -face drainage to the sea .
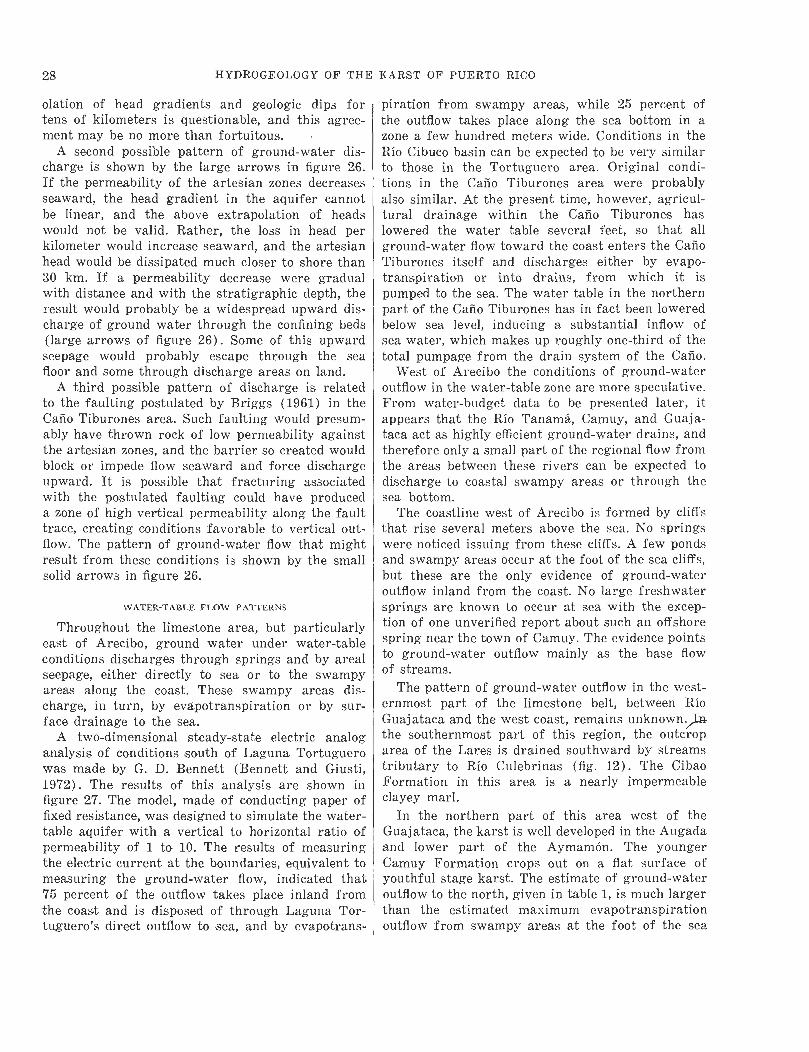
A two-dimensional steady-state electric analoganalysis of conditions ,south of Laguna Tortuguerowas made by G. D. Bennett (Bennett and Giusti ,1972) . The results of this analysis are shown infigure 27. The model, made of conducting paper offixed resistance, was designed to simulate the water-table aquifer with a vertical to horizontal ratio o fpermeability of 1 to 10 . The results of measuringthe electric current at the boundaries, equivalent tomeasuring the ground-water flow, indicated tha t75 percent of the outflow takes place inland fro mthe coast and is disposed of through Laguna Tor-tuguero's direct outflow to sea, and by evapotrans -
piration from swampy areas, while 25 percent ofthe outflow takes place along the sea bottom in azone a few hundred meters wide . Conditions in th eRío Cibuco basin can be expected to be very simila rto those in the Tortuguero area . Original condi-tions in the Caño Tiburones area were probablyalso similar. At the present time, however, agricul-tural drainage within the Caño Tiburones haslowered the water table several feet, so that al lground-water flow toward the coast enters the CañoTiburones itself and discharges either by evapo-transpiration or into drains, from which it i spumped to the sea . The water table in the norther npart of the Caño Tiburones has in fact been loweredbelow sea level, inducing a substantial inflow ofsea water, which makes up roughly one-third of th etotal pumpage from the drain system of the Caño .
West of Arecibo the conditions of ground-wate routflow in the water-table zone are more speculative .From water-budget data to be presented later, i tappears that the Río Tanamá, Camuy, and Guaja -taca act as highly efficient ground-water drains, an dtherefore only a small part of the regional flow fro mthe areas between these rivers can be expected t odischarge to coastal swampy areas or through th esea bottom .
The coastline west of Arecibo is formed by cliff sthat rise several meters above the sea . No springswere noticed issuing from these cliffs . A few pondsand swampy areas occur at the foot of the sea cliffs ,but these are the only evidence of ground-wate routflow inland from the coast . No large freshwatersprings are known to occur at sea with the excep-tion of one unverified report about such an offshor espring near the town of Camuy . The evidence pointsto ground-water outflow mainly as the base flowof streams .
The pattern of ground-water outflow in the west-ernmost part of the limestone belt, between RíoGuajataca and the west coast, remains unknown -the southernmost part of this region, the outcro parea of the Lares is drained southward by stream stributary to Río Culebrinas (fig . 12) . The CibaoFormation in this area is a nearly impermeabl eclayey marl .
In the northern part of this area west of th eGuajataca, the karst is well developed in the Augad aand lower part of the Aymamón . The youngerCamuy Formation crops out on a flat surface o fyouthful stage karst. The estimate of ground-wate routflow to the north, given in table 1, is much large rthan the estimated maximum evapotranspirationoutflow from swampy areas at the foot of the sea
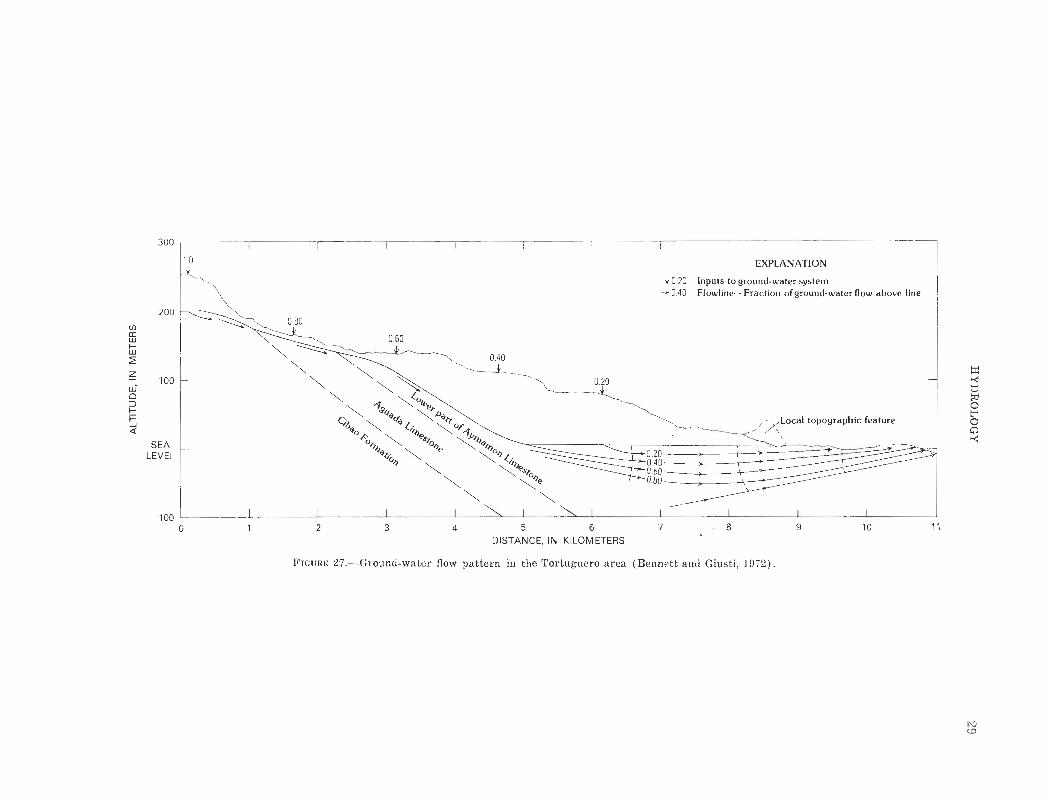
--7
EXPLANATIO N
0 .20 Inputs to ground-water syste mX0 .40 Flowline—Fraction of ground-water flow above line
3 4 5 6DISTANCE, IN KILOMETER S
FIGURE 27 .—Ground-water flow pattern in the Tortuguero area (Bennett and Giusti, 1972) .
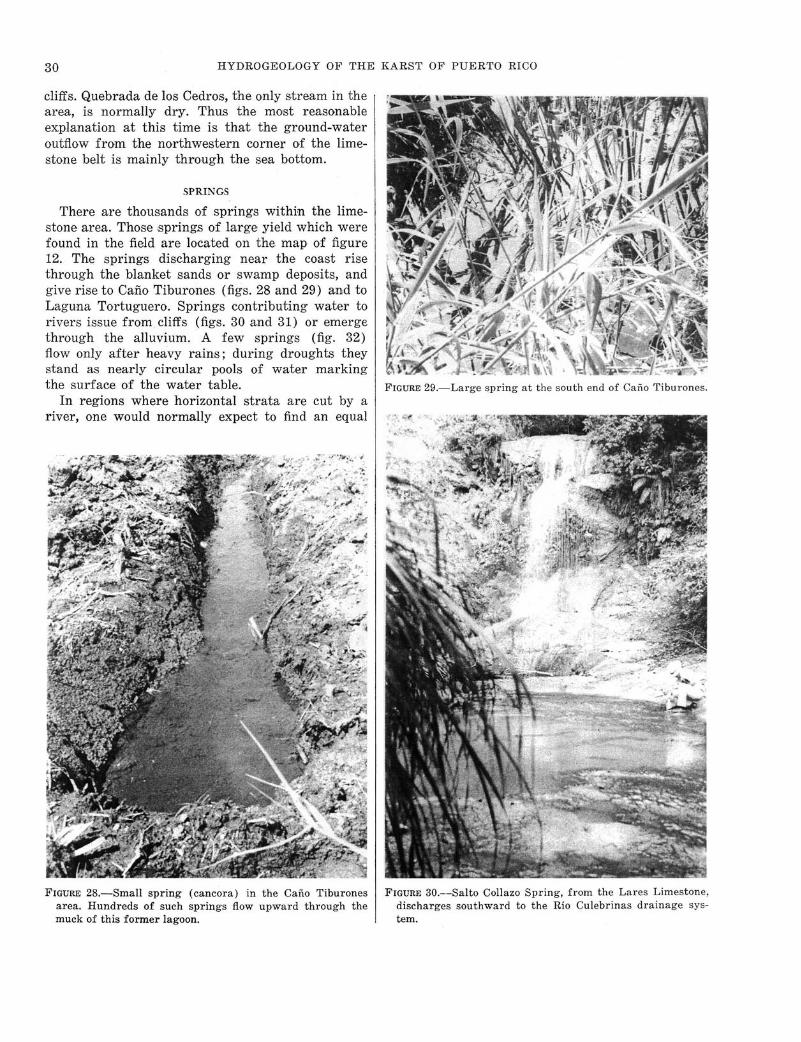
30 HYDROGEOLOGY OF THE KARST OF PUERTO RIC O
cliffs . Quebrada de los Cedros, the only stream in th earea, is normally dry. Thus the most reasonabl eexplanation at this time is that the ground-wateroutflow from the northwestern corner of the lime -stone belt is mainly through the sea bottom.
SPRINGS
There are thousands of springs within the lime -stone area . Those springs of large yield which werefound in the field are located on the map of figure12 . The springs discharging near the coast ris ethrough the blanket sands or swamp deposits, an dgive rise to Caño Tiburones (figs. 28 and 29) and t oLaguna Tortuguero . Springs contributing water torivers issue from cliffs (figs. 30 and 31) or emerg ethrough the alluvium. A few springs (fig . 32)flow only after heavy rains ; during droughts theystand as nearly circular pools of water markingthe surface of the water table .
In regions where horizontal strata are cut by ariver, one would normally expect to find an equal
FIGURE 28 .-Small spring (cancora) in the Caño Tiburone sarea . Hundreds of such springs flow upward through themuck of this former lagoon .
f k
. S ~w.,
?II•., sí ~ ~ ~ ~
`
,*_ ~ ~sc \ ,
% L~ ~ ~ • ,'~.
~ ~ — , . —
FIGURE 29 .-Large spring at the south end of Caño Tiburones .
FIGURE 30 .--Salto Collazo Spring, from the Lares Limestone ,discharges southward to the Río Culebrinas drainage sys-tem.
S á*r
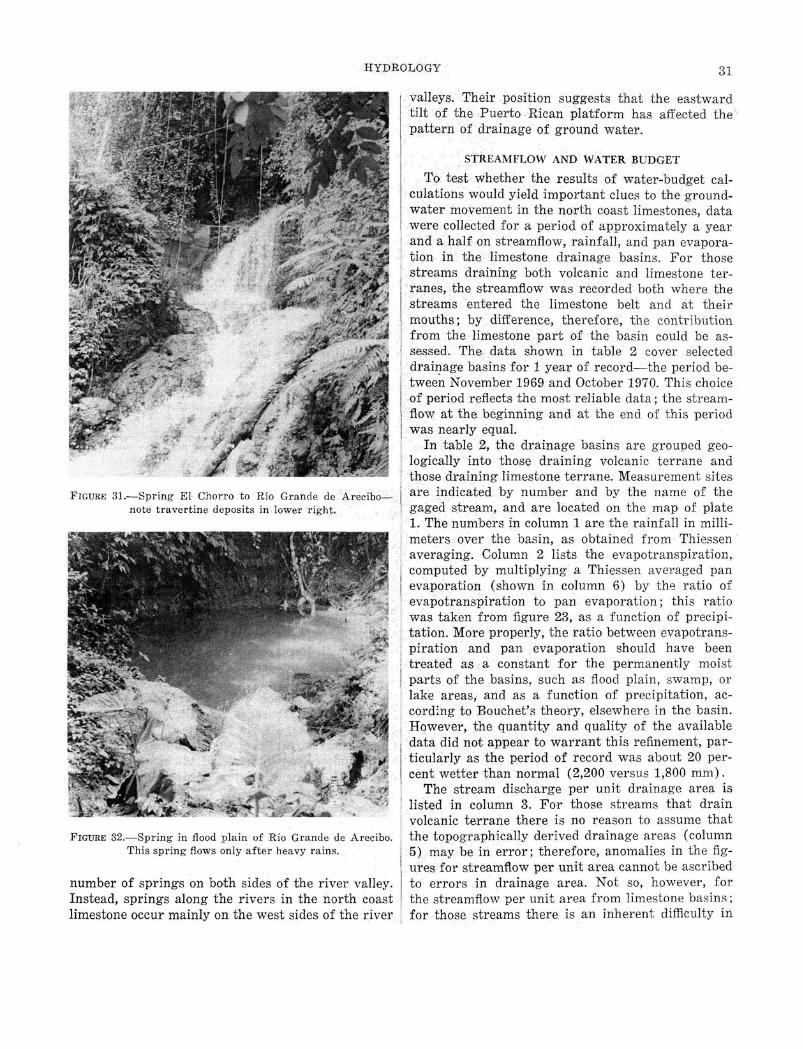
HYDROLOG Y 31
valleys . Their position suggests that the eastwar d tilt of the Puerto Rican platform has affected th e pattern of drainage of ground water.
STREAMFLOW AND WATER BUDGET
To test whether the results of water-budget calculations would yield important clues to the ground water movement in the north coast limestones, dat a were collected for a period of approximately a year and a half on streamflow, rainfall, and pan evaporation in the limestone drainage basins . For those streams draining both volcanic and limestone ter
¡ ranes, the streamflow was recorded both where the
FIGURE 31 . —Spring El Chorro to Río Grande de Arecibo-note travertine deposits in lower right .
_ :T - • —
'_ X ;
~ ~.}k1LL . . .~
FIGURE 32 .-Spring in flood plain of Rio Grande de Arecibo . This spring flows only after heavy rains .
streams entered the limestone belt and at thei r mouths ; by difference, therefore, the contribution from the limestone part of the basin could be assessed. The data shown in table 2 cover selecte d drainage basins for 1 year of record—the period between November 1969 and October 1970 . This choic e of period reflects the most reliable data ; the stream-flow at the beginning and at the end of this perio d was nearly equal .
In table 2, the drainage basins are grouped geologically into those draining volcanic terrane an d those draining limestone terrane . Measurement sites are indicated by number and by the name of th e gaged stream, and are located on the map of plate 1 . The numbers in column 1 are the rainfall in milli meters over the basin, as obtained from Thiesse n averaging . Column 2 lists the evapotranspiration , computed by multiplying a Thiessen averaged pa n evaporation (shown in column 6) by the ratio o f evapotranspiration to pan evaporation ; this rati o was taken from figure 23, as a function of precipitation. More properly, the ratio between evapotranspiration and pan evaporation should have bee n treated as a constant for the permanently moist parts of the basins, such as flood plain, swamp, o r lake areas, and as a function of precipitation, ac cording to Bouchet's theory, elsewhere in the basin . However, the quantity and quality of the availabl e data did not appear to warrant this refinement, particularly as the period of record was about 20 per cent wetter than normal (2,200 versus 1,800 mm )
The stream discharge per unit drainage area is listed in column 3 . For those streams that drai n volcanic terrane there is no reason to assume tha t the topographically derived drainage areas (column 5) may be in error ; therefore, anomalies in the figures for streamflow per unit area cannot be ascribed
number of springs on both sides of the river valley . to errors in drainage area . Not so, however, for Instead, springs along the rivers in the north coast the streamflow per unit area from limestone basins ;
inlimestone occur mainly on the west sides of the river for those streams there is an inherent difficulty
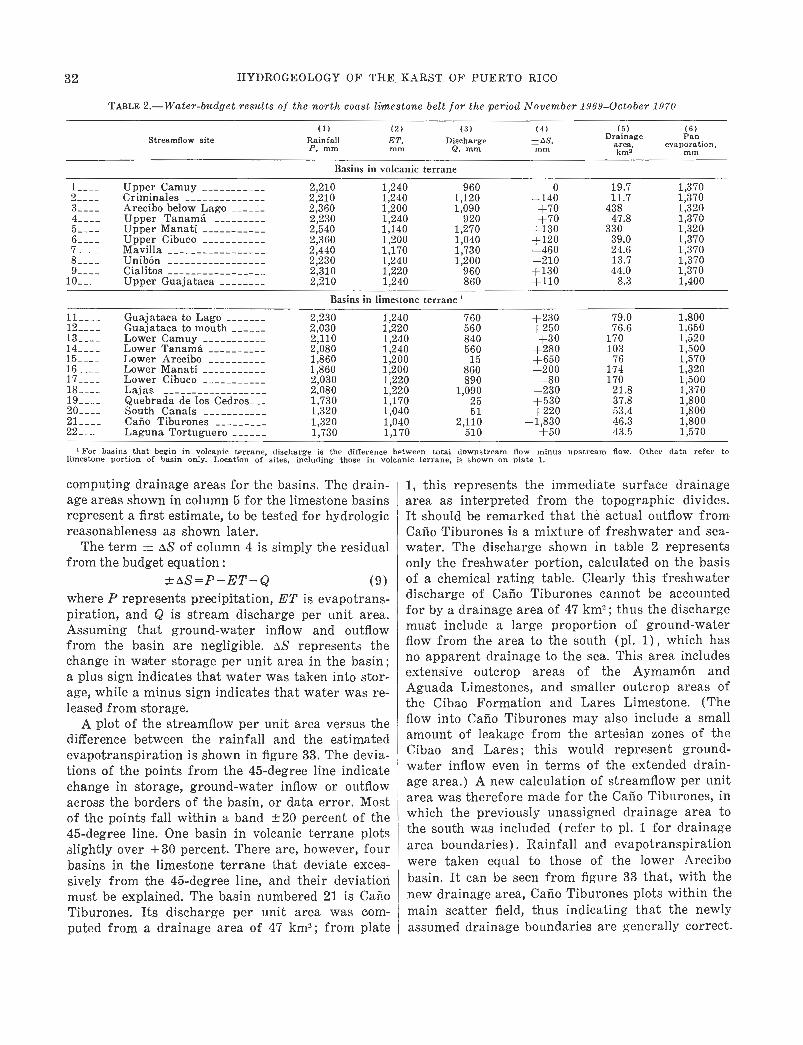
32 HYDROGEOLOGY OF THE KARST OF PUERTO RICO
TABLE 2 .-Water-budget results of the north coast limestone belt for the period November 1969-October 197 0
(1) (2) (3) (4) (5 )Drainage
(6 )Pa n
Streamflow site RainfallP, mm
ET,mm
DischargeQ, mm
±AS,mm
area ,km'
evaporation ,mm
Basins in volcanic terran e
Upper Camuy 2,210 1,240 960 0 19 .7 1,37 02____ Criminales 2,210 1,240 1,120 -140 11 .7 1,37 0
Arecibo below Lago 2,360 1,200 1,090 +70 438 1,32 04____ Upper Tanamá 2,230 1,240 920 +70 47 .8 1,37 0
Upper Manatí 2,540 1,140 1,270 +130 330 1,32 06____ Upper Cibuco 2,360 1,200 1,040 +120 39.0 1,37 07____ Mavilla 2,440 1,170 1,730 -460 24 .6 1,3708____ Unibón 2,230 1,240 1,200 -210 13 .7 1,37 0
Cialitos 2,310 1,220 960 +130 44 .0 1,37 0Upper Guajataca 2,210 1,240 860 +110 8 .3 1,40 0
Basins in limestone terran e
11____ Guajataca to Lago 2,230 1,240 760 +230 79 .0 1,80 012____ Guajataca to mouth 2,030 1,220 560 +250 76 .6 1,65 013____ Lower Camuy 2,110 1,240 840 +30 170 1,52 0
Lower Tanamá 2,080 1,240 560 +280 103 1,50 015____ Lower Arecibo 1,860 1,200 15 +650 76 1,57016____ Lower Manatí 1,860 1,200 860 -200 174 1,32 017____ Lower Cibuco 2,030 1,220 890 -80 170 1,50 018____ Lajas 2,080 1,220 1,090 -230 21 .8 1,37 019____ Quebrada de los Cedros 1,730 1,170 25 +530 37 .8 1,800
South Canals 1,320 1,040 51 +220 53 .4 1,80 021____ Caño Tiburones 1,320 1,040 2,110 -1,830 46 .3 1,80 022____ Laguna Tortuguero 1,730 1,170 510 +50 43 .5 1,57 0
' For basins that begin in volcanic terrane, discharge is the difference between total downstream flow minus upstream flow . Other data refer t olimestone portion of basin only. Location of sites, including those in volcanic terrane, is shown on plate 1 .
computing drainage areas for the basins . The drain -age areas shown in column 5 for the limestone basinsrepresent a first estimate, to be tested for hydrologi creasonableness as shown later.
The term ± AS of column 4 is simply the residua lfrom the budget equation :
±OS=P-ET-Q (9 )where P represents precipitation, ET is evapotrans -piration, and Q is stream discharge per unit area .Assuming that ground-water inflow and outflo wfrom the basin are negligible . AS represents thechange in water storage per unit area in the basin ;a plus sign indicates that water was taken into stor-age, while a minus sign indicates that water was re-leased from storage .
A plot of the streamflow per unit area versus th edifference between the rainfall and the estimate devapotranspiration is shown in figure 33 . The devia-tions of the points from the 45-degree line indicat echange in storage, ground-water inflow or outflo wacross the borders of the basin, or data error . Mos tof the points fall within a band ± 20 percent of th e45-degree line. One basin in volcanic terrane plot sslightly over +30 percent. There are, however, fourbasins in the limestone terrane that deviate exces-sively from the 45-degree line, and their deviationmust be explained. The basin numbered 21 is CañoTiburones . Its discharge per unit area was com-puted from a drainage area of 47 km 2 ; from plate
1, this represents the immediate surface drainagearea as interpreted from the topographic divides .It should be remarked that the actual outflow fro mCaño Tiburones is a mixture of freshwater and sea-water . The discharge shown in table 2 representsonly the freshwater portion, calculated on the basi sof a chemical rating table . Clearly this freshwaterdischarge of Caño Tiburones cannot be accounte dfor by a drainage area of 47 km" ; thus the dischargemust include a large proportion of ground-wate rflow from the area to the south (pl . 1), which ha sno apparent drainage to the sea. This area include sextensive outcrop areas of the Aymamón an dAguada Limestones, and smaller outcrop areas o fthe Cibao Formation and Lares Limestone. (Theflow into Caño Tiburones may also include a smallamount of leakage from the artesian zones of th eCibao and Lares ; this would represent ground -water inflow even in terms of the extended drain -age area.) A new calculation of streamflow per unitarea was therefore made for the Caño Tiburones, inwhich the previously unassigned drainage area t othe south was included (refer to pl . 1 for drainagearea boundaries) . Rainfall and evapotranspiratio nwere taken equal to those of the lower Arecib o
basin. It can be seen from figure 33 that, with the
new drainage area, Caño Tiburones plots within themain scatter field, thus indicating that the newlyassumed drainage boundaries are generally correct .
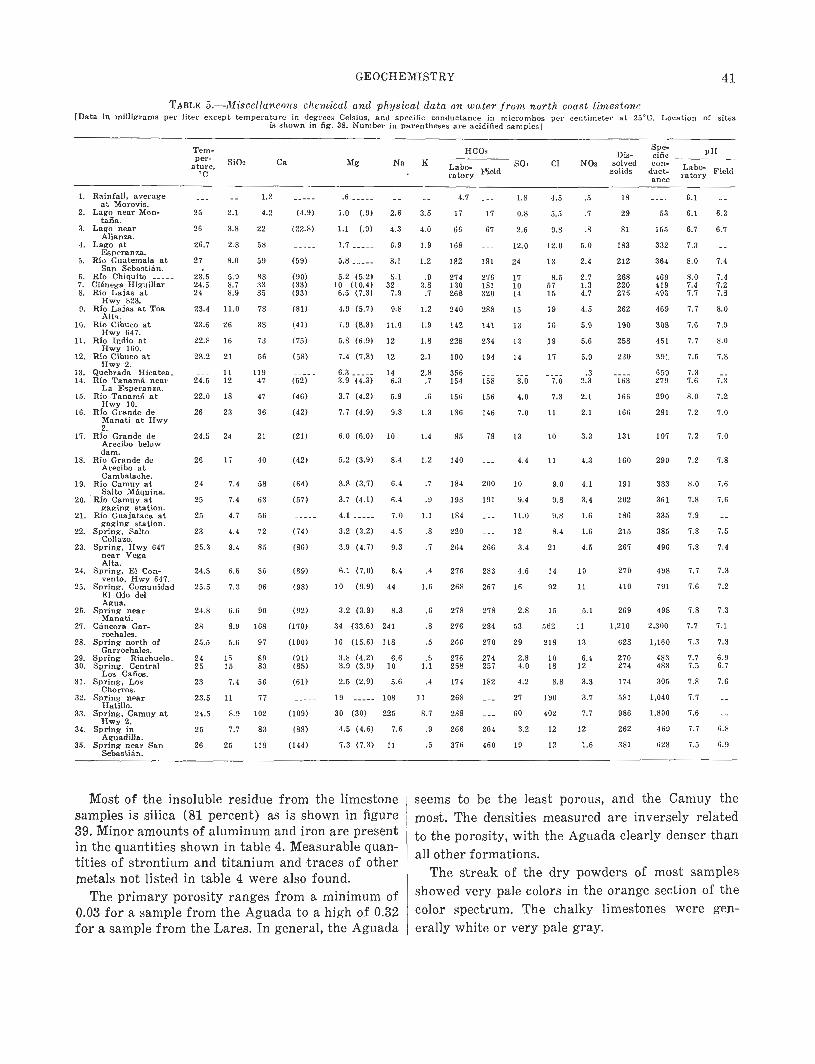
GEOCHEMISTRY 41
TABLE 5 . Miscellaneous chemical and physical data on water from north coast limeston e[Data in milligrams per liter except temperature in degrees Celsius, and specific conductance in micromhos per centimeter at 25°C . Location of site s
is shown in fig . 38 . Number in parentheses are acidified samples )
Tem- HCOs Dis-Spe-cific p H
per -ature ,
'CSiO, Ca Mg Na K Lobo-
ratory FieldSO1 CI NOa solved
solidscon-
duet-ance
Lobo-ratory Field
1 . Rainfall, average ___ 1 .2 _____ .6 1 .8 4 .5 .5 18 6 . 1
2.at Morovis.
Lago near Mon- 25 2 .1 4 .2 (4 .9) 1 .0 ( .9) 2 .6 3 .5 17 17 0 .8 5 .5 .7 29 53 6 .1 6 . 3
3 .taña .
Lago near 26 3 .8 22 (22 .8) 1 .1 ( .9) 4 .3 4 .0 66 67 2.6 9 .8 .8 81 155 6.7 6. 7Alianza .
26 .7 2 .8 58 _____ 1 .7 6 .9 1 .9 168 12 .0 12 .0 5.0 183 332 7 . 34 . Lago a t
5 .Esperanza.
Río Guatemala at 27 8 .0 59 (59) 5 .8 8 .1 1 .2 182 181 24 13 2 .4 212 364 8 .0 7 . 4
6.San Sebastián.
Rfo Chiquito _ __ 23 .5 5 .9 88 (90) 5 .2 (5 .2) 5 .1 .9 274 276 17 8 .5 2 .7 268 469 8 .0 7 . 47 . Ciénega Higuillar__ 24 .5 8 .7 33 (33) 10 (10 .4) 32 3.8 130 181 10 57 1 .3 220 419 7 .4 7 . 28. Rio Lajas at 24 8 .9 85 (93) 6 .5 (7 .3) 7 .9 .7 268 320 14 15 4 .7 275 493 7 .7 7 . 8
Hwy 823 .9 . Rfo Lajas at Toa 23 .4 11 .0 78 (81) 4 .9 (5.7) 9.8 1 .2 240 288 15 19 4 .5 262 469 7 .7 8 . 0
10 .Alta .
Río Cibuco at 23 .6 26 38 (41) 7 .9 (8.3) 11 .0 1.9 142 141 13 16 5 .9 190 308 7 .6 7 . 9Hwy 647 .
11 . Rfo Indio at 22 .8 16 73 (75) 5 .8 (6 .9) 12 1.8 228 234 13 19 5 .6 258 451 7 .7 8 . 0Hwy 160 .
12 . Río Cibuco at 23.2 21 56 (58) 7.4 (7 .8) 12 2 .1 190 194 14 17 5.9 230 391 7 .6 7 .8
13 .Hwy 2 .
Quebrada Hicatea_ ___ 11 119 _____ 6 .3 14 2 .8 356 .3 659 7. 314 . Río Tanamá near 24 .5 12 47 (52) 3 .9 (4 .3) 6 .3 .7 154 158 8 .0 7 .0 2 .3 163 279 7 .6 7 . 3
15 .La Esperanza .
Rio Tanamá at 22 .0 18 47 (46) 3 .7 (4.2) 5.9 .6 156 156 4.0 7.3 2 .1 166 290 8 .0 7. 2
16 .Hwy 10 .
Rfo Grande de 26 23 36 (42) 7.7 (4 .9) 9 .8 1 .3 136 146 7 .0 11 2 .1 166 281 7.2 7 . 0Manatí at Hwy2 .
17. Rfo Grande de 24 .5 24 21 (21) 6 .0 (6 .0) 10 1 .4 85 78 13 10 3 .3 131 197 7 .2 7 . 0
18 .
Arecibo belowdam .
Río Grande de 26 17 40 (42) 5 .2 (3 .9) 8 .4 1 .2 140 4 .4 11 4 .3 160 290 7 .2 7 . 8
19.
Arecibo a tCambalache .
Rio Camuy at 24 7 .4 58 (64) 3 .8 (3 .7) 6 .4 .7 184 200 10 9 .0 4 .1 191 333 8 .0 7 . 6
20 .Salto Máquina.
Rfo Camuy at 25 7 .4 63 (57) 3 .7 (4 .1) 6 .4 .9 198 191 9 .4 9 .8 3 .4 202 361 7 .8 7 . 6
21 .gaging station.
Río Guajataca at 25 4 .7 56 _____ 4 .1 7.0 1 .1 184 11 .0 9 .8 1 .6 186 335 7 . 9
22.gaging station.
Spring, Salto 23 4 .4 72 (74) 3 .2 (3 .2) 4 .5 .8 220 __5 12 8 .4 1 .6 215 385 7 .8 7 . 5
23 .Collazo.
Spring, Hwy 647 25 .3 9 .4 85 (86) 3 .9 (4.7) 9.3 .7 264 266 3.4 21 4 .5 267 496 7.8 7. 4
24 .
near VegaAlta .
Spring, El Con- 24 .5 6 .6 86 (89) 6.1 (7 .0) 6.4 .4 276 283 4.6 14 10 270 498 7 .7 7 . 3vento, Hwy 647 .
25 .5 7 .3 96 (98) 44 1 .6 268 267 16 92 11 410 791 7 .6 7 . 225 . Spring . Comunidad 10 (9.9 )El Ojo del
24 .8 6 .6 90 (92) 3.2 (3.9) 8 .3 278 278 2 .8 15 5 .1 269 498 7 .8 7 . 3Agua .
26 . Spring nea r
27 .Manatí .
Cáncora Gar- 28 8 .9 168 (170) 34 (33.6) 241 .8 276 284 53 562 11 1,210 2,300 7.7 7 . 1
28 .rochales .
Spring north of 25 .5 5 .6 97 (100) 16 (15 .6) 118 .5 266 270 29 218 13 628 1,160 7 .3 7 . 3Garrochales .
24 15 89 (91) 3 .8 (4.2) 6 .6 .5 276 274 2 .8 10 6.4 270 483 7.7 6. 929 . Spring Riachuelo _30. Spring, Central 25 15 83 (85) 3.9 (3 .9) 10 1 .1 258 257 4 .0 18 12 274 483 7 .5 6 . 7
Los Caños .23 7 .4 56 (61) 2.5 (2 .9) 5 .6 .4 174 182 4 .2 8 .8 3 .3 174 305 7 .8 7 . 631 . Spring, Los
Chorros .23.5 11 77 _____ 19 108 11 268 27 190 3 .7 581 1,040 7 . 732 . Spring near
33 .Hatillo.
Spring, Camuy at 24 .5 8 .9 102 (109) 30 (30) 225 8 .7 288 60 402 7 .7 986 1,800 7 .6 5 _
34 .Hwy 2 .
Spring in 25 7 .7 83 (88) 4.5 (4 .6) 7 .6 .9 266 264 3 .2 12 12 262 469 7 .7 6 . 8
35 .Aguadilla .
Spring near San 26 25 119 (144) 7.3 (7 .3) 11 .5 376 460 19 12 1 .6 381 628 7 .5 6 . 9Sebastián .
Most of the insoluble residue from the limestonesamples is silica (81 percent) as is shown in figur e39. Minor amounts of aluminum and iron are presen tin the quantities shown in table 4 . Measurable quan-tities of strontium and titanium and traces of othe rmetals not listed in table 4 were also found .
The primary porosity ranges from a minimum o f0.03 for a sample from the Aguada to a high of 0 .3 2fora sample from the Lares . In general, the Aguada
seems to be the least porous, and the Camuy th e
most . The densities measured are inversely related
to the porosity, with the Aguada clearly denser than
all other formations .The streak of the dry powders of most sample s
showed very pale colors in the orange section of the
color spectrum. The chalky limestones were gen-
erally white or very pale gray .
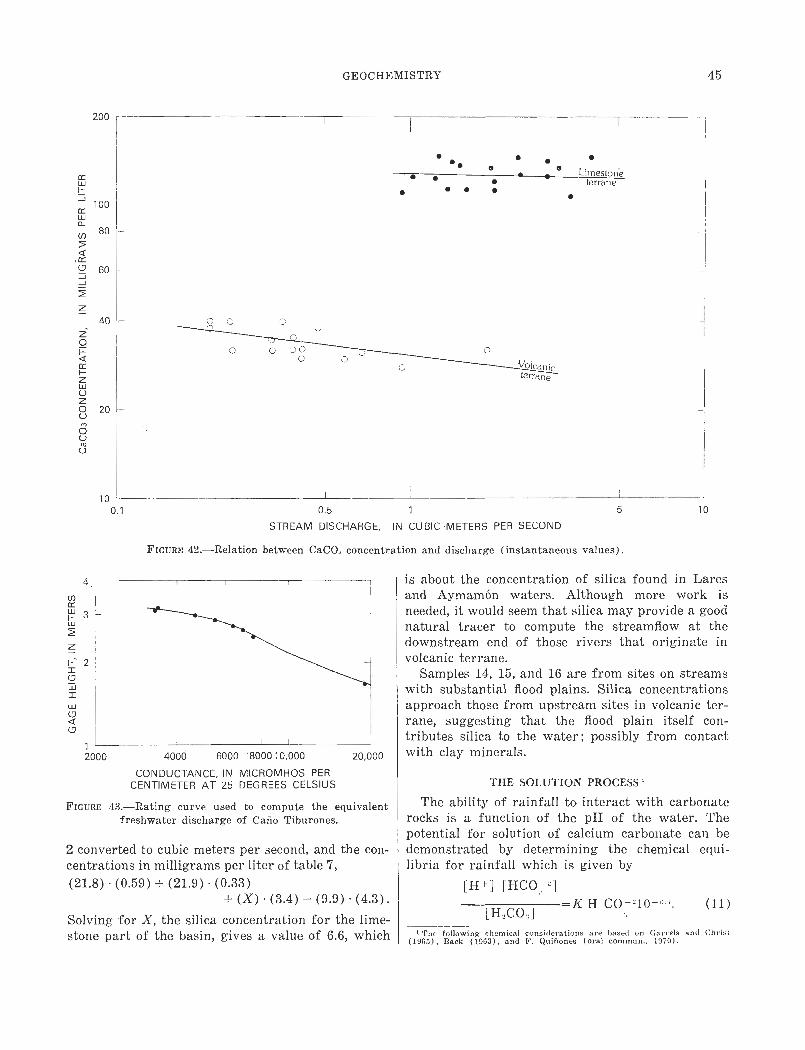
GEOCHEMISTRY 45
200
• • o •® • ® ®
• Limestone~ ® • ®• terran eÑ ~ • •~ 10 0wo_
8 0<n
Q[coc7 6 0JJ_
z_40
zO
O JC
Volcani cterran e
100 .1 0 .5 1 5 1 0
STREAM DISCHARGE, IN CUBIC METERS PER SECON D
FIGURE 42 .-Relation between CaCO., concentration and discharge (instantaneous values) .
is about the concentration of silica found in Laresand Aymamón waters. Although more work i sneeded, it would seem that silica may provide a goo dnatural tracer to compute the streamflow at th edownstream end of those rivers that originate i nvolcanic terrane .
Samples 14, 15, and 16 are from sites on stream swith substantial flood plains . Silica concentrationsapproach those from upstream sites in volcanic ter-rane, suggesting that the flood plain itself con-tributes silica to the water ; possibly from contac twith clay minerals .
THE SOLUTION PROCESS '
wc~ac~
1 i
2000 4000 6000 '800010,000 20,000
CONDUCTANCE, IN MICROMHOS PE RCENTIMETER AT 25 DEGREES CELSIU S
FIGURE 43 .-Rating curve used to compute the equivalen tfreshwater discharge of Caño Tiburones.
2 converted to cubic meters per second, and the con -centrations in milligrams per liter of table 7 ,(21.8) . (0 .59) + (21 .9) - (0 .33 )
+(X)•(3.4)=(9 .9)•(4.3) .
Solving for X, the silica concentration for the lime -stone part of the basin, gives a value of 6 .6, which
The ability of rainfall to interact with carbonaterocks is a function of the pH of the water . Thepotential for solution of calcium carbonate can b edemonstrated by determining the chemical equi-libria for rainfall which is given b y
[H +] [HCO--] =K H CO- 2 10 (11 )
1-H,CO' The following chemical considerations are based on Carrels and Chris t
(1965), Back (1963), and F . quiñones (oral commun ., 1970) .
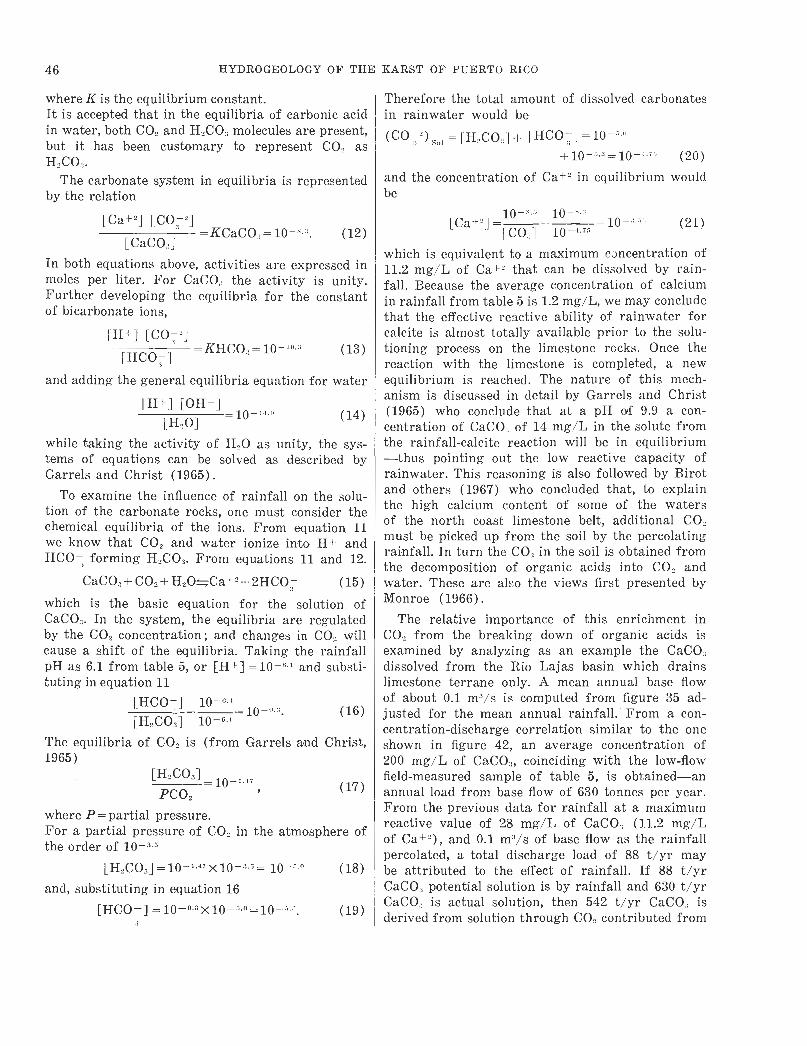
46 HYDROGEOLOGY OF THE KARST OF PUERTO RIC O
where K is the equilibrium constant .It is accepted that in the equilibria of carbonic aci din water, both C O 2 and H_CO„ molecules are present ,but it has been customary to represent CO, a sH,CO 3 .
The carbonate system in equilibria is represente dby the relation
[CaCO :, ]
In both equations above, activities are expressed i nmoles per liter . For CaCO, the activity is unity .Further developing the equilibria for the constan tof bicarbonate ions ,
[H+ ] [C0 :á 2 ]=KHCO=10 -1° . 3
[HCOS ]
and adding the general equilibria equation for wate r
[H+ ] [O H- ]=10 -14 .° (14)[H20]
while taking the activity of H 2 O as unity, the sys-tems of equations can be solved as described byGarrels and Christ (1965) .
To examine the influence of rainfall on the solu-tion of the carbonate rocks, one must consider th echemical equilibria of the ions . From equation 1 1we know that CO2 and water ionize into H+ andHCO-; forming H 2 CO 3 . From equations 11 and 12 .
CaCO 3 +CO3 +HIO±Ca+2+2HCO (15 )
which is the basic equation for the solution o fCaCO 4, . In the system, the equilibria are regulate dby the CO, concentration ; and changes in CO, willcause a shift of the equilibria . Taking the rainfal lpH as 6 .1 from table 5, or [H+] =10-(i .1 and substi-tuting in equation 1 1
[HCO-] 10_-10 ° .3 . (16)[H2 CO 3] 10- 6 - '
The equilibria of CO 2 is (from Garrels and Christ,1965)
PCO2=10 -1 .47
(17 )
where P = partial pressure .For a partial pressure of CO 2 in the atmosphere o fthe order of 10-3 . 5
[H2 CO3]=10- 1 .47 x10 -3.5= 10 (18 )
and, substituting in equation 16
(19 )[HCO-]=10-° .3 x10- °=103
Therefore the total amount of dissolved carbonate sin rainwater would be
(CO 2), r, = [H2CO ;] + [HCO-] =1 0
+10-03= 10- ' (20 )
and the concentration of Ca+ 2 in equilibrium woul dbe
_ 10 10[Ca ] [CO ;] 10-4 .75 =10 :3 ., :, (21 )
which is equivalent to a maximum concentration o f11.2 mg/L of Ca+ 2 that can be dissolved by rain -fall . Because the average concentration of calciumin rainfall from table 5 is 1 .2 mg/L, we may conclud ethat the effective reactive ability of rainwater fo rcalcite is almost totally available prior to the solu-tioning process on the limestone rocks. Once thereaction with the limestone is completed, a ne wequilibrium is reached . The nature of this mech-anism is discussed in detail by Garrels and Chris t(1965) who conclude that at a pH of 9 .9 a con-centration of CaCO :; of 14 mg/L in the solute fromthe rainfall-calcite reaction will be in equilibrium—thus pointing out the low reactive capacity o frainwater. This reasoning is also followed by Birotand others (1967) who concluded that, to explainthe high calcium content of some of the water sof the north coast limestone belt, additional CO 2must be picked up from the soil by the percolatingrainfall . In turn the CO9 in the soil is obtained fro mthe decomposition of organic acids into CO, andwater . These are also the views first presented byMonroe (1966) .
The relative importance of this enrichment i nCO, from the breaking down of organic acids i sexamined by analyzing as an example the CaCO :4dissolved from the Rio Lajas basin which drain slimestone terrane only . A mean annual base flowof about 0.1 m 3/s is computed from figure 35 ad-justed for the mean annual rainfall . From a con-centration-discharge correlation similar to the on eshown in figure 42, an average concentration of200 mg/L of CaCO,, coinciding with the low-flowfield-measured sample of table 5, is obtained—a nannual load from base flow of 630 tonnes per year .From the previous data for rainfall at a maximu mreactive value of 28 mg/L of CaCO3 (11 .2 mg/ Lof Ca+ 2 ), and 0 .1 m 3/s of base flow as the rainfallpercolated, a total discharge load of 88 t/yr maybe attributed to the effect of rainfall . If 88 t/yrCaCO : ; potential solution is by rainfall and 630 t/y rCaCO :; is actual solution, then 542 t/yr CaCO :; i sderived from solution through CO 2 contributed fro m
[Ca +2] [C0 -2 ]=KCaCO 3 = 10 -~' . (12 )
(13)
[HICO 3 ]
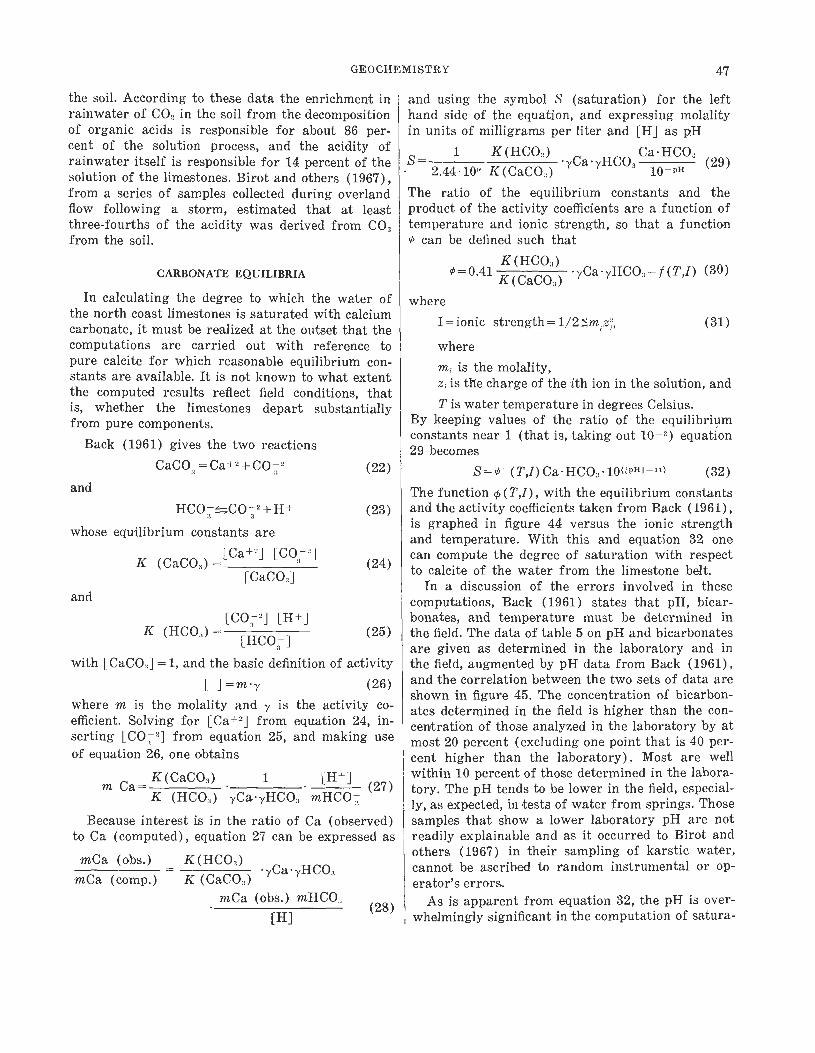
GEOCHEMISTRY 47
the soil . According to these data the enrichment i nrainwater of CO 2 in the soil from the decompositionof organic acids is responsible for about 86 per -cent of the solution process, and the acidity o frainwater itself is responsible for 14 percent of th esolution of the limestones. Birot and others (1967) ,from a series of samples collected during overlan dflow following a storm, estimated that at leas tthree-fourths of the acidity was derived from CO 2from the soil .
CARBONATE EQUILIBRIA
In calculating the degree to which the water o fthe north coast limestones is saturated with calciu mcarbonate, it must be realized at the outset that thecomputations are carried out with reference t opure calcite for which reasonable equilibrium con-stants are available . It is not known to what exten tthe computed results reflect field conditions, tha tis, whether the limestones depart substantiall yfrom pure components .
Back (1961) gives the two reaction s
CaCO, = Ca+2 + C072 (22)
and
HCO .; ±CO 3 2 +H+ (23 )
whose equilibrium constants are
(24 )K (CaCO3) =
[Ca+ -] [CO- 2 1
and
[CaCO3]
K (HCO 3) _ [CO32]
[ H+ ](25 )
[HCO. ]
with [CaCO,] =1, and the basic definition of activit y
[ ] =m'y (26 )where m is the molality and y is the activity co -efficient. Solving for [Ca+ 2 ] from equation 24, in-serting [C0 2] from equation 25, and making useof equation 26, one obtains
m Ca=K(CaCO 3) 1 [H+ ] (27 )K (HCO 3 ) yCa•yHCO, mHC O
Because interest is in the ratio of Ca (observed )to Ca (computed), equation 27 can be expressed a s
mCa (ohs.) K (HCO3)yCa yHCO ,
mCa (comp .) K (CaCO 3 )mCa (obs.) mHCO ,
[H]
and using the symbol S (saturation) for the lef thand side of the equation, and expressing molalit yin units of milligrams per liter and [H] as pH
1 K(HCO3 ) Ca•HCO,S
yCa yHC O2.44 . 10" K(CaCO)
3 (29 )10-PH
The ratio of the equilibrium constants and th eproduct of the activity coefficients are a function o ftemperature and ionic strength, so that a function
can be defined such that
~ =0 .41K(HCO3)
.yCa•yHCO=f(T,I) (30 )K ( CaCO,)
where
I=ionic strength =1/2 m .z 2 , (31 )
where
m, is the molality ,z ; is the charge of the ith ion in the solution, and
T is water temperature in degrees Celsius .By keeping values of the ratio of the equilibriu mconstants near 1 (that is, taking out 10- 2 ) equation29 becomes
S = 0 (T,I)Ca•HCO 3 •10{{ nn! - ,I } (32 )
The function 4)(T,I), with the equilibrium constant sand the activity coefficients taken from Back (1961) ,is graphed in figure 44 versus the ionic strengt hand temperature. With this and equation 32 onecan compute the degree of saturation with respec tto calcite of the water from the limestone belt .
In a discussion of the errors involved in thes ecomputations, Back (1961) states that pH, bicar-bonates, and temperature must be determined i nthe field . The data of table 5 on pH and bicarbonatesare given as determined in the laboratory and i nthe field, augmented by pH data from Back (1961) ,and the correlation between the two sets of data ar eshown in figure 45 . The concentration of bicarbon-ates determined in the field is higher than the con-centration of those analyzed in the laboratory by a tmost 20 percent (excluding one point that is 40 per -cent higher than the laboratory) . Most are wel lwithin 10 percent of those determined in the labora-tory. The pH tends to be lower in the field, especial-ly, as expected, in tests of water from springs . Thosesamples that show a lower laboratory pH are no treadily explainable and as it occurred to Birot an dothers (1967) in their sampling of karstic water ,cannot be ascribed to random instrumental or op-erator ' s errors .
As is apparent from equation 32, the pH is over-whelmingly significant in the computation of satura -(28)
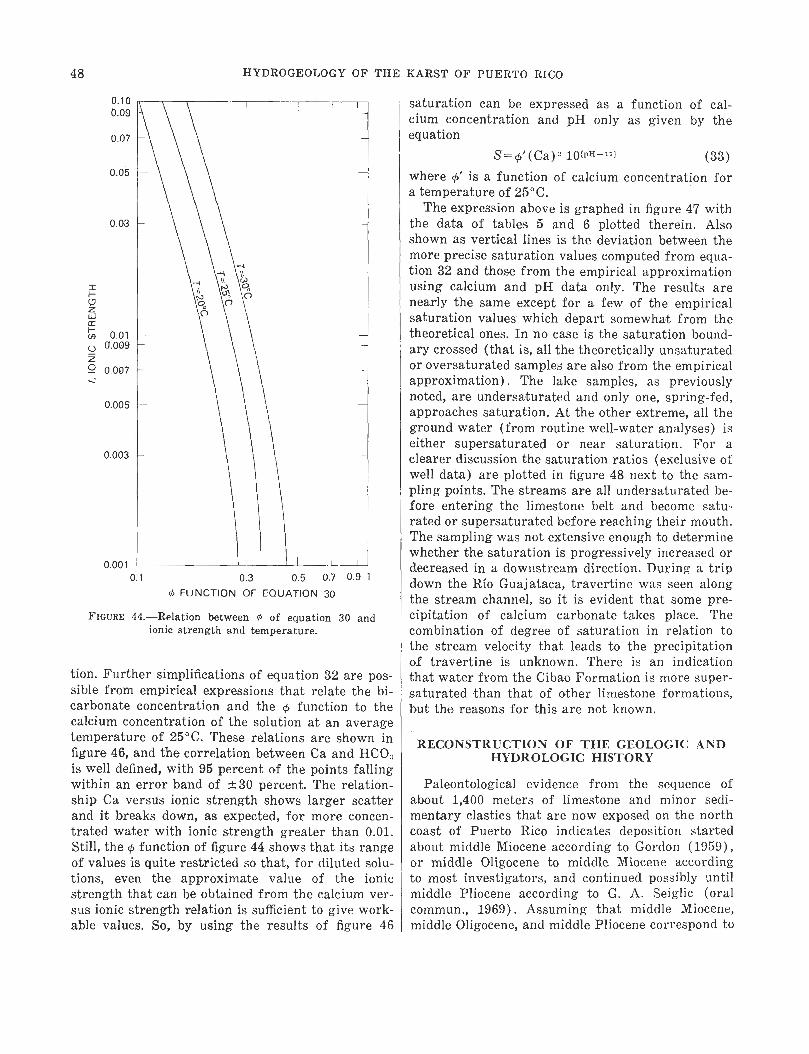
48 HYDROGEOLOGY OF THE KARST OF PUERTO RIC O
0 .1 00 .09
0 .07
0 .0 5
0 .03
0 .0 10 :00 9
0 .00 7
0 .00 5
0 .00 3
0 .0010 .1 0 .3 0.5 0 .7 0 .9 1
O FUNCTION OF EQUATION 3 0
FIGURE 44 .-Relation between 4 of equation 30 an dionic strength and temperature .
tion. Further simplifications of equation 32 are pos-sible from empirical expressions that relate the bi-carbonate concentration and the function to th ecalcium concentration of the solution at an averagetemperature of 25°C . These relations are shown infigure 46, and the correlation between Ca and HCO :,is well defined, with 95 percent of the points fallin gwithin an error band of ±30 percent . The relation -ship Ca versus ionic strength shows larger scatte rand it breaks down, as expected, for more concen-trated water with ionic strength greater than 0 .01 .Still, the function of figure 44 shows that its rang eof values is quite restricted so that, for diluted solu-tions, even the approximate value of the ioni cstrength that can be obtained from the calcium ver-sus ionic strength relation is sufficient to give work-able values . So, by using the results of figure 46
saturation can be expressed as a function of cal-cium concentration and pH only as given by th eequation
S=0' (Ca) 2 10{pn-11} (33 )
where ¢' is a function of calcium concentration fora temperature of 25°C .
The expression above is graphed in figure 47 withthe data of tables 5 and 6 plotted therein . Alsoshown as vertical lines is the deviation between th emore precise saturation values computed from equa-tion 32 and those from the empirical approximatio nusing calcium and pH data only . The results arenearly the same except for a few of the empirica lsaturation values which depart somewhat from th etheoretical ones . In no case is the saturation bound-ary crossed (that is, all the theoretically unsaturate dor oversaturated samples are also from the empirica lapproximation) . The lake samples, as previousl ynoted, are undersaturated and only one, spring-fed ,approaches saturation . At the other extreme, all th eground water (from routine well-water analyses) iseither supersaturated or near saturation . For aclearer discussion the saturation ratios (exclusive ofwell data) are plotted in figure 48 next to the sam-pling points . The streams are all undersaturated be-fore entering the limestone belt and become satu-rated or supersaturated before reaching their mouth .The sampling was not extensive enough to determinewhether the saturation is progressively increased ordecreased in a downstream direction . During a tripdown the Rio Guaj ataca, travertine was seen alongthe stream channel, so it is evident that some pre-cipitation of calcium carbonate takes place . Thecombination of degree of saturation in relation t othe stream velocity that leads to the precipitationof travertine is unknown . There is an indicatio nthat water from the Cibao Formation is more super -saturated than that of other limestone formations ,but the reasons for this are not known .
RECONSTRUCTION OF THE GEOLOGIC AN DHYDROLOGIC HISTORY
Paleontological evidence from the sequence o fabout 1,400 meters of limestone and minor sedi-mentary elastics that are now exposed on the nort hcoast of Puerto Rico indicates deposition starte dabout middle Miocene according to Gordon (1959) ,or middle Oligocene to middle Miocene accordin gto most investigators, and continued possibly unti lmiddle Pliocene according to G. A. Seiglic (ora lcommun., 1969) . Assuming that middle Miocene ,middle Oligocene, and middle Pliocene correspond to
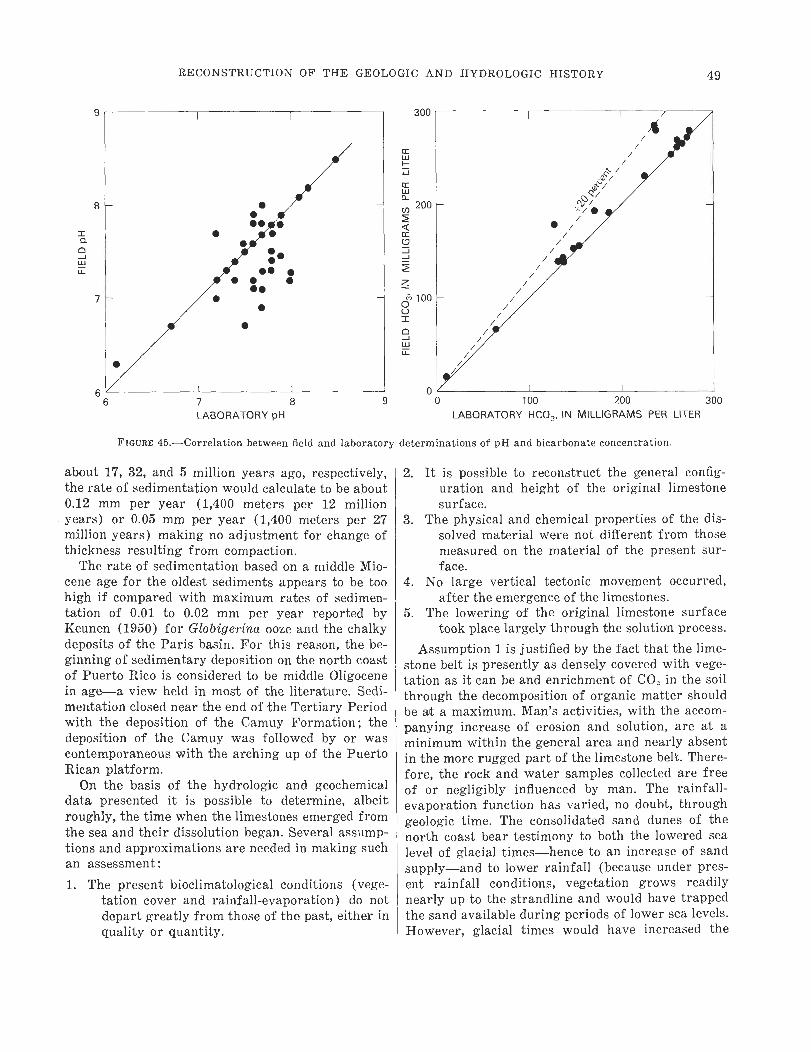
RECONSTRUCTION OF THE GEOLOGIC AND HYDROLOGIC HISTORY 49
300
o
wwF--:-J¢wa
7 8LABORATORY pH
9 100 200 300
LABORATORY HCO 3, IN MILLIGRAMS PER LITE R0
FIGURE 45.-Correlation between field and laboratory determinations of pH and bicarbonate concentration .
about 17, 32, and 5 million years ago, respectively ,the rate of sedimentation would calculate to be abou t0.12 mm per year (1,400 meters per 12 millionyears) or 0.05 mm per year (1,400 meters per 2 7million years) making no adjustment for change o fthickness resulting from compaction .
The rate of sedimentation based on a middle Mio-cene age for the oldest sediments appears to be to ohigh if compared with maximum rates of sedimen-tation of 0 .01 to 0.02 mm per year reported byKeunen (1950) for Globigerina ooze and the chalk ydeposits of the Paris basin . For this reason, the be-ginning of sedimentary deposition on the north coas tof Puerto Rico is considered to be middle Oligocen ein age—a view held in most of the literature . Sedi-mentation closed near the end of the Tertiary Periodwith the deposition of the Camuy Formation ; thedeposition of the Camuy was followed by or wascontemporaneous with the arching up of the Puert oRican platform .
On the basis of the hydrologic and geochemica ldata presented it is possible to determine, albei troughly, the time when the limestones emerged fro mthe sea and their dissolution began . Several assump-tions and approximations are needed in making suchan assessment :
1 . The present bioclimatological conditions (vege -tation cover and rainfall-evaporation) do notdepart greatly from those of the past, either inquality or quantity .
2. It is possible to reconstruct the general config-uration and height of the original limeston esurface .
3. The physical and chemical properties of the dis-solved material were not different from thos emeasured on the material of the present sur -face .
4 . No large vertical tectonic movement occurred ,after the emergence of the limestones .
5. The lowering of the original limestone surfac etook place largely through the solution process .
Assumption 1 is justified by the fact that the lime -stone belt is presently as densely covered with vege-tation as it can be and enrichment of CO2 in the soi lthrough the decomposition of organic matter shoul dbe at a maximum. Man's activities, with the accom-panying increase of erosion and solution, are at aminimum within the general area and nearly absen tin the more rugged part of the limestone belt. There -fore, the rock and water samples collected are freeof or negligibly influenced by man . The rainfall -evaporation function has varied, no doubt, throug hgeologic time. The consolidated sand dunes of th enorth coast bear testimony to both the lowered se alevel of glacial times—hence to an increase of san dsupply—and to lower rainfall (because under pres-ent rainfall conditions, vegetation grows readilynearly up to the strandline and would have trappe dthe sand available during periods of lower sea levels .However, glacial times would have increased the
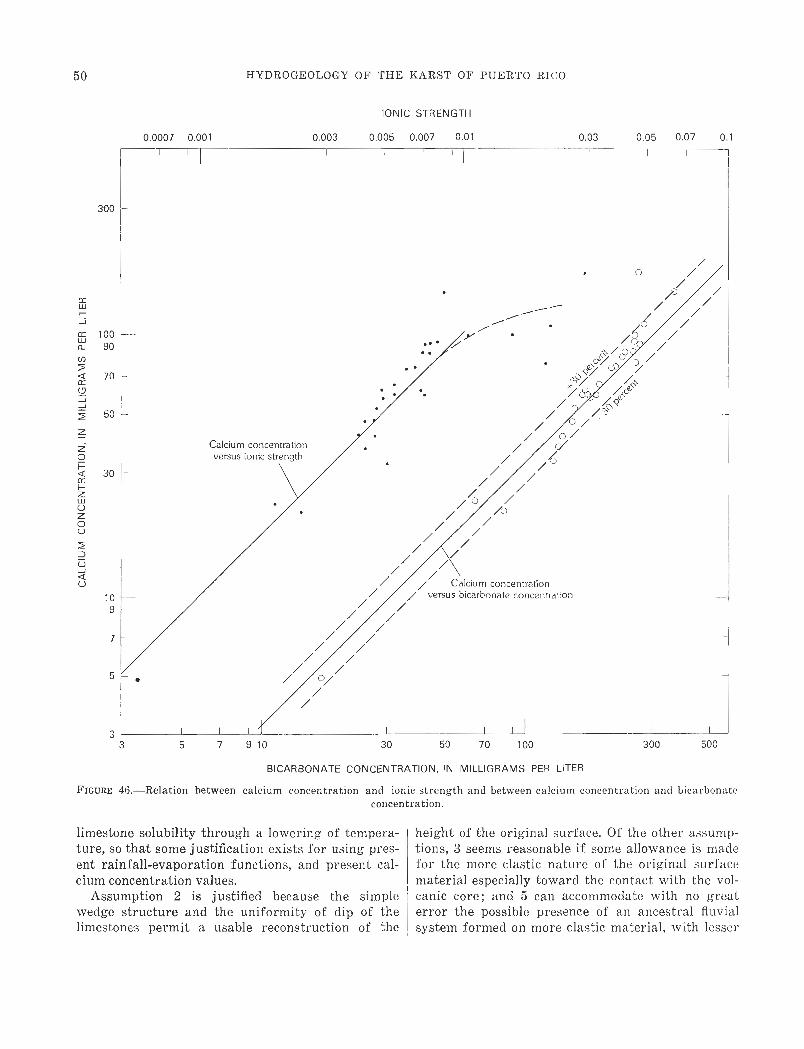
50 HYDROGEOLOGY OF THE KARST OF PUERTO RICO
IONIC STRENGTH
0 .0007 0 .001 0 .003 0 .005 0 .007 0 .0 1I
_- I !0 .03 0 .05 0 .0 7
I I I0 . 1
300
/~ Calcium concentratio n/ versus bicarbonate concentratio n
I I I I i __ I
50 70 100 300 50 07 9 10 3 0
Calcium concentratio nversus ionic strength
FIGURE
BICARBONATE CONCENTRATION, IN MILLIGRAMS PER LITE R
46 .—Relation between calcium concentration and ionic strength and between calcium concentration and bicarbonateconcentration .
limestone solubility through a lowering of tempera-ture, so that some justification exists for using pres-ent rainfall-evaporation functions, and present cal-cium concentration values .
Assumption 2 is justified because the simpl ewedge structure and the uniformity of dip of th elimestones permit a usable reconstruction of the
height of the original surface . Of the other assump-tions, 3 seems reasonable if some allowance is mad efor the more clastic nature of the original surfac ematerial especially toward the contact with the vol-canic core ; and 5 can accommodate with no grea terror the possible presence of an ancestral fluvialsystem formed on more clastic material, with lesser
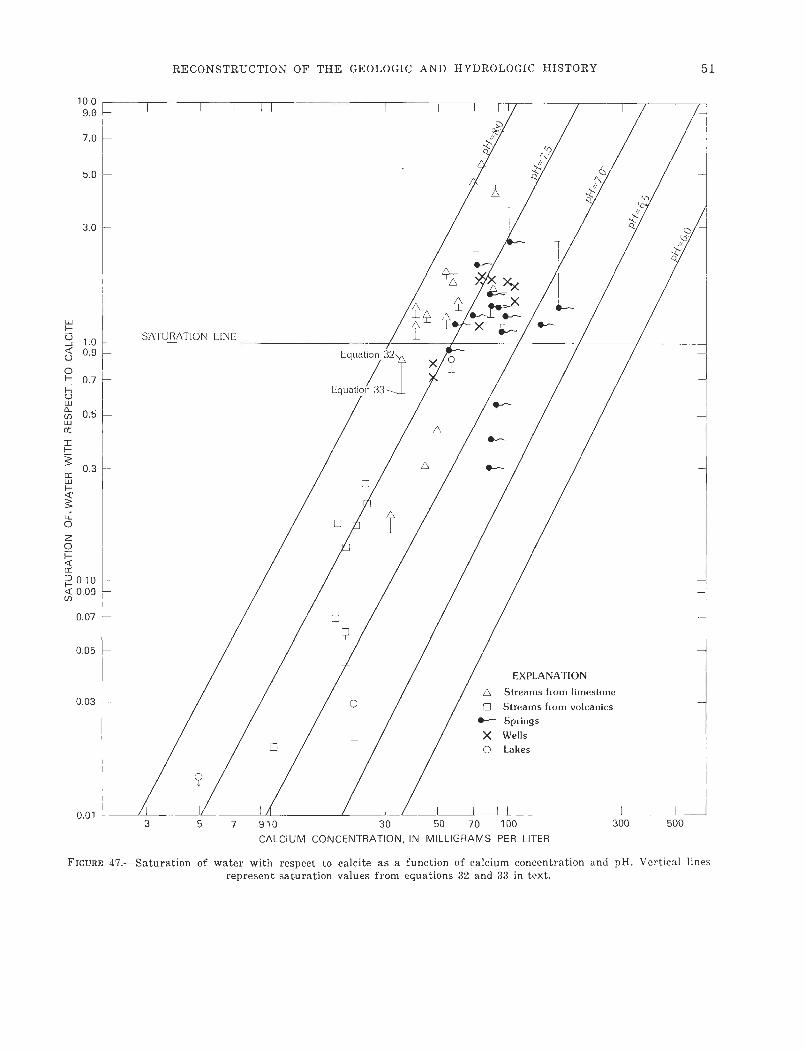
RECONSTRUCTION OF THE GEOLOGIC AND HYDROLOGIC HISTORY 5 1
FIGURE 47 .-Saturation of water with respect to calcite as a function of calcium concentration and pH . Vertical line srepresent saturation values from equations 32 and 33 in text .
10 .09. 0
7 .0
5. 0
3 . 0
HQ`
~OzoFQccD O 1 0Q 0 .0 9co
0 .07
0.0 5
0 .03
0.013 75
EXPLANATION
• Streams from limeston e
q Streams from volcanics• Spring sX Well sq Lake s
I I II I I910 30 50 70 100 300 500
CALCIUM CONCENTRATION, IN MILLIGRAMS PER LITER
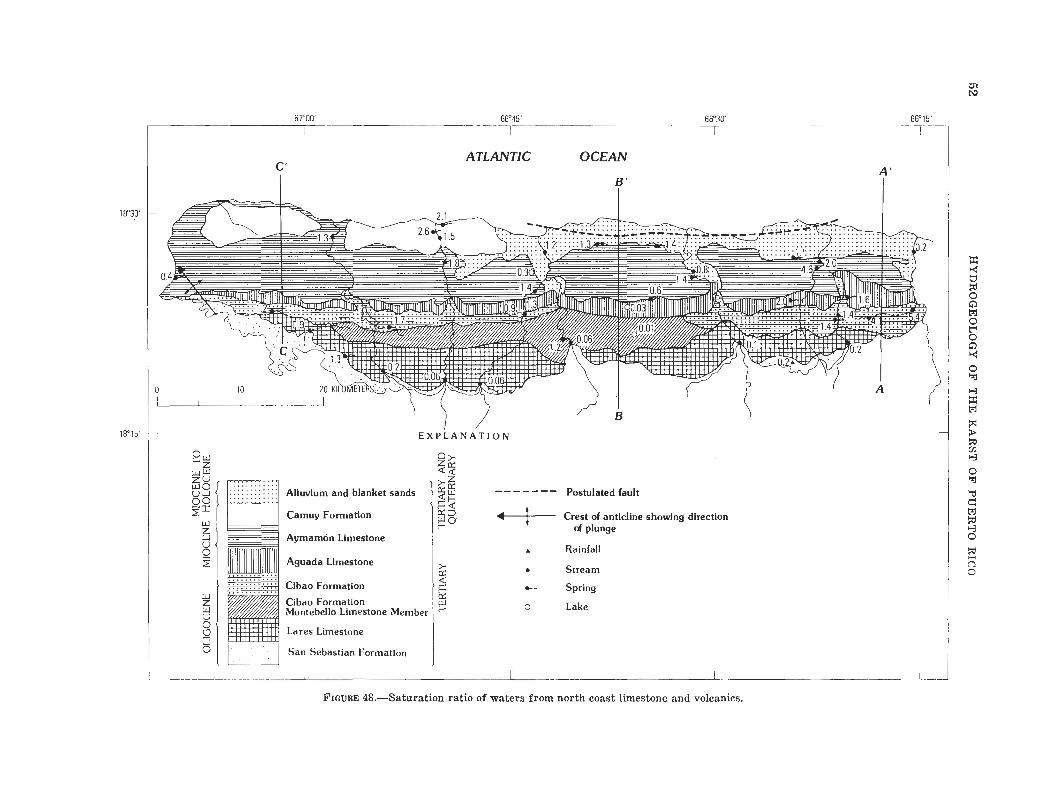
18°30 '
18°15'
57°00' 66°30'66°45'
EXPLANATIO N
o >-d ~¢
Alluvium and blanket sand s
Camuy Formation
yz~
¢ WQáO
.. . .. . . Postulated faul t
Crest of anticline showing direction4
Aymamón Limeston e
Aguada Limeston e
Cibao Formation
F
>-cc
of plunge
Rainfal l
Strea m
Spring~Cibao Formation
Montebello Limestone Membe r
Lares Limeston e
San Sebastian Formation
wF o Lake
cn
FIGURE 48.-Saturation ratio of waters from north coast limestone and volcanics .
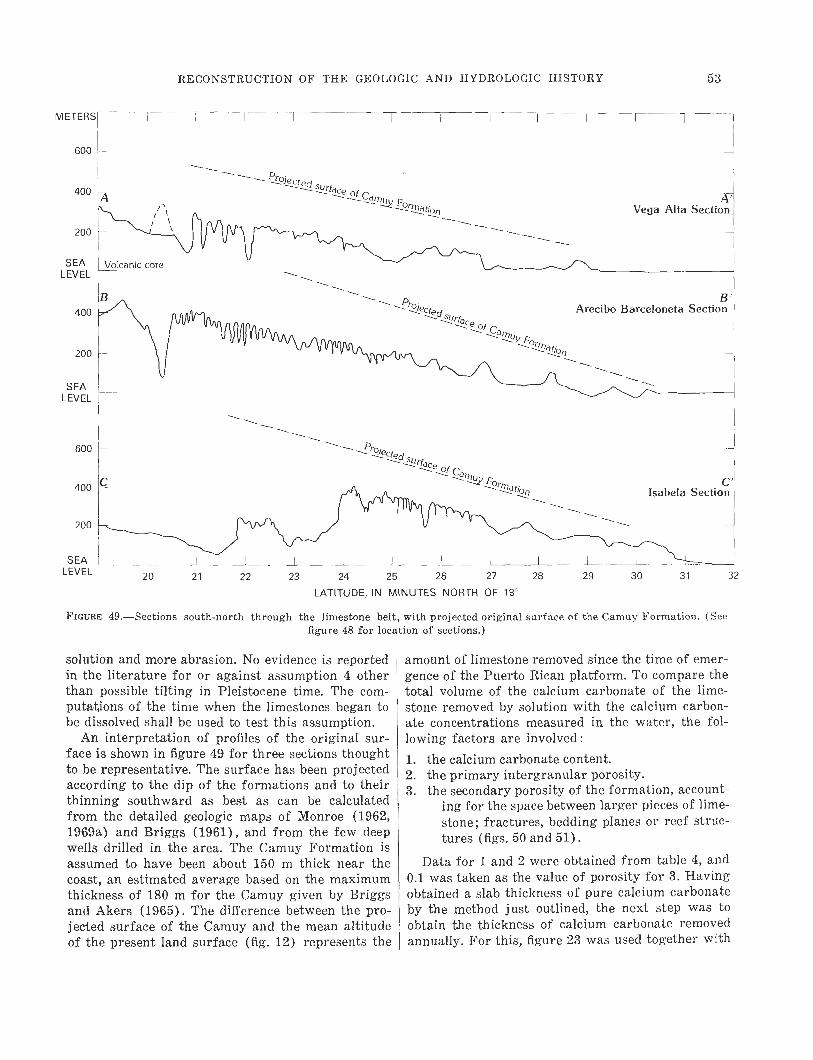
RECONSTRUCTION OF THE GEOLOGIC AND HYDROLOGIC HISTORY 5 3
METERS
FIGURE 49 .-Sections south-north through the limestone belt, with projected original surface of the Camuy Formation . (Seefigure 48 for location of sections . )
60 0
40 0
20 0
SEALEVEL 20 21 22 23 24 25 26 27 2 8
LATITUDE, IN MINUTES NORTH OF 18°
3 2
solution and more abrasion . No evidence is reportedin the literature for or against assumption 4 otherthan possible tilting in Pleistocene time . The com-putations of the time when the limestones began t obe dissolved shall be used to test this assumption .
An interpretation of profiles of the original sur -face is shown in figure 49 for three sections though tto be representative . The surface has been projecte daccording to the dip of the formations and to theirthinning southward as best as can be calculate dfrom the detailed geologic maps of Monroe (1962 ,1969a) and Briggs (1961), and from the few dee pwells drilled in the area . The Camuy Formation i sassumed to have been about 150 m thick near th ecoast, an estimated average based on the maximu mthickness of 180 m for the Camuy given by Briggsand Akers (1965) . The difference between the pro-jected surface of the Camuy and the mean altitudeof the present land surface (fig . 12) represents the
amount of limestone removed since the time of emer-gence of the Puerto Rican platform. To compare th etotal volume of the calcium carbonate of the lime-stone removed by solution with the calcium carbon -ate concentrations measured in the water, the fol-lowing factors are involved :
1. the calcium carbonate content .2. the primary intergranular porosity .3. the secondary porosity of the formation, account -
ing for the space between larger pieces of lime-stone ; fractures, bedding planes or reef struc -tures (figs . 50 and 51) .
Data for 1 and 2 were obtained from table 4, an d0 .1 was taken as the value of porosity for 3 . Havingobtained a slab thickness of pure calcium carbonat eby the method just outlined, the next step was t oobtain the thickness of calcium carbonate removedannually . For this, figure 23 was used together with
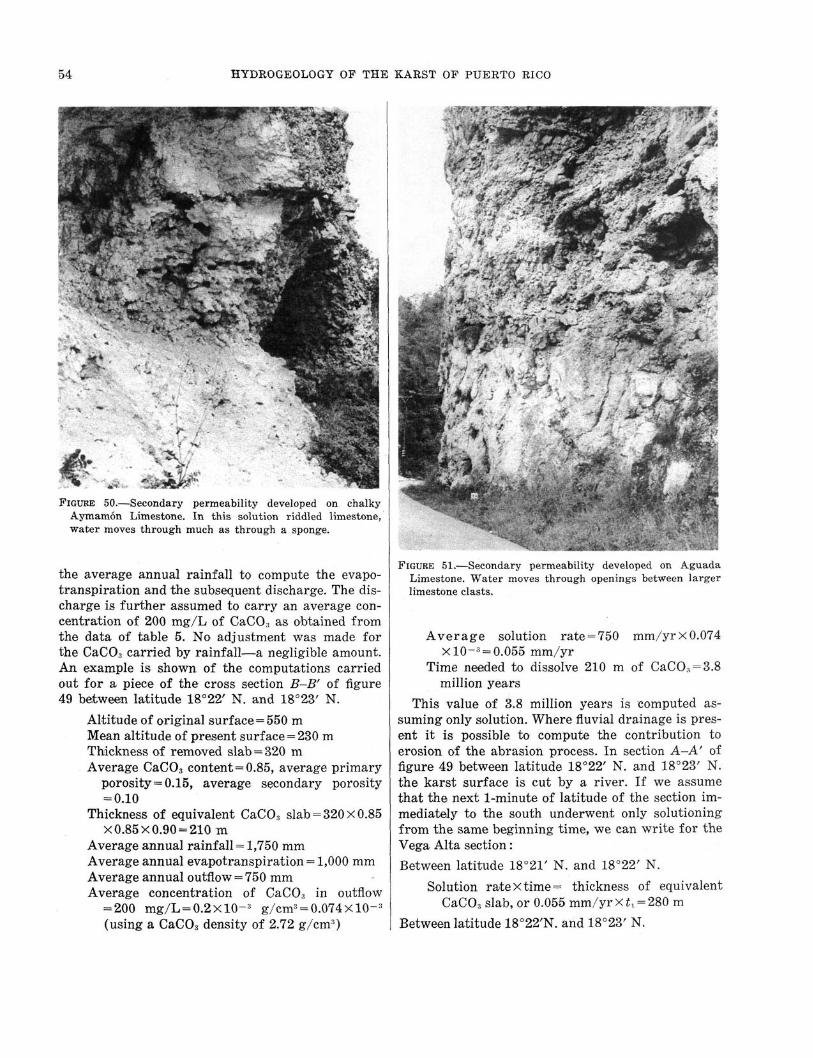
54 HYDROGEOLOGY OF THE KARST OF PUERTO RIC O
FIGURE 50.-Secondary permeability developed on chalk yAymamón Limestone. In this solution riddled limestone ,water moves through much as through a sponge .
the average annual rainfall to compute the evapo-transpiration and the subsequent discharge . The dis-charge is further assumed to carry an average con-centration of 200 mg/L of CaCO 3 as obtained fromthe data of table 5 . No adjustment was made forthe CaCO, carried by rainfall—a negligible amount .An example is shown of the computations carrie dout for a piece of the cross section B-B' of figure49 between latitude 18°22' N . and 18°23' N .
Altitude of original surface= 550 mMean altitude of present surface-230 mThickness of removed slab-320 mAverage CaCO 3 content-0.85, average primary
porosity-0 .15, average secondary porosit y= 0 .10
Thickness of equivalent CaC O 3 slab =320 x0 .85x0.85x0.90=210 m
Average annual rainfall =1,750 m mAverage annual evapotranspiration =1,000 mmAverage annual outflow = 750 mmAverage concentration of CaCO 3 in outflow
=200 mg/L= 0 .2 x 10- 3 g/cm 3 =0.074X10- 3(using a CaCO 3 density of 2 .72 g/cm`)
FIGURE 51.-Secondary permeability developed on AguadaLimestone . Water moves through openings between large rlimestone clasts .
Average solution rate=750 mm/yr x0 .074x 10- 33 = 0 .055 mm/yr
Time needed to dissolve 210 m of CaCO :;=3.8million years
This value of 3 .8 million years is computed as-suming only solution . Where fluvial drainage is pres -ent it is possible to compute the contribution t oerosion of the abrasion process . In section A-A' offigure 49 between latitude 18°22' N . and 18°23' N .the karst surface is cut by a river. If we assum ethat the next 1-minute of latitude of the section im -mediately to the south underwent only solutionin gfrom the same beginning time, we can write for theVega Alta section :
Between latitude 18°21' N . and 18°22' N .
Solution rate xtime= thickness of equivalentCaCO 3 slab, or 0 .055 mm/yr x t, = 280 m
Between latitude 18°22'N . and 18°23' N .

RECONSTRUCTION OF THE GEOLOGIC AND HYDROLOGIC HISTORY 55
(Solution rate+abrasion rate) xtime=thick-ness of equivalent CaCO 3 slab, or
(0.055 mm/yr + abrasion rate) t,= 290 m
and, assuming that tl = t ,Abrasion rate-0 .007 mm/yr
and the relation between abrasion and solution rate sis
Abrasion rate 0.007
Solution rate 0 .055or
Abrasion rate-0 .13 Solution rate.
The calculations shown refer to an area whereone small river has cut a canyon through the kars tsurface, perhaps through collapse of a former under -ground channel . The abrasion rate computed is prob-ably a minimum.
The previous computations carried through in th earea between latitude 18°21' N . and 18°23' N . of theIsabela section C-C' where a true fluvial system i spresent, give much larger results for abrasion : there
Abrasion rate 0 .024
Solution rate 0 .063or
Abrasion rate= 0 .38 Solution rat e
and this can probably be considered a more sig-nificant ratio.
The solution rates and the time since solution be-gan, computed for the three sections of figure 49 ,adjusted for abrasion rates where applicable, ar eshown in table 8. The variability in time since theonset of solution among the sections is probably du eto sampling error except for the uniformly lowervalues of section C-C' . These lower values arethought to be indicative of the Pleistocene tiltingand, taking an age of 3 .6 to 4 million years as an
average for the beginning of the erosion process o rthe time of emergence of the limestones, and 2 .6 to3.0 million years as the apparent age of the mostseaward part of the Isabela section, the tilting canbe dated as the difference in the two times, or about1 million years ago .
Birot and others (1967) compute 2 million year sas the time needed to erode a circular doline 100 mdeep, and this is the same order of time computedhere for an equivalent thickness of limestone .
The author's view is that tectonic movements hav ebeen responsible for the high Pleistocene terrace sand eolianities described by Monroe (1968a) andKaye (1959), but these investigators prefer eustati cmovements (changes in sea level) as the explana-tion.
HISTORICAL DEVELOPMENT OF THE PUERTORICAN KARST
According to the computations of the previou ssection, about 4 million years ago the north coast o fPuerto Rico completed its emergence from the se aand the dissolution of the limestones began (it ha dprobably started earlier near the contact of the lime-stones with the volcanic mountain core) . A view ofthe area as it might have looked about 3 .8 millionyears ago is shown in figure 53 .
The drainage in the limestone belt in the westnear the contact with the volcanics is assumed t ohave been southward to the ancestral Rio Culebrinas ,which was cutting a deep canyon at the volcanics-limestones contact. Subterranean drainage in a slightnorthwesterly direction is assumed to have bee ntaken by all the rivers west of the city of Arecibo .All the rivers from the city of Arecibo east are pre-sumed to have cut through the limestone belt by thi stime (fig. 52) . It is further assumed that a maturekarst existed in the east and that an incipient karstwas forming in the west .
TABLE 8 .Solution rates (in millimeters per year) and times (in million years) since solution bega n
Sections in figure 4 9A-A' B-B' C-C '
Latitude Solution Time since Solution Time since Solution Time sincerate
(mm per yr)solutio nbegan
rat e(mm per yr)
solutionbegan
rate(mm per yr)
solutio nbegan
18°29' 0 .028 2 . 628' ----------------- - .032 3 . 027' ------------ ------ - - 0 .035 4 .0 .035 3 . 026' _____ _____________ 0 .035 3 .7 .040 3 .7 .042 3 . 325' ________________ .040 3 .2 .040 4 .1 .049 3 .424' ----------- ------- .040 3 .8 .045 4.2 .052 3 . 623' __________________ .045 3.5 .050 3 .8 .056 '3 . 622' ------------ ------ .050 1 3 .5 .055 3 .8 .063 '3 . 621' ------------ ------ .055 3 .1 .060 4 .0 .063 '3 . 620' ------------------ - - .060 4 . 0
' Adjusted for abrasion.
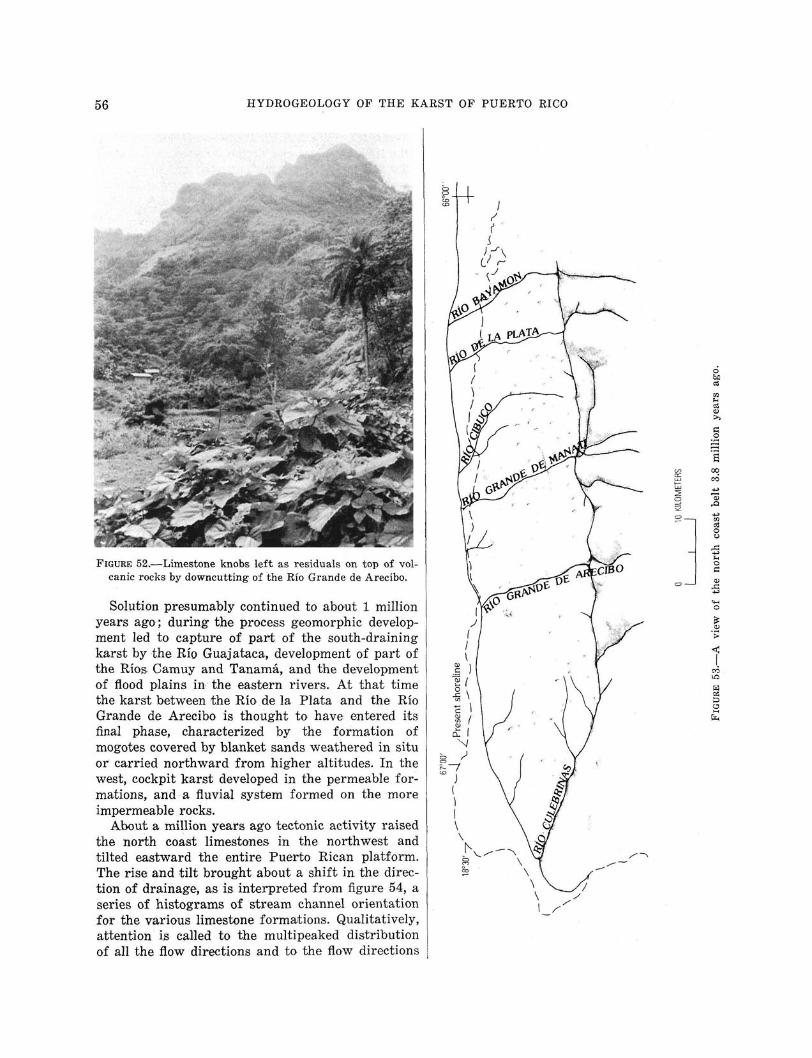
56 HYDROGEOLOGY OF THE KARST OF PUERTO RICO
C/D CC
2 ~G
FIGURE 52 .-Limestone knobs left as residuals on top of volcanic rocks by downcutting of the Río Grande de Arecibo . o
Solution presumably continued to about 1 millio n years ago ; during the process geomorphic development led to capture of part of the south-drainin g karst by the Río Guajataca, development of part o f the Ríos Camuy and Tanamá, and the development of flood plains in the eastern rivers . At that time the karst between the Rio de la Plata and the Rí o Grande de Arecibo is thought to have entered it s final phase, characterized by the formation o f mogotes covered by blanket sands weathered in sit u or carried northward from higher altitudes . In the west, cockpit karst developed in the permeable formations, and a fluvial system formed on the mor e impermeable rocks.
About a million years ago tectonic activity raise d the north coast limestones in the northwest an d tilted eastward the entire Puerto Rican platform . The rise and tilt brought about a shift in the direction of drainage, as is interpreted from figure 54, a series of histograms of stream channel orientation
\ \ \
\ I
/ii- ~
...-
for the various limestone formations . Qualitatively , attention is called to the multipeaked distribution of all the flow directions and to the flow directions
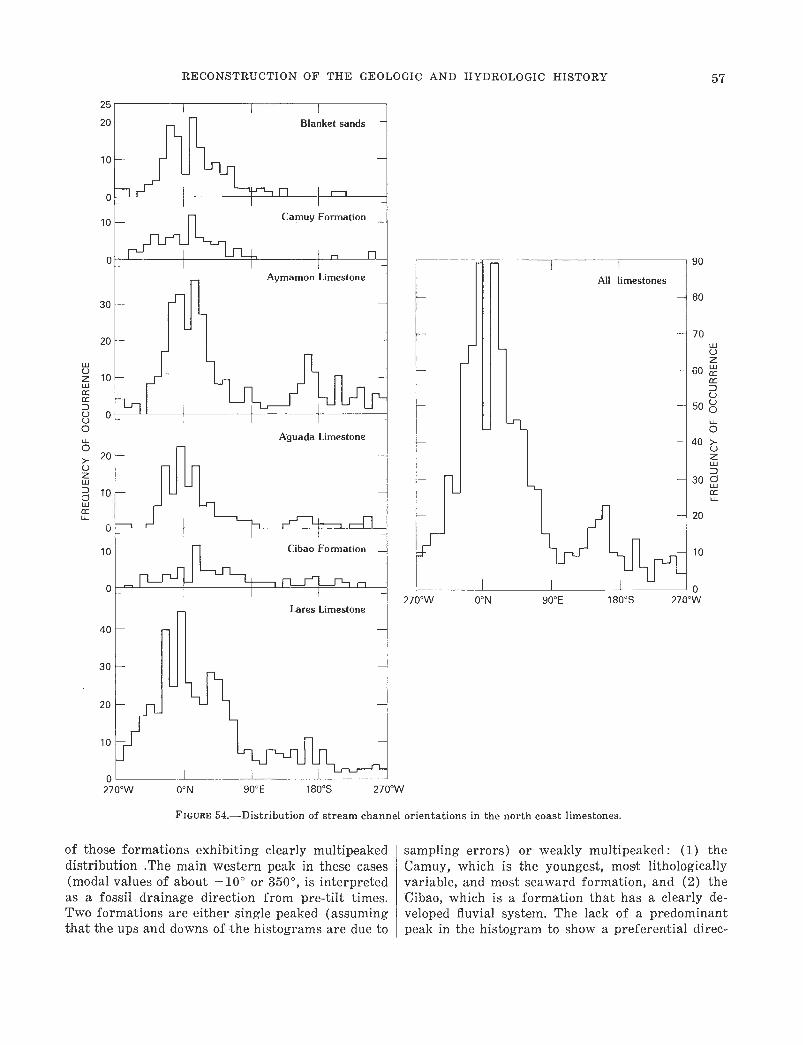
RECONSTRUCTION OF THE GEOLOGIC AND HYDROLOGIC HISTOR Y
fBlanket sands —
n { r,Camuy Formation _
20 —
10 —
~ n
Aymamon Limeston e
Aguada Limeston e
Cibao Formation — Jj
n fl
0O°N 90°E 180°S 270°W270°W
All limestone s
f2 0
10
ccw
57
90
8 0
70wUZ
60 c'tl
2 52 0
1 0
1 0
3 0
20
Lares Limeston e
40 —
30 —
20 —_FL
10 J
0 I I270°W 0°N 90°E 180°S 270° W
FIGURE 54.—Distribution of stream channel or entations in the north coast limestones .
of those formations exhibiting clearly multipeake ddistribution .The main western peak in these case s(modal values of about -10° or 350°, is interpretedas a fossil drainage direction from pre-tilt times .Two formations are either single peaked (assumin gthat the ups and downs of the histograms are due to
sampling errors) or weakly multipeaked : (1) theCamuy, which is the youngest, most lithologicall yvariable, and most seaward formation, and (2) th eCibao, which is a formation that has a clearly de-veloped fluvial system . The lack of a predominan tpeak in the histogram to show a preferential direc-
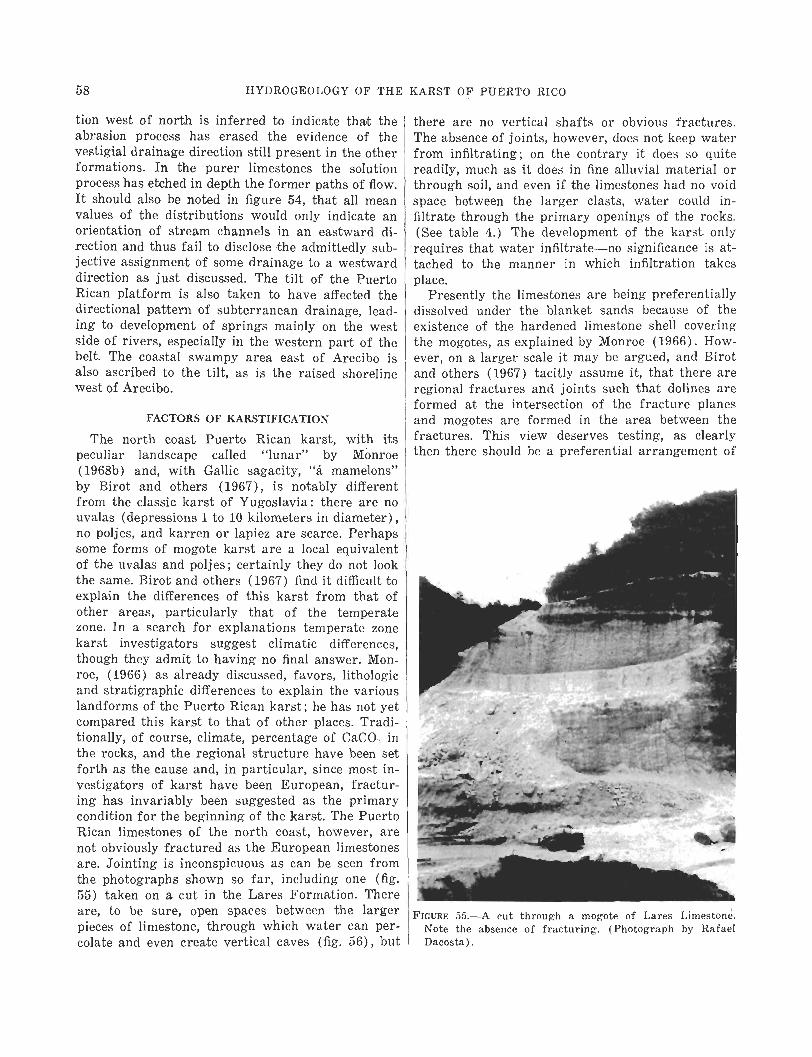
58 HYDROGEOLOGY OF THE KARST OF PUERTO RIC O
tion west of north is inferred to indicate that th eabrasion process has erased the evidence of th evestigial drainage direction still present in the otherformations . In the purer limestones the solutio nprocess has etched in depth the former paths of flow .It should also be noted in figure 54, that all mea nvalues of the distributions would only indicate a norientation of stream channels in an eastward di-rection and thus fail to disclose the admittedly sub-jective assignment of some drainage to a westwar ddirection as just discussed. The tilt of the PuertoRican platform is also taken to have affected thedirectional pattern of subterranean drainage, lead-ing to development of springs mainly on the wes tside of rivers, especially in the western part of th ebelt. The coastal swampy area east of Arecibo i salso ascribed to the tilt, as is the raised shorelin ewest of Arecibo .
FACTORS OF KARSTIFICATION
The north coast Puerto Rican karst, with it speculiar landscape called "lunar" by Monroe(1968b) and, with Gallic sagacity, "á mamelons"by Birot and others (1967), is notably differen tfrom the classic karst of Yugoslavia : there are nouvalas (depressions 1 to 10 kilometers in diameter) ,no poljes, and karren or lapiez are scarce . Perhapssome forms of mogote karst are a local equivalen tof the uvalas and poljes ; certainly they do not loo kthe same. Birot and others (1967) find it difficult toexplain the differences of this karst from that ofother areas, particularly that of the temperatezone. In a search for explanations temperate zon ekarst investigators suggest climatic differences ,though they admit to having no final answer . Mon-roe, (1966) as already discussed, favors, lithologi cand stratigraphic differences to explain the variou slandforms of the Puerto Rican karst ; he has not ye tcompared this karst to that of other places. Tradi-tionally, of course, climate, percentage of CaCO . inthe rocks, and the regional structure have been se tforth as the cause and, in particular, since most in-vestigators of karst have been European, fractur-ing has invariably been suggested as the primar ycondition for the beginning of the karst . The Puert oRican limestones of the north coast, however, ar enot obviously fractured as the European limestone sare. Jointing is inconspicuous as can be seen fro mthe photographs shown so far, including one (fig .55) taken on a cut in the Lares Formation . Thereare, to be sure, open spaces between the large rpieces of limestone, through which water can per-colate and even create vertical caves (fig . 56), but
there are no vertical shafts or obvious fractures .The absence of joints, however, does not keep waterfrom infiltrating ; on the contrary it does so quit ereadily, much as it does in fine alluvial material o rthrough soil, and even if the limestones had no voi dspace between the larger clasts, water could in -filtrate through the primary openings of the rocks .(See table 4 .) The development of the karst onlyrequires that water infiltrate—no significance is at-tached to the manner in which infiltration takesplace .
Presently the limestones are being preferentiall ydissolved under the blanket sands because of th eexistence of the hardened limestone shell coverin gthe mogotes, as explained by Monroe (1966) . How-ever, on a larger scale it may be argued, and Biro tand others (1967) tacitly assume it, that there ar eregional fractures and joints such that dolines ar eformed at the intersection of the fracture planesand mogotes are formed in the area between th efractures. This view deserves testing, as clearl ythen there should be a preferential arrangement o f
FIGURE 55 .-A cut through a mogote of Lares Limestone .Note the absence of fracturing. (Photograph by Rafae lDacosta) .
1
'"pfirr, ., ,
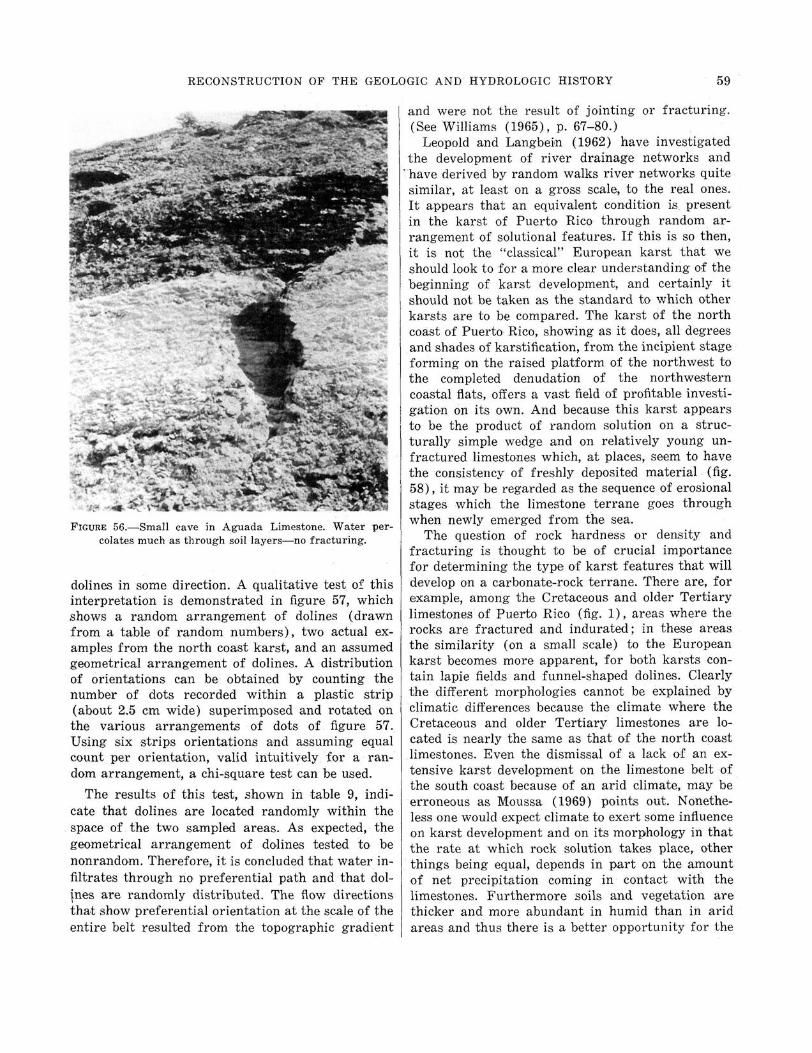
RECONSTRUCTION OF THE GEOLOGIC AND HYDROLOGIC HISTOR Y
FIGURE 56 .—Small cave in Aguada Limestone. Water per colates much as through soil layers—no fracturing .
dolines in some direction . A qualitative test of thi s interpretation is demonstrated in figure 57, which shows a random arrangement of dolines (drawn from a table of random numbers), two actual examples from the north coast karst, and an assume d geometrical arrangement of dolines . A distribution of orientations can be obtained by counting th e number of dots recorded within a plastic stri p (about 2.5 cm wide) superimposed and rotated on the various arrangements of dots of figure 57 .
Using six strips orientations and assuming equa l count per orientation, valid intuitively for a random arrangement, a chi-square test can be used .
The results of this test, shown in table 9, indicate that dolines are located randomly within th e space of the two sampled areas. As expected, th e geometrical arrangement of dolines tested to b e nonrandom. Therefore, it is concluded that water in filtrates through no preferential path and that dolines are randomly distributed . The flow directions that show preferential orientation at the scale of th e entire belt resulted from the topographic gradient
5 9
and were not the result of jointing or fracturing . (See Williams (1965), p . 67-80 . )
Leopold and Langbein (1962) have investigated the development of river drainage networks an d have derived by random walks river networks quit e similar, at least on a gross scale, to the real ones . It appears that an equivalent condition is present in the karst of Puerto Rico through random arrangement of solutional features . If this is so then , it is not the "classical" European karst that w e should look to for a more clear understanding of th e beginning of karst development, and certainly i t should not be taken as the standard to which othe r karsts are to be compared . The karst of the nort h coast of Puerto Rico, showing as it does, all degrees and shades of karstification, from the incipient stag e forming on the raised platform of the northwest t o the completed denudation of the northwester n coastal flats, offers a vast field of profitable investigation on its own . And because this karst appear s to be the product of random solution on a structurally simple wedge and on relatively young un fractured limestones which, at places, seem to hav e the consistency of freshly deposited material (fig . 58), it may be regarded as the sequence of erosiona l stages which the limestone terrane goes through when newly emerged from the sea .
The question of rock hardness or density an d fracturing is thought to be of crucial importanc e for determining the type of karst features that wil l develop on a carbonate-rock terrane . There are, for example, among the Cretaceous and older Tertiary limestones of Puerto Rico (fig . 1), areas where th e rocks are fractured and indurated ; in these area s the similarity (on a small scale) to the Europea n karst becomes more apparent, for both karsts contain lapie fields and funnel-shaped dolines . Clearly the different morphologies cannot be explained by climatic differences because the climate where th e Cretaceous and older Tertiary limestones are located is nearly the same as that of the north coast limestones . Even the dismissal of a lack of an extensive karst development on the limestone belt o f the south coast because of an arid climate, may b e erroneous as Moussa (1969) points out . Nonetheless one would expect climate to exert some influenc e on karst development and on its morphology in that the rate at which rock solution takes place, other things being equal, depends in part on the amount of net precipitation coming in contact with the limestones . Furthermore soils and vegetation are thicker and more abundant in humid than in ari d areas and thus there is a better opportunity for the
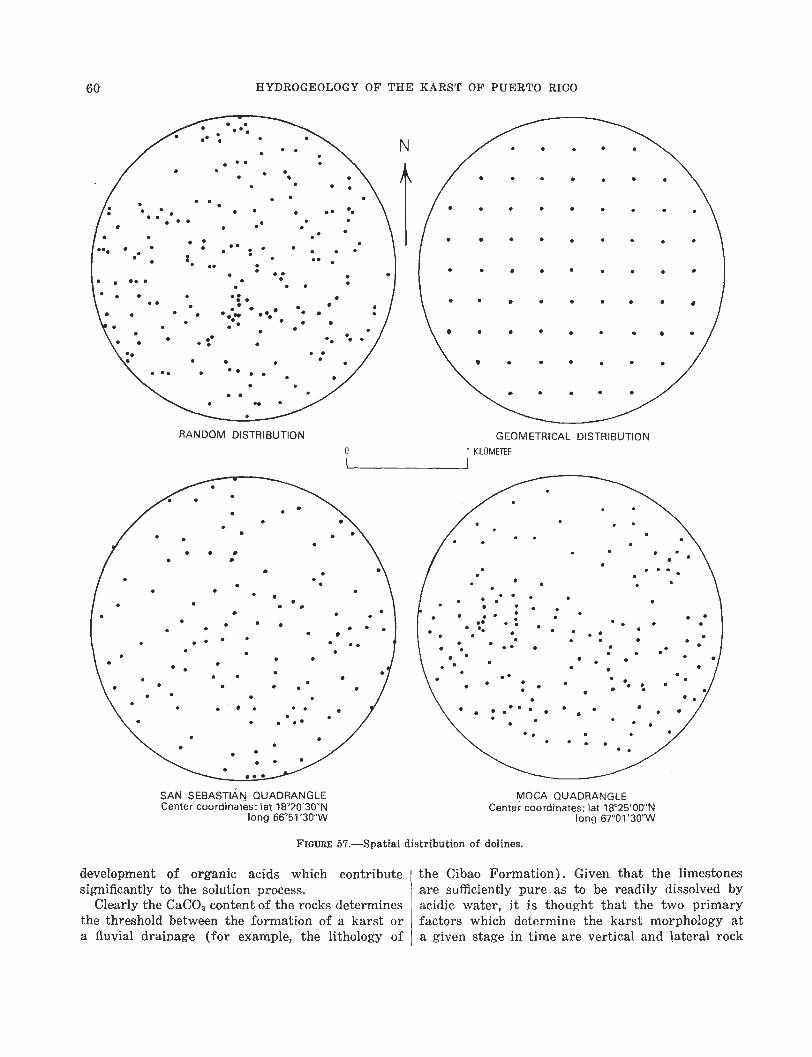
60 HYDROGEOLOGY OF THE KARST OF PUERTO RICO
GEOMETRICAL DISTRIBUTION
1 KILOMETER
RANDOM DISTRIBUTION
0
SAN SEBASTIAN. QUADRANGLECenter coordinates : lat 18°20'30" N
long 66°51'30"W
MOCA QUADRANGLECenter coordinates : lat 18°25'00" N
long 67°01'30"W
FIGURE 57 .-Spatial distribution of dolines .
development of organic acids which contribut esignificantly to the solution process .
Clearly the CaCO, content of the rocks determine sthe threshold between the formation of a karst o ra fluvial drainage (for example, the lithology of
the Cibao Formation) . Given that the limestonesare sufficiently pure as to be readily dissolved byacidic water, it is thought that the two primar yfactors which determine the karst morphology a ta given stage in time are vertical and lateral rock
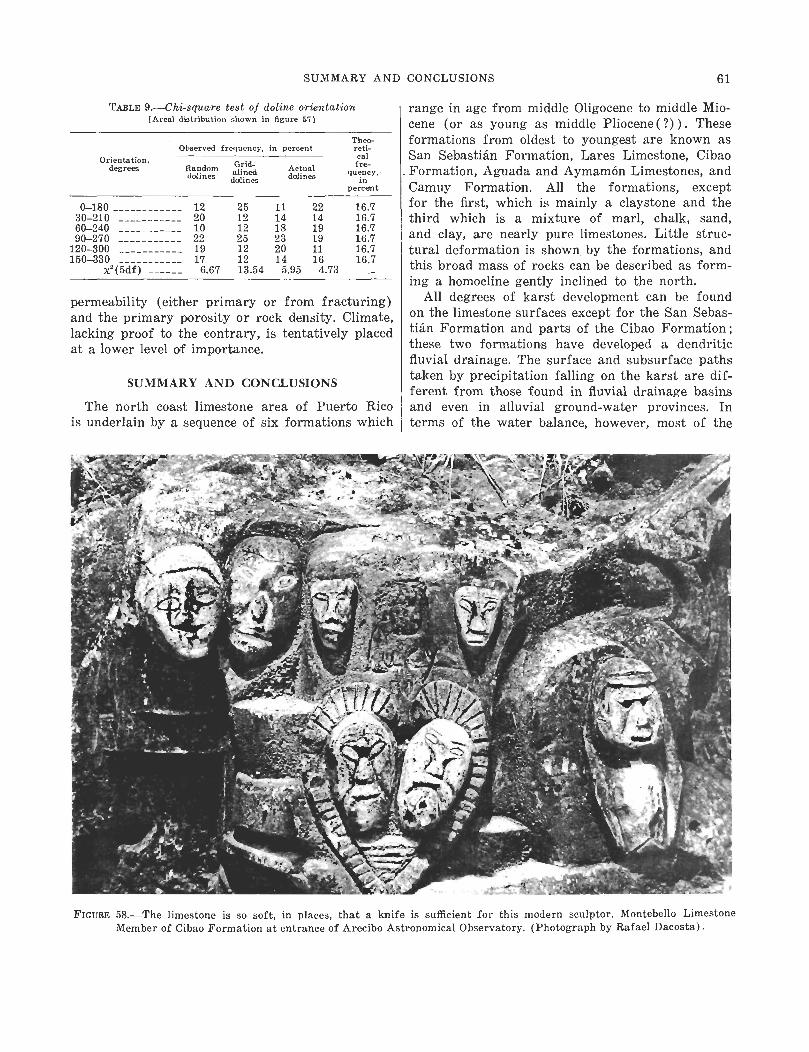
SUMMARY AND CONCLUSIONS 6 1
TABLE 9 .—Chi-square test of doline orientation[Areal distribution shown in figure 57 1
Observed frequency, in percentTheo -reti-
Orientation ,degrees Random alinedalined Actual
calfre -
quency,mines Balines i npercen t
0—180 ________ 12 25 11 22 16 . 730—210 ___________ 20 12 14 14 16 . 760—240 ___________ 10 12 18 19 16 . 790—270 ___________ 22 25 23 19 16 . 7
120—300 ___________ 19 12 20 11 16 . 7150—330 ___________ 17 12 14 16 16 . 7
x'(5df) 6 .67 13 .54 5 .95 4 .73
permeability (either primary or from fracturing )and the primary porosity or rock density . Climate,lacking proof to the contrary, is tentatively place dat a lower level of importance .
SUMMARY AND CONCLUSION S
The north coast limestone area of Puerto Ricois underlain by a sequence of six formations which
range in age from middle Oligocene to middle Mio-cene (or as young as middle Pliocene(?) ) . Theseformations from oldest to youngest are known a sSan Sebastián Formation, Lares Limestone, Cibao
. Formation, Aguada and Aymamón Limestones, an dCamuy Formation . All the formations, exceptfor the first, which is mainly a claystone and th ethird which is a mixture of marl, chalk, sand,and clay, are nearly pure limestones . Little struc-tural deformation is shown by the formations, andthis broad mass of rocks can be described as form-ing a homocline gently inclined to the north .
All degrees of karst development can be foun don the limestone surfaces except for the San Sebas-tián Formation and parts of the Cibao Formation ;these two formations have developed a dendriti cfluvial drainage . The surface and subsurface pathstaken by precipitation falling on the karst are dif-ferent from those found in fluvial drainage basinsand even in alluvial ground-water provinces . Interms of the water balance, however, most of th e
FIGURE 58 .—The limestone is so soft, in places, that a knife is sufficient for this modern sculptor . Montebello LimestoneMember of Cibao Formation at entrance of Arecibo Astronomical Observatory . (Photograph by Rafael Dacosta) .
62 HYDROGEOLOGY OF THE KARST OF PUERTO RIC O
rainfall on the karst can be accounted for by stream -flow or lagoonal discharge, when consideration i sgiven to losses by evapotranspiration .
The climatic factors which condition this dis-charge are :1 . Average rainfall ranging from 1,550 mm on the
coast to 2,300 mm at the higher elevations, o r1,800 mm as an overall average .
2 . Incoming total solar radiation (direct plus dif-fuse sky), expressed as about 4,000 mm o fevaporated water for cloudless sky or abou t2,900 mm under the average cloud cover ; re-sulting in an average potential evapotrans-piration of about 1,500 mm .
For the average climatic conditions, the actua levapotranspiration is about 1,100 mm and the dis-charge is about 650 mm. The discharge may followsurface or subsurface paths whose pattern is con -trolled by the karst development. In the impureCibao Formation and in the northwestern part o fthe Lares Limestone area, discharge is predomin-antly by surface drainage with subsequent infiltra-tion in the karst of the Aguada Limestone, wher ethe Cibao dips under it . Elsewhere in the karst thedischarge is subsurface partly as transient tribu-tary flow to those rivers alined in the general direc-tion of the ground-water flow (south to north) an dpartly as saturated flow in the areas between therivers.
The ground-water flow is under water-table con-ditions in the Aymamón and Aguada Limestones ;discharge occurs in a strip near the coastline alonga freshwater-seawater interface created by the dif-ference in density between freshwater and seawater .East of Arecibo, much of the ground water dis-charges landward of the shoreline, in springs, lakes ,and swamps, and is dissipated by evapotranspirationor by surface outflow to the sea. The direct dischargeto the sea in this area probably emerges uniforml y(rather than through springs) through the seabe dand diffuses into the sea. West of Arecibo, and inincreasing amounts toward Aguadilla, however, theground-water discharge appears to be predomin-antly on the seaward side of the shoreline and ma yemerge in places as spring flow through the se abottom.
In the downdip parts of the Montebello Lime-stone between Arecibo and Mantatí, the ground -water flow is under artesian conditions, confine dby low-permeability layers of massive limeston eand by certain nearly impermeable sections of th eCibao. The artesian flow emerges through sub-marine outflow areas at an unkown distance from
the coast and possibly, in part, through the faultproposed by Briggs (1961) into the swampy area sof Caño Tiburones and Laguna Tortuguero .
There is an indication that the lateral perme-ability of the aquifer decreases exponentially withstratigraphic depth, ranging in value from about1 cm/sec for the upper part of the Aymamón Lime-stone to 10- 4 cm/sec for the basal Lares . No dataare available for the vertical permeability althoug hit can be inferred that it must be high because th ewater table is but a few meters above sea level incertain parts of the upper part of the Aymamó nwhere the altitude of the land surface is more tha n100 meters .
The water table is extremely flat in the mos tseaward Aymamón thus reflecting its high perme-ability. The increase in water-table gradientthrough the Aguada is ascribed to its relatively lowlateral permeability and to the effect of the under -lying impermeable Cibao. In the Cibao and theLares the water table is again quite flat, possiblyindicating that lateral flow through the water-tabl ezone is less significant than downdip flow into th eartesian system .
Streamflow from the volcanic terrane south o fthe limestones is increased during rainy periods bycontribution from the karst, mainly by shallowtransient subsurface flow through solution chan-nels. The base-flow component of streamflow i sless in basins in limestone than in volcanic terrane .On an annual basis, water-budget results indicate,however, that the flow of the rivers, after the yhave traversed the limestone belt, is about thesame as it would have been had they continuedflowing on volcanic terrane .
The flood plain provides a dampening effect onthe storm runoff, absorbing part of the floodflowthrough bank storage, and releasing it later asbase flow. However, one flood plain, the Río Grandede Arecibo, seems to be responsible for an overal lapparent loss of flow . This loss is probably flow thatbypasses this basin to emerge as spring flow inCaño Tiburones .
It is not possible to define a unique drainage are afor that portion of the limestone belt that is draine dby Caño Tiburones and the Río Grande de Arecibobecause the base flow of Caño Tiburones is almostall ground-water flow from much of the belt to thesouth, whereas its direct runoff is from the are aof the Caño itself . The best interpretation that canbe made of the flow pattern and associated drainag eareas of the north coast limestones is shown infigure 59 .
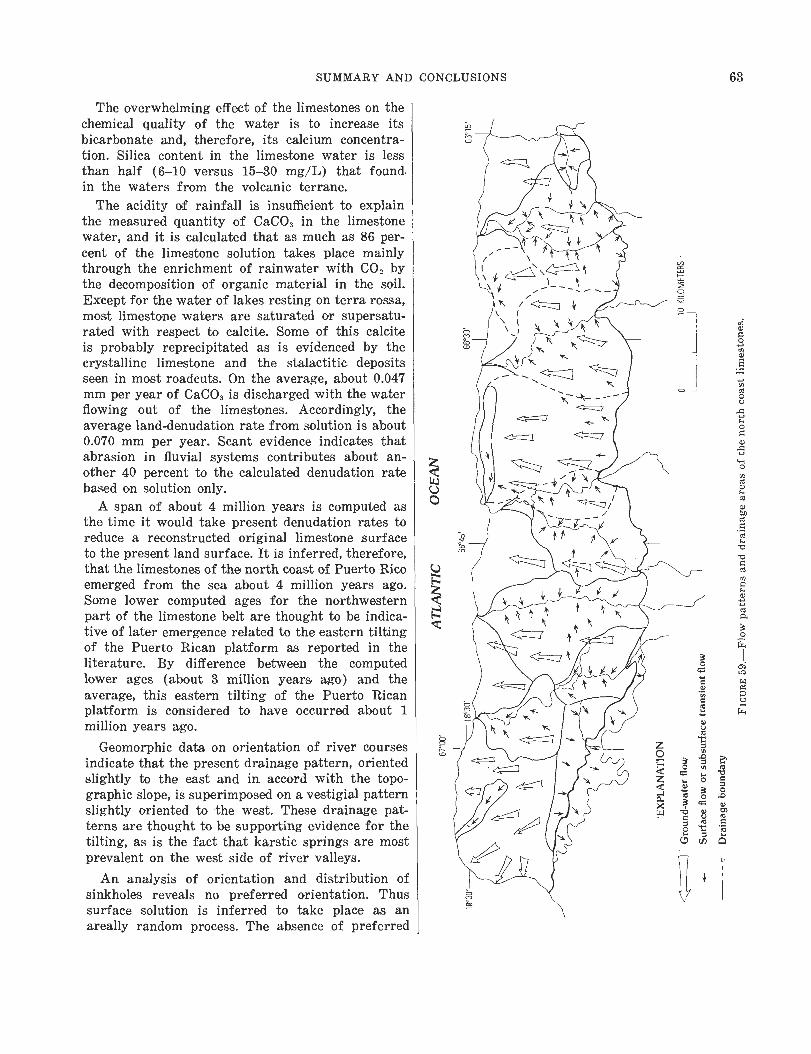
SUMMARY AND CONCLUSIONS 63
The overwhelming effect of the limestones on th echemical quality of the water is to increase it sbicarbonate and, therefore, its calcium concentra-tion. Silica content in the limestone water is les sthan half (6—10 versus 15—30 mg/L) that foundin the waters from the volcanic terrane.
The acidity of rainfall is insufficient to explai nthe measured quantity of CaCO3 in the limestonewater, and it is calculated that as much as 86 per -cent of the limestone solution takes place mainl ythrough the enrichment of rainwater with CO 2 bythe decomposition of organic material in the soil .Except for the water of lakes resting on terra rossa ,most limestone waters are saturated or supersatu-rated with respect to calcite. Some of this calciteis probably reprecipitated as is evidenced by th ecrystalline limestone and the stalactite depositsseen in most roadcuts . On the average, about 0.047mm per year of CaCO 3 is discharged with the waterflowing out of the limestones . Accordingly, theaverage land-denudation rate from solution is about0.070 mm per year. Scant evidence indicates thatabrasion in fluvial systems contributes about an -other 40 percent to the calculated denudation rat ebased on solution only .
A span of about 4 million years is computed a sthe time it would take present denudation rates toreduce a reconstructed original limestone surfac eto the present land surface . It is inferred, therefore ,that the limestones of the north coast of Puerto Ricoemerged from the sea about 4 million years ago .Some lower computed ages for the northwester npart of the limestone belt are thought to be indica-tive of later emergence related to the eastern tiltingof the Puerto Rican platform as reported in th eliterature. By difference between the computedlower ages (about 3 million years ago) and theaverage, this eastern tilting of the Puerto Ricanplatform is considered to have occurred about 1million years ago.
Geomorphic data on orientation of river coursesindicate that the present drainage pattern, oriente dslightly to the east and in accord with the topo-graphic slope, is superimposed on a vestigial patternslightly oriented to the west. These drainage pat-terns are thought to be supporting evidence for th etilting, as is the fact that karstic springs are mos tprevalent on the west side of river valleys .
An analysis of orientation and distribution o fsinkholes reveals no preferred orientation. Thussurface solution is inferred to take place as anareally random process. The absence of preferred
UO
É̀.
64 HYDROGEOLOGY OF THE KARST OF PUERTO RICO
orientation is taken to imply that large scale lime -stone joints are rare or absent .
Consideration of the processes that form the sur -face features of karst on soluble, unjointed, andunfractured limestones in Puerto Rico indicate sthat the primary controls are the distribution o flateral and vertical permeability and the primaryporosity of the rocks . Climate is considered to be o flesser importance.
REFERENCES
Back, William, 1961, Calcium carbonate saturation in groundwater, from routine analyses : U.S . Geol . Survey Water -Supply Paper 1535-D, 14 p., 1 pl . 1963, Preliminary results of a study of calcium car-
bonate saturation of ground water in central Florida :Bull . Internat . Assoc . Sci . Hydr . VIII Année, no . 3 .
Bennett, G. D., and Giusti, E . V ., 1972, Ground water in th eTortuguero Area, Puerto Rico, as related to proposedharbor construction : Commonwealth of Puerto Ric oWater-Resources Bull . 10, 25 p .
Birot, P., Corbel, J ., and Muxart, R., 1967, Morphologie desrégions calcaires a la Jamaique et a Puerto Rico : compterendu de deux missions subventionnées par le ComitéNat. Recherche Sci .
Bouchet, R. J ., 1963, Evapotranspiration réelle et potentielle ,signification climatique : Gen. Assembly Berkely Pub . 62 ,Bull . Internat . Assoc . Sci . Hydrology, Gentbrugge, p .134-142 .
Briggs, R. P., 1961, Oil and gas possibilities of northernPuerto Rico : Puerto Rico Mining Commission, San Juan ,P .R ., p . 1-23, illus . including map . 1966, The blanket sands of northern Puerto Rico :
Third Caribbean Geol . Conference, Kingston, Jamaic aGeol . Survey Pub. 95, Tr ., p . 60-69 .
Briggs, R. P., and Akers, J . P., 1965, Hydrogeologic map o fPuerto Rico and adjacent islands : U.S . Geol . SurveyHydrol . Inv. Atlas HA-197.
Briscoe, C. B., 1966, Weather in the Luquillo mountains o fPuerto Rico : Inst. Tropical Forestry, U .S. Forest Serv .Research Paper ITF-3 .
Diaz, José Raul, 1973, Chemical quality of water in CañoTiburones, Puerto Rico : U.S . Geol . Survey open-file re -port, map series 2 .
Garrels, R. M., and Christ, C. L ., 1965, Solutions, minerals ,and equilibria, New York, Harper and Row.
Giusti, E . V ., and López, M. A ., 1967, Climate and streamflowof Puerto Rico, Caribbean Jour . Sci ., v . 7, no. 3-4, p . 87-93, illus.
Goddard, E . N., chm., and others, 1948, Rock-color chart :Washington, Natl . Research Council (repub . by Geol .Soc . America, 1951) , 6 p .
Gordon, W. A., 1959, The age of the Middle Tertiary rocksof northwestern Puerto Rico : Second Caribbean Geol .Conf . (Puerto Rico) Trans ., p . 87-90 .
Gurnee, R . H., Thrailkill, J . V., and Nicholas, G ., 1966, Dis-covery at the Río Camuy; limestone erosion by groundwater can produce caves of impressive size : ExplorersJour ., v. 44, no . 1, p . 51-65, illus.
Jordan, D . G., 1970, Water and copper-mine tailings in karstterrane of Río Tanamá basin, Puerto Rico . U.S . Geol .Survey open-file report, 24 p .
Kaye, C . A., 1959, Shoreline features and Quaternary shore -line changes, Puerto Rico : U .S . Geol . Survey Prof . Paper317-B, p . 49-140, illus.
Kuenen, P . H., 1950, Marine geology : New York, John Wileyand Sons, Inc . p . 376-385 .
Leopold, L. B., and Langbein, W. B., 1962, The concept ofentropy in landscape evolution : U.S . Geol. Survey Prof.Paper 500-A .
Lobeck, A . K., 1922, The physiography of Puerto Rico : NewYork Acad . Sci ., v . 1, pt. 1 (Survey of Porto Rico) .
McGuinness, C. L., 1948, Ground water resources of PuertoRico : Puerto Rico Aqueduct and Sewer Authority, dupli-cate report .
Mackin, J . H., 1948, Concept of the graded river : Geol . Soc .America Bull., v. 59, p . 463-512 .
Meyerhoff, H. A., 1933, Geology of Puerto Rico : Univ .Puerto Rico Mon ., ser. B, no . 1, 306 p .
Monroe, W. H., 1962, Geology of the Manatí quadrangle ,Puerto Rico (with text), U .S . Geol . Survey Misc . Geol .Inv. Map I-334. 1964, The zanjón, a solution feature of karst topog-
raphy in Puerto Rico : U : S : Geol . Survey Prof . Paper501-B, p. B126-B129 . 1966, Formation of tropical karst topography by lime -
stone solution and reprecipitation : Caribbean Jour . Sci . ,v. 6, no . 1-2, p. 1-7, illus . 1968a, High level Quaternary beach deposits in north-
western Puerto Rico, in Geological Survey research ,1968 : U.S . Geol . Survey Prof. Paper 600-C, C140-C143 . 1968b, The karst features of northern Puerto Rico :
Natl . Speleol . Soc . Bull ., v . 30, no . 3, p . 75-86.1969a, Geologic map of the Aguadilla quadrangle ,
Puerto Rico : U.S . Geol . Survey Misc . Geol . Inv. Map I -569 . 1969b, Evidence of subterranean sheet solution under
weathered detrital cover in Puerto Rico : Problems of thekarst denudation, Brno, Studia Geographica 5, Geogra-ficky Ústav, Brno .
Morton, F . I ., 1965, Potential evaporation and river basi nevaporation : Proc . Am. Soc . Civil Engrs ., J . Hydrauli cDiv ., v. 91, HY 6.
Moussa, M . T., 1969, Quebrada de los Cedros, southwesternPuerto Rico, and its bearing on some aspects of karstdevelopment : Jour. Geology, v . '77, p . 714-720.
Myers, W. H., 1955, Preliminary results of geophysical ex-ploration for gas and oil on the north coast of Puert oRico : Puerto Rico Econ. Dev. Admin., Div . Mineralogyand Geology, Bull . 1, 10 p .
Olmsted, F. H., and Hely, A. G., 1962, Relation betwee nground water and surface water in Brandywine Cree kbasin, Pennsylvania : U .S . Geol . Survey Prof . Paper 417-A, 21 p .
Picó, Rafael, 1950, The geographic regions of Puerto Rico :University of Puerto Rico Press, Río Piedras, P .R., 25 6p ., illus .
Roche, M., 1963, Hydrologie de surface : Gauthier-Villar sEditeur, Paris, 123 p .

REFERENCES 65
Shurbet, G . L., and Ewing, Maurice, 1956, Gravity recon-naissance survey of Puerto Rico : Geol . Soc . Am. Bull . ,v. 67, no. 4, p. 511-534, illus.
Smithsonian Meteorological' Tables, 1966, Sixth revised edi-tion : Smithsonian Institution .
Solomon, S ., 1967, Relationship between precipitation, evapo-ration, and runoff in tropical-equatorial regions : WaterResources Research, v . 3, no . 1 .
Thornthwaite, C. W., 1931, The climates of North America
according to a new classification : Geographic Review ,v. 21, p . 633-655 .
Williams, R . S., 1965, Geomorphology of a portion of th eNorthern Coastal plain of Puerto Rico : Unpub. thesis ,Pennsylvania State University .
Zapp, A . D., Bergquist, H . R., and Thomas, C . R., 1948 (re-printed 1950), Tertiary geology of the coastal plains o fPuerto Rico : U.S. Geol . Survey Oil and Gas Inv . Prelim .Map 95 .


