HYDROGRAPHISCHE NACHRICHTEN Fachzeitschrift für Hydrographie und Geoinformation 02/2015 HN 100 First International Issue Hydrography made in Germany • Bathymetry of Lake Constance • Extensive sheet pile wall inspection in the Port of Hamburg • Disputed boundary in the Ems-Dollart estuary • Peter Ehlers: »In development aid Germany should adopt a leading role«
Transcript
HYDROGRAPHISCHENACHRICHTENFachzeitschrift für Hydrographie und Geoinformation 02/2015 HN 100
First International Issue
Hydrography made in Germany•BathymetryofLakeConstance
First International IssueHydrography made in Germany
Kongsberg EM 2040 multibeam echo sounder and LiDAR point cloud
0 m
-5 m
-15 m
-20 m
-10 m
10 m
height over
NHN
5 m
50 m 100 m 150 m 200 m 250 m 300 m 350 m 400 m 450 m
Kongsberg Mesotech 1171 series imaging sonar and LiDAR mosaic
0 m
-5 m
-15 m
-20 m
-10 m
10 m
height over
NHN
5 m
50 m 100 m 150 m 200 m 250 m 300 m 350 m 400 m 450 m
Derived sketch from multibeam and imaging data showing features of interest
50 m 100 m 150 m 200 m 250 m 300 m 350 m 400 m 450 m
Pos. 11 362mPos. 10 229 m
Pos. 1 47,5m Pos. 2 63.5 m Pos. 3 77 m Pos. 4 120 m Pos. 5 144 m Pos. 6 162 m Pos. 7 190 m Pos. 8 206 m Pos. 9 224 m
0 m
-5 m
-15 m
-20 m
-10 m
10 m
height over
NHN
5 m
1 2 3 4 5 6 7 8 9 10 11 12 13 14 15 16 17 18
KM Embient and KM Mesotech
Key Wall Inspection 2014 - The Full Picture
Surveying of inland waters6 Bathymetry of Lake Constance
State-of-the-art in surveying a large lake An article by MArtiN Wessels et al.
Underwater inspection and monitoring12 Extensive sheet pile wall inspection
in the Port of Hamburg An article by isAbell Mücke
Applied research16 How deep is deep enough?
Anchor penetration tests in the German Bight to optimise burial depth for subsea power cables
An article by cHristiAN MAusHAke
Boundary negotiations20 Ems-Dollart estuary
Did Germany and the Netherlands really agree on the disputed boundary recently?
An article by tHoMAs deHliNG
Project and geodata management24 Big Data
The challenges of large-area bathymetric surveys An article by klAus MicHels
Software solutions29 Hydrographic applications on a Mac
Public domain software solutions An article by HArtMut Pietrek
Automatic object detection32 Modern multibeam technology
Beyond accurate depth measurements An article by Peter GiMPel and cHristiAN ZWANZiG
Interview36 »In development aid Germany should
adopt a leading role« An academic discussion with Peter eHlers
Conference report42 HYDRO 14 Energy & Enterprise in Aberdeen A report by HolGer kliNdt and iAN HoldeN
Literature46 Flight into freedom A review by lArs scHiller
History of port surveying48 The evolution of the Port of Hamburg
from a hydrographic perspective An article by FrANk köster and tHoMAs tHies
History of navigation54 New perspectives on indigenous
navigation tradition An article by iNGo HeNNiNGs
Philosophy of hydrography59 What exactly is hydrography?
The IHO delivers an abstract definition only. It is high time for more graphicness
An essay by lArs scHiller
The next issue of Hydrographische Nachrichten will be published in June 2015. Editorial deadline: 15 May 2015Advertising deadline: 15 May 2015
16 Hydrographische Nachrichten
Applied research
soil conditions in the German Bight the implemen-tation of a burial depth of 3 m is ambitious from a technical point of view as well as being very cost-intensive. Hence, a discussion between the transmission system operator and the approving authorities about the possibility to reduce the pre-scribed burial depth has been initiated.
To gain more information on the level of risk in-volved in a possible reduction of the burial depth, a consortium of stakeholders embarked upon a field measurement programme in order to deter-mine the real penetration depths of anchors into the sea-floor. Alongside the transmission system operator TenneT and the approving authority (Wa-terways and Shipping Administration of the Feder-al Government, GDWS), the Federal Maritime and Hydrographic Agency (BSH), the Dutch research institute Deltares and the Federal Waterways En-gineering and Research Institute (BAW) have been involved in the field measurement programme, its documentation and the scientific evaluation of the results. The results of the experiment will poten-tially support and substantiate the enhancement of the regulations for the burial depth of subsea power cables in the TSS. The most relevant regula-tions are formulated in the »Spatial Offshore Grid Plan« which is issued and updated by the BSH for the German EEZ. The plan is being coordinated in consent with other federal agencies like the GDWS for nautical concerns.
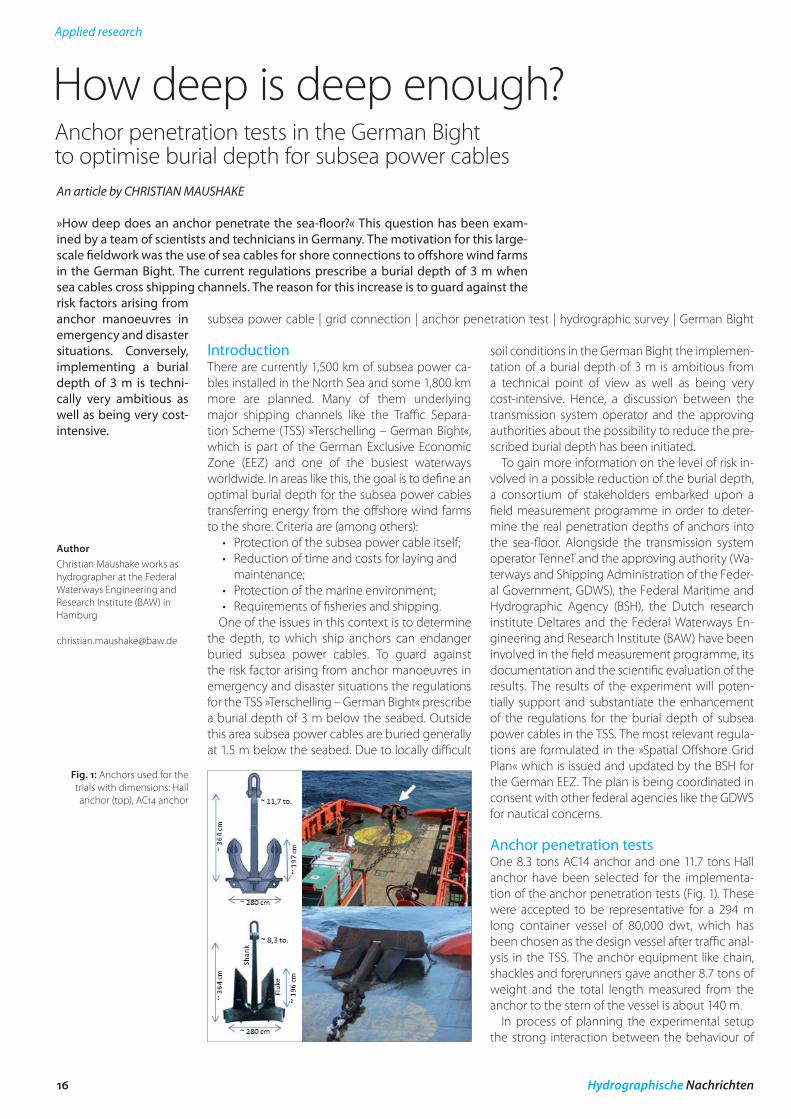
AnchorpenetrationtestsOne 8.3 tons AC14 anchor and one 11.7 tons Hall anchor have been selected for the implementa-tion of the anchor penetration tests (Fig. 1). These were accepted to be representative for a 294 m long container vessel of 80,000 dwt, which has been chosen as the design vessel after traffic anal-ysis in the TSS. The anchor equipment like chain, shackles and forerunners gave another 8.7 tons of weight and the total length measured from the anchor to the stern of the vessel is about 140 m.
In process of planning the experimental setup the strong interaction between the behaviour of
IntroductionThere are currently 1,500 km of subsea power ca-bles installed in the North Sea and some 1,800 km more are planned. Many of them underlying major shipping channels like the Traffic Separa-tion Scheme (TSS) »Terschelling – German Bight«, which is part of the German Exclusive Economic Zone (EEZ) and one of the busiest waterways worldwide. In areas like this, the goal is to define an optimal burial depth for the subsea power cables transferring energy from the offshore wind farms to the shore. Criteria are (among others):
One of the issues in this context is to determine the depth, to which ship anchors can endanger buried subsea power cables. To guard against the risk factor arising from anchor manoeuvres in emergency and disaster situations the regulations for the TSS »Terschelling – German Bight« prescribe a burial depth of 3 m below the seabed. Outside this area subsea power cables are buried generally at 1.5 m below the seabed. Due to locally difficult
How deep is deep enough?
An article by CHrISTIAn MAUSHAKE
subsea power cable | grid connection | anchor penetration test | hydrographic survey | German Bight
AuthorChristian Maushake works as hydrographer at the Federal Waterways Engineering and Research Institute (BAW) in Hamburg
»Howdeepdoesananchorpenetratethesea-floor?«Thisquestionhasbeenexam-inedbyateamofscientistsandtechniciansinGermany.Themotivationforthislarge-scalefieldworkwastheuseofseacablesforshoreconnectionstooffshorewindfarmsin theGermanBight.Thecurrent regulationsprescribeaburialdepthof3mwhenseacablescrossshippingchannels.Thereasonforthisincreaseistoguardagainsttheriskfactorsarisingfromanchor manoeuvres inemergencyanddisastersituations. Conversely,implementing a burialdepthof3m is techni-cally very ambitious aswellasbeingverycost-intensive.
Anchor penetration tests in the German Bight to optimise burial depth for subsea power cables
Fig. 1: Anchors used for the trials with dimensions: Hall anchor (top), AC14 anchor
HN 100 — 02/2015 17
Applied research
face of the sea-floor is being detected. In contrast to that an SES is able to penetrate the seabed – although in a line not in a swath – and to visualise vertical sediment structures and layers as well as e.g. embedded objects. Therefore, the SES played the key role in the detection of the anchor pen-etration depth because it has to be assumed that the anchor track refills with sediment quickly after the pull and the spot of maximum influence depth lies underneath ›fresh‹ sediment.
The survey of the anchor tracks was conducted in two steps. First an SSS sweep identifies the an-chors track and the start and ending position of the anchor pull. This gave the baseline for the sec-ond step: A cross-sectional SES survey perpendic-ular to the anchor track. The distance between the survey lines was kept as small as possible. Depend-ing on the length between 2 and 13 crossings of an anchor track could be achieved (Fig. 4 and 5).
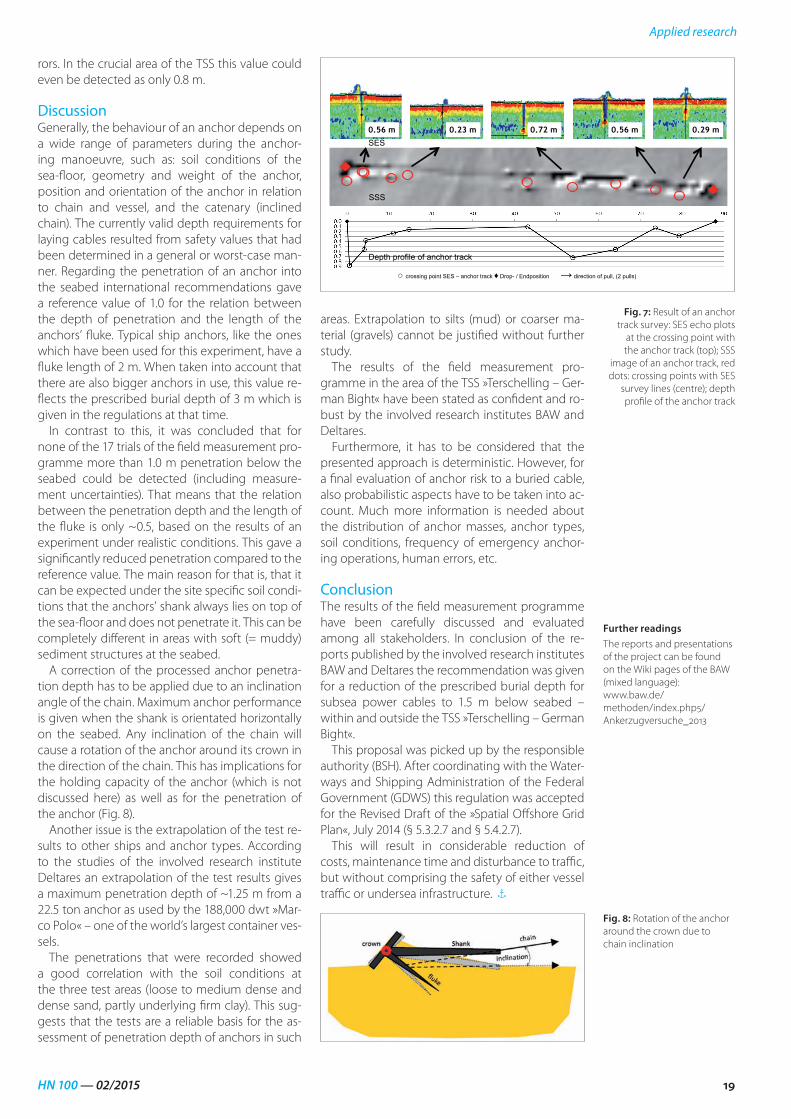
The impact of the anchor could clearly be iden-tified for all of the 17 processed trials. Goal of the analysis was the detection of the ›deepest point of influence‹ in the seabed. The dragging of an an-chor through the seabed generates local changes in the sediment structures, like loosening, com-pression or displacing. These changes in sediment properties can be detected with an SES as a tran-sition e.g. from a loose to a dense state which is caused by dragging the anchors’ flukes through the seabed. This ›deepest point of influence‹ can be digitised as a depth value and was compared
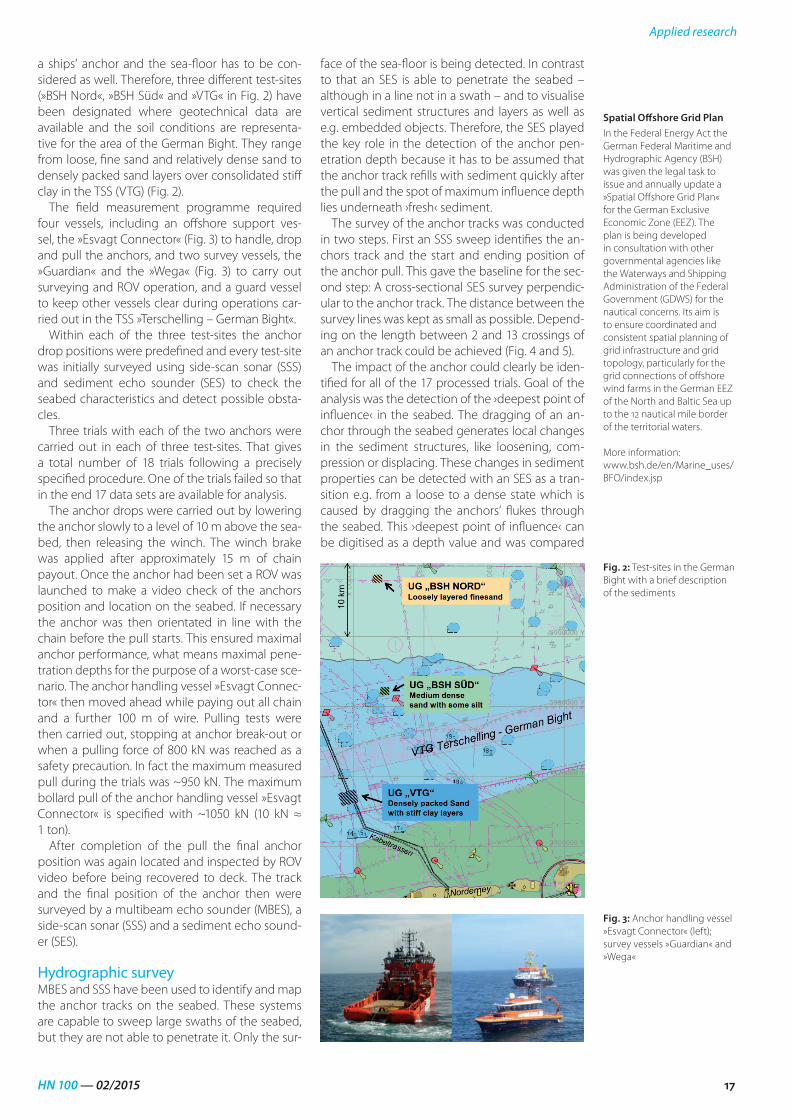
a ships’ anchor and the sea-floor has to be con-sidered as well. Therefore, three different test-sites (»BSH Nord«, »BSH Süd« and »VTG« in Fig. 2) have been designated where geotechnical data are available and the soil conditions are representa-tive for the area of the German Bight. They range from loose, fine sand and relatively dense sand to densely packed sand layers over consolidated stiff clay in the TSS (VTG) (Fig. 2).
The field measurement programme required four vessels, including an offshore support ves-sel, the »Esvagt Connector« (Fig. 3) to handle, drop and pull the anchors, and two survey vessels, the »Guardian« and the »Wega« (Fig. 3) to carry out surveying and ROV operation, and a guard vessel to keep other vessels clear during operations car-ried out in the TSS »Terschelling – German Bight«.
Within each of the three test-sites the anchor drop positions were predefined and every test-site was initially surveyed using side-scan sonar (SSS) and sediment echo sounder (SES) to check the seabed characteristics and detect possible obsta-cles.
Three trials with each of the two anchors were carried out in each of three test-sites. That gives a total number of 18 trials following a precisely specified procedure. One of the trials failed so that in the end 17 data sets are available for analysis.
The anchor drops were carried out by lowering the anchor slowly to a level of 10 m above the sea-bed, then releasing the winch. The winch brake was applied after approximately 15 m of chain payout. Once the anchor had been set a ROV was launched to make a video check of the anchors position and location on the seabed. If necessary the anchor was then orientated in line with the chain before the pull starts. This ensured maximal anchor performance, what means maximal pene-tration depths for the purpose of a worst-case sce-nario. The anchor handling vessel »Esvagt Connec-tor« then moved ahead while paying out all chain and a further 100 m of wire. Pulling tests were then carried out, stopping at anchor break-out or when a pulling force of 800 kN was reached as a safety precaution. In fact the maximum measured pull during the trials was ~950 kN. The maximum bollard pull of the anchor handling vessel »Esvagt Connector« is specified with ~1050 kN (10 kN ≈ 1 ton).
After completion of the pull the final anchor position was again located and inspected by ROV video before being recovered to deck. The track and the final position of the anchor then were surveyed by a multibeam echo sounder (MBES), a side-scan sonar (SSS) and a sediment echo sound-er (SES).
HydrographicsurveyMBES and SSS have been used to identify and map the anchor tracks on the seabed. These systems are capable to sweep large swaths of the seabed, but they are not able to penetrate it. Only the sur-
Fig. 2: Test-sites in the German Bight with a brief description of the sediments
Spatial Offshore Grid PlanIn the Federal Energy Act the German Federal Maritime and Hydrographic Agency (BSH) was given the legal task to issue and annually update a »Spatial Offshore Grid Plan« for the German Exclusive Economic Zone (EEZ). The plan is being developed in consultation with other governmental agencies like the Waterways and Shipping Administration of the Federal Government (GDWS) for the nautical concerns. Its aim is to ensure coordinated and consistent spatial planning of grid infrastructure and grid topology, particularly for the grid connections of offshore wind farms in the German EEZ of the North and Baltic Sea up to the 12 nautical mile border of the territorial waters.
More information:www.bsh.de/en/Marine_uses/BFO/index.jsp
18 Hydrographische Nachrichten
Applied research
and the corresponding survey lines. Data were processed using the ISE software which is part of the used Innomar SES system.
The error budget of this method is mainly given by two sources:
• Errorsindigitisingthetargets(›maximumdepth of influence‹ and ›undisturbed sea-bed‹);
• Errorduetovariationinthesoundvelocityof the echo sounder signals (sound velocity through water ~ 1,500 m/s, sound velocity through sand ~ 1,600 m/s).
With conservative estimate the maximum error could be accounted for approximately 0.11 m.
The crossing points between anchor track and survey line can be connected to depth pro-files of the anchor through the sea-floor. Fig. 7 shows an example of a complete processed tri-al, including SES cross sections, SSS image, and depth profile.
The overall result is put together in the table.
Pos. Type Number of pulls
Length of pulls [m]
Max. force [t]
Max. depth [m]
N1 AC14 1 67 62 0,65
N2 Hall 2 92 64 0,70
N3 AC14 1 57 82 0,69
N5 Hall 2 87 58 0,88
N6 Hall 2 92 65 0,78
S1 AC14 1 63 86 0,33
S2 AC14 1 20 95 0,28
S3 AC14 1 102 64 0,34
S4 Hall 1 23 76 0,28
S5 Hall 1 27 72 0,28
S6 Hall 1 22 80 0,26
V1 AC14 3 107 73 0,33
V2 Hall 1 27 75 0,34
V3 AC14 1 20 78 0,19
V4 Hall 1 24 79 0,26
V5 AC14 1 31 80 0,67
V6 Hall 1 26 80 0,67
The first column is labelling the position and the test site (N = BSH North, S = BSH South, V = TSS). Subsequently, anchor type and the number of pulls are listed. On some position the anchor handling vessels has pulled more than one time to ensure maximum performance of the anchor. Then the parameters of the pulls are specified: length of the entire pulls, maximum pulling force as recorded by the anchor handling vessel and the maximum penetration depth as processed out of the SES survey.
As expected the deepest anchor penetration was recorded at the test-site »BSH Nord« with its loosely layered fine sand. Due to soil conditions the other two test-sites are showing significantly less penetration. None of the overall 17 trials, which have been processed, showed an anchor penetra-tion depth of more than 1 m including possible er-
to the level which can be assumed as ›undisturbed seabed‹, like it has been before the anchor was dragged through. The difference between these two levels (›undisturbed seabed‹ – ›deepest point of influence‹) gives the maximum penetration depth of the anchor into the seabed. In Fig. 6 the procedure for the analysis of the anchor penetra-tion depth is shown. There are two anchor tracks
Fig. 4: SES survey lines (blue) on top of an SSS image with
anchor track
Fig. 5: Schematic illustration of a combined SES/SSS survey
Fig. 6: Derivation of the anchor penetration depth out of SES echo plots
HN 100 — 02/2015 19
Applied research
areas. Extrapolation to silts (mud) or coarser ma-terial (gravels) cannot be justified without further study.
The results of the field measurement pro-gramme in the area of the TSS »Terschelling – Ger-man Bight« have been stated as confident and ro-bust by the involved research institutes BAW and Deltares.
Furthermore, it has to be considered that the presented approach is deterministic. However, for a final evaluation of anchor risk to a buried cable, also probabilistic aspects have to be taken into ac-count. Much more information is needed about the distribution of anchor masses, anchor types, soil conditions, frequency of emergency anchor-ing operations, human errors, etc.
ConclusionThe results of the field measurement programme have been carefully discussed and evaluated among all stakeholders. In conclusion of the re-ports published by the involved research institutes BAW and Deltares the recommendation was given for a reduction of the prescribed burial depth for subsea power cables to 1.5 m below seabed – within and outside the TSS »Terschelling – German Bight«.
This proposal was picked up by the responsible authority (BSH). After coordinating with the Water-ways and Shipping Administration of the Federal Government (GDWS) this regulation was accepted for the Revised Draft of the »Spatial Offshore Grid Plan«, July 2014 (§ 5.3.2.7 and § 5.4.2.7).
This will result in considerable reduction of costs, maintenance time and disturbance to traffic, but without comprising the safety of either vessel traffic or undersea infrastructure. “
rors. In the crucial area of the TSS this value could even be detected as only 0.8 m.
DiscussionGenerally, the behaviour of an anchor depends on a wide range of parameters during the anchor-ing manoeuvre, such as: soil conditions of the sea-floor, geometry and weight of the anchor, position and orientation of the anchor in relation to chain and vessel, and the catenary (inclined chain). The currently valid depth requirements for laying cables resulted from safety values that had been determined in a general or worst-case man-ner. Regarding the penetration of an anchor into the seabed international recommendations gave a reference value of 1.0 for the relation between the depth of penetration and the length of the anchors’ fluke. Typical ship anchors, like the ones which have been used for this experiment, have a fluke length of 2 m. When taken into account that there are also bigger anchors in use, this value re-flects the prescribed burial depth of 3 m which is given in the regulations at that time.
In contrast to this, it was concluded that for none of the 17 trials of the field measurement pro-gramme more than 1.0 m penetration below the seabed could be detected (including measure-ment uncertainties). That means that the relation between the penetration depth and the length of the fluke is only ~0.5, based on the results of an experiment under realistic conditions. This gave a significantly reduced penetration compared to the reference value. The main reason for that is, that it can be expected under the site specific soil condi-tions that the anchors’ shank always lies on top of the sea-floor and does not penetrate it. This can be completely different in areas with soft (= muddy) sediment structures at the seabed.
A correction of the processed anchor penetra-tion depth has to be applied due to an inclination angle of the chain. Maximum anchor performance is given when the shank is orientated horizontally on the seabed. Any inclination of the chain will cause a rotation of the anchor around its crown in the direction of the chain. This has implications for the holding capacity of the anchor (which is not discussed here) as well as for the penetration of the anchor (Fig. 8).
Another issue is the extrapolation of the test re-sults to other ships and anchor types. According to the studies of the involved research institute Deltares an extrapolation of the test results gives a maximum penetration depth of ~1.25 m from a 22.5 ton anchor as used by the 188,000 dwt »Mar-co Polo« – one of the world’s largest container ves-sels.
The penetrations that were recorded showed a good correlation with the soil conditions at the three test areas (loose to medium dense and dense sand, partly underlying firm clay). This sug-gests that the tests are a reliable basis for the as-sessment of penetration depth of anchors in such
○ crossing point SES – anchor track ♦ Drop- / Endposition → direction of pull, (2 pulls)
0.56 m 0.23 m 0.72 m 0.56 m 0.29 m
Depth profile of anchor track
SSS
SES
Fig. 7: Result of an anchor track survey: SES echo plots
at the crossing point with the anchor track (top); SSS
image of an anchor track, red dots: crossing points with SES
survey lines (centre); depth profile of the anchor track
Fig. 8: Rotation of the anchor around the crown due to chain inclination
Further readingsThe reports and presentations of the project can be found on the Wiki pages of the BAW (mixed language):www.baw.de/methoden/index.php5/Ankerzugversuche_2013