Page 1
Institutional Support to Ministry of Environment and Spatial Planning (MESP) & River Basin Authorities An EU project managed by the European Commission Liaison Office in KosovoImplemented by GFA consulting Group GmbH
HYDROLOGICAL ANALYSIS
Date of mission: 9th – 28th of June 2008
Basin hydrologist - ZX. FANG
from BRL ingénierie
Page 2
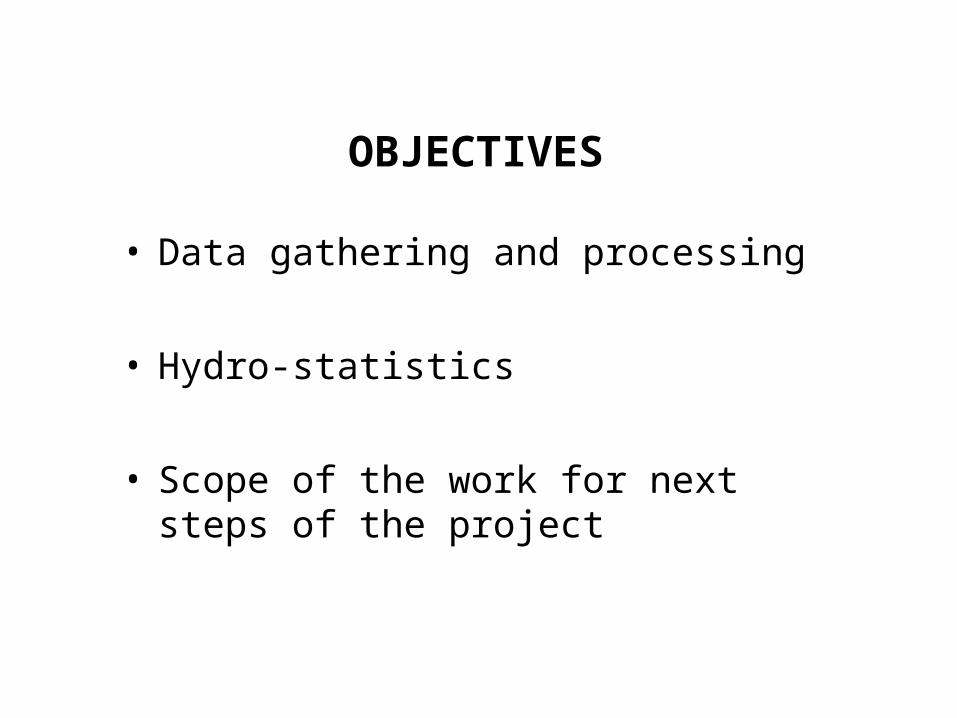
OBJECTIVES
• Data gathering and processing
• Hydro-statistics
• Scope of the work for next steps of the project
Page 3
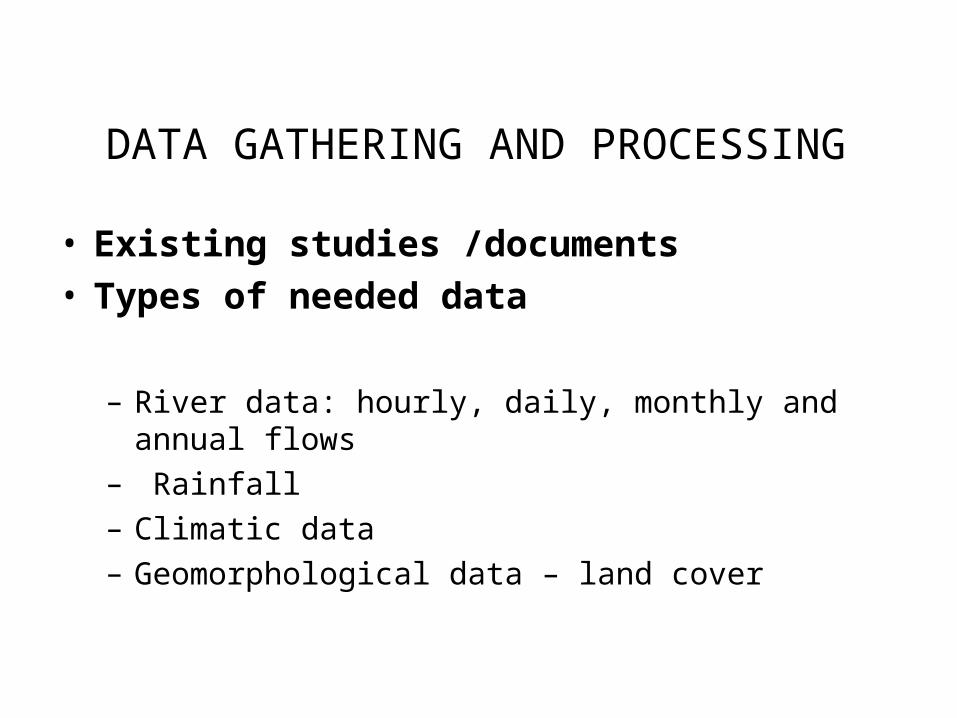
DATA GATHERING AND PROCESSING
• Existing studies /documents• Types of needed data
– River data: hourly, daily, monthly and annual flows– Rainfall– Climatic data– Geomorphological data – land cover
Page 4
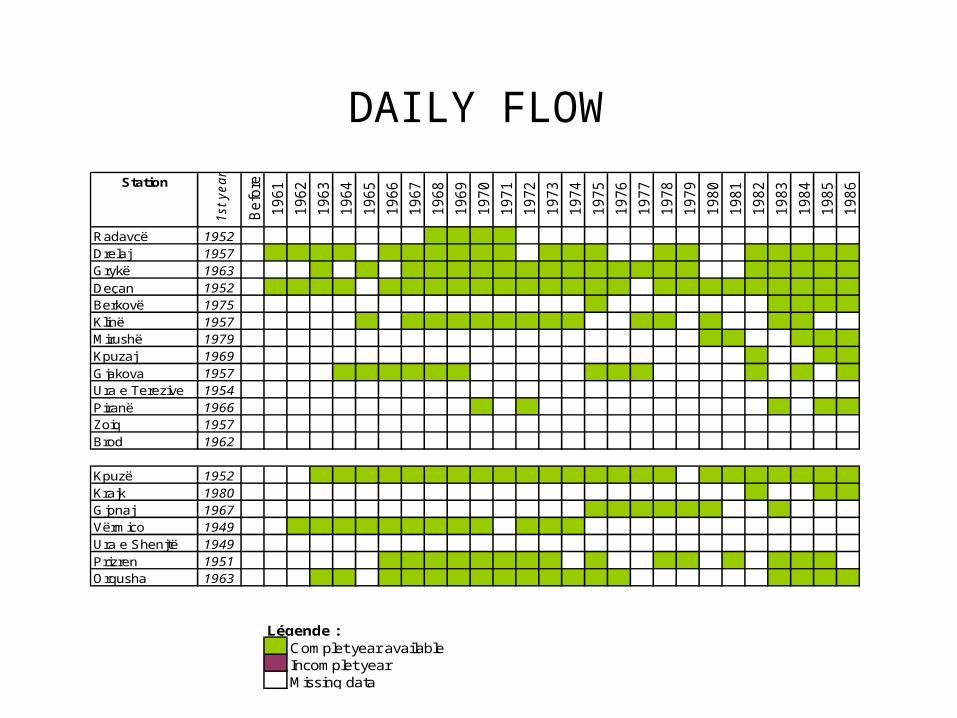
DAILY FLOW
Station
1st
ye
ar
Befo
re
1961
1962
1963
1964
1965
1966
1967
1968
1969
1970
1971
1972
1973
1974
1975
1976
1977
1978
1979
1980
1981
1982
1983
1984
1985
1986
Radavcë 1952Drelaj 1957Grykë 1963Deçan 1952Berkovë 1975Klinë 1957Mirushë 1979Kpuzaj 1969Gjakova 1957Ura e Terezive 1954Piranë 1966Zoiq 1957Brod 1962
Kpuzë 1952Krajk 1980Gjonaj 1967Vërmico 1949Ura e Shenjtë 1949Prizren 1951Orqusha 1963
Légende : Complet year availableIncomplet yearMissing data
Page 5
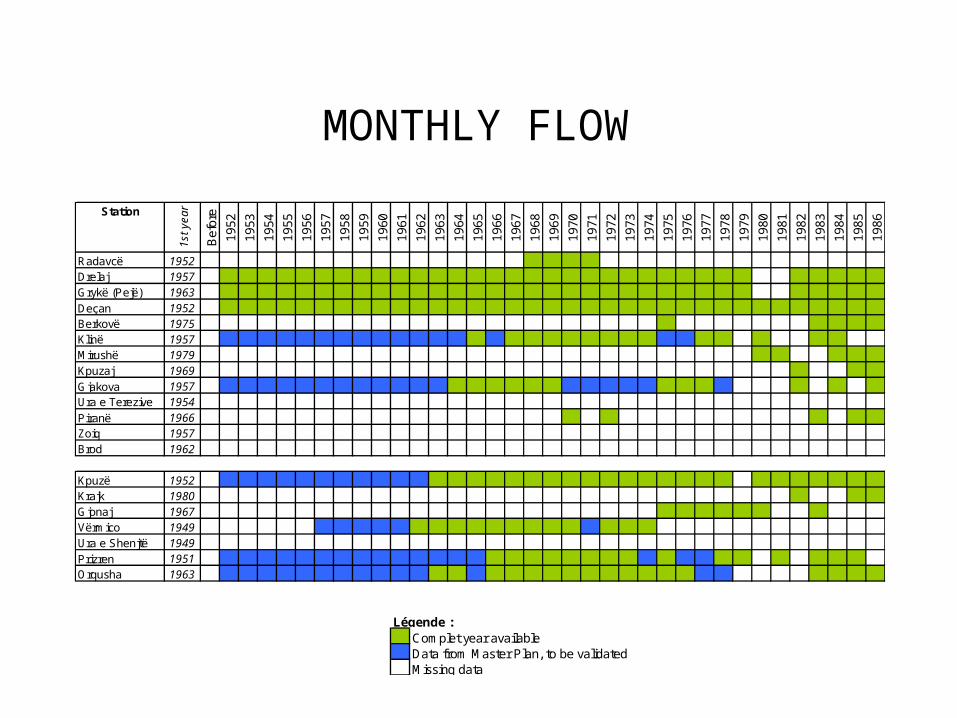
MONTHLY FLOW
Station
1st
ye
ar
Bef
ore
1952
1953
1954
1955
1956
1957
1958
1959
1960
1961
1962
1963
1964
1965
1966
1967
1968
1969
1970
1971
1972
1973
1974
1975
1976
1977
1978
1979
1980
1981
1982
1983
1984
1985
1986
Radavcë 1952Drelaj 1957Grykë (Pejë) 1963Deçan 1952Berkovë 1975Klinë 1957Mirushë 1979Kpuzaj 1969
Gjakova 1957Ura e Terezive 1954Piranë 1966Zoiq 1957Brod 1962
Kpuzë 1952Krajk 1980Gjonaj 1967Vërmico 1949Ura e Shenjtë 1949Prizren 1951Orqusha 1963
Légende : Complet year availableData from Master Plan, to be validatedMissing data
Page 6
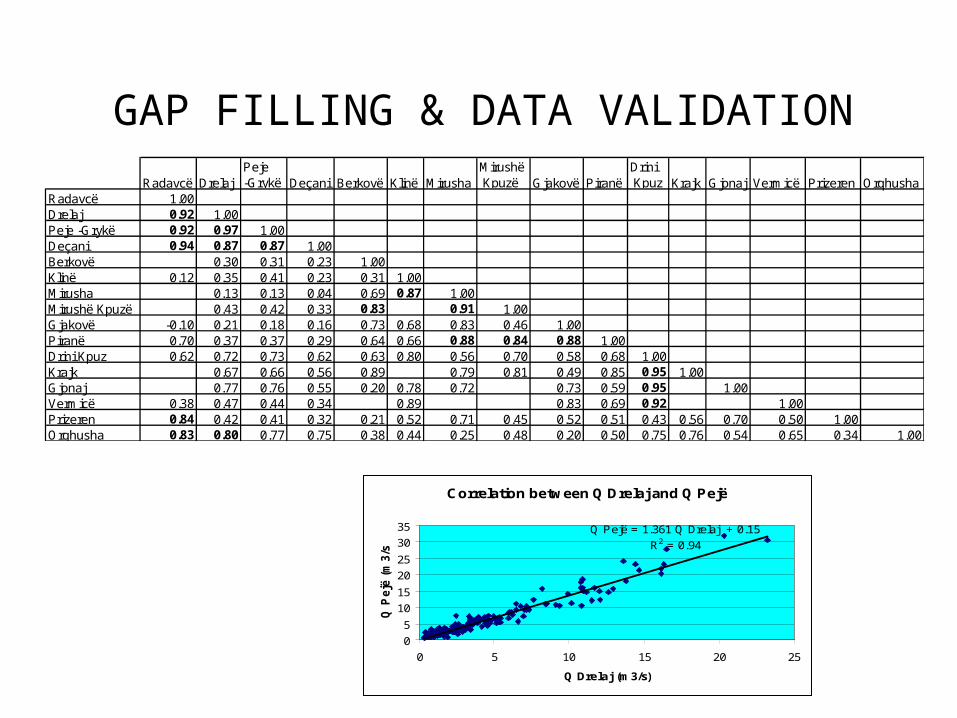
GAP FILLING & DATA VALIDATION
Radavcë Drelaj Peje -Grykë Deçani Berkovë Klinë Mirusha
Mirushë Kpuzë Gjakovë Piranë
Drini Kpuz Krajk Gjonaj Vermicë Prizeren Orqhusha
Radavcë 1.00Drelaj 0.92 1.00Peje -Grykë 0.92 0.97 1.00Deçani 0.94 0.87 0.87 1.00Berkovë 0.30 0.31 0.23 1.00Klinë 0.12 0.35 0.41 0.23 0.31 1.00Mirusha 0.13 0.13 0.04 0.69 0.87 1.00Mirushë Kpuzë 0.43 0.42 0.33 0.83 0.91 1.00Gjakovë -0.10 0.21 0.18 0.16 0.73 0.68 0.83 0.46 1.00Piranë 0.70 0.37 0.37 0.29 0.64 0.66 0.88 0.84 0.88 1.00Drini Kpuz 0.62 0.72 0.73 0.62 0.63 0.80 0.56 0.70 0.58 0.68 1.00Krajk 0.67 0.66 0.56 0.89 0.79 0.81 0.49 0.85 0.95 1.00Gjonaj 0.77 0.76 0.55 0.20 0.78 0.72 0.73 0.59 0.95 1.00Vermicë 0.38 0.47 0.44 0.34 0.89 0.83 0.69 0.92 1.00Prizeren 0.84 0.42 0.41 0.32 0.21 0.52 0.71 0.45 0.52 0.51 0.43 0.56 0.70 0.50 1.00Orqhusha 0.83 0.80 0.77 0.75 0.38 0.44 0.25 0.48 0.20 0.50 0.75 0.76 0.54 0.65 0.34 1.00
Correlation between Q Drelaj and Q Pejë
Q Pejë = 1.361 Q Drelaj + 0.15
R2 = 0.94
0
5
10
15
20
25
30
35
0 5 10 15 20 25
Q Drelaj (m3/s)
Q P
ejë
(m
3/s
)
Page 7
REFERENCE PERIODE FOR FLOW DATA
• Times series terminated in 1986, no recent flow data
• Reference period 1952-1986 for monthly flow (Qm)
• Daily flow (Qd): less data than QM
• QM + Qd: basic data for water resource assessment, modelling, indicators of EMF, permits for abstraction…
Page 9
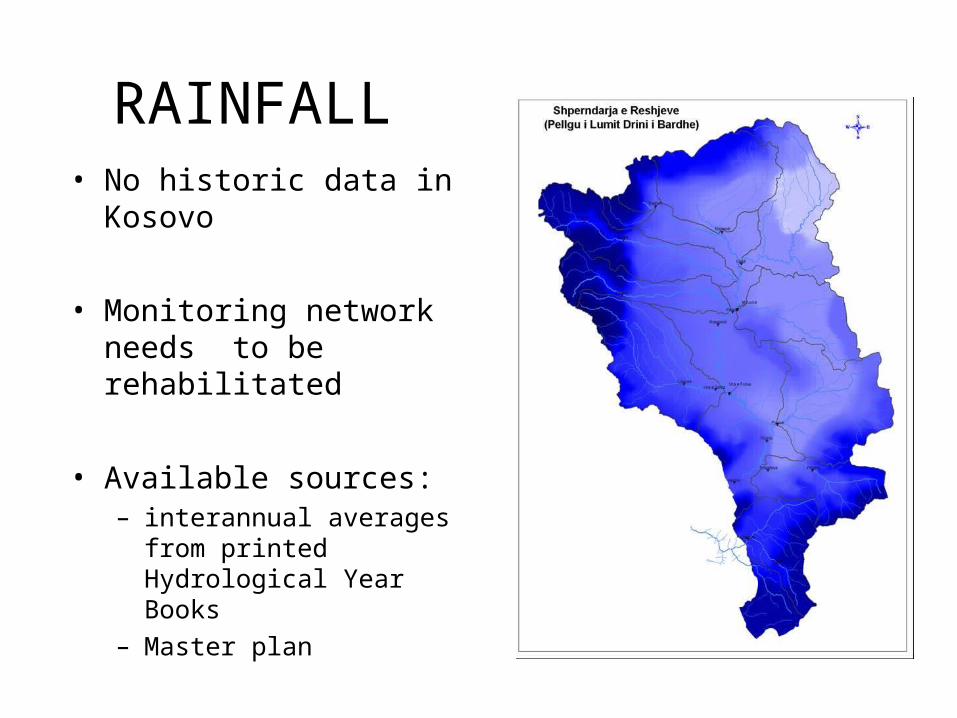
RAINFALL• No historic data in Kosovo
• Monitoring network needs to be rehabilitated
• Available sources: – interannual averages from
printed Hydrological Year Books
– Master plan
Page 10
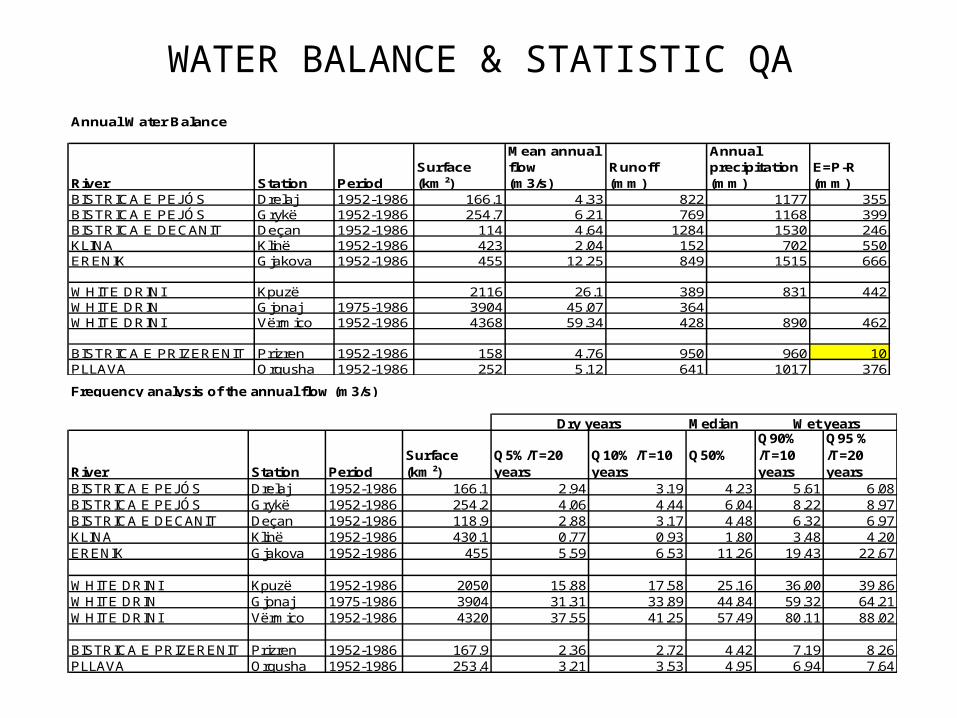
WATER BALANCE & STATISTIC QA
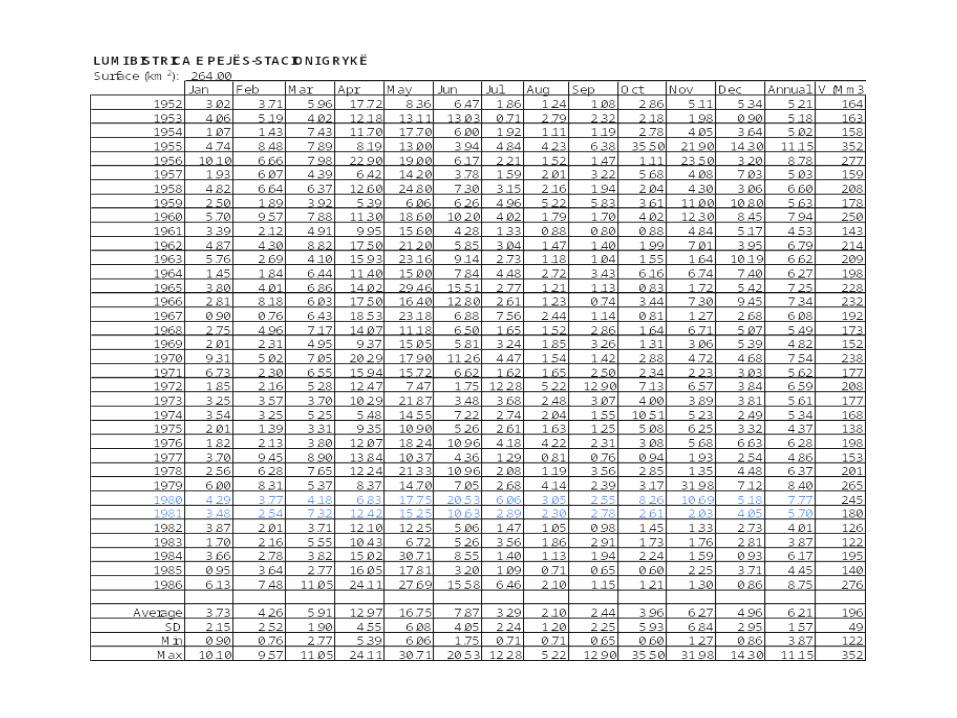
Annual Water Balance
River Station PeriodSurface (km²)
Mean annual flow (m3/s)
Runoff (mm)
Annual precipitation (mm)
E=P-R(mm)
BISTRICA E PEJÓS Drelaj 1952-1986 166.1 4.33 822 1177 355BISTRICA E PEJÓS Grykë 1952-1986 254.7 6.21 769 1168 399BISTRICA E DECANIT Deçan 1952-1986 114 4.64 1284 1530 246KLINA Klinë 1952-1986 423 2.04 152 702 550ERENIK Gjakova 1952-1986 455 12.25 849 1515 666
WHITE DRINI Kpuzë 2116 26.1 389 831 442WHITE DRIN Gjonaj 1975-1986 3904 45.07 364WHITE DRINI Vërmico 1952-1986 4368 59.34 428 890 462
BISTRICA E PRIZERENIT Prizren 1952-1986 158 4.76 950 960 10PLLAVA Orqusha 1952-1986 252 5.12 641 1017 376
Frequency analysis of the annual flow (m3/s)
Median
River Station PeriodSurface (km²)
Q5%/T=20 years
Q10% /T=10 years
Q50% Q90% /T=10 years
Q95 %/T=20 years
BISTRICA E PEJÓS Drelaj 1952-1986 166.1 2.94 3.19 4.23 5.61 6.08BISTRICA E PEJÓS Grykë 1952-1986 254.2 4.06 4.44 6.04 8.22 8.97BISTRICA E DECANIT Deçan 1952-1986 118.9 2.88 3.17 4.48 6.32 6.97KLINA Klinë 1952-1986 430.1 0.77 0.93 1.80 3.48 4.20ERENIK Gjakova 1952-1986 455 5.59 6.53 11.26 19.43 22.67
WHITE DRINI Kpuzë 1952-1986 2050 15.88 17.58 25.16 36.00 39.86WHITE DRIN Gjonaj 1975-1986 3904 31.31 33.89 44.84 59.32 64.21WHITE DRINI Vërmico 1952-1986 4320 37.55 41.25 57.49 80.11 88.02
BISTRICA E PRIZERENIT Prizren 1952-1986 167.9 2.36 2.72 4.42 7.19 8.26PLLAVA Orqusha 1952-1986 253.4 3.21 3.53 4.95 6.94 7.64
Dry years Wet years
Page 11
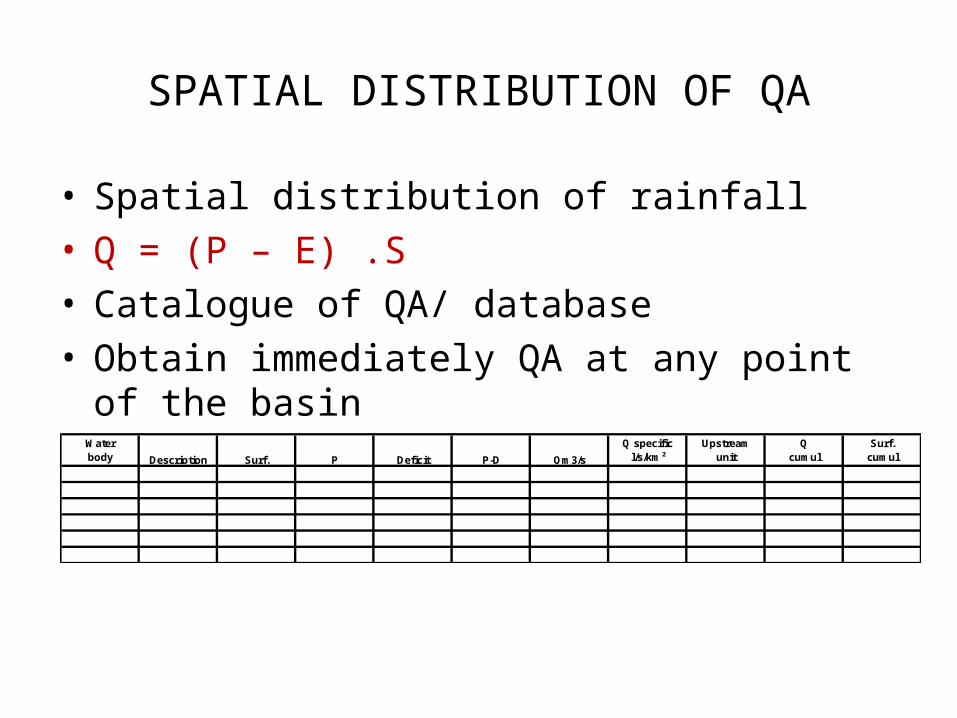
SPATIAL DISTRIBUTION OF QA
• Spatial distribution of rainfall• Q = (P – E) .S• Catalogue of QA/ database• Obtain immediately QA at any point of the basin
Water Q specific Upstream Q Surf.body l/s/km² unit cumul cumulP-D Qm3/sDescription Surf. P Deficit
Page 12
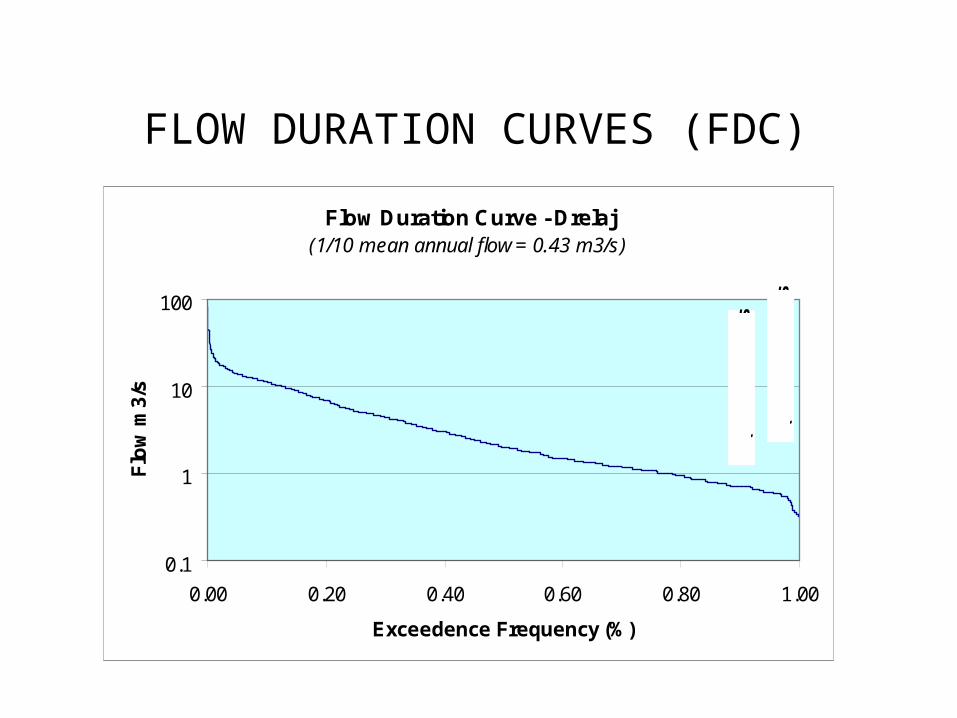
FLOW DURATION CURVES (FDC)
Flow Duration Curve - Drelaj(1/10 mean annual flow = 0.43 m3/s)
0.1
1
10
100
0.00 0.20 0.40 0.60 0.80 1.00
Exceedence Frequency (%)
Flo
w m
3/s
Q90
% =
0.7
m3/
s
Q95
% =
0.61
m3/
s
Page 13
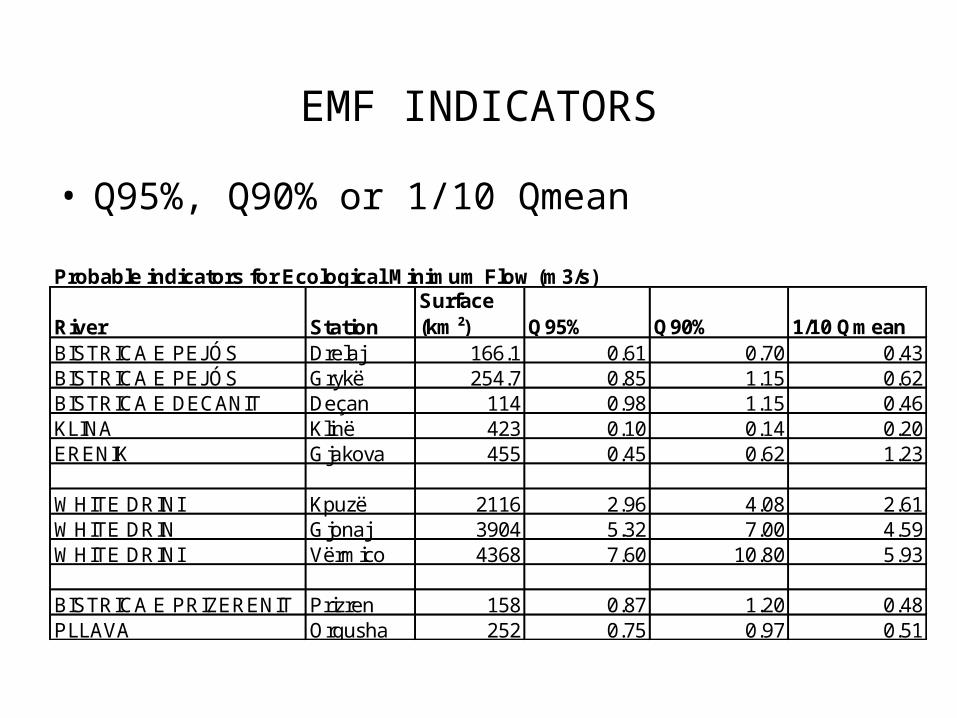
EMF INDICATORS
• Q95%, Q90% or 1/10 Qmean
Probable indicators for Ecological Minimum Flow (m3/s)
River StationSurface (km²) Q95% Q90% 1/10 Qmean
BISTRICA E PEJÓS Drelaj 166.1 0.61 0.70 0.43BISTRICA E PEJÓS Grykë 254.7 0.85 1.15 0.62BISTRICA E DECANIT Deçan 114 0.98 1.15 0.46KLINA Klinë 423 0.10 0.14 0.20ERENIK Gjakova 455 0.45 0.62 1.23
WHITE DRINI Kpuzë 2116 2.96 4.08 2.61WHITE DRIN Gjonaj 3904 5.32 7.00 4.59WHITE DRINI Vërmico 4368 7.60 10.80 5.93
BISTRICA E PRIZERENIT Prizren 158 0.87 1.20 0.48PLLAVA Orqusha 252 0.75 0.97 0.51
Page 14
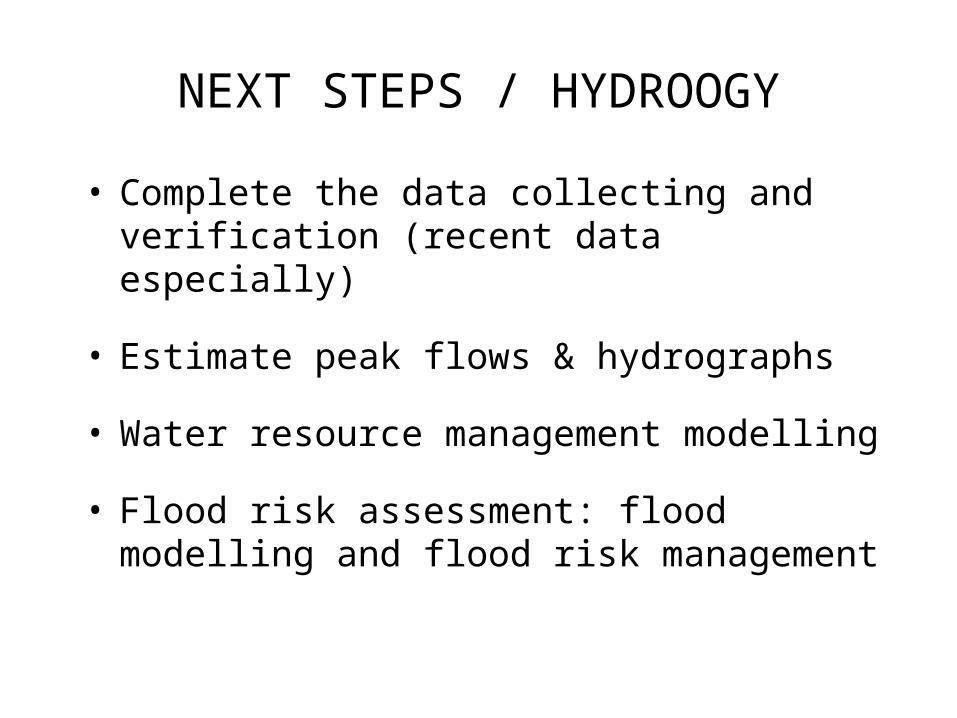
NEXT STEPS / HYDROOGY
• Complete the data collecting and verification (recent data especially)
• Estimate peak flows & hydrographs
• Water resource management modelling
• Flood risk assessment: flood modelling and flood risk management
Page 15
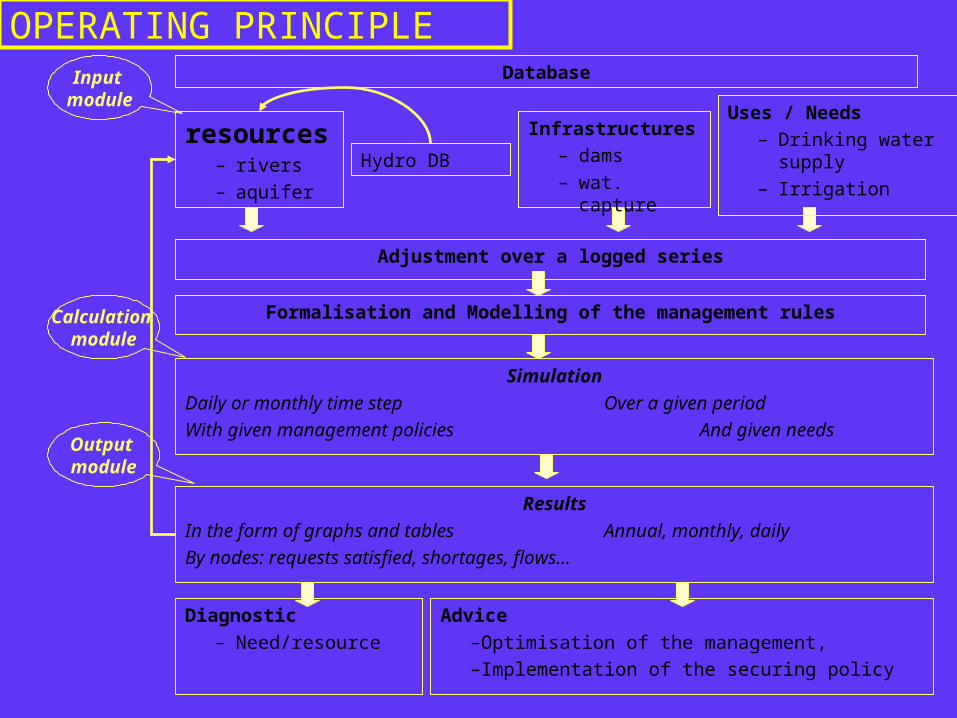
WATER RESOURCE MANAGEMENT MODELLING
• Objective– To better assess water availability– To improve the management of conflicting situations– To optimise water allocation
Page 16
Results
In the form of graphs and tables Annual, monthly, daily
By nodes: requests satisfied, shortages, flows...
Output module
resources – rivers– aquifer
Hydro DB
Adjustment over a logged series
OPERATING PRINCIPLEDatabase
Formalisation and Modelling of the management rules
Diagnostic– Need/resource
Advice–Optimisation of the management,–Implementation of the securing policy
Uses / Needs– Drinking water
supply– Irrigation
Infrastructures – dams– wat. capture
Input module
Simulation
Daily or monthly time step Over a given period
With given management policies And given needs
Calculation module
Page 17
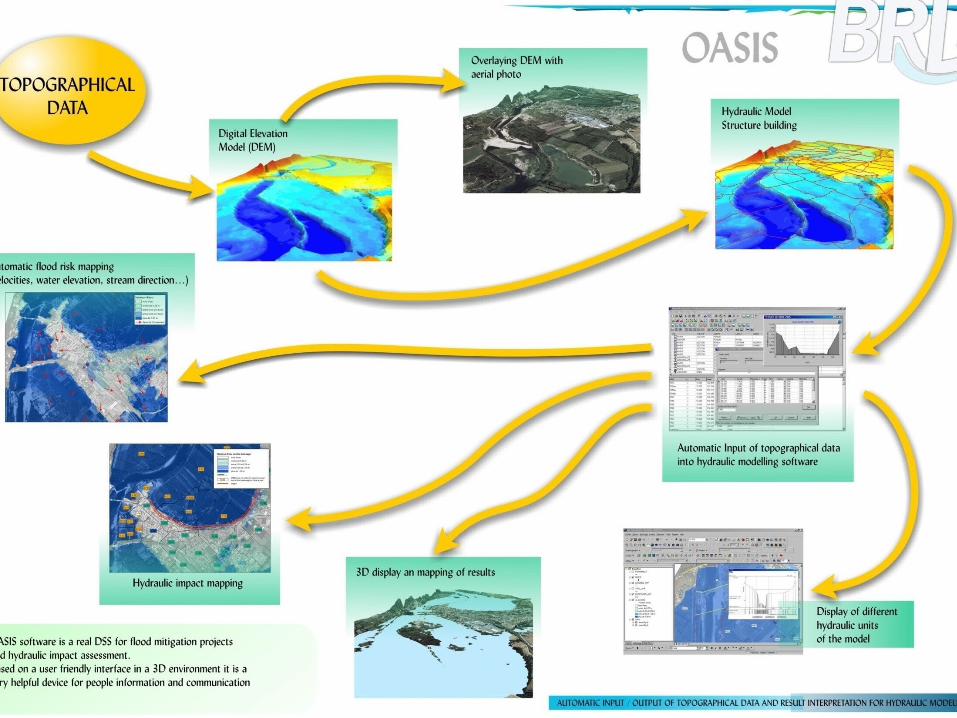
FLOOD RISK ASSESSMENT
Page 18
THANK YOU FOR COOPERATION