IJISET - International Journal of Innovative Science, Engineering & Technology, Vol. 4 Issue 3, March 2017 ISSN (Online) 2348 – 7968 | Impact Factor (2016) – 5.264 www.ijiset.com 171 Hydrology of Wadi El Sanab, El Qasr area, West Mersa Matrouh, Northwestern Coastal Zone – Egypt. * Hassan S. Sabet ** Yehia L. Ismail *** Said A. F. Hawash & *Ezz El Deen S. *Department of Geology, Faculty of Science, Al-Azhar University, Egypt. ** Hydrology Department, Desert Research Center, Cairo, Egypt. *** Control & Cath. Prot. Dep., MERI, National Water Research Center, Delta Barrage (El-Kanater), Qalyubia, Egypt. AbstractThe main objective of this research is to assess the water resources in one of the main drainage basins in the northwestern coast of Egypt. The area of study has a population growth and agricultural activities, which require necessary development of water resources. Rainfall and surface runoff are the recharge resources, which should be taken into consideration in water resources planning and management in developing processes. The quantitative analysis of surface runoff which has been occurred during the rainfall storm of December 2015. Above all, the present work focused some light on the characteristics of the water bearing formation in the study Wadi. The investigated Wadi has two aquifers: Quaternary (wadi fill) and Middle Miocene (Marmarica Limestone). The recharge to these aquifers comes either from the direct infiltration of the rainfall, and/or from the surface runoff, which reveals that the volume of runoff is 118000 m3 . The groundwater in the study area is evaluated qualitatively for drinking, domestic, livestock and agricultural purposes. The present study reaches out for some recommendations to develop the surface water and groundwater in the study area. Key Words Water resources planning and management, Surface water, Groundwater, Water bearing formation Hydraulic parameters, Rainfall Runoff Relationship. Introduction The surface water in the coastal area is very limited in magnitude as it originates from the rainfall of the winter season (Sewidan 1978; El Bastawesy et al. 2008). The hydrogeological framework of Egypt is composed of several different aquifer systems. They differ in general characteristics, including extension, transmissivity, renewability etc. (Hefny et al. 1992). Wadi flow as result of rainfall storms becomes one of the alternative managerial considerations in water resources planning and management. Runoff is possible after rather heavy rains, and a considerable amount of water may percolate to deeper soil layers. Water from Wadi may be used directly through surface storage and indirectly through groundwater storage. The important of this study comes from that the application of the integrated water resources development and management in one of the promising hydrographic basins called Wadi El Sanab in El Qasr area, west Mersa Matrouh along the north western coastal zone. So, the main target of this study is to find other water supplies by carrying out good assessment for both surface and groundwater resources in the investigated Wadi. This target is achieved through an integrated works in both field and office. This includes, infiltration tests, pumping tests, surface runoff and flash flood estimation, as well as, groundwater assessment. Regional information on the hydrogeological conditions of the Northwestern coastal zone of Egypt can be found in several publications and theses such as El Shamy (1968), Hammad (1966, 1972), Misak (1974), El Shazly et al. (1975), Ezzat (1976), Hilmy et al. (1978), Sewidan (1978), Guindy (1989) and El Maghraby (1997). Also, some reports were prepared such as FAO (1970), Mudallal (1990) and El-Raey (1998). The previous literature concluded that the Northwestern coast receives amounts of annual rainfall where distributed in the form of surface runoff, and/or infiltrate to recharge the groundwater, (Raslan 1995; El-Raey; 1998; El-Sharabi E 2000).
Transcript
IJISET - International Journal of Innovative Science, Engineering & Technology, Vol. 4 Issue 3, March 2017
Hydrology of Wadi El Sanab, El Qasr area, West Mersa Matrouh, Northwestern Coastal Zone – Egypt.
* Hassan S. Sabet ** Yehia L. Ismail *** Said A. F. Hawash & *Ezz El Deen S.
*Department of Geology, Faculty of Science, Al-Azhar University, Egypt.
** Hydrology Department, Desert Research Center, Cairo, Egypt. *** Control & Cath. Prot. Dep., MERI, National Water Research Center, Delta Barrage (El-Kanater), Qalyubia, Egypt.
UAbstractU The main objective of this research is to assess the water resources in one of the main
drainage basins in the northwestern coast of Egypt. The area of study has a population growth and agricultural activities, which require necessary development of water resources. Rainfall and surface runoff are the recharge resources, which should be taken into consideration in water resources planning and management in developing processes. The quantitative analysis of surface runoff which has been occurred during the rainfall storm of December 2015. Above all, the present work focused some light on the characteristics of the water bearing formation in the study Wadi. The investigated Wadi Uhas Utwo aquifers: Quaternary (wadi fill) and Middle Miocene (Marmarica Limestone). The recharge to these aquifers comes either from the direct infiltration of the rainfall, and/or from the surface runoff, which reveals that the volume of runoff is 118000 m P
3P. The groundwater in the study area is
evaluated qualitatively for drinking, domestic, livestock and agricultural purposes. The present study reaches out for some recommendations to develop the surface water and groundwater in the study area.
UKey Words Water resources planning and management, Surface water, Groundwater, Water bearing formation Hydraulic parameters, Rainfall Runoff Relationship.
UIntroduction The surface water in the coastal area is very limited in magnitude as it originates from the
rainfall of the winter season (Sewidan 1978; El Bastawesy et al. 2008). The hydrogeological framework of Egypt is composed of several different aquifer systems. They differ in general characteristics, including extension, transmissivity, renewability etc. (Hefny et al. 1992). Wadi flow as result of rainfall storms becomes one of the alternative managerial considerations in water resources planning and management. Runoff is possible after rather heavy rains, and a considerable amount of water may percolate to deeper soil layers. Water from Wadi may be used directly through surface storage and indirectly through groundwater storage. The important of this study comes from that the application of the integrated water resources development and management in one of the promising hydrographic basins called Wadi El Sanab in El Qasr area, west Mersa Matrouh along the north western coastal zone. So, the main target of this study is to find other water supplies by carrying out good assessment for both surface and groundwater resources in the investigated Wadi. This target is achieved through an integrated works in both field and office. This includes, infiltration tests, pumping tests, surface runoff and flash flood estimation, as well as, groundwater assessment. Regional information on the hydrogeological conditions of the Northwestern coastal zone of Egypt can be found in several publications and theses such as El Shamy (1968), Hammad (1966, 1972), Misak (1974), El Shazly et al. (1975), Ezzat (1976), Hilmy et al. (1978), Sewidan (1978), Guindy (1989) and El Maghraby (1997). Also, some reports were prepared such as FAO (1970), Mudallal (1990) and El-Raey (1998). The previous literature concluded that the Northwestern coast receives amounts of annual rainfall where distributed in the form of surface runoff, and/or infiltrate to recharge the groundwater, (Raslan 1995; El-Raey; 1998; El-Sharabi E 2000).
UMaterials and methods The present work includes a group of studies which deal with geomorphology, geology,
hydrogeology and hydrogeochemistry. The field studies comprised reconnaissance survey of the various land forms, rock exposures and hydrographic pattern using topographic maps and geological map, carrying out pumping tests and recovery tests on some representative wells, carrying out infiltration tests in the study area to estimate the infiltration rates for the surface soil in the study Wadi, carrying out measurements of the depth to water in the drilled wells, Evaluation of Rainfall – Runoff relationship, full description of the aquifers and groundwater occurrence in the study area to assess the groundwater potentiality as a supplementary resource, collecting representative samples for chemical analysis in the central laboratory of Desert Research Center (DRC), representing the chemical data using standard diagrams and make qualitative evaluation for groundwater. Finally the recommendations for water harvesting are prepared to achieve the sustainable development.
UArea of study The Northwestern coastal zone extends from Alexandria in the east for 520 km to El-Salloum
on the Libyan border in the west and represents a portion of the small semi-arid belt of North Africa which receives winter rainfall. The area of study occupies the central portion of the northwestern coastal zone. Wadi El Sanab located west Mersa Matrouh city. It extends over an area of about17 km inland and stretches along the coast for 3 km. It lies between longitudes 27˚ 02ʹ 00ʺ and 27˚ 08ʹ 00 ʺ E and latitudes 31˚ 14ʹ 00ʺ and 31˚ 22ʹ 00ʺ N and finally drains towards the Mediterranean Sea at north (Fig. 1).
Fig. 1: Key map of the study Wadi.
UClimate Generally, the weather along the coastal zone is characterizes by arid climate, a rainy unstable
winter, a stable warm and dry summer. The other two seasons are also characterized by unstable climatic conditions. In the Northwestern Mediterranean coastal zone precipitation is considered as the main source of recharge of groundwater aquifers. The Mediterranean coastal zone of Egypt receives noticeable amounts of rainfall, especially in winter. About 97% of this amount falls between October and March. The Desert Research Center has been installing meteorological weather stations along the Northwestern coast to measure the amount of rainfall. The average
annual precipitation in the period from 1998 to 2006 was 103.1 mm in El Negela station (nearest station to Wadi El Sanab basin) (Yousif, M., Abd, E.S.E. and Baraka, A., 2013). The relative humidity is high in July (73%) and moderate in March (63%). Evaporation intensity varies from 162 mm in summer and 28 mm in winter. Air temperature is relatively mild in summer (26.8 °c) and low in winter (12.8 °c) (EL Sabri, etal., 2011).
UGeologyU The exposed rocks in the Northwestern coastal zone are entirely of sedimentary origin ranging
in age from Early Miocene to Holocene with a maximum thickness of about 200 m (Atwa, 1979) (Fig.2).
Fig. 2: Geological map of the study area (After Conoco, 1987).
The Holocene deposits formed of beach loose carbonate sand, lagoonal and alluvial deposits. The alluvial deposits are generally composed of Quartz sand, silt and clay filling the shallow elongated depressions and channels of drainage lines, while the lagoonal deposits prevail in the lower parts of the elongated depressions. The Pleistocene sediments are differentiated into Oolitic limestone and pink limestone. The Oolitic limestone covers the greater parts of the Northwestern coastal zone, where it constitutes the main aquifer in the area. The Pliocene sediments are limited on surface but it present in the subsurface concealed under younger formations of the Miocene sediments are represented by Marmarica limestone Formation, where they cover the most part of the northern plateau of the Western Desert (Said, 1962). The stratigraphic units in the study area are described from older to younger as follows (Fig. 3).
Fig. 3: Stratigraphic sequence and water bearing properties of the Northwestern coast
of the Mediterranean Sea(After F.A.O., 1970).
Tertiary The Tertiary deposits are exposed mainly in the southern parts of the study area, and
constitute the major part of the tableland and include the following: Middle Miocene sediments: In the study area, the Middle Miocene sediments are represented
by the Marmarica limestone formation that constitutes the tableland in southern portion of the study area. This formation is built up of fissured and cavernous limestone, dolomitic limestone and sandy limestone intercalated partly with marl interbeds. The Middle Miocene exposures are covered by a rocky crust, which is found in the top surfaces, on the slopes, or even in the drainage courses. The thicknesses of this formation vary from basin to another. This variation is due to the local structure which affected each basin and increases the thickness of Middle Miocene exposures.
Quaternary Pleistocene sediments: The Pleistocene sediments are also widely distributed in the study area
and are mainly represented by Wadifill deposits, which constitute the main bulk of the Pleistocene sediments. Wadifill deposits are developed in the downstream of the Wadi in the form of Wadi terraces and Wadi fillings. These deposits are muddy deposits composed of sand, silt, and clay with abundant carbonate grains (Fig. 3).
UThe structural setting The geologic structures of the study area can be considered as a part of the main structure,
which affects the northwestern coast of Egypt. The northwestern coast is a series of structurally alternating positive and negative areas trending NE–SW which affects the Mediterranean coast (Fig. 2). The studied basin drains from the tableland, which represents a great Marmarican homocline and plunging in a NE-ward direction. Therefore, the mentioned tectonic movements lead to the occurrences of cracking and fracturing of the Middle Miocene rocks in the study area, where many fractures are recorded with different directions E–W, NE–SW and N–S. These fractures are the responsible for the occurrence of groundwater in the Middle Miocene rocks and play a main role in the recharge of this aquifer.
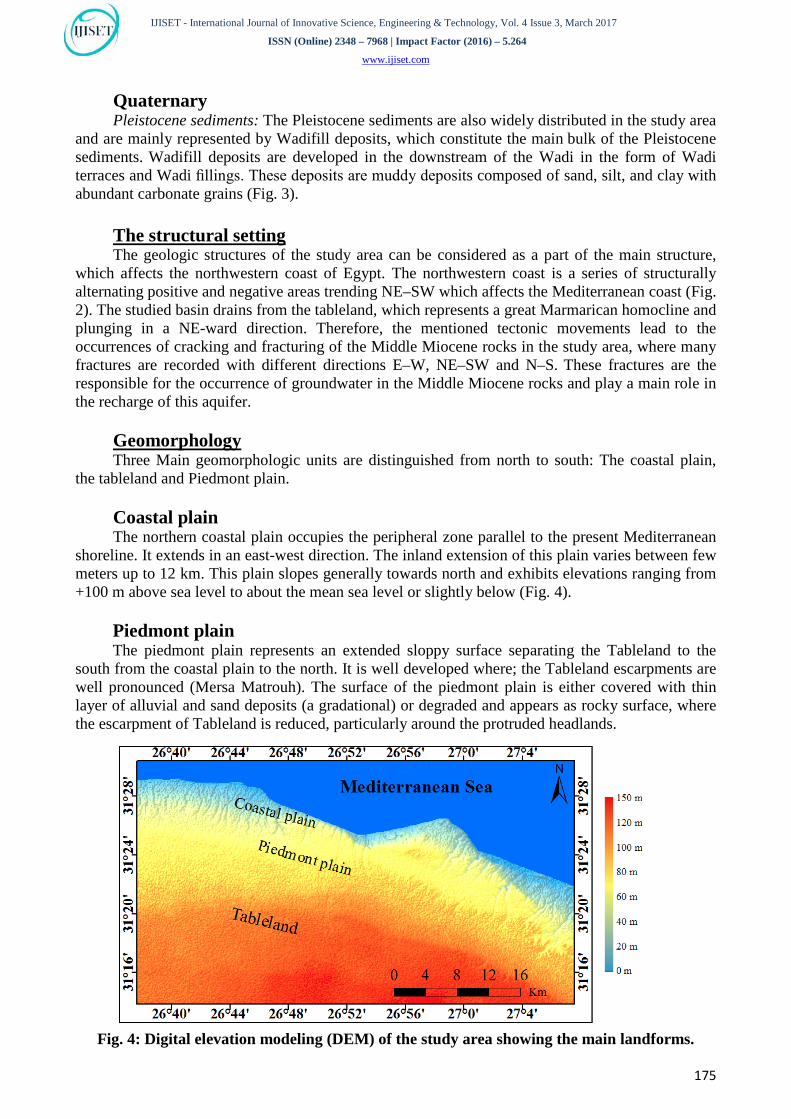
UGeomorphology Three Main geomorphologic units are distinguished from north to south: The coastal plain,
the tableland and Piedmont plain.
Coastal plain The northern coastal plain occupies the peripheral zone parallel to the present Mediterranean
shoreline. It extends in an east-west direction. The inland extension of this plain varies between few meters up to 12 km. This plain slopes generally towards north and exhibits elevations ranging from +100 m above sea level to about the mean sea level or slightly below (Fig. 4).
Piedmont plain The piedmont plain represents an extended sloppy surface separating the Tableland to the
south from the coastal plain to the north. It is well developed where; the Tableland escarpments are well pronounced (Mersa Matrouh). The surface of the piedmont plain is either covered with thin layer of alluvial and sand deposits (a gradational) or degraded and appears as rocky surface, where the escarpment of Tableland is reduced, particularly around the protruded headlands.
Fig. 4: Digital elevation modeling (DEM) of the study area showing the main landforms.
Tableland The southern Tableland comprises the most outstanding land feature in the Northwestern
coastal zone. It lies to the north of the Qattara Depression and slopes in the northward direction. It extends generally in an E – W direction with ground elevation of about 125m above sea level. The Tableland is composed mainly of fissured and jointed limestone whose top portion is highly weathered and is developed into a hard pink crust.
UGeological history The main events which took place during the Middle Miocene –Holocene period are
summarized as follows:
Middle Miocene ; with the end of Middle Miocene , there was an emergent phase due to the regional rise of the land surface (epeirogenesis ) resulted in the development of huge watershed areas , i.e. ancestry of the present day plateau. At that time the level of the Mediterranean Sea dropped to about 400m compared with the present level. This process continued during Upper Miocene (rocks belonging to this age are completely missing), and continental conditions prevailed .then the homoclinal plateau formed a watershed area and its surface was dissected by a great number of drainage lines directed to the sea.
Pliocene; with the start of Pliocene time further rise of sea level and marine erosion of the Northern edge of the tableland area took place and the early stages of the coastal plain were developed. There was a gradual rise of the water table and the ground water was subjected to deterioration due to seawater intrusion.
Plio-Pleistocene; at the end of the Pliocene and start of the Pleistocene time, the sea transgressed the northern edge of the Tableland and the pink limestone was deposited unconformably over the Middle Miocene strata. This is due to a regional minor Oscillation, which took place at these times.
Pleistocene; during this period the level of the Mediterranean Sea becomes successively lowered to approach its present level. The landscape is characterized by:
− The occurrence of elongate inland and offshore ridge standed parallel to the coast alternating with lagoonal depression (glacial and interglacial periods.
− The watershed area continuously contributed to the surface runoff.
− The development of new aquifers and the flushing of the old ones.
Holocene; during the Holocene, gradual development of aridity accumulation of dune sand deposit and the landscape acquired most of its present shape.
UResults and discussion UWater resources In the study area the water resources are mainly derived from atmospheric precipitation. Dams
and man-made underground storage cisterns or galleries are playing a vital role in collecting the surface runoff. On the other hand, groundwater is essentially discharged from wells. Precipitation or surface water that percolates downward is responsible for groundwater recharge. Climate, land use, soil type, geology…etc. are affecting on groundwater recharge. In the present work surface hydrology and groundwater hydrology were clarify in one of the essential basins which selected based on its ability to receive flash flood.
USurface hydrology Drainage characteristics The characteristics of the selected drainage basin are delineated from the quantitative
morphometric analysis and the estimation of basin relative hazard degree. Evaluation of the measuring morphometric parameters of the selected basin is achieved by using topographic maps with scale 1:50,000.
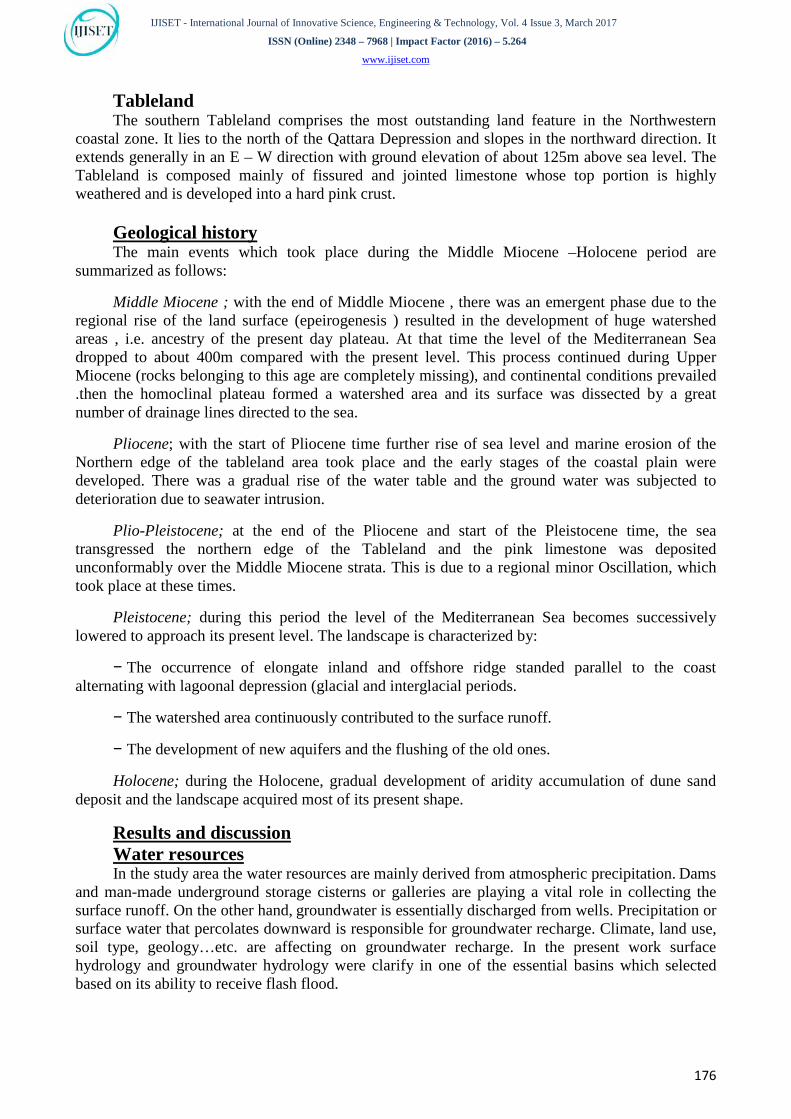
A brief discussion for each one in the following:- Order of the stream (U): The first step in drainage basin analysis is designation of stream
orders, following a system introduced by Horton's (1945) and slightly modified by Strahler (1952). There are 5 stream orders in the selected Wadi as shown in (Fig. 5). The estimation of both measured and calculated morphometric parameters (Basin area (A), Stream order (U), bifurcation ratio (RRbR), stream frequency (F)...etc.) based on Horton (1945), Melton (1957) and Strahler (1957) methodologies give the results listed in (Table 1).
The relative hazard degree analysis Plotting the obtained results of (RRbR), (D), and (F) data for the selected basin on the hydro-geo-
morphometric graph shows that Wadi El Sanab is projected in class (B) due to their values of stream frequency (F), drainage density (D) and bifurcation ratio (RRbR). Class (B) means these basins may represent the highest flood probability and the least groundwater potentiality, (Fig. 6).
Worth to mention that this kind of classification is depending only on three hydrogeomorphometric parameters which gives a general view about the relative hazard degree of the catchment of any basin.
Fig.6: Hydrogeomorphometric graph showing the different classes of the studied basin depending
on the relation between F, D and Rb (After El-Shamy 1992).
U = Order of the stream, Pr = Basin Perimeter (km), Vl =Valley length (km), Rb = Bifurcation ratio, Lo= Length of overland flow Re= Elongation ratio, SI = Slope Index, Rt =Texture ratio,
∑ Lu = Sum of stream lengths (km), ∑ Nu = Sum of stream numbers, F = Stream frequency, Rf =Relief (km), Ish = Shape Index, S = Inverse shape form, Rr = Relief ratio,
A = Basin Area (km2), Lb =Basin length (km), E =Internal relief (km), D = Drainage density, Rc = Circularity ratio, Sin = Sinuosity ratio, Rn = Ruggedness number, Wmrb = Weighted mean bifurcation ratio.
Rb: Bifurcation ratio F: Stream frequency D: Stream density A: Low flood possibilities
B: High flood possibilities C: Intermediate flood possibilities 1= Wadi El Sanab
UInfiltration rate determination The first process that occurs after flow starts in an ephemeral Wadi is the infiltration of the
water into the Wadi bed. This is very important process to study the soil characteristics within the investigated Wadi, through the calculation of the infiltration rates through them. To define the infiltration rate of the different soils, two infiltration tests are carried out at selected sites as shown in (Fig.1). The method which used in this study to determine the soil permeability is called Double Ring Infiltrometer (Sewidan, 1999). It consists of two coaxial rings of 25 and 50 cm diameter as shown in (Figs. 7 and 8).
The infiltration calculations and graphical representations are performed using the computer program INFITEST (Sewidan, 1999), which is based on Philip equation (1957).
Fig. 7: Double Ring Infiltrometer
Fig. 8: Field photographs show Double Ring Infiltrometer used in field measurements
In the study area, the common types of soil are loamy sand and Wadi fill deposits. So the better method for described it is Philip equation. By using a formula developed by Philip (1957) and with respect to soil type classification (Kohnke, 1980). Figs. 9and 10 shows the graphical representations of infiltration tests, which carried out in the study basin, while the results are listed in Table 2. The obtained values displayed that the infiltration rate is varies from moderately slow to moderately rapid.
Fig. 9: The infiltration rate and cumulative infiltration –time curves for Wadi El Sanab (Upstream)
Fig. 10: The infiltration rate and cumulative infiltration –time curves for
Wadi El Sanab (Downstream).
Table 2: The calculations values of infiltration rate for the investigated soil Test No.
Lat.
Long.
Infiltration Rate(m/day)
Evaluation according to kohnke classification Type of Soil
URainfall – Runoff relationship The rainfall – runoff relationship is influenced by catchment's characteristics and climatic
factors. The rainfall is almost the important factor. The first loss of the rainfall is through the interception by vegetation and artificial surfaces. This interception storage is lost completely by evaporation. The rainfall in excess of the interception storage falls to ground surfaces and infiltrates. The water in excess of infiltration capacity starts to accumulate over the surface and thus will be subject to evaporation. The remainder of the accumulated water will start moving by gravity towards the watershed outlet.
Hydrograph generation is an approach to calculate the peak discharge of surface runoff within the study Wadi. SMADA 6.0 (Storm water Management And Design Aid) computer program was used to generate the hydrograph and calculate the maximum runoff transferred to the delta of the study Wadi (Stubchear, 1975).
Santa Barbara Hydrograph type (SBUH) which was firstly presented by Stubchear applied in the present study from the program among the other types of runoff hydrograph calculation. The input data, output data and the resulting hydrograph presented in (Fig. 11 and Table 3). The hydrograph shows that the peak runoff equal to 2300 cf/sec and the total runoff transferred to the down portion of the investigated Wadi reaches 118000 m P
33.7 Length of main channel L (km) 20.5 Slope (S) 0.0123 Previous area (km P
2P) 29.7
Impervious area (kmP
2P) 3.37
Percent of impervious area (%) 10 Time of concentration (min.) 28 Minimum infiltration rate (m / day) 0.25
Maximum infiltration rate (m / day) 1.7
Step of rainfall (min) 15
Total rainfall duration (h) 2
Rainfall intensity (inch/h) 3.4
Curve number 71
Peak discharge (cf/sec.)
Output
2300
Total runoff ( m P
3P) 118000
Base time (h) 4
Time to peak (h) 2
UGroundwater occurrence UAquifer system The main aquifers in the study Wadi are the Quaternary (Wadifill deposits) aquifer and
Middle Miocene (Marmarica limestone) aquifer. It is represented in the courses of the depressions below the alluvial deposits and extends from the cliff of the plateau in the south to the shore line in the north.
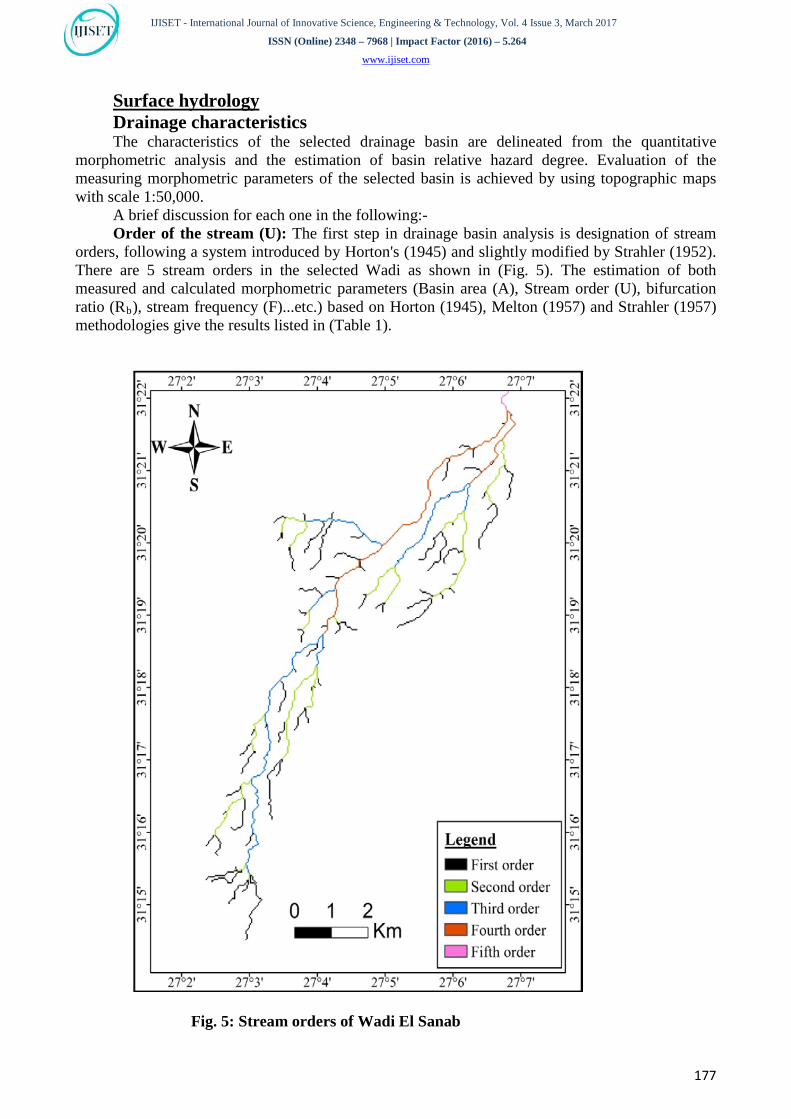
Hydraulic parameters namely hydraulic conductivity (k), the transmissivity (T) and storage coefficient (S) (or specific yields for unconfined aquifers). The hydraulic conductivity (k) is the amount of flow per unit cross section area -under the influence of a unit gradient. The transmissivity (T) is defined as the rate of flow under a hydraulic gradient equal to unity through a cross-section of unit width over the whole thickness of the aquifer. It is also equal to the product of the hydraulic conductivity (or permeability) and the thickness of the aquifer. The storage coefficient and the specific yield are both defined as the volume of water released or stored per unit surface area of the aquifer per unit change in the component of head normal to that surface. The storage coefficient refers only to the confined parts of an aquifer but the specific yield refers to the unconfined parts of the aquifer (Todd, 1959). During the field work, an approach was done to evaluate the hydraulic parameters of the study aquifers through long duration pumping tests (150 min), (Fig. 12).
Fig. 12: Field photographs show the wells of the studied aquifers [1a, b and 2 Wadifill Deposits aquifer (Pleistocene) & 3 Marmarica Limestone aquifer (M. Miocene).
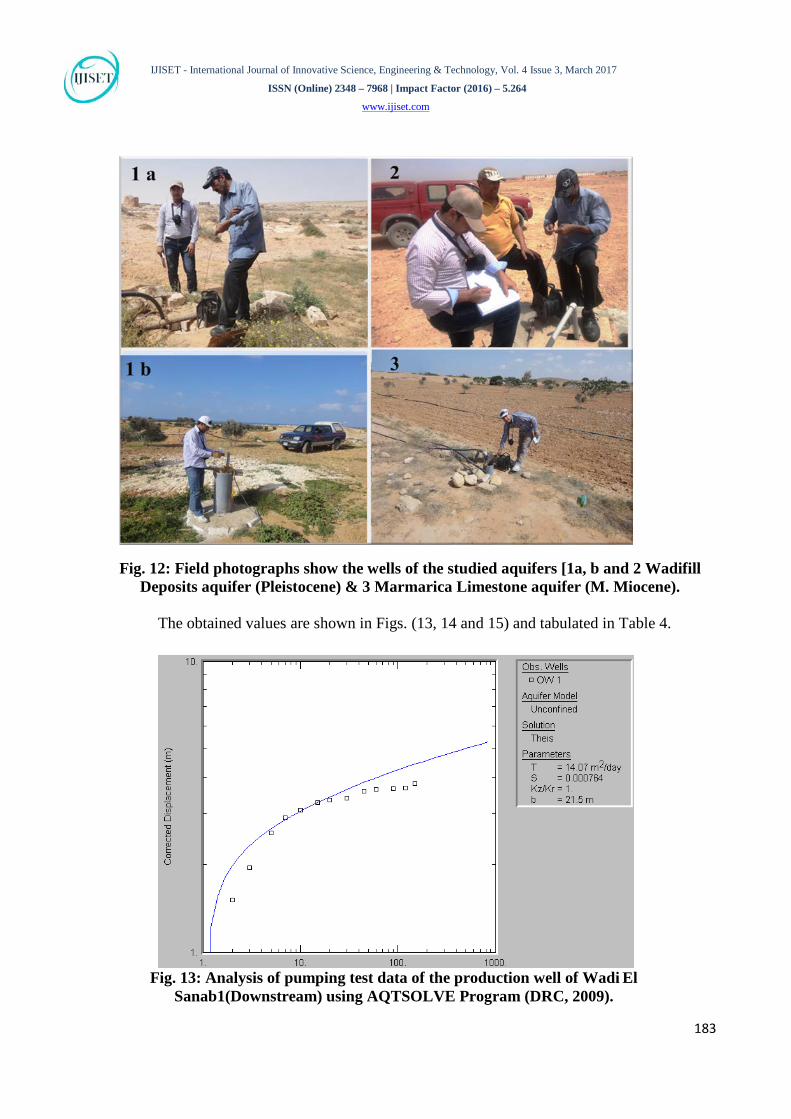
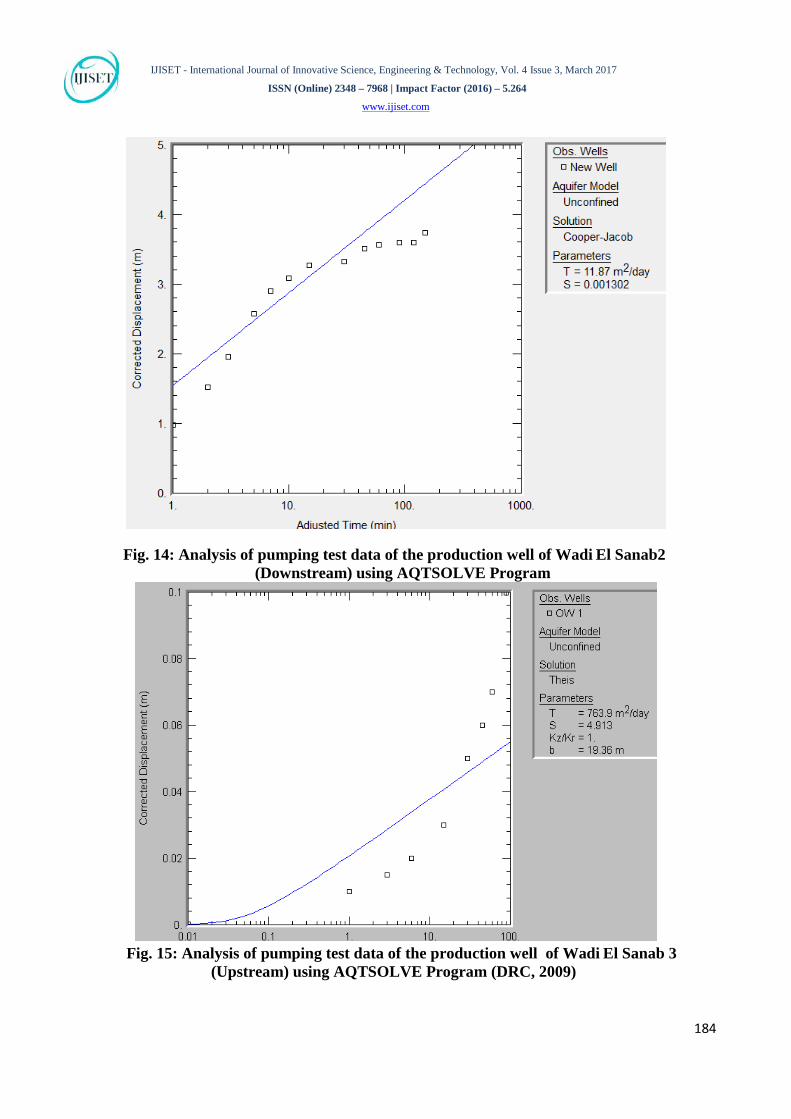
The obtained values are shown in Figs. (13, 14 and 15) and tabulated in Table 4.
Fig. 13: Analysis of pumping test data of the production well of Wadi El
Sanab1(Downstream) using AQTSOLVE Program (DRC, 2009).
The calculated values of the transmissivity in the downstream reveal low capability of aquifer deposits to transmit water through it. This could be attributed to the heterogeneity of lithofacies laterally and vertically for the water bearing formation. The obtained values of the transmissivity in the upstream reflect good aquifer potentiality. This is due to the limestone is highly fissured and jointed. So it is expected that certain amounts of the rainwater percolate both through joints and channels as well as through the secondary porous of fissured limestone to form the groundwater.
UChemistry of groundwater It is well known that the chemical characteristics of groundwater are mainly influenced by
rock interaction, sources of recharge, direction and rate of groundwater movement, in addition to other factors. The chemical analyses of the samples were carried out in the Desert Research Center (DRC). The sodium (NaP
+P) and potassium (KP
+P) contents were determined by means of flame
photometer technique. The concentrations of the other main cations (CaP
2+P and MgP
2+P) were measured
by means of spectrophotometer. Chloride, Sulfate and bicarbonate (Cl P
-P, SOR4RP
2- Pand HCOR3RP
-P), were
determined by titration (calorimetrically) method. The ions concentration values were expressed in milliequivalent and converted to ppm and percentage. The physical properties of groundwater are characterized by normal temperature ranging between 26.5 P
oP C and 30P
oP C suggesting the absence of
any geothermal activity. The pH values range from 6.65 and 6.8 while most of the samples are colorless. However, some samples are characterized by turbidity with variable colors, so these samples have been filtrated before carrying out chemical analysis. The results of groundwater chemical analysis shown in (Table 5) reveal the following chemical properties
WHO (2011) International Standards for Drinking-water suggested that concentrations of total solids greater than 1500 mg/l would markedly impair the palatability of the water, while the TDS guideline which was established by Environmental Protection Agency (EPA, 2011) was 500 mg/l.
In relation to TDS value and according to Hem (1970) the water type in the studied area ranging from brackish water to slightly saline.
Genesis of groundwater The groundwater in the study area was classified using Trilinear diagram of Piper (1953) and
Schoeller diagram (1962) to detect the genesis of groundwater. Representation of the Samples in the study area by Piper diagram reveals that the majority of water type is Magnesium-Sulfate MgSOR4R (Fig. 16 b).
The Piper diagram (Piper 1953) constitutes a useful tool in the interpretation of water chemistry. The studied groundwater samples fall into the sub-area 6 of the Piper diagram, which means that noncarbonated hardness ("secondary salinity") exceeds 50 %. Scholler’s diagram (Scholler 1962) was developed to enable a quick visual comparison of different water chemical composition. The relationship between two constituents (in milliequivalent per liter) of two different samples is comparatively expressed by the slopes of the straight lines connecting these constituents. Parallel lines in the diagram express an identical relationship between the charged chemical species. After plotting each component of the chemical constitution of the studied groundwater samples, the main group can be distinguished into two groups: Group (1): MgP
++P > CaP
++P> NaP
+ P/ SOR4RP
-- P> Cl P
-P > HCOR3RP
- P.Group (2): CaP
++P > MgP
++ P> NaP
+P / SOR4RP
--P > Cl P
-P >
HCOR3RP
-P , which reflects an advanced stage of hydrochemical evolution (Fig. 16 a). The general shape
of such groundwater profiles indicating that such groundwater is of meteoric origin and affected by continental processes. Generally, (Fig. 16a, b) can be interpreted as the main source of the groundwater is the rainwater.
Table 5: Hydrochemical analysis of groundwater samples in the study area
Fig. 16: Graphical representation of the geochemical data of the groundwater in Wadi El Sanab. (a) Schoeller diagram. (b) Piper diagram.
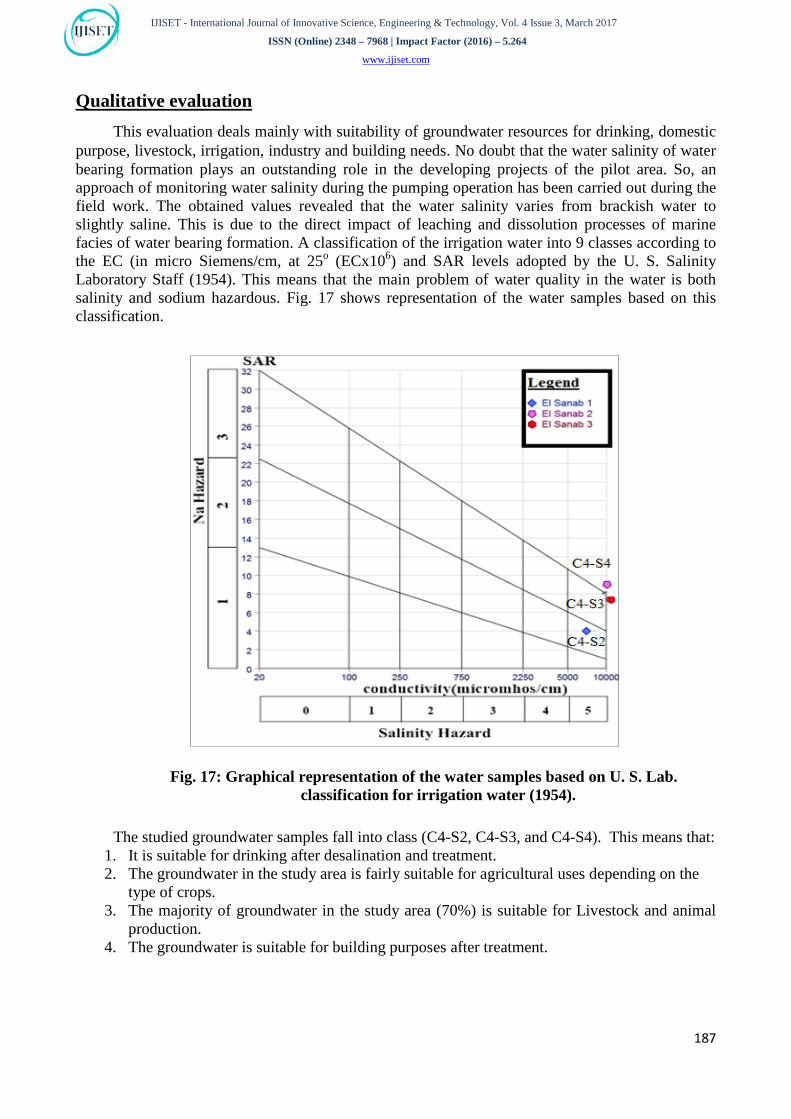
UQualitative evaluation This evaluation deals mainly with suitability of groundwater resources for drinking, domestic
purpose, livestock, irrigation, industry and building needs. No doubt that the water salinity of water bearing formation plays an outstanding role in the developing projects of the pilot area. So, an approach of monitoring water salinity during the pumping operation has been carried out during the field work. The obtained values revealed that the water salinity varies from brackish water to slightly saline. This is due to the direct impact of leaching and dissolution processes of marine facies of water bearing formation. A classification of the irrigation water into 9 classes according to the EC (in micro Siemens/cm, at 25P
oP (ECx10P
6P) and SAR levels adopted by the U. S. Salinity
Laboratory Staff (1954). This means that the main problem of water quality in the water is both salinity and sodium hazardous. Fig. 17 shows representation of the water samples based on this classification.
Fig. 17: Graphical representation of the water samples based on U. S. Lab.
classification for irrigation water (1954).
The studied groundwater samples fall into class (C4-S2, C4-S3, and C4-S4). This means that: 1. It is suitable for drinking after desalination and treatment. 2. The groundwater in the study area is fairly suitable for agricultural uses depending on the
type of crops. 3. The majority of groundwater in the study area (70%) is suitable for Livestock and animal
production. 4. The groundwater is suitable for building purposes after treatment.
UConclusions The main objective of the present study is how to assess the hydrologic potentialities of
surface water and groundwater in the study Wadi to achieve the sustainable development for the Bedouin communities. To achieve these objective field investigations, laboratory and computer analyses were carried out. The field work included reconnaissance survey of the various land forms, rock exposures and hydrographic pattern using topographic maps, geological map., collection of available climatic data from the meteorological station in the study area., carrying out pumping tests on some representative wells, carrying out infiltration tests for calculation the infiltration rates of the surface soil. DEM, Landsat images, topographic and geologic maps, chemical analysis, the application of GIS, AQTSOLVE and SMADA 6.0 software were used for data extraction and interpretation. The obtained values of infiltration tests displayed that the infiltration rate is vary from 0.25m/day (moderately slow) to 1.7 (moderately rapid) based on (Kohnke, 1980) classifications. The total volume of runoff during the rainfall storm of Dec., 2015 is 118000 m P
3P.
This amount varies from year to another depending on rainfall intensity and duration. Only minimum of that runoff are replenished the water bearing formations. So, the application of advanced harvesting techniques play an outstanding role in the management of surface runoff process. Such techniques include the construction of small earth dams along the Wadi for diverting flood water to be distributed to agricultural lands, where cereal crops grow with flood occurrence. These dams are sized in order to allow for the storage of water in wet years, while others are made to recharge the aquifers. On the other hand, the runoff can be utilized in rain feed cisterns to supply needed water. The calculated values of the transmissivity in the downstream range between 11.8 and 14 mP
2P/day. It reveals low capability of aquifer deposits to transmit water through it. This could
be attributed to the heterogeneity of lithofacies laterally and vertically for the water bearing formation. The obtained values of the transmissivity in the upstream reach to 764 mP
2P/day. Reflect
good aquifer potentiality. This is due to the limestone is highly fissured and jointed. So it is expected that certain amounts of the rainwater percolate both through joints and channels as well as through the secondary porous of fissured limestone to form the groundwater. The TDS of the studied groundwater vary between 2900and 4268 ppm, meaning that the choice tolerant of plants are very necessary for the saline water of water bearing formation. As well as, the manufacture of Olive oil are the better approaches for the Bedouins community of the study Wadi.
URecommendations According to the results of the present study, the following recommendations should be taken
into account: (1) Establishing of data base and updating of the input data by recent field investigations is
highly recommended to detect any deterioration in water quality and water quantity. (2) The using of new irrigation methods is recommended to minimize the irrigation water
losses and to improve the soil capability. (3) Observation and test wells are required for continuous monitoring of the groundwater
levels in the study area. (4) Updating of existing well information, by making periodic surveys and well inventories
every year. Analysis of data obtained from these wells is very important in understanding the aquifers behavior.
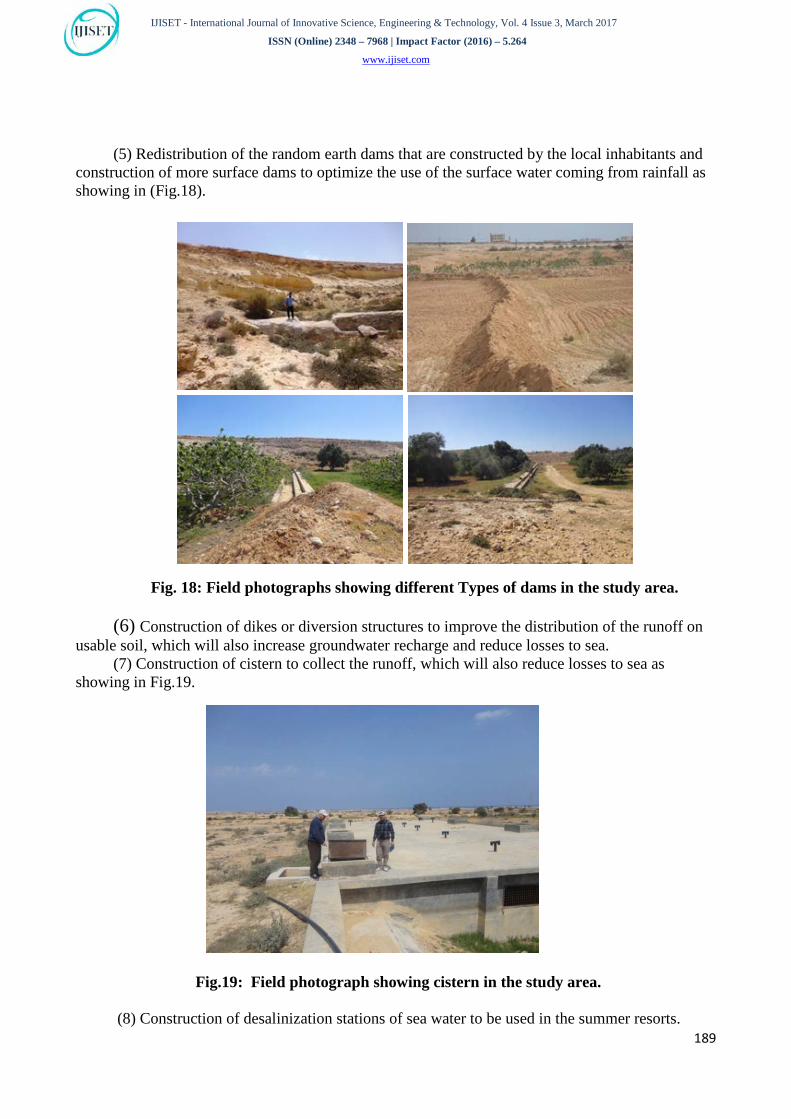
(5) Redistribution of the random earth dams that are constructed by the local inhabitants and
construction of more surface dams to optimize the use of the surface water coming from rainfall as showing in (Fig.18).
Fig. 18: Field photographs showing different Types of dams in the study area.
(6) Construction of dikes or diversion structures to improve the distribution of the runoff on
usable soil, which will also increase groundwater recharge and reduce losses to sea. (7) Construction of cistern to collect the runoff, which will also reduce losses to sea as
showing in Fig.19.
Fig.19: Field photograph showing cistern in the study area.
(8) Construction of desalinization stations of sea water to be used in the summer resorts.
The Egyptian General Petroleum Corporation. Conoco Coral. 5. El Bastawesy, M., Khalaf, F. I. and Arafat, S. M. (2008): “The use of remote sensing
and GIS for the estimation of water loss from Tushka lakes.” southwestern desert, Egypt, J. Afr. Earth Sci., no. 52, pp. 73–80.
6. El Maghraby M. (1997): “Geophysical, hydrogeological and remote sensing studies on the effect of sea level fluctuation on the groundwater reservoir between Alexandria and El Dabaa,Egypt”, Ph.D. Thesis, Fac Sci Alex Univ, p 357.
7. EL Sabri, M A., Masoud, M.H & Dahab, K.A. (2011): “Water Budget assessment for some Wadis West Mersa Matrouh and possibilities of sea water intrusion.” Journal of the Sedimentological Society of Egypt Vol., 19 pp. 113 – 125.
8. El Shamy, I. Z. (1968): “The geology of water and soil resources in Dabaa area, western Mediterranean coastal zone,” U. A. R. M. Sc. Thesis, Fac. Sci., Cairo Univ., Egypt, p. 112.
9. El Shamy, I. Z. (1992): “New approach for hydrological assessment of hydrographic basins concerning recent recharge and flooding possibilities.” 10P
thP Symp. Quatern. Develop.
Mansoura Univ., Egypt, p. 13. 10. El Shazly M, Abdel Hady A, El Ghawaby A, El Kassas A. (1975): “Geologic
interpretation of Landsat satellite images for west Nile Delta area, Egypt,” Remote Sens. Res. Proj. Acad. Sci. Res.Techn. Pap., p 38.
11. El-Raey M (1998): “Framework of integrated coastal area management of the Fuka-Matrouh area, Egypt.”PAP/RAC-37.
12. El-Sharabi E. S. (2000): “Hydrogeological, geomorphological and geoenvironmental implications for future sustainable development of the Northwestern coastal zone of Egypt.” Ph.D. Thesis, Mansoura University, p 346.
13. Environmental Protection Agency (EPA, 2011): “Edition of the Drinking Water Standards and Health Advisories.” U.S. Environmental Protection Agency Washington, D.C., p.12.
14. Ezzat M. (1976): “Groundwater resources of North Western Coastal Zone.” Part 1, Ministry of irrigation, Cairo, Egypt.
15. FAO (1970): Pre-investment survey of the northwestern coastal region: physical conditions and water resources. Technical report2 (ESE: SF/UAR 49) p. 140.
16. Guindy K. (1989): “Hydrogeology of the coastal zone between El Ameriya and El Hammam.” Ph.D Thesis, Fac. Sci., Ain Shams Univ., Cairo, p 151.
17. Hammad, F. A. (1966): “The geology of water supplies in Ras El Hekma area, western Mediterranean coastal zone, Egypt.”, M. Sc. Thesis, Fac. Sci., Cairo Univ., Egypt, p. 109.
18. Hammad, F. A. (1972): “The geology of soils and water resources in the area between Ras El Hekma and Ras Alam El Rum, western Mediterranean littoral zone, Egypt.” Ph.D. Thesis, Fac. Sci. Cairo Univ., Egypt, p. 162.
19. Hefny K, Samir F. M., Mohamed H. (1992): “Groundwater assessment in Egypt. Inst J Water Resour Dev 8(2):126–134.
20. Hem, J. D. (1970): “Study and Interpretation of the Chemical Characteristics of Natural Water”, 2nd Edition. Geological Survey Water Supply, Washington, p.140.
21. Hilmy M, El Shazly M, Korany E (1978): “Lithostratigraphy and petrology of the Miocene and post-Miocene sediments in Burg El Arab-El Daba’a area.” Desert Inst. Bull A R E 28(1):1–24.
22. Horton, R. E. (1945): “Erosional development of streams and their drainage basins”. Geol.Soc.Amer.Bull.Vo1.56, pp. 275-330.
23. Kohnke, H. (1980): “Soil physics.” Soil Scientist, Purdue Univ., TATA Mc Graw-Hill publishing Company LTD. New Delhi, pp. 28-34.
24. Melton, M. N. (1957): “An analysis of the relations among elements of climate surface properties and geomorphology.” Project NR 389-042 Tech. Rept. II, Columbia Univ., and Dept. Of geology, OnR, Geog. Branch, New York, p. 34.
25. Misak, R. F. (1974): “Geomorphology and geology of the area between El Dabaa and Ras El Hekma, western Mediterranean coastal zone, Egypt.” M. Sc. Thesis, Fac. Sci., Ain Shams. Univ., Egypt, p.144.
26. Mudallal U. H. (1990): “Hydrogeological studies of areas in the North-western coastal zone and Siwa.” Project EGY/87/010, FAO, Rome, p 133.
27. Philip, J. R. (1957): “The theory of infiltration” 2, 3 and 4 Soil Science, p 34, 83, 85,163 and 257.
28. Piper, A. M. (1953): “A Graphical Procedure in the Geochemical Interpretation of Water Analyses.” Washington D.C., U.S. Geological Survey, Water Res. Div., Ground-Water Notes, Geochemistry, No. 12, p. 14.
29. Raghunath, H. M. (1990): “Hydrology Principles analyses and design,” Wiley Eastern limited New Delhi, 482p.
30. Raslan S.M. (1995): “Geomorphological and hydrogeological studies on some localities along the Northwestern Coast of Egypt.” M. Sc.Thesis, Faculty of Science, Menoufia University, p 172.
31. Said, R. (1962): “The Geology of Egypt.” Elsevier Publishing Company, Amsterdam, New York. P.377.
32. Schoeller, H. (1962): “Les eaux Souterraines.” Paris, France, Massio et Cie, p. 642. 33. Sewidan, A. S. (1978): “Water budget analysis for the northwestern coastal zone of the
Arab Republic of Egypt.” Ph. D. Thesis, Fac. Sci., Cairo Univ., Egypt, p. 179. 34. Sewidan, A. S., (1994): “(INF-TEST) computer program (Software) of infiltration rate
calculation.” Hydrology Dept. Desert Research Center, Cairo, Egypt.
35. Curran, Timothy W., "SMADA-Stormwater Management And Design Aid" (1980). Retrospective Theses and Dissertations. 476.
36. Strahler, A. N. (1952): “Hypometric (area-altitude) analysis of erosional topography.” Geol. Soc. America Bull., v.63, pp.1117-1142.
37. Stubchear, J. M. (1975): “The Santa Barbara Urban Hydrograph method” Proc., National Sympos. On Urban Hydrology and Sediment Control, University of Kentuky, Lexington, July. 28, 31, 131, 141 p.
38. Todd, D. K. (1959): “Groundwater Hydrology.” 2nd edition, John Wiley and Sons Interscience, New York, U.S.A., p. 336.
39. United Sates Salinity Laboratory Staff, USSLs (1954): “Diagnosis and improvement of saline and alkali soils.” U. S. Dept. Agric., Handbook No. 60, Washington, D. C., p. 160.
40. World Health Organization WHO (2011): “Guidelines for Drinking-water Quality.” 4th Edition, Geneva, World Health Organization. p. 564.
41. Yousif, M., Abd, E.S.E. and Baraka, A. (2013): “Assessment of water resources in some drainage basins, northwestern coast, Egypt”, 35TApplied Water Science35T Volume 3, 35TI. 235T, pp. 439–452.