30
Hydrology and Floodplain Analysis Fifth Edition Supplemental Materials
Hydrology and Floodplain Analysis Fifth Edition
Supplemental Materials

Jones Creek

Subbasins of Jones Creek


Example 1: Calculate volume of the Direct Runoff of Subbasin A and plot the net rainfall on the resul@ng hydrograph
Baseflow for Subbasins A = 100 cfs
Initial infiltration for the first hr = 0.5 in
Constant infiltration = 0.25 in 0
100
200
300
400
500
600
700
0 2 4 6 8 10 12 14
Q (
cfs)
Time (hr)
Storm Hydrograph for Subbasin A
0 0.5
1 1.5
2 2.5
3 3.5
1 2 3
Inte
nsity
(in/
hr)
Time (hr)
Rainfall hyetograph (Subbasin A)
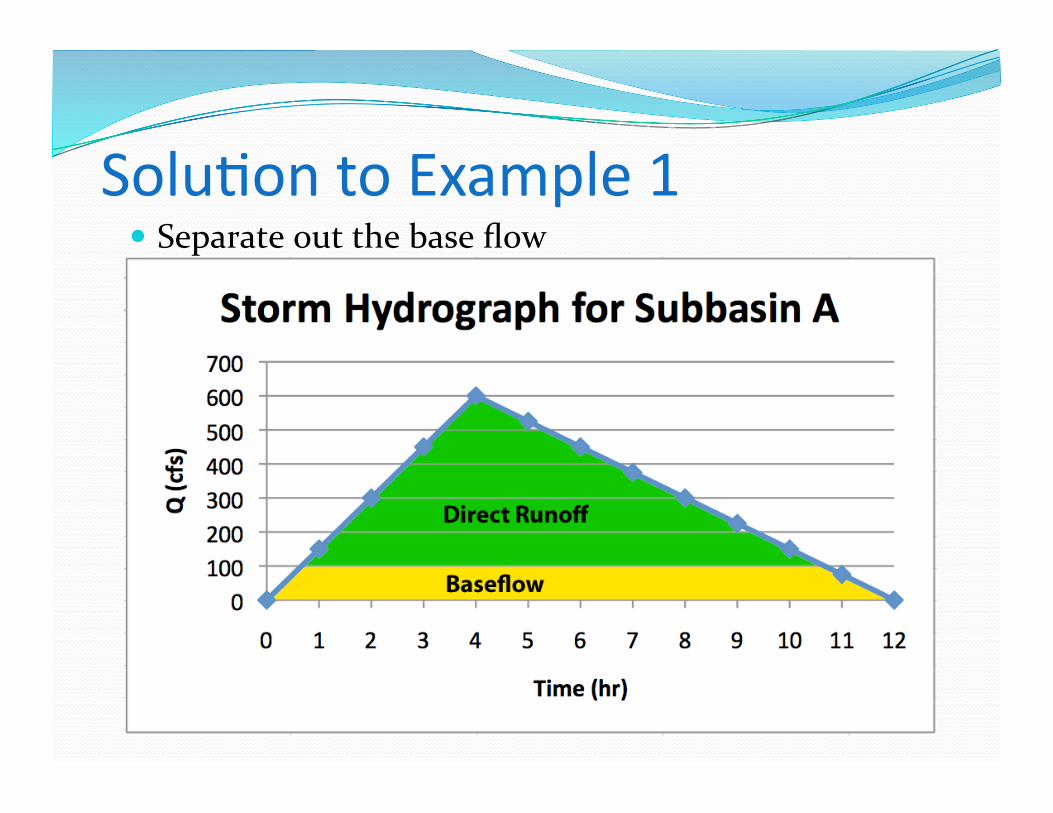
Solu@on to Example 1 Separate out the base flow

Solu@on to Example 1 Calculate the volume of Direct Runoff
DRO = Total Runoff – Base Flow
Total Runoff = 12 hr * 600 cfs * ½ * (3600 s/ hr) * (1 ac-ft/ 43,560 ft3)
= 297.5 ac-ft
Base Flow = (12 hr + 10 hr)/2 * 100 cfs * (3600 s/ hr) * (1 ac-ft/ 43,560 ft3)
= 90.9 ac-ft
DRO = 297.5 ac-ft – 90.9 ac-ft
DRO = 206.6 ac-ft

Solu@on to Example 1 Resulting hydrograph after removing Baseflow

Solu@on to Example 1 Separate out the infiltration from the hyetograph

Solu@on to Example 1 Place the rainfall in the upper left corner of the resulting hydrograph
0
0.5
1
1.5
2
2.5
3 0
100
200
300
400
500
600
0 2 4 6 8 10 12
Rainf
all (in)
Q (c
fs)
Time (hr)
Storm Hydrograph for Subbasin A: No Baseflow


Problem 1: Calculate volume of the Direct Runoff of Subbasin C and plot the net rainfall on the resul@ng hydrograph
Use the process in Example 1
Base flow for Subbasin C = 200 cfs Initial infiltration for the first hr = 1 in Constant infiltration = 0.5 in
0
0.5
1
1.5
2
2.5
3
1 2 3
Inte
nsity
(in/
hr)
Time (hr)
Rainfall hyetograph (Subbasin C)


Example 2: a) Make sure the Unit hydrograph of Subbasin A is a unit hydrograph
Area of Subbasin A = 550 ac
Assume no baseflow
Qp = 220 cfs

Solu@on to Example 2, Part a DRO = area under the hydrograph
DRO = 220 cfs * 5 hr * ½
DRO = 550 cfs-‐hr = 550 ac-‐in
550 ac-‐in / 550 ac = 1 in

Example 2: b) Given a 4-‐period storm (1 period =30 minutes) and the previous unit hydrograph for Subbasin A, create the storm hydrograph using the “add and lag” method
Area of A = 550 ac Assume no baseflow or
infiltration Qp = 220 cfs
Time (0.5 hr)
Q (cfs)
0 0
1 55
2 110
3 165
4 220
5 183.333
6 146.667
7 110
8 73.333
9 36.667
10 0
0.5 in 0.5 in 1 in 1.5 in

Solu@on to Example 2, Part b Time (0.5 hr)
Q (cfs)
0 0
1 55
2 110
3 165
4 220
5 183.333
6 146.667
7 110
8 73.333
9 36.667
10 0
Time (0.5 hr) P1*Un P2*Un P3*Un P4*Un Qn 0 0 0
1 27.5 0 27.5
2 55 55 0 110
3 82.5 110 82.5 0 275
4 110 165 165 27.5 467.5
5 91.6665 220 247.5 55 614.2
6 73.3335 183.333 330 82.5 669.2
7 55 146.667 274.9995 110 586.7
8 36.6665 110 220.0005 91.6665 458.3
9 18.3335 73.333 165 73.3335 330
10 0 36.667 109.9995 55 201.7
11 0 55.0005 36.6665 91.7
12 0 18.3335 18.3
13 0 0
Unit Hydrograph

Solu@on to Example 2, Part b Time
(0.5 hr) Qn
(cfs) 0 0
1 27.5
2 110
3 275
4 467.5
5 614.2
6 669.2
7 586.7
8 458.3
9 330
10 201.7
11 91.7
12 18.3
13 0


Problem 2 (informa@on on next slide) a) Make sure the Unit hydrograph of Subbasin C is a unit hydrograph (Subbasin C area = 770 ac)
b) Given a 4-‐period storm (1 period =30 minutes) and the unit hydrograph for Subbasin C, create the storm hydrograph using the “add and lag” method

Unit Hydrograph and 4-‐period storm for Subbasin C
Time (0.5 hr)
Q (cfs)
0 0.0
1 70.0
2 140.0
3 210.0
4 280.0
5 240.0
6 200.0
7 160.0
8 120.0
9 80.0
10 40.0
11 0

Storm Hydrograph Worksheet UH for C
Time (0.5 hr) Qn
0.0 0
70.0 1
140.0 2
210.0 3
280.0 4
240.0 5
200.0 6
160.0 7
120.0 8
80.0 9
40.0 10
0 11
12
13
14


Example 3: Find the @me to peak (tp) and the maximum flow (Qp) by the SCS triangular unit hydrograph method for Subbasin A (550 ac). Use L = 1 mi, average slope = 25[/mi, D = 0.5 hr and CN = 71.
tp = [L0.8(S + 1)0.7]/1900y0.5 L = length to divide (ft) y = average watershed slope (%) S = (1000/CN) – 10 in CN = Curve Number for various soil/land use
Qp = [484 * (Area in sq. mi)]/TR TR = D/2 + tp = rise time of the hydrograph
D = rainfall duration

Solu@on to Example 3 L = 5280 ft S = (1000/71) – 10 = 4.085 y = 25ft/5280ft = 0.474 %
tp = [5280.8*(5.085)0.7]/1900(.474)0.5
tp = 2.27 hr
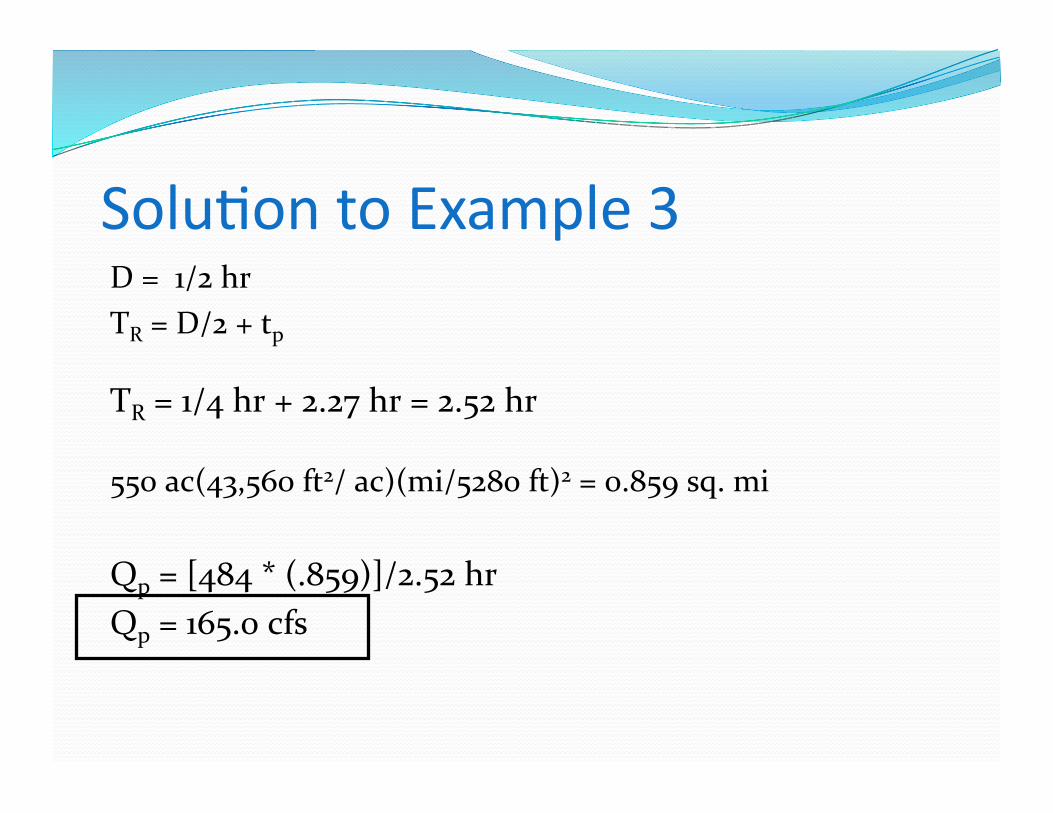
Solu@on to Example 3 D = 1/2 hr TR = D/2 + tp
TR = 1/4 hr + 2.27 hr = 2.52 hr
550 ac(43,560 ft2/ ac)(mi/5280 ft)2 = 0.859 sq. mi
Qp = [484 * (.859)]/2.52 hr Qp = 165.0 cfs

Solu@on to Example 3 TB = time base
DRO = ½ * Qp * TB hr
550 ac-‐in = ½ * 165 cfs * TB hr
TB = 6.67 hr
Note: B = TB + TR

Solu@on to Example 3


Problem 3 Find the time to peak (tp) and the maximum flow (Qp) by the SCS triangular unit hydrograph method for Subbasin C (770 ac). Use L = 1.5 mi, average slope = 30ft/mi, D = 0.5 hr and CN = 75.


