Technical Memorandum Hydroplaning Crash Study and Mitigation Strategies Phase II Prepared By: Al-Ahad Ekram, PE, PTOE; Steven Kane, PE Prepared for: Florida’s Turnpike Enterprise October 2018
Transcript
Technical Memorandum
Hydroplaning Crash Study and Mitigation Strategies Phase II
Prepared By:
Al-Ahad Ekram, PE, PTOE; Steven Kane, PE
Prepared for: Florida’s Turnpike Enterprise October 2018
Hydroplaning Crash Study and Mitigation Strategies Phase II
1.1. Phase I Study Review ...................................................................................................................................................... 3
1.2. Phase II Study Objectives .............................................................................................................................................. 4
2. Development of Hydroplaning Assessment Method .................................................................................................. 5
2.1. Background and Literature Review ........................................................................................................................... 5
2.2. Current and Upcoming Assessments ....................................................................................................................... 7
3. Test Site Characteristics ........................................................................................................................................................... 8
3.1. Site Description ................................................................................................................................................................. 8
3.2. Test Site Hydroplaning Assessment ......................................................................................................................... 9
4.1. Overview of Available Mitigation Measures ....................................................................................................... 11
4.1.3 Surface Texture Through Mix .................................................................................................................................. 16
4.1.4 Signage and ITS ............................................................................................................................................................ 17
4.2. Specific Mitigation Strategies .................................................................................................................................. 18
Hydroplaning Crash Study and Mitigation Strategies Phase II
ii
List of Tables
Table 1. Hydroplaning Assessment for the 12-lane Existing Section ........................................................................... 10
Table 2. Hydroplaning Assessment for the 16-lane Future Section .............................................................................. 10
Table 3. Supereleveation Modification for the 16-lane Future Section ....................................................................... 12
Table 4. Horizontal Curve Radius Modification for the 16-lane Future Section ....................................................... 14
Table 5. Buffer Width Reduction for the 16-lane Future Section ................................................................................... 14
Table 6. Barrier Separation of Ramps for the 12-lane Section ........................................................................................ 15
Table 7. Barrier Separation of Express Lanes for the 16-lane Section .......................................................................... 16
Table 8. Summary of Safety Countermeasures with Crash Modification Factors .................................................... 19
List of Figures
Figure 1. Existing Turnpike Section East of Daniel Webster Parkway - Test Site ........................................................ 9
Figure 2. Planned Future Turnpike Section East of Daniel Webster Parkway - Test Site ...................................... 10
Figure 3. Superelevation – Stagger transitions by lane ...................................................................................................... 13
Figure 5. 16-lane section with Reduced Buffer Width ........................................................................................................ 14
Figure 6. 12-lane section with Barrier Separated Ramps ang General Use Lanes ................................................... 15
Figure 7. 16-lane section with Barrier Separated Express Lanes ang General Use Lanes ..................................... 16
Figure 8. Mean Texture Depth vs. Hydroplaning Speed .................................................................................................... 17
Hydroplaning Crash Study and Mitigation Strategies Phase II
Page 3
1. Introduction
Florida’s Turnpike Enterprise (FTE) is evaluating the current practice of analyzing mitigation of hydroplaning related crashes and hydroplaning risk. Dynamic hydroplaning is a condition where one or more tires of a vehicle completely lose contact with the pavement due to a layer of water film between the tire and the pavement surface. The condition that generates water film thickness sufficient to create uplift on the pavement typically occurs at high speeds during moderate to high rainfall events. The slower time of drainage during such rainfall events causes water film to accumulate. A combination of roadway geometric elements, pavement materials and pavement condition can cause water to drain off the travel lanes slower than needed, thus contributing to a higher water film thickness. Sufficiently thick water film that cannot be adequately displaced by the vehicle’s tires may cause a vehicle to hydroplane causing a driver to temporarily or completely lose control of the vehicle.
The study stemmed from a need for FTE to provide insight into the locations and frequency of hydroplaning crashes with wide typical sections along Florida’s Turnpike facilities and to provide mitigating strategies and offset hydroplaning risks so that a more consistent process can be achieved for project coordination between FTE and design consultants. Currently, several Turnpike facilities are under design for widening, including managed lane additions. The results of this hydroplaning study will identify any need for possible modifications in design, hydroplaning calculation strategy or establish pathways for mitigation strategies to be identified to mitigate hydroplaning risk. This report summarizes the Phase II of the two-phase study. Phase I of the study dealt with analysis of hydroplaning crashes on facilities within the State of Florida and identifying the crash characteristics, spatial and temporal variations of these crashes, and traffic characteristics at the times of these crashes. In addition, Phase I also evaluated the hydroplaning theory and the formula used by FTE. Phase II identifies possible mitigation strategies for the hydroplaning crashes. HNTB Corporation, as the General Engineering Consultant for FTE, was tasked to perform Phase I and Phase II of this study. This Phase II study proposes mitigation strategies, provides guidelines to obtain concurrence on governing criteria for hydroplaning, provides comparison and benefit cost estimates for different mitigation strategies, and proposes guidelines to address hydroplaning risk during the design process.
1.1. Phase I Study Review FTE initiated a hydroplaning crash study to provide insight into the locations and frequency of hydroplaning crashes with wide typical sections along Florida’s Turnpike facilities so that a more consistent process can be achieved for project coordination between FTE and design consultants. Currently, several Turnpike facilities are under design for widening, including additions of managed lanes. The output of this study will identify any need for possible modifications in design, hydroplaning calculation strategy or establish pathways for mitigation strategies to be identified to mitigate hydroplaning related crashes. This report summarizes the Phase I of the two-phase study.
This Phase I study identified existing facilities owned by the Department that have eight or more lanes (combined both direction, including auxiliary lanes) and selected a total of 12 sites that experienced hydroplaning induced crashes from year 2011 to 2015. The crash data were combined with relevant weather conditions data to provide insights into roadway and traffic characteristic of the selected sites relevant to hydroplaning. This study also evaluated the PAVDRN empirical formula in practice for the selected sites and
Hydroplaning Crash Study and Mitigation Strategies Phase II
Page 4
compared results against the actual hydroplaning crash rates. Finally, crash rates for the selected sites were compared to crash rates for six-lane control sites within the same timeframe and weather conditions. In addition, HSM 2010 predictive method was utilized with surrogate safety measures to assess crash rates between different number of lanes on Turnpike.
The key observations of this Phase I study are:
Based on comparative statistics with the control sites (which are six-lane facilities in the proximity of the selected sites), selected wider sections had about 33.7% of wet weather crashes compared to about 11.6% of wet weather crashes in the six-lane sections;
Predicted hydroplaning crash rate increases about 257% from a six-lane to an eight-lane section, and about 50% from an eight-lane to a ten-lane section;
Hydroplaning crash frequencies were greater in the lower lanes than the higher lanes;
For some of the sections, adjacent lane to the lowest lane had slightly higher crash frequency than the lowest lane;
For majority of the study sites, a design speed of 65 mph triggers hydroplaning in the PAVDRN empirical hydroplaning formula;
Speeds observed at the time of the hydroplaning induced crashes showed that drivers were travelling at greater than posted speed limits at the time of crashes. It is possible that modern technologies in vehicle safety features as well as improved tires have prevented some possible crashes in hydroplaning conditions at lower speeds;
For 1 inch/hour and 2 inch/hour rainfall intensities, the recorded running speeds collected at the time of the crashes reviewed in Phase I, where higher than anticipated by the PAVDRN empirical threshold;
More than 50% of the hydroplaning crashes occurred during rainfall intensities of 1.5 inch/hour or over. This is consistent with frequent findings that the 2 inch/hour rainfall intensity in the PAVDRN empirical formula often is the controlling intensity.
1.2. Phase II Study Objectives Scopes and objectives of the Phase II study are as follows:
• Perform background literature review pertaining to hydroplaning mitigation
• Perform review accuracy of mitigating trigger
• Perform a review of available mitigating strategies
• Obtain the best practices for governing criteria for hydroplaning
• Review costs and benefits of mitigating strategies
• Revise design process with consistent and practical approach
Hydroplaning Crash Study and Mitigation Strategies Phase II
Page 5
2. Development of Hydroplaning Assessment Method
2.1. Background and Literature Review Hydroplaning crashes are prevalent in different regions across the world. In the U.S., majority of the states with moderate to heavy rainfalls have reported crashes that can be related to hydroplaning scenarios. As a result, various agencies and researchers have analyzed crash patterns, weather conditions, location characteristics, operational conditions and the theory of hydroplaning. In addition, several documents and guidelines are available for the designers that can help to identify mitigation measures against hydroplaning scenario. As part of this Phase II study, a comprehensive list of relevant literatures was reviewed.
Yassin et al. (2013) assessed the reliability of predicting hydroplaning risk based on crash data on several Florida interstate highways. The study also evaluated PAVDRN, a computer software package developed under the National Cooperative Highway Research Program (NCHRP) sponsorship to determine the threshold hydroplaning speeds on a given section of a highway during a specific rainfall event. The study showed that PAVDRN was accurate in predicting a hydroplaning crash more than 60% of the time. However, the study also addresses external factors associated with hydroplaning crashes that are not included in the PAVDRN’s analytical model. A similar study was also performed by Gunaratne et al. (2012), where the researchers performed validation of the available hydroplaning prediction models with several field studies on Florida highways at different rainfall intensities. The study observed relationships with pavement skid resistance and hydroplaning possibility. In addition, the study also analyzed hydroplaning crashes on the field study spots and compared the results with the empirical models as well as PAVDRN. They concluded that wider sections are more likely to produce hydroplaning crashes, dense-graded pavements are more likely to induce conditions conducive to hydroplaning than open-graded ones, and the field skid test results yielded similar water film thicknesses for hydroplaning thresholds as the empirical models.
NCHRP 15-55 (2017) report provided guidelines to predict and mitigate dynamic hydroplaning on roadways. In this two-phase study, the investigators analyzed the approaches used for assessing hydroplaning potential on new and existing roads, for predicting the water film thickness on road surfaces, and for modeling the response of the vehicle. The study proposed a methodology for developing an integrated hydroplaning model that uses and integrates the most appropriate surface water drainage, tire, vehicle, and fluid dynamic models to predict the hydroplaning risk for new and existing roads. This study also developed an outline for a guide to assess and mitigate hydroplaning potential and a plan for developing accompanying tools and guidance. The second part of this study is currently underway and will illustrate the proposed format for a hydroplaning risk assessment tool to apply the results of the integrated model in practice in addition to a guide mitigating hydroplaning potential.
The purpose of the NCHRP 1-29 (1998) study was to identify techniques to improve the drainage of multi-lane highway pavements and to develop guidelines for implementing the most promising of these techniques. This study conducted laboratory skid testing on different concrete and asphalt surfaces. The study used the field tests into PAVDRN and predicted hydroplaning threshold speeds based on the test results.
Hydroplaning Crash Study and Mitigation Strategies Phase II
Page 6
American Association of State Highway and Transportation Officials (AASHTO) published A Policy on Geometric Design of Highways and Streets (2011) and A Policy on Design Standards- Interstate System (2005), which provides current design research and practices for highway and street geometric design. These documents provide guidance to highway engineers and designers who strive to make unique design solutions to problems like hydroplaning that meet the needs of highway users while maintaining the integrity of the environment. They are also intended as a comprehensive reference manual to assist in administrative, planning, and educational efforts pertaining to design formulation for drainage related issues such as hydroplaning. Design guidelines are included for freeways, arterials, collectors, and local roads, in both urban and rural locations, paralleling the functional classification used in highway planning.
Design guidelines and criteria pertaining to the State of Florida are primarily governed by Florida Design Manual (2018), and FTE has their own design criteria Turnpike Design Handbook (2018). These documents provide criteria and guidelines for different typical sections as it pertains to drainage conditions.
Pratt et. al (2014) developed an analysis framework to assess the need for surface treatments at curves based on the concept of margin of safety analysis. Margin of safety is defined as side friction demand subtracted from side friction supply. Vehicle speed, curve geometric characteristics (such as radius and superelevation rate), and curve travel path characteristics all affect friction demand. Meanwhile, pavement characteristics (particularly skid number) and weather conditions affect friction supply. The researchers developed models to predict vehicle speeds throughout a curve as a function of curve geometric and traffic control characteristics. These models were calibrated using speed data from Texas curve sites.
NCHRP report 640 (2009) provides a comprehensive description of the construction and maintenance practices of the Permeable friction courses (PFC), which include new generation open-graded friction courses (OGFC), asphalt-rubber friction courses, and porous European mixes. PFC have wide use throughout the southern and western United States. PFC reduces hydroplaning, splash and spray, and pavement noise, and improves ride quality and the visibility of pavement markings in wet weather. Properly designed and constructed PFCs are durable and exhibit service lives of 10 to 14 years. The objective of this research was to develop practical guidelines for PFC design, construction, and maintenance that maximize the advantages and minimize the disadvantages associated with PFC use. A comprehensive, critical review of the worldwide literature on PFC design, performance, construction, and maintenance was conducted. Based on an analysis of the results of this review and survey, recommendations were made for materials selection, design, and construction of PFC in addition to maintenance and rehabilitation.
An Federal Highway Administration (FHWA) report produced by Merritt et. al (2015) focused on the evaluation of pavement safety performance with various low cost teratments. The intent of this study was to isolate the effects of various low-cost pavement treatments on roadway safety. This was a retrospective study of pavement safety performance, looking back at crash data before and after treatments were installed. Both flexible and rigid pavement treatments were analyzed, with the majority typically used for pavement preservation or minor rehabilitation purposes. Although State highway agencies recognize that most of these treatments generally improve pavement friction, they are not typically installed explicitly for safety improvement, with one exception, high-friction surfacing, which is typically applied as a spot safety treatment. The research was conducted as part of Phase VI of the FHWA Evaluation of Low-Cost Safety
Hydroplaning Crash Study and Mitigation Strategies Phase II
Page 7
Improvements Pooled Fund Study (ELCSI–PFS). The intent of the work conducted under the various phases of the ELCSI-PFS is to provide a crash modification factor (CMF) and benefit-cost (BC) economic analysis for each of the targeted safety strategies identified as priorities by the PFS States. Under the effort described herein, CMFs and BC ratios were developed for various low-cost pavement treatments.
For a list of the references that has been used in this Phase II study, refer to the “References” section at the end of this document.
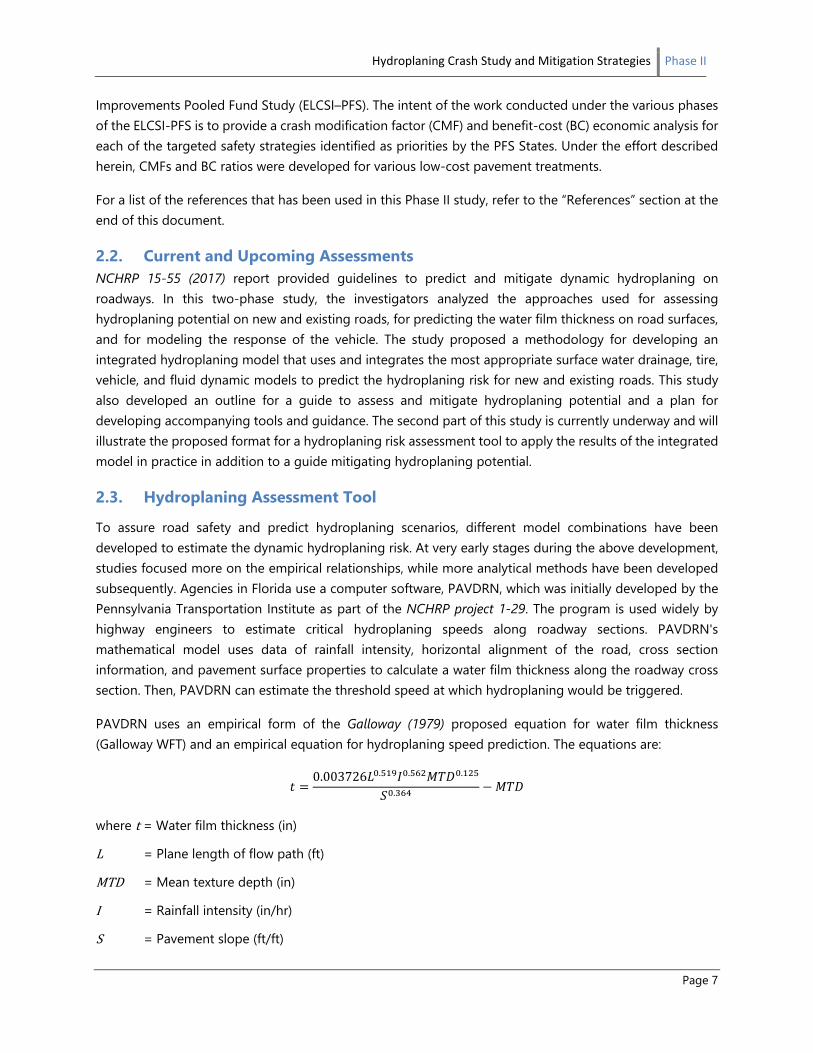
2.2. Current and Upcoming Assessments NCHRP 15-55 (2017) report provided guidelines to predict and mitigate dynamic hydroplaning on roadways. In this two-phase study, the investigators analyzed the approaches used for assessing hydroplaning potential on new and existing roads, for predicting the water film thickness on road surfaces, and for modeling the response of the vehicle. The study proposed a methodology for developing an integrated hydroplaning model that uses and integrates the most appropriate surface water drainage, tire, vehicle, and fluid dynamic models to predict the hydroplaning risk for new and existing roads. This study also developed an outline for a guide to assess and mitigate hydroplaning potential and a plan for developing accompanying tools and guidance. The second part of this study is currently underway and will illustrate the proposed format for a hydroplaning risk assessment tool to apply the results of the integrated model in practice in addition to a guide mitigating hydroplaning potential.
2.3. Hydroplaning Assessment Tool
To assure road safety and predict hydroplaning scenarios, different model combinations have been developed to estimate the dynamic hydroplaning risk. At very early stages during the above development, studies focused more on the empirical relationships, while more analytical methods have been developed subsequently. Agencies in Florida use a computer software, PAVDRN, which was initially developed by the Pennsylvania Transportation Institute as part of the NCHRP project 1-29. The program is used widely by highway engineers to estimate critical hydroplaning speeds along roadway sections. PAVDRN's mathematical model uses data of rainfall intensity, horizontal alignment of the road, cross section information, and pavement surface properties to calculate a water film thickness along the roadway cross section. Then, PAVDRN can estimate the threshold speed at which hydroplaning would be triggered.
PAVDRN uses an empirical form of the Galloway (1979) proposed equation for water film thickness (Galloway WFT) and an empirical equation for hydroplaning speed prediction. The equations are:
𝑡𝑡 =0.003726𝐿𝐿0.519𝐼𝐼0.562𝑀𝑀𝑀𝑀𝑀𝑀0.125
𝑆𝑆0.364 − 𝑀𝑀𝑀𝑀𝑀𝑀
where t = Water film thickness (in)
L = Plane length of flow path (ft)
MTD = Mean texture depth (in)
I = Rainfall intensity (in/hr)
S = Pavement slope (ft/ft)
Hydroplaning Crash Study and Mitigation Strategies Phase II
This section presents a list of the design criteria that are in best practices by FDOT and FTE pertaining to hydroplaning as well as general roadway and drainage design. The governing criteria are stated below:
• Maximum cross slope in tangent sections: 3.5% AASHTO Interstate, 2005
• Highest emax table for superelevated sections: 12% AASHTO, 2011
• Maximum algebraic difference between travel lanes: 4% AASHTO Interstate, 2005
• Maximum side friction factor at 70 MPH: 0.10 AASHTO, 2011
• Minimum side friction factor at 70 MPH: 0.00 AASHTO, 2011
• Minimum profile grade when cross slope is less than 1.5%: 0.5%, FDM 210.9.1, 2018
3. Test Site Characteristics
In the Phase I of this hydroplaning study, six sites were identified along Florida’s Turnpike that were prone to hydroplaning crashes between 2011 and 2015. Majority of the sites were located in the South Florida region with one site in the Central Florida region. Of the six sites, three were located within tangent sections and the others were located within curve sections. A single test site was selected out of the six sites for this Phase II study. This section summarizes the findings of the test site.
3.1. Site Description The site along Florida’s Turnpike east of Daniel Webster Parkway was selected as a test site for this Phase II study. Primary reasons for the selection of the test site are:
• 12 lane typical section with future expansion to 16 lanes
• 34 hydroplaning crashes (5 years analysis found in Phase I of the study)
• 77% of wet weather crashes are hydroplaning related
Hydroplaning Crash Study and Mitigation Strategies Phase II
Page 9
• 15% of all crashes are hydroplaning related
• $8.67 million in hydroplaning related economic loss (refer to Phase I study report)
3.2. Test Site Hydroplaning Assessment
The test site was evaluated to determine if the existing and future typical sections poses a hydroplaning risk. The geometric mitigation strategies were then applied to evaluate the effectiveness of each. The results of these analyses can be found in section 4..1.1.
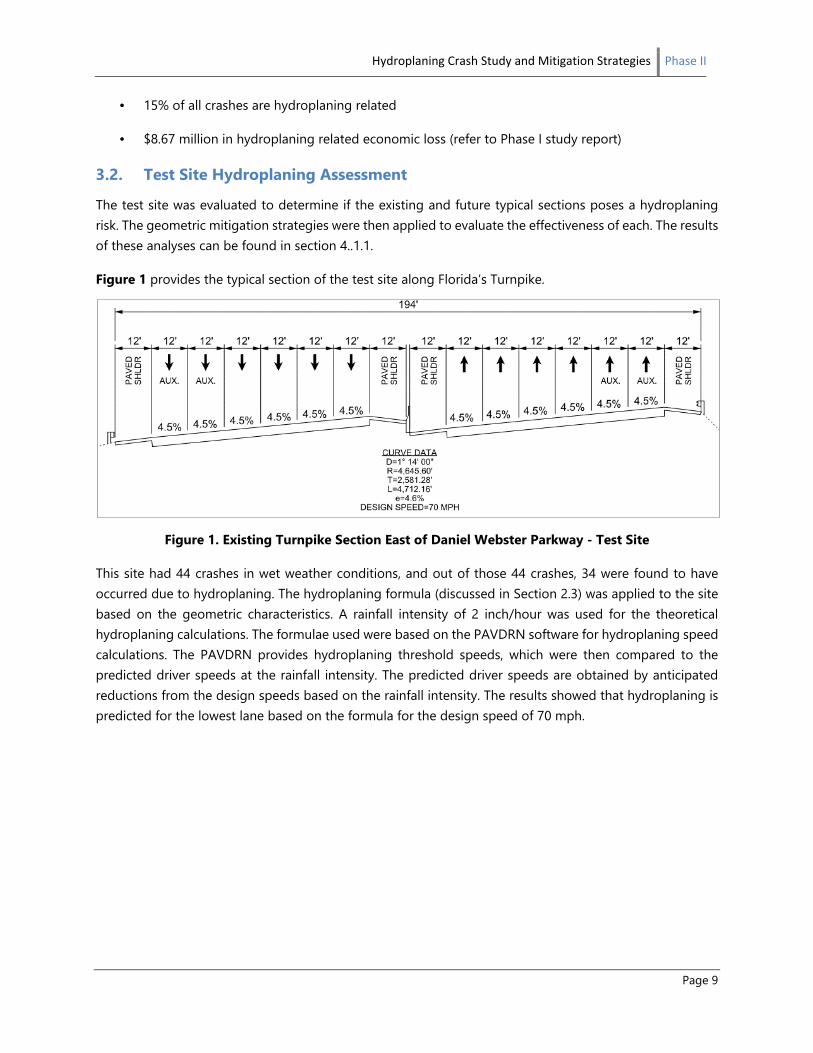
Figure 1 provides the typical section of the test site along Florida’s Turnpike.
Figure 1. Existing Turnpike Section East of Daniel Webster Parkway - Test Site
This site had 44 crashes in wet weather conditions, and out of those 44 crashes, 34 were found to have occurred due to hydroplaning. The hydroplaning formula (discussed in Section 2.3) was applied to the site based on the geometric characteristics. A rainfall intensity of 2 inch/hour was used for the theoretical hydroplaning calculations. The formulae used were based on the PAVDRN software for hydroplaning speed calculations. The PAVDRN provides hydroplaning threshold speeds, which were then compared to the predicted driver speeds at the rainfall intensity. The predicted driver speeds are obtained by anticipated reductions from the design speeds based on the rainfall intensity. The results showed that hydroplaning is predicted for the lowest lane based on the formula for the design speed of 70 mph.
Hydroplaning Crash Study and Mitigation Strategies Phase II
Page 10
Figure 2 provides the typical section of the test site along Florida’s Turnpike for a planned widening with 16-lanes. For a future planned 16-lane typical section, the formula predicts a much higher degree of hydroplaning using the same 70 mph design speed. For the 16-lane section, hydroplaning is predicted for up to 4th lane starting with the lowest lane. Tables 1 and 2 provide the results of the 12-lane and 16-lane analysis, respectively.
Figure 2. Planned Future Turnpike Section East of Daniel Webster Parkway - Test Site
Table 1. Hydroplaning Assessment for the 12-lane Existing Section
Table 2. Hydroplaning Assessment for the 16-lane Future Section
Hydroplaning Crash Study and Mitigation Strategies Phase II
Page 11
4. Mitigation Strategies
4.1. Overview of Available Mitigation Measures
The purpose of this section is to provide a summary of the available mitigation strategies that can be applied to mitigating hydroplaning related crashes. To identify the mitigation strategies, several guideline documents were consulted as are cited in Section 2.1. Specifically, the FHWA CMP Clearinghouse, July 2017 and the Mitigation strategies for design exceptions (Stein et. al 2007) were followed to identify relevant strategies that can relate to mitigating hydroplaning related crashes. Additional discussion on the benefit for the options listed below is provided in sections 5.2.
The mitigation strategies are largely grouped into four categories:
• Superelevation – Increase beyond AASHTO 12% emax table by decreasing side friction – Exception Required (low/moderate cost option)
• Superelevation – Stagger transitions by lane (low/moderate cost option)
• Tangent cross slope - Increase to a maximum of 3.5% for lowest lane (low/moderate cost option)
• Horizontal curve radius – Modify alignment to curve with effective cross slope to meet hydroplaning speed (high cost option)
Profile modification
• Reduce longitudinal slope to make sheet flow more perpendicular to road (low/moderate cost option)
Reducing effective pavement width
• Break inside lanes down towards median (tangent sections only) (low/moderate cost option)
Hydroplaning Crash Study and Mitigation Strategies Phase II
Page 12
• Break high-side shoulders way from travel lanes in superelevated sections. (low/moderate cost option)
• Reduce buffer width (low/moderate cost option)
• Barrier separate auxiliary lanes from general use lanes (high cost option)
• Barrier separate general use lanes from express lanes (high cost option)
• Elevate roadway using a viaduct, or similar, to bridge above existing lanes (high cost option)
Table 3 shows that the increase in superelevation using the AASHTO 12% emax table values and beyond provides predicted driver speeds below the hydroplaning thresholds for a 16-lane typical section for the test site.
Table 3. Supereleveation Modification for the 16-lane Future Section
AASHTO (2011) recommends a minimum side friction factor of 0.0 and a maximum side friction factor of 0.10 for design speeds at or above 70 mph. AASHTO does not recommend a negative side friction factor as it can result in excessive steering or erratic operation of the vehicle in motion.
16-Lane Section - Mitigation Reduced Side Friction Factor
Hydroplaning Crash Study and Mitigation Strategies Phase II
Page 13
Figure 3 provides an example of the transition section for supereleveation.
Figure 3. Superelevation – Stagger transitions by lane
Figure 4 provides the typical section of the 16-lane test site with modified radius of the horizontal curve, and Table 4 provides the output for the hydroplaning calculation for the test site for the future 16-lane section. Based on the results, the modification of the horizontal curve radius mitigates the hydroplaning issues for the 16-lane section.
Hydroplaning Crash Study and Mitigation Strategies Phase II
Page 14
Table 4. Horizontal Curve Radius Modification for the 16-lane Future Section
Figure 5 provides the typical section of the 16-lane test site with reduced buffer width, and Table 5 provides the output for the hydroplaning calculation for the test site for the future 16-lane section. Based on the results, the modification of the reduced buffer width does not mitigate hydroplaning issues for the 16-lane section.
Figure 5. 16-lane section with Reduced Buffer Width
Table 5. Buffer Width Reduction for the 16-lane Future Section
Hydroplaning Crash Study and Mitigation Strategies Phase II
Page 15
Figure 6 provides the typical section of the 16-lane test site with barrier separated ramps, and Table 6 provides the output for the hydroplaning calculation for the test site for the 12-lane section. Based on the results, the modification of the reduced buffer width does mitigate hydroplaning issues for the 12-lane section.
Figure 6. 12-lane section with Barrier Separated Ramps ang General Use Lanes
Table 6. Barrier Separation of Ramps for the 12-lane Section
Hydroplaning Crash Study and Mitigation Strategies Phase II
Page 16
Figure 7 provides the typical section of the 16-lane test site with barrier separated express lanes and general use lanes, and Table 7 provides the output for the hydroplaning calculation for the test site for the 16-lane section. Based on the results, the modification of the reduced buffer width does not mitigate hydroplaning issues for the 16-lane section for the lowest elevation general use lane. However, because of the barrier separation, the express lanes do not exhibit hydroplaning.
Figure 7. 16-lane section with Barrier Separated Express Lanes ang General Use Lanes
Table 7. Barrier Separation of Express Lanes for the 16-lane Section
4.1.2 Drainage Approaches
Strategies under this category are as follows:
Trench Drain
Permeable pavement in buffer areas
Drainage related strategies dictate roadway geometric decisions and should be made in concert with Roadway engineer-of-records.
High friction surface treatment (not recommended for use on open-graded surfaces) (low cost option)
Figure 8. Mean Texture Depth vs. Hydroplaning Speed
Figure 8 provides a schematic of the effects of MTD on hydroplaning speed with: design speeds = 70 MPH, rainfall intensity = 2 in/hr, cross slope = 4.5%, pavement width = 72 ft and a grade = 0.30%. Hydroplaning analysis tool uses average MTD based on pavement type. Actual values of MTD varies based on specific mixture and pavement condition over time. Typical range of MTD is +/- 2mm which produces a +/- 2 MPH variability in speed.
4.1.4 Signage and ITS
This is the most cost-effective solution for short as well as long term. Static/dynamic signs combined with ITS technologies are relatively much cheaper than any geometric solutions discussed before. Some options in this category can be:
Dynamic message signs (low cost option)
Variable speed limit signs (low cost option)
Advanced warning with flashers and rain sensors (low cost option)
Hydroplaning Crash Study and Mitigation Strategies Phase II
Page 18
4.2. Specific Mitigation Strategies Based on the discussion with FTE, the list of mitigation strategies were further reduced to the following that can be applied to FTE facilities:
Roadway Geometry
• Cross Slope (reconstruct curve roadway to get superelevation that will pass or help hydroplaning)
• Effective Pavement Width (reduce number of lanes in one direction to reduce water film thickness)
Break lanes away from each other
Break high-side shoulders away from travel lanes in superelevated sections.
Barrier separate lanes
Elevate roadway using a viaduct, or similar, to bridge above existing lanes
Pavement Design
• Grooved Concrete Pavement from open graded FC-5
• High Friction Surface Treatment – Ramps Only
Signage/ITS
• Dynamic Message Signs
• Advanced Warning Signs with Flashers
5. Recommended Approach
Based on the outcome of the Phase I study and the subsequent feedback from FTE, this Phase II study focused on identifying a list of mitigation strategies that can be tied to the overall planning and design process for existing and new FTE facilities. Several factors were considered as catalysts to formulate an approach for hydroplaning mitigation. The following subsections describe them in brief.
Hydroplaning Crash Study and Mitigation Strategies Phase II
Page 19
5.1. Crash Modification Factors
A comprehensive review of the crash modification factors (CMFs) was performed for various safety countermeasures to determine if there are existing CMFs already approved by FDOT that could be used to calculate the benefit/cost ratio of hydroplaning mitigation strategies. Currently, there are no CMFs that are directly related to modification of hydroplaning related crash frequency. However, FHWA has provided CMFs for various pavement and shoulder treatment that improves vehicles stability during inclement weather conditions in high speed facilities. Table 8 provides a summary of the safety countermeasures and the associated CMFs. The CMFs follow the performance rating defined in the NCHRP report 500.
Table 8. Summary of Safety Countermeasures with Crash Modification Factors
Widen Existing Travel Lanes by Two Feet or Less per Lane
$$$$$ $$$ P 0.95 n/a n/a 0.3 2.8
Increase Shoulder Width $$$$$ - P 0.90-
0.97 - - - -
Cost NCHRP 500 Performance rating Volumes $ = $0 to $5,000 P – Proven Lower Volume ≤ 1000 vpd $$ = $5,001 to $20,000 T – Tried Higher Volume = Between 1,001 and 8000 vpd
$$$ = $20,001 to $50,000 E – Experimental Optimal Conditions = 12-foot lanes, 6-foot paved shoulders
$$$$ = $50,001 to $100,000 U – Unknown Narrower Conditions = 10-foot lanes and no shoulders
$$$$$ = $100,001 and up
Hydroplaning Crash Study and Mitigation Strategies Phase II
Page 20
The FHWA approved CMFs are associated with various safety treatments that increases the overall paved area used by a vehicle, providing audible warning when a vehicle is leaving the driving lane, or improving the friction to reduce hydroplaning and loss of vehicle control. As shown in Table 8, currently there are no CMFs that can be directly related to the proposed mitigation strategies that have been discussed in this report. FHWA maintains a CMF Clearinghouse with additional safety countermeasures. These CMFs have quality ratings ranging from 0-stars to 5-stars based on the supporting research and effectiveness. While these countermeasures are not directly cited as mitigating hydroplaning crashes, they could be evaluated by the Turnpike Safety Engineer. Additionally, the Safety Engineer can assist with the development of a CMFs for any proposed countermeasure that can mitigate hydroplaning related crashes.
5.2. Benefit Cost Ratio
Benefit-cost (B/C) ratios can be used as one of the key indicators for selection of a mitigation strategy for hydroplaning. A B/C of greater than 1 correlates to an overall benefit for the project. B/C can be defined as:
The following parameters are required to estimate the B/C ratio for a particular mitigation strategy:
• Crash modification factor
• Existing crash data
• Design life of project
• Existing traffic data
• Avg. cost per crash
• Cost of initial implementation
• Cost of additional long-term maintenance
There are however several concerns that are associated with estimating an acceptable B/C ratio. One of which is that CMFs are not available for all mitigation strategies and no research exists for several mitigation strategies pertaining to hydroplaning studies. In addition, the cost of implementing a particular measure is not always straightforward as it can involve an accurate estimation of right-of-way costs, reconstruction costs, utility relocation costs, schedule delays, new technology, and long-term maintenance costs. In addition, a strategy that can mitigate hydroplaning crashes may have adverse effects on dry weather conditions and may increase crashes in the dry weather.
Hydroplaning Crash Study and Mitigation Strategies Phase II
Page 21
5.3. Workflow of Recommended Approach The following approach is recommended to tackle the hydroplaning scenario in a project:
Evaluate initial site conditions and crashes
Run hydroplaning tool to identify deficient areas
• No need to proceed if no deficient areas.
Evaluate the best mitigating strategy by B/C ratio
• Use minimum “3 star” rated CMF’s first then work with Turnpike Safety Engineer for “zero star”, “2 star” rated CMF’s or if none are available.
• Provide at least 3 strategies for comparison
Identify context sensitive concerns that could affect Turnpike decision making
• Schedule
• Stakeholder Input
• Site Constraints
• Long Term Maintenance Costs
• Constructability
Provide recommended mitigation strategy based on best b/c ratio and least impact to site and schedule.
All mitigation strategies should be provided to FTE as a technical memorandum prior to implementation to obtain FTE concurrence.
Figure 9 provides a schematic diagram of the recommended approach.
Hydroplaning Crash Study and Mitigation Strategies Phase II
Page 22
Figure 9. Hydroplaning Mitigation Approach
* Consultant shall work with Turnpike Safety Office to develop crash modification factor if it does not exist.
*
Hydroplaning Crash Study and Mitigation Strategies Phase II
Page 23
6. Recommended Changes to Turnpike Design Handbook
As part of this Phase II study, the current TDH was consulted, and any additional guidelines that can assist the designer to assess and mitigate hydroplaning issues for existing or future FTE facilities were analyzed. Based on the analysis and Phase II assessment, the following are recommended to be included/modified in the TDH.
Add the following activities in the Section 110.2 Initial Engineering Design:
(13) Identify seasonal high water and base clearance water elevations and determine base clearance.
(14) Identify applicable project drainage criteria and constraints. Determine impacts to project design and schedule.
(15) Identify locations of potential hydroplaning risk and develop mitigating strategies to reduce risk and aid the development of the typical section package. This shall be performed prior to the Phase I submittal to provide sufficient time for Turnpike concurrence.
* Consultant shall work with Turnpike Safety Office to develop crash modification factor if it does not exist.
*
Hydroplaning Crash Study and Mitigation Strategies Phase II
Page 24
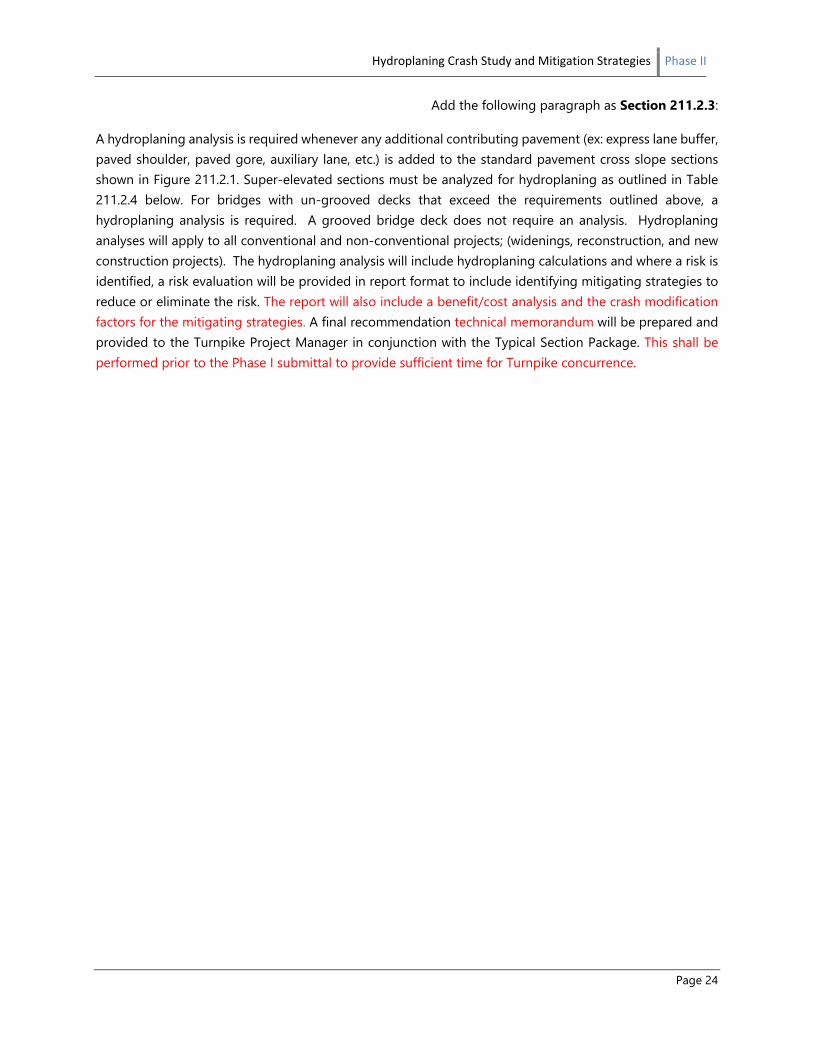
Add the following paragraph as Section 211.2.3:
A hydroplaning analysis is required whenever any additional contributing pavement (ex: express lane buffer, paved shoulder, paved gore, auxiliary lane, etc.) is added to the standard pavement cross slope sections shown in Figure 211.2.1. Super-elevated sections must be analyzed for hydroplaning as outlined in Table 211.2.4 below. For bridges with un-grooved decks that exceed the requirements outlined above, a hydroplaning analysis is required. A grooved bridge deck does not require an analysis. Hydroplaning analyses will apply to all conventional and non-conventional projects; (widenings, reconstruction, and new construction projects). The hydroplaning analysis will include hydroplaning calculations and where a risk is identified, a risk evaluation will be provided in report format to include identifying mitigating strategies to reduce or eliminate the risk. The report will also include a benefit/cost analysis and the crash modification factors for the mitigating strategies. A final recommendation technical memorandum will be prepared and provided to the Turnpike Project Manager in conjunction with the Typical Section Package. This shall be performed prior to the Phase I submittal to provide sufficient time for Turnpike concurrence.
Hydroplaning Crash Study and Mitigation Strategies Phase II
2. Gunaratne, M., et al. “Hydroplaning on multi lane facilities”. No. BDK84 977-14. 2012.
3. Yassin, M., Jayasooriya, W., & Gunaratne, M. (2013). Assessment of the Reliability of Predicting Hydroplaning Risk Based on Past Hydroplaning Accident Data on the Florida Interstate System. Transportation Research Record: Journal of the Transportation Research Board, (2369), 104-113.
4. Pratt, M. P., Geedipally, S. R., Pike, A. M., Carlson, P. J., Celoza, A. M., & Lord, D. (2014). Evaluating the need for surface treatments to reduce crash frequency on horizontal curves (No. 0-6714-S). Texas Transportation Institute, Texas A&M University System.
5. NCHRP Project 15-55: Guidance to Predict and Mitigate Dynamic Hydroplaning on Roadways. 2017.
6. Florida Design Handbook. 2018.
7. Turnpike Design Handbook. 2018.
8. Cooley Jr, L. A., Brumfield, J. W., Mallick, R. B., Mogawer, W. S., Partl, M. N., Poulikakos, L. D., & Hicks, G. (2009). Construction and maintenance practices for permeable friction courses (No. Project 09-41).
9. Huebner, R., Anderson, D., Warner, J., & Reed, J. (1997). PAVDRN: Computer model for predicting water film thickness and potential for hydroplaning on new and reconditioned pavements. Transportation Research Record: Journal of the Transportation Research Board, (1599), 128-131.
10. Jayasooriya, Waruna, and Manjriker Gunaratne. "Evaluation of Widely Used Hydroplaning Risk Prediction Methods Using Florida's Past Crash Data." Transportation Research Record: Journal of the Transportation Research Board 2457 (2014): 140-150.
11. Anderson, David A., et al. Improved Surface Drainage of Pavements. No. Project 1-29,. 1998.
12. Ivey, Don L., Eero K. Lehtipuu, and J. W. Button. "Rainfall invisibility--the view from behind the wheel." Journal of safety research 7.4 (1975): 156-169.
13. Gallaway, B.M., Ivey, D.L., Hayes, G.G., Ledbetter, W.G., Olson, R.M., Woods, D.L. and Schiller, R.E., “Pavement and Geometric Design Criteria for Minimizing Hydroplaning”, FHWA RD-79-31, 1979, pp. 278.
14. Anderson, D.A., Huebner, R.S., Reed, J.R., Warner, J.C., and J.J.Henry. Improved Surface Drainage of Pavements, The Pennsylvania Transportation Institute. National Cooperative Highway Research program, Transportation Research Board National Research Council, NCHRP Web-Only Document (Project 1-29), University Park, PA, 1998.
15. Fwa, T., Kumar, S., Anupam, K., & Ong, G. (2009). Effectiveness of tire-tread patterns in reducing the risk of hydroplaning. Transportation Research Record: Journal of the Transportation Research Board, (2094), 91-102.
16. Merritt, D. K., Lyon, C. A., & Persaud, B. N. (2015). Evaluation of pavement safety performance (No. FHWA-HRT-14-065).
17. Stein, W. J., & Neuman, T. R. (2007). Mitigation strategies for design exceptions (No. FHWA-SA-07-011).