Hydrosol deposition in fibrous beds Chang-upp Choo and Chi Tien Department of Chemical Engineering and Materials Science, Syracuse University, Syracuse, NY, USA Clean jilter coejjkients (or unit collector efjiciencies) for the removal of small particles from dilute liquid suspensions by fibrous filters were calculated using different porous media models. Based on the numerical results obtained, approximate expressions of the filter coefficient were established and relate thejlter coefficient with various relevant dimensionless parameters. The results were found to be in good agreement with experiments conducted as part of this study. Keywords: filtration; hydrosol; fibrous filters; deep-bed filtration; deposition Introduction Clarification of dilute liquid suspensions is often ac- complished by passing the suspension to be treated through a packed bed. As the retention of particles by the bed takes place throughout the entire bed, the pro- cess is commonly referred to as deep bedjltration or depth$ltration. In contrast, the more common surface (or cake) filtration is effected by passing a slurry through a medium that acts principally as a sieve or screen, leading to formation of a cake at the surface of the median. The best-known example of deep bed filtration is perhaps the use of sand filters for water treatment. The selection of granular media for water treatment is ne- cessitated by the specific requirements of the water industry; namely, a very large filtration capacity and the need for low operating cost. On the other hand, when deep-bed filtration is applied to systems other than water (for example, liquid metals or polymers), these requirements may no longer be valid. The possi- ble use of filter media other than granular ones war- rants consideration. Fibrous filters represent a natural alternative to granular filters in cases where high particle collection efficiency is required. In terms of their performances, fibrous filters have two major advantages; namely, fi- bers usually can be fabricated with a dimension signifi- cantly less than that of commonly available granular substances, and the porosity of fibrous beds may be Address reprint requests to Mr. Choo at the Department of Chemi- cal Engineering and Materials Science, Syracuse University, Syra- cuse, NY 13244, USA. Received 1 May 1990; accepted 10 October 1990 122 Separations Technology, 1991, vol. 1 varied over a much greater range than that of granular beds. Since particle collection efficiency, in general, increases with the decrease of the size of the entities constituting a filter and the pressure drop necessary to maintain a given flow rate decreases with the increase of the porosity (as can be deduced from the Carman- Kozeny equation), a more efficient filter can be de- signed with fibrous material than with granular sub- stance. Accordingly, in applications such as filtration of polymers or molten metals, where the unit price of product is high and the required filtration capacity is limited, fibrous filters become more attractive than granular filters. This conclusion is confirmed by the growing number of new fibrous filter media prepared for various special applications that have become com- mercially available in recent years. In contrast to the growing practical interests in fi- brous filters, research in deep bed filtration is still con- fined largely to granular beds. The present study was undertaken in view of the general lack of information about fibrous beds for liquid filtration. The study con- sists of three main parts: First, filter coefficients of supramicron particles with a negligible Brownian dif- fusion effect were obtained using the conventional tra- jectory calculations based on several different porous media models. As part of the study, based on the nu- merically determined results on filter coefficients, sim- ple, approximate expressions relating the filter coeffi- cient with the various relevant parameters were developed. Second, filter coefficients for submicron particles with a dominant Brownian diffusion effect were calculated by considering the deposition problem as analogous to mass transfer fiber. Finally, a limited number of experiments of fibrous filtration using acti- vated carbon fiber as the filtration media were con- ducted. The experiments were compared with the cal- 0 1991 Butterworth-Heinemann
Transcript
Hydrosol deposition in fibrous beds
Chang-upp Choo and Chi Tien
Department of Chemical Engineering and Materials Science, Syracuse University, Syracuse, NY, USA
Clean jilter coejjkients (or unit collector efjiciencies) for the removal of small particles from dilute liquid suspensions by fibrous filters were calculated using different porous media models. Based on the numerical results obtained, approximate expressions of the filter coefficient were established and relate thejlter coefficient with various relevant dimensionless parameters. The results were found to be in good agreement with experiments conducted as part of this study.
Clarification of dilute liquid suspensions is often ac- complished by passing the suspension to be treated through a packed bed. As the retention of particles by the bed takes place throughout the entire bed, the pro- cess is commonly referred to as deep bedjltration or depth$ltration. In contrast, the more common surface (or cake) filtration is effected by passing a slurry through a medium that acts principally as a sieve or screen, leading to formation of a cake at the surface of the median.
The best-known example of deep bed filtration is perhaps the use of sand filters for water treatment. The selection of granular media for water treatment is ne- cessitated by the specific requirements of the water industry; namely, a very large filtration capacity and the need for low operating cost. On the other hand, when deep-bed filtration is applied to systems other than water (for example, liquid metals or polymers), these requirements may no longer be valid. The possi- ble use of filter media other than granular ones war- rants consideration.
Fibrous filters represent a natural alternative to granular filters in cases where high particle collection efficiency is required. In terms of their performances, fibrous filters have two major advantages; namely, fi- bers usually can be fabricated with a dimension signifi- cantly less than that of commonly available granular substances, and the porosity of fibrous beds may be
Address reprint requests to Mr. Choo at the Department of Chemi- cal Engineering and Materials Science, Syracuse University, Syra- cuse, NY 13244, USA. Received 1 May 1990; accepted 10 October 1990
122 Separations Technology, 1991, vol. 1
varied over a much greater range than that of granular beds. Since particle collection efficiency, in general, increases with the decrease of the size of the entities constituting a filter and the pressure drop necessary to maintain a given flow rate decreases with the increase of the porosity (as can be deduced from the Carman- Kozeny equation), a more efficient filter can be de- signed with fibrous material than with granular sub- stance. Accordingly, in applications such as filtration of polymers or molten metals, where the unit price of product is high and the required filtration capacity is limited, fibrous filters become more attractive than granular filters. This conclusion is confirmed by the growing number of new fibrous filter media prepared for various special applications that have become com- mercially available in recent years.
In contrast to the growing practical interests in fi- brous filters, research in deep bed filtration is still con- fined largely to granular beds. The present study was undertaken in view of the general lack of information about fibrous beds for liquid filtration. The study con- sists of three main parts: First, filter coefficients of supramicron particles with a negligible Brownian dif- fusion effect were obtained using the conventional tra- jectory calculations based on several different porous media models. As part of the study, based on the nu- merically determined results on filter coefficients, sim- ple, approximate expressions relating the filter coeffi- cient with the various relevant parameters were developed. Second, filter coefficients for submicron particles with a dominant Brownian diffusion effect were calculated by considering the deposition problem as analogous to mass transfer fiber. Finally, a limited number of experiments of fibrous filtration using acti- vated carbon fiber as the filtration media were con- ducted. The experiments were compared with the cal-
0 1991 Butterworth-Heinemann
Hydrosol deposition in fibrous beds: C-u Choo and C. Tien
culated results of the filter coefficients in order to validate the accuracy of the calculation.
Calculation of filter coefficient by trajectory analysis
The extent of deposition taking place in a filter bed may be described by the specific deposit, (T, defined as the volume of deposited particles per unit filter vol- ume. The time derivation of o, &r/at, is therefore the local, instantaneous filtration rate. &r/f% is commonly written as
aa - = hu,c at (1)
where u, is the liquid superficial velocity and c is the particle concentration. On physical grounds, the filtra- tion rate can be expected to be proportional to the particles present in the suspension to be filtered, or u,c. Filter coefficient, according to Equation 1, is the proportionality constant, or for a given particle, the probability of its capture.
To conceptualize the capture of particles by a filter, a filter may be considered as an assembly of collectors. For the simplest case, where all the collectors are the same in size and shape, the collection efficiency of an individual collector (i.e., unit collector efficiency), 7, and the filter coefficient, A, are related to one another such that’
1 1 -=7/e if q<l (2)
A=T1nl-q
where 4 is the length of periodicity or the axial dis- tance of a unit collector and
T ‘12a e = (1 - EOf112 (3)
The unit collector efficiency can be determined from the classical trajectory analysis. First, an appro- priate geometrical configuration (in the case of fibrous beds, it is natural to assume the collectors to be cylin- drical) may be selected to represent the collecting bodies, and a compatible porous media model may be
Notation
A, B, D Constants of velocity distribution (see Equations 8.6a and 8.6b
AI Constant defined by Equation 10 af Fiber radius
UP Particle radius b Fluid envelope radius c1,c2,c3,c4 Coefficients of stream function c Particle concentration
Effluent concentration ceff Gin Influent concentration Cm Particle concentration of approaching
liquid DBM Brownian diffusivity E Constant of Equation 14
$l,h Ratio of r),Jqr Quantity defined by Equation 11
& Gravitational acceleration Hamaker constant
L Filter height e Length of periodicity NDL Dimensionless double-layer parameter
defined by Equation 7.6 NEI, NE2 Dimensionless electrokinetic parame-
ters No. 1 and No. 2 defined by Equa- tions 7.d and 7.e
NG Dimensionless gravitational parameter defined by Equation 7.b
NLO Dimensionless London force parameter defined by Equation 7.f
Npe Peclet number defined as uSaflDBM NR Interception parameter defined as a,laf RRtd Dimensionless retardation parameter
defined by Equation 7g
r Dimensionless radial coordinate t Time US Superficial velocity vx, uy Fluid velocity components Z Axial distance
Greek letters
.!? Dielectric constant of fluid Initial bed porosity
ZY 5P Surface potential of collectors and par- titles, respectively
r) Unit collector efficiency VBM Unit collector efficiency due to Brown-
ian diffusion 7)O Initial unit collector efficiency 7)I Unit collector efficiency by interception
only e Corrected time defined as t - zo/u, or
angular coordinate 0, Angular coordinate of the limiting tra-
A0 Initial filter coefficient A, Wavelength of electron oscillation CL Viscosity of liquid P, PP Liquid and particle densities, respec-
tively Specific deposit
; Dimensionless stream function
Separations Technology, 1991, vol. 1 123
Hydrosol deposition in fibrous beds: C-u Choo and C. Tien
chosen to represent the flow field around the fibers. Figure 1 depicts the representation of fibrous beds by a cell model in which a cylindrical collector of radius ar surrounded by a fluid envelope of radius b = (1 - .$1’2uf is used to represent a fibrous bed. With such a representation, fibrous filtration may be re- garded as the deposition of particles from a suspension flowing past a cylindrical collector.
The extent of deposition can be found from the lo- cation of the limiting trajectory, defined as the trajec- tory that makes contact with the collector surface at the rear stagnation point. If the angular position of this trajectory at the outer cell is 8,, it is clear that any particles whose initial angular positions at the outer cell are less than & will be deposited, while those with 19 greater than BC will escape. The initial unit collector efficiency, 710, is
no = sin & (4)
The location of the limiting trajectory equation can be found from the integration of the equations of parti- cle motion, which in turn, can be derived from a bal- ance of the various forces acting on the particle. The important forces involved in liquid filtration are the gravitational force, drag force (with hydrodynamic re- tardation correction), and surface interaction force (London-van der Waals and double-layer force). These forces and the equations of particle motion are given in Tables 1 and 2.
Several investigators have employed the use of tra- jectory analysis for estimating the collection efficien- cies in hydrosol filtration (for a summary of these stud- ies, see Tienl). In particular, Guzy et a1.2 calculated the collection efficiencies of fibrous filters using four different cell models (namely, Happel’s model, Kuwa- bara’s model, Swarm models with Darcy’s law, and that with Brinkman’s law). As part of the present work, the same calculations were repeated. There are two reasons for repeating the calculations. First, there is a need for improving the method used by Guzy et al.
Figure 1 Schematic representation of (a) cylinder-in-cell model and (b) Limiting trajectory concept
Table 1 Forces and torques acting on a particle
1. Drag forces and torque
F, = 67r/~a,u, [ -u,flt + ap ; f;, + By f? + oprg]
FY = -6rpapu,[uyf; + s4y2f~]
T, = 8rrw,u, [ -u; Es: + a&&g: + 2 &7;: + DY&) 1
2. Gravitational forces
F, = i 9x$(pP - p)g sin 6
FY = - ; T+, # p)g cos 0
3. London-van der Waals force
4. Electrokinetic force
in considering the hydrodynamic retardation effect. Second, and perhaps more important from practical consideration, in order to facilitate filter coefficient prediction, it is necessary to develop simple expres- sions of the filter coefficient as a function of relevant variables. For this purpose, a large body of numerical results of ho is required.
The dimensionless stream function, 5, for the fluid flow in the domain 1 < r < (1 - c~)-~‘* may be ex- pressed as
I$ = [clr3 + c2? + Q/T + c,$ In r] sin 8 (5)
where ? is the dimensionless radial distance (normal- ized by ar, the fiber collector radius). The coefficients cl, c2, c3, and c4 are given in Table 3 for the four models used. *
The hydrodynamic retardation correction factors (namely,f:,f:. . . appearing in the equation of parti- cle motion of Table 2) were derived by a number of previous investigators3-7 on the basis that the fluid ve- locity is of the type
UX = By + Dy2 (6.a)
vY = Ay2 (6.b)
Thus, for making hydrodynamic retardation correc- tions in trajectory calculations, the assumed flow field in the neighborhood of the collector needs to be repre- sented with the above format. Guzy et al2 used a set- ond-order approximation for the stream function, JI,
* The expression for 5, given in Table 3, for the Swarm model with Brinkman’s law is different from that given in Guzy et aL2 The expression given in Table 3, however, yields numerical values iden- tical to those given in Table I of Guzy et al.* while the expression given by Guzy et aLz failed to do so.
124 Separations Technology, 1991, vol. 1
Table 2 Equations of particle motion
Hydrosol deposition in fibrous beds: C-u Choo and C. Tien
The particle velocity components u, and uy are given as
u, = BN& + l)F#) + DNg(S + l)zFz(S) + NG sin 0 F&) (a)
where
F(s) = r;“,g: + (6 + 1)-Y&7;: 1 f:s: - w
F (*) 2
= f2mxgi + (6 + I)-Kg2 f:s: - w
(cl
id)
Dividing Equation a by b and using the definition of the various dimensionless parameters given in the text, the trajectory equation is found to be
d6 l+N&3+1,uy ;iii = NR u.
NCPSP 1 + N&s+ 1)
-NG COS 19 - 62(2 + ,qz + NE1(NE2 - e-ND@l , ~~~~DLa - AN&i + lYfm Y
=
NR BN& + l)F&) + DN$(6 + l&(S) + NG sin O&(6) (f)
where 6 is the dimensionless separation distance (normalized by a,) and F,&) = F,(6) fi, F,(6) = F2(8) fb, and Fs = F3(S) fb.
Table 3 Constants of stream function of the four cylinder-in-cell models
Cl c2 c3 c4
Happel’s model
Kuwabara’s model
-a2c4 _
2(1 + (Y2) -c, - c3
-c, - c3
c, + $
c, +2
-2
In a! + (I - a2)/(l + cy2)
-4
Swarm theory’ with Darcy’s law
Swarm theory with Brinkman’s Lawb
(~(2 + C, In (w) 1
4(1 - (I) -c, - c3 c, + 2
G
VYQ Ina
- - + 5 ( 25 + 4ar
KWVZ)
K&l/a)
16a + 8(1 - a) Ml/~) -c, - c3 c, + 2
1
2 4a5 K&A@)
a = 1 - Eg. a 5 is the positive root of the equation
(1 + a21 s4a(2 + 8(2 - (Y - a2 + In & + 2 7 -
4 + 1 - a* In (y = ()
- a!
b 5 is the root of the following equation:
5= (-a + 1 + In a + 2-a’ In a - 4ac)[2tG + (I - ala’1
(namely, Equation 5), to satisfy this requirement. As one moves away from the surface. Instead, it would be pointed out by Rajagopalan and Tien8 previously, this better, over any interval (y,, y2), y2 > y1 away from the kind of approximation is valid in the immediate vicin- collector surface, to approximate the fluid velocity by ity of the collector surface but tends to cause errors as Equations 6.a and 6.b such that the coefficients A, B,
Separations Technology, 1991, vol. 1 125
Hydrosol deposition in fibrous beds: C-u Choo and C. Tien
N Rtd = ?zzP A.5
Figure 2 Initial collection efficiency, Happel’s model versus NR at various NG values
and D vary with both x and y. The second method was used in the calculations performed in this study.
The integration of the equations of particle motion (see Table 2) was carried out backwards, namely, the integration began at r = 1 + NR, 0 = 7r, using an integration package (e.g., EPISODE). The initial col- lection efficiency (or filter coefficient) can be seen to be a function of the porosity of the filter and seven dimensionless parameters, including:
NR = a,laf (7.4
NC = *h - 6)) a2g
9/-W p (7.b)
NoL = Kap (733
NL~ =
H
97rpa@,
(7.4
(7.6
(7.0
(74)
with the meanings of the symbols given in the nomen- clature.
The effect of the interception and gravitational pa- rameters, NR and No, on the initial collector can be seen from the results shown in Figure 2. Also included in this figure are results obtained by ignoring the hy- drodynamic retardation effect. In general, the depen- dence of A0 (or r)o) on the various dimensionless pa- rameters is qualitatively similar to those observed in granular beds previously.
The difference between the results of this work and those of Guzy et al2 can be seen from Table 4, in which the numerical value of q. based on the two dif- ferent methods of estimating the hydrodynamic retar- dation correction factors are tabulated. Regardless of the particular cell model used, the results of the present study are consistently lower than those ob- tained by Guzy et a1.2, with the difference being of the order of 10% (at low porosities) to 40% (at high porosi- ties).
Collection efficiency due to Brownian diffusion
For submicron particles, their deposition is deter- mined largely by the Brownian diffusion, and the prob- lem can be treated as that of convection diffusion. As- suming that there is no repulsive force barrier, an asymptotic expression of the unit collector efficiency for large Peclet number (NrC = U&DBM, where us, ar, and DBM denote, respectively, the superficial velocity, collector radius, and the Brownian diffusivity of the particles) can be found by applying the Lighthill for- mula.9
The unit collector efficiency due to Brownian diffu- sion, r)a~, may be defined as
(8.4
where c is the particle concentration of the liquid stream, c, is the particle concentration of the ap-
Table 4 Comparisons between the calculated unit collector efficiencies and those reported by Guzy et aL2
Unit collector efficiency (%) by trajectory calculation
Hydrosol deposition in fibrous beds: C-u Choo and C. Tien
,
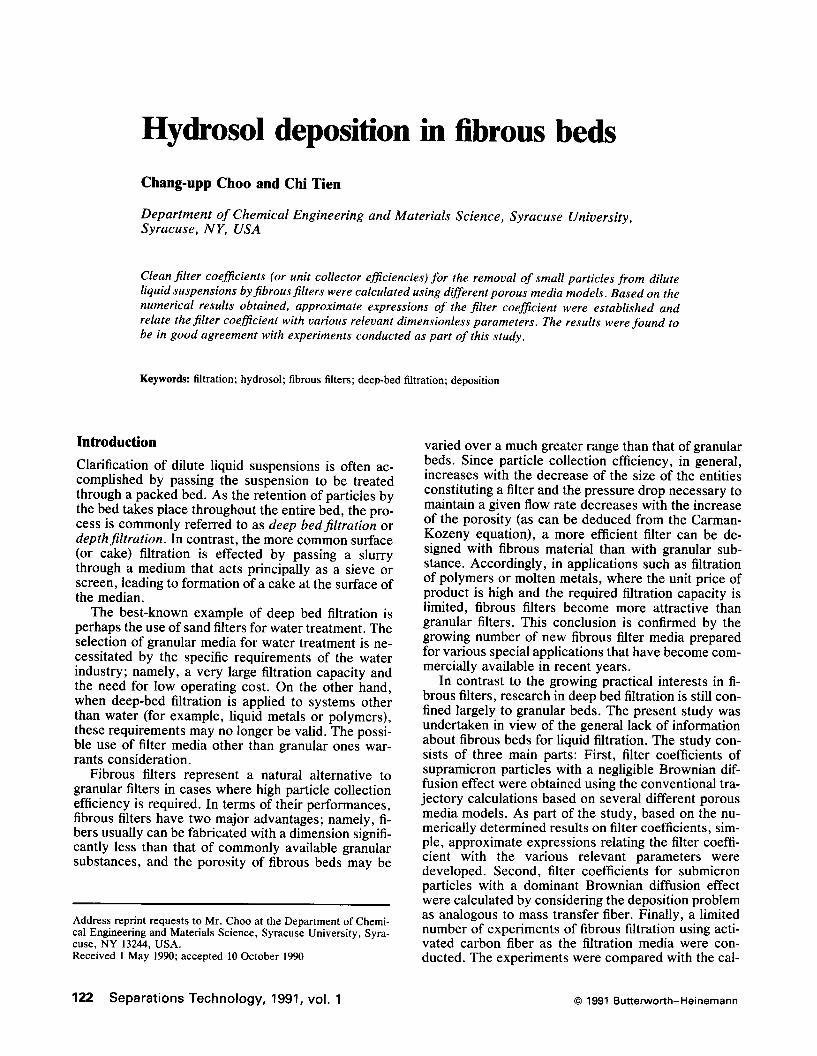
Figure 3 Collection efficiency due to Brownian diffusion ac- cording to different porous media models
proaching liquid stream, and q is the volumetric flow rate of liquid into the fluid envelope. ‘~)au is found from the convective diffusion equation to be
TBM = (i)lil [It (sin 19)“~ &]” (’ ~~~)“*
x (c, + cpNp3 e
= 2.30 N;,2’(1 - a,#‘*(~, + c~)“~ (8.b)
which is identical to the results of Guzy et al.* Equation 8.b suggested that qau varies with the cell
model used for characterizing the fibrous filter. How- ever, the difference is relatively small, as shown in Figure 3.
For particles of intermediate sizes such that their deposition is controlled by interception, sedimenta- tion, as well as Brownian diffusion, as an approxima- tion, the initial unit collection efficiency, 770, may be assumed to be the sum of Equations 8.b and 14, which is to be developed in the following section.
Approximate expression of w
The trajectory analysis shown above can be used to predict the collection efficiency if fibrous beds under the condition that the surface interaction between the particles and fibers is favorable. Its use, however, re- quires the integration of the equation of particle mo- tion, which may become tedious under certain condi- tions. For preliminary design calculations, it is often desirable to have explicit expressions relating the col- lection efficiency with relevant variables. Both Raja- gopalan and Tien8 and Yoshimura*” developed such expressions for collection efficiencies of granular beds with favorable surface interactions. Similar expres- sions based on the numerical result of qo obtained in this study were obtained according to the procedure described below.
From the stream function expression of Equation 5, the unit collector efficiency due to interception alone, qI, can be found to be
rlI = ; A:(1 - so)“* N; (9)
where
; (4c1 + c4)
A;= 1
i
(10)
Cl - - 2 + a) + (c412)(a - 1 - In a) d!
where CX, the packing density, is equal to 1 - so. Since interception is the major mechanism of depo-
sition, one may consider 70 to be a product of 71 and a correction factor, or
qoh1 = f = .fl + A (11)
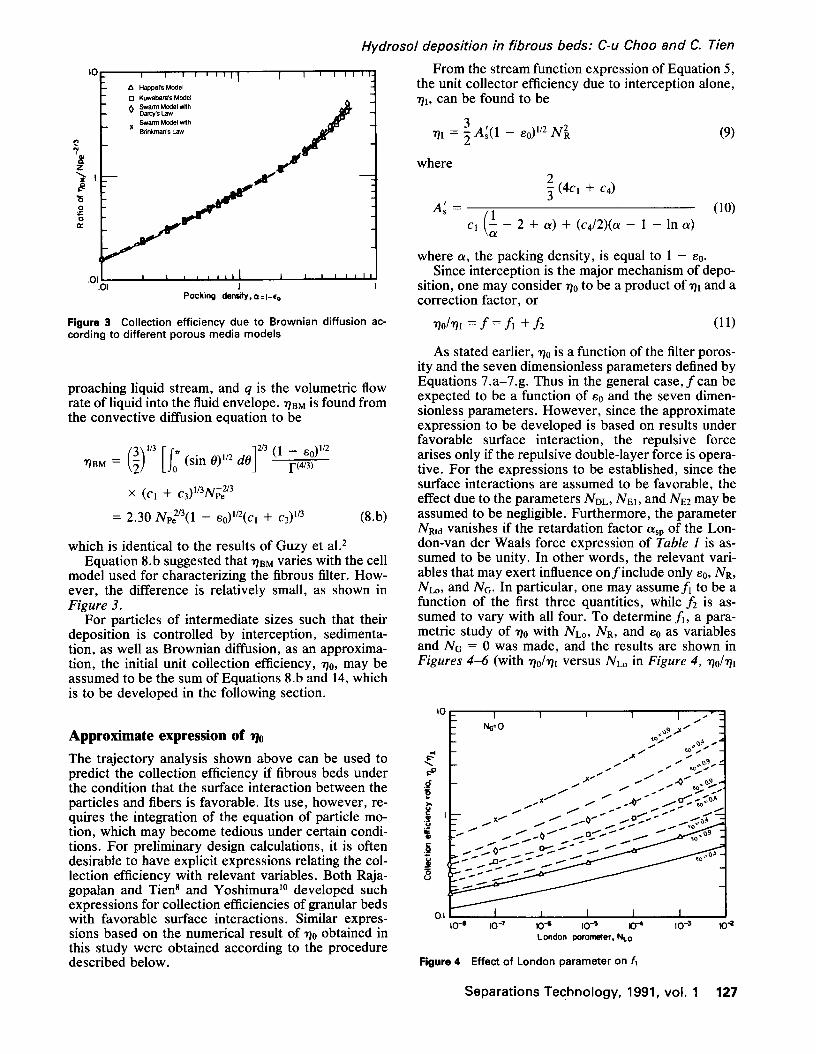
As stated earlier, q. is a function of the filter poros- ity and the seven dimensionless parameters defined by Equations 7.a-7.g. Thus in the general case, fcan be expected to be a function of e. and the seven dimen- sionless parameters. However, since the approximate expression to be developed is based on results under favorable surface interaction, the repulsive force arises only if the repulsive double-layer force is opera- tive. For the expressions to be established, since the surface interactions are assumed to be favorable, the effect due to the parameters NnL, NEI, and NE2 may be assumed to be negligible. Furthermore, the parameter Natd vanishes if the retardation factor Q, of the Lon- don-van der Waals force expression of Table I is as- sumed to be unity. In other words, the relevant vari- ables that may exert influence onfinclude only .so, Na, NL~, and No. In particular, one may assumef, to be a function of the first three quantities, while f2 is as- sumed to vary with all four. To determine fi, a para- metric study of q. with NLO, Na, and co as variables and No = 0 was made, and the results are shown in Figures 4-6 (with r)o/r]i versus NL~ in Figure 4, yolq~
-. IO-' IO-' 0‘ IO-’
London pammeter. t4/’ IO” 102
Figure 4 Effect of London parameter on 6
Separations Technology, 1991, vol. 1 127
Hydrosol deposition in fibrous beds: C-u Choo and C. Tien
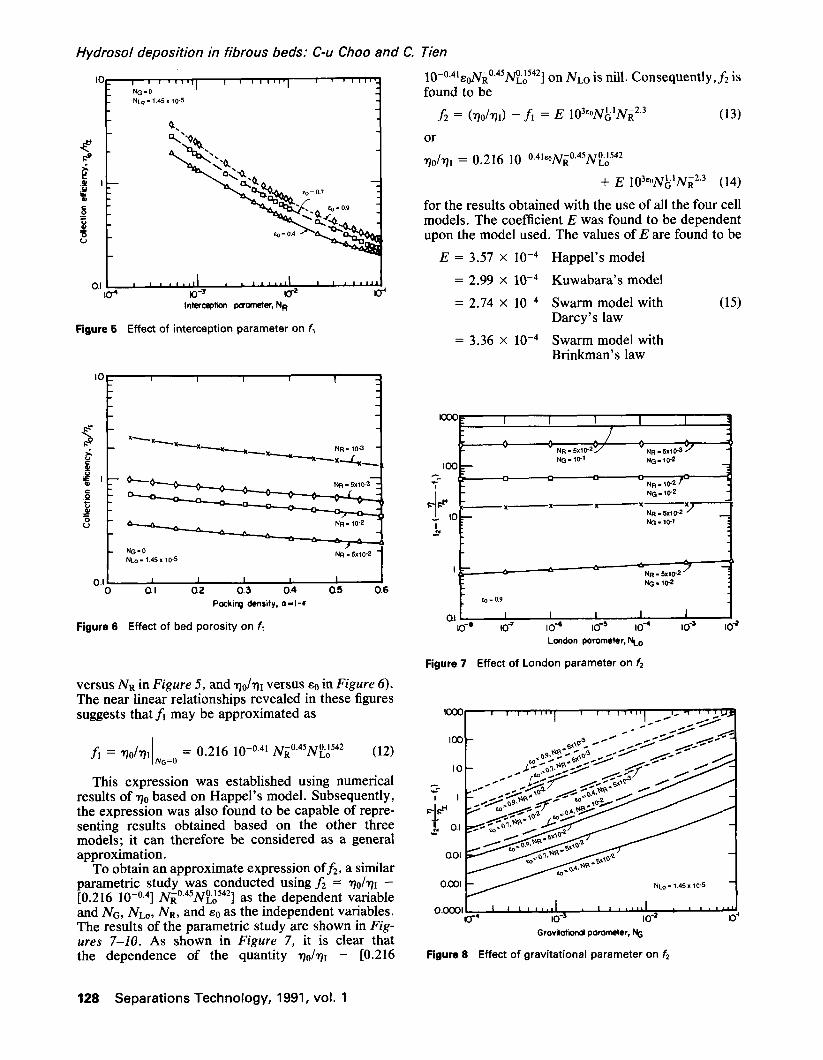
Figure 5 Effect of interception parameter on f,
NG’0 9
N~o.1.45x10-5 N~-5x10⁻²
1
0.11 0
I
al I I I I I
a2 0.3 0.4 05 0.6 Pockirq density, awl-*
Figure 6 Effect of bed porosity on f,
versus Na in Figure 5, and &qI versus co in Figure 6). The near linear relationships revealed in these figures suggests that fi may be approximated as
fi = ~o/~~~~G~o = 0.216 1O-o.41 Ni”.45N:;s42 (12)
This expression was established using numerical results of q. based on Happel’s model. Subsequently, the expression was also found to be capable of repre- senting results obtained based on the other three models; it can therefore be considered as a general approximation.
To obtain an approximate expression offi, a similar parametric study was conducted using f2 = r)o/r)I - [0.216 1O-o.4] Ni”.45NtA542] as the dependent variable and NC, NL~, Na, and co as the independent variables. The results of the parametric study are shown in Fig- ures 7-10. As shown in Figure 7, it is clear that the dependence of the quantity qo/qI - [0.216
10-0.41~0~~0.4JRPi~5421 on NLO is nill. Consequently, f2 is found to be
fi = (qo/qI) - fi = E 103”oN&‘NR2.3
or
(13)
r)o/711 = 0.216 ~O-~.~~“ONR~,~~N~~~~~
+ E 103EoN~‘N~2~3 (14)
for the results obtained with the use of all the four cell models. The coefficient E was found to be dependent upon the model used. The values of E are found to be
E = 3.57 X 10m4 Happel’s model
= 2.99 x 10m4 Kuwabara’s model
= 2.74 x low4 Swarm model with Darcy’s law
(15)
= 3.36 x 10s4 Swarm model with Brinkman’s law
0.1 I I I I I 1 10-s IO” IO* IO-’ 10-4 lo-’ IO<
London porometer. To
Figure 7 Effect of London parameter on fz
Grovtiotiind porometer, F(G
Figure 6 Effect of gravitational parameter on f2
128 Separations Technology, 1991, vol. 1
IOOG
lOG
I0
T ~ ,
I
O.I
001
Ot:X)l
Hydrosol deposition in fibrous beds: C-u Choo and C. Tien
~o = 0"9 .111-5 ~ NL°" 1"45 x 10 NG. 10. 4 ~
, , . . . . . . I . . . . . . . . I , ,
iO-3 IO-I iO ̀4 Intercel~lion porometer, N R
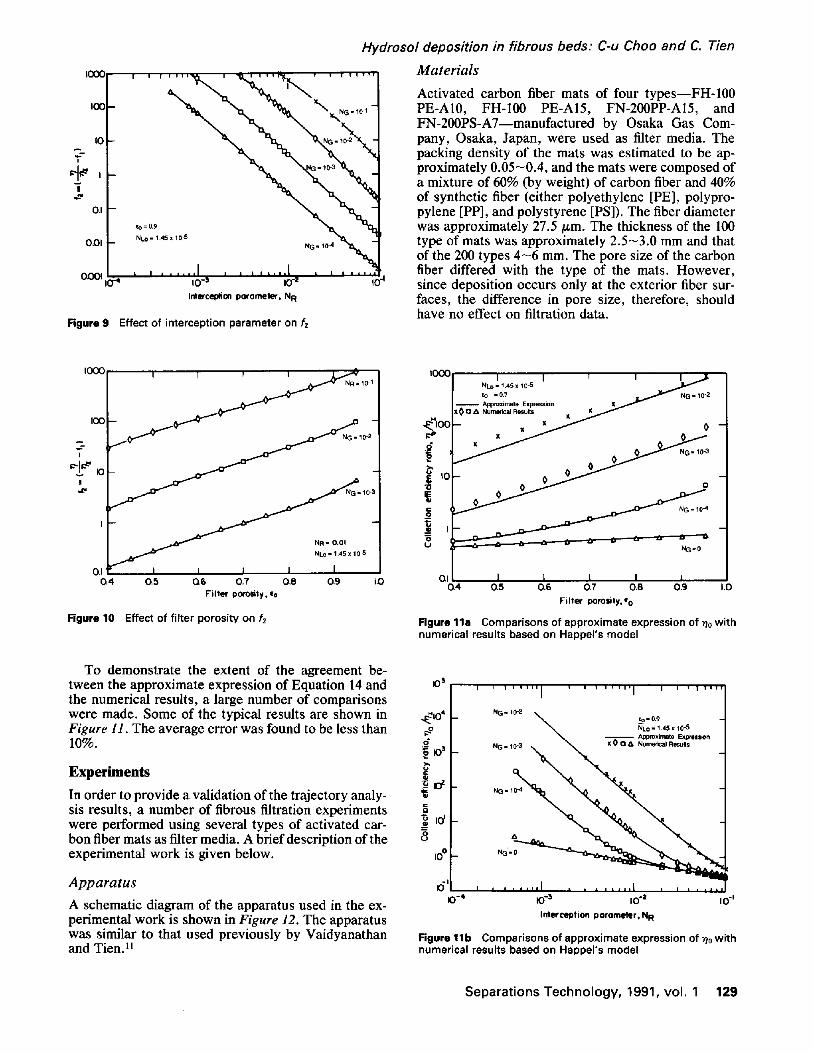
Figure 9 Effect of interception parameter on f2
Materials
Activated carbon fiber mats of four types--FH-100 PE-A10, FH-100 PE-A15, FN-200PP-A15, and FN-200PS-A7--manufactured by Osaka Gas Com- pany, Osaka, Japan, were used as filter media. The packing density of the mats was estimated to be ap- proximately 0.05~0.4, and the mats were composed of a mixture of 60% (by weight) of carbon fiber and 40% of synthetic fiber (either polyethylene [PE], polypro- pylene [PP], and polystyrene [PS]). The fiber diameter was approximately 27.5/zm. The thickness of the 100 type of mats was approximately 2.5~3.0 mm and that of the 200 types 4~6 mm. The pore size of the carbon fiber differed with the type of the mats. However, since deposition occurs only at the exterior fiber sur- faces, the difference in pore size, therefore, should have no effect on filtration data.
I000
1130
7- I
I
0.1 0.4
F i g u r e 10
J t I I ~ I "- NR= ,L~,~v 10-1
J : : " 01 ::~ x 10 5
I I I i I 0.5 a6 0.7 0,8 O9 I.O
Filter porosity, "a
Effect of f i l ter porosi ty on f2
To demonstrate the extent of the agreement be- tween the approximate expression of Equation 14 and the numerical results, a large number of comparisons were made. Some of the typical results are shown in Figure 11. The average error was found to be less than 10%.
Experiments In order to provide a validation of the trajectory analy- sis results, a number of fibrous filtration experiments were performed using several types of activated car- bon fiber mats as filter media. A brief description of the experimental work is given below.
Apparatus
A schematic diagram of the apparatus used in the ex- perimental work is shown in Figure 12. The apparatus was similar to that used previously by Vaidyanathan and Tien. l]
IOOO
~ IOC
~" ~o
i
NLo/1.45x10.5 I 1 ~ 1 I ~J;
~,ppm~;Ll. Expression X ~ ~ ' ~ - h'G" ̀ 0-2
XO0 A NumericalResults It ~ /
- - It ~ 0 - -
0_~-~- NG = 10a
NG= 0
I I I I I Q4 0.5 0.6 0.7 0.8 0.9 1,0
Filter porosity, f 0
Figure 11a Comparisons of approximate expression of r/o with numerical results based on Happel's model
tO s
@ d
.S te
8
io ° _
10 -4
Figure 1 l b
NG" 10-2 ~ eO = 0"9 NLo = 1.45 x 10-5
= Approximate Expression NG=~0-3 ~ ~ XV'O A NurnerioalResuns
NG = 10 -4
f . , , . IO -~ I 0 "2 I O "
In tercept ion p o r o m e t e r , N R
Comparisons of approximate expression of 7/o with numerical results based on Happel's model
Separat ions Techno logy , 1991, vol . 1 129
Hydrosol deposition in fibrous beds: C-u Choo and C. 7ien
Latex particles of styrene-divinylbenzene copoly- mer of diameter 6.4 pm obtained from Duke Scientific Corp. (Palo Alto, CA) were used in the experiments. The test suspension were prepared using sodium ace- tate as a buffering agent, and sodium chloride was added to provide the desired ionic strength. Both chemicals were obtained from Aldrich Chemical Co. (Milwaukee, WI).
Particle concentration analysis
A Coulter particle counter (model ZB) equipped with a multichannel analyzer (model C-1000, Coulter Elec- tronics) interfaced with an Apple II plus computer was used for analyzing the particle concentration. The ac- curacy of the instrument under the operating condi- tions was estimated to be 5%.
Figure 12 Schematic diagram of the experimental apparatus
Results
The macroscopic conservation equation of deep bed filtration is
where c and cr are the particle concentration of the suspension and the specific deposition, and us is the superficial velocity. The independent variables are the axial distance z and the corrected time, 8, defined as t - zq,/us. The above equation, together with Equation 1, give the description of the dynamic behavior of deep bed filtration. During the initial period of filtration, A = ho throughout the entire bed, which is free of deposited particles. For the initial condition, c = tin at z = 0. The solution of Equations 1 and 15 is
x
L x x x_l
(17) 01: IO+ IO-' -2
lo Id IO0 Electrolyk conomtrotiin.mol/~
Figure 13 Initial filter coefficient versus ionic strength
where ceff is the effluent concentration and L is the bed height.
8 t -I
-
i OJ 1 1 1 11111,l I I,,,,,. I I1.11,
lo-’ lo-* 10-I IO0 Electrolyte concentrotion.ml/l
0.111 IO-’ lo-’ 10-l loo
Electrolytic concentrotion,mot/~
Figure 14 Comparisons of calculated initial filter coefficients Figure 15 Comparisons of calculated initial filter coefficients with experiments at different ionic strengths with experiments at different ionic strengths
130 Separations Technology, 1991, vol. 1
Hydrosol deposition in fibrous beds: C-u Choo and C. Tien
Accordingly, the clean filter coefficient, ho, can be evaluated from experimental data to be
A0 = ; en Gin (18) ceff
The initial filter coefficient results obtained with us = 0.1 cm/s and using the four types of mats are shown in Figure 13, corresponding to different values of ionic concentration of the suspension. It is clear that from these results the ionic concentration had no ef- fect on particle deposition, from it which may be in- ferred that the surface interactions between the latex particles and the mat fiber used for the filtration exper- iments under these experimental conditions were fa- vorable .
A comparison between the experimentally deter- mined and calculated A0 is shown in Figures 14 and 15. Figure 14 shows the results obtained for experiments using FH-100 PE-A15 fiber mats, and Figure 15 is based on the data obtained using FN-200 PS-A7. Also shown in these two figures are calculated results based on the four different cell models. It is clear that the experimental results and predictions are well within a factor of two, which is the expected accuracy in deter- mining the filter coefficient of deep bed filtration.’ The contribution deposition by the Brownian diffusion was negligible because of the relatively large size of latex particles used in the experiment.
References
1.
2.
3.
4.
5.
6.
7.
8.
9.
10.
11.
Tien, C., Granular Filtration ofAerosols and Hydrosols. Bos- ton: Butterworths, 1989 Guzy, C.J., Bonano, E.J., and Davis E.J. “The analysis of flow and colloidal particle retention in fiborus porous media. .I Colloid Interface Sci 1983. 95. 523-543 Brenner, H.“The slow motion’of a sphere through a viscous fluid towards a plane surface. Chem. Eng. Sci. 1961,16,242- 251 Goren, S.L. and O’Neill, M.E. On the hydrodynamic resis- tance to a particle of dilute suspension when in the neighbor- hood of a large obstacle. Chem. Eng. Sci. 1971, 26, 325- 338 O’Neill, M.E. A slow motion of a viscous fluid caused by a slowly moving solid sphere. Mathematics 1964, 11, 67-74 Goldman, A.J., Cox, R.G., and Brenner, H. Slow viscous motion of a sphere parallel to a plane wall: I. Motion through a auiescient fluid. Chem. Ena. Sci. 1%7a. 22. 637-650 Goldman, A.J., Cox, R.G., and Brenner, H. Slow viscous motion of a sphere parallel to a plane wall: II. Couette flow. Chem. Eng. Sci. 1967b, 22, 653-659 Rajagopalan, R. and Tien, C. Trajectory analysis of deep-bed liltration with the sphere-in-cell porous media model. AZChE J 1976, 22,523-533 Lighthill, M.J. Contribution to the theory of heat transfer through a laminar boundary layer. Proc. R. Sot. London 1950, A202, 359-377 Yoshimura, Y. Initial Particle-Collection Mechanism in Clean Deep-Bed Filtration. Ph.D. Dissertation, Kyoto University, Kyoto, 1980 Vaidyanathan, R. and Tien, C. Hydrosol deposition in granu- lar beds. Chem. Eng. Sci. 1988, 43, 289-302