General rights Copyright and moral rights for the publications made accessible in the public portal are retained by the authors and/or other copyright owners and it is a condition of accessing publications that users recognise and abide by the legal requirements associated with these rights. • Users may download and print one copy of any publication from the public portal for the purpose of private study or research. • You may not further distribute the material or use it for any profit-making activity or commercial gain • You may freely distribute the URL identifying the publication in the public portal If you believe that this document breaches copyright please contact us providing details, and we will remove access to the work immediately and investigate your claim. Downloaded from orbit.dtu.dk on: Jul 06, 2018 Hygroscopic behaviour of paper and books Derluyn, Hannelore; Janssen, Hans ; Diepens, Jan; Derome, Dominique; Carmeliet, Jan Published in: Journal of Building Physics Link to article, DOI: 10.1177/1744259107079143 Publication date: 2007 Link back to DTU Orbit Citation (APA): Derluyn, H., Janssen, H., Diepens, J., Derome, D., & Carmeliet, J. (2007). Hygroscopic behaviour of paper and books. Journal of Building Physics, 31(1), 9-34. DOI: 10.1177/1744259107079143
Transcript
General rights Copyright and moral rights for the publications made accessible in the public portal are retained by the authors andor other copyright owners and it is a condition of accessing publications that users recognise and abide by the legal requirements associated with these rights
bull Users may download and print one copy of any publication from the public portal for the purpose of private study or research bull You may not further distribute the material or use it for any profit-making activity or commercial gain bull You may freely distribute the URL identifying the publication in the public portal
If you believe that this document breaches copyright please contact us providing details and we will remove access to the work immediately and investigate your claim
Downloaded from orbitdtudk on Jul 06 2018
Hygroscopic behaviour of paper and books
Derluyn Hannelore Janssen Hans Diepens Jan Derome Dominique Carmeliet Jan
Published inJournal of Building Physics
Link to article DOI1011771744259107079143
Publication date2007
Link back to DTU Orbit
Citation (APA)Derluyn H Janssen H Diepens J Derome D amp Carmeliet J (2007) Hygroscopic behaviour of paper andbooks Journal of Building Physics 31(1) 9-34 DOI 1011771744259107079143
Postprint Derluyn H Janssen H Diepens J Derome D Carmeliet J (2007) Hygroscopic behavior of paper and books Journal of Building Physics 31 (9) 9-34 DOI 1011771744259107079143
1
Hygroscopic behavior of paper and books
H Derluyn(a) H Janssen(b) J Diepens(c) D Derome(d) and J Carmeliet(ac)
(a) Department of Civil Engineering Laboratory of Building Physics Katholieke Universiteit Leuven Kasteelpark Arenberg 40 3001 Heverlee Belgium
(b) Department of Civil Engineering Section of Building Physics and Services
Technical University of Denmark Brovej ndash Building 118 2800 Kgs Lyngby Denmark
(c) Faculty of Building and Architecture Building Physics and Systems TUEindhoven PO Box 513 5600 MB Eindhoven The Netherlands
(d) Building Envelope Performance Laboratory Department of Building Civil and
Environmental Engineering Concordia University 1455 de Maisonneuve blvd West Montreal Qc Canada H3C 1M8
ABSTRACT This paper presents experimental analysis and numerical modeling of hygroscopic moisture buffering by paper and books First a literature review of moisture transport properties of paper is presented Experimental work on two paper types includes SEM analysis of the paper structure determination of sorption isotherms and water vapor permeability measurements A hysteretic model for paper is presented which is based on the measurement of the main adsorption and desorption curves It is shown that the water vapor permeability in a hysteretic model is dependent on the moisture content and not on the relative humidity Books consist of several paper sheets with air layers between the sheets To take the air layers into account a parallel transport model is proposed to determine the effective moisture transport properties of books taking into account the air layers The dynamic hygroscopic behavior of small book samples was measured It is shown that although the water vapor permeability of different paper types can be quite different the effusivity of a book highly depends on the presence of the air layers and can therefore remain comparable for different paper types KEY WORDS paper book hygroscopic properties hysteresis moisture buffering effective material properties
INTRODUCTION Paper being made of organic fibers is a hygroscopic material Books magazines newspapers in a room may therefore represent a high potential for moisture buffering since they are composed of a large set of thin paper layers Small air layers between the sheets may exist enhancing the water vapor transport into the book and increasing the moisture buffering capacity Until now it is not clear which paper surface of a book or magazine is accessible for moisture buffering when exposed to varying indoor air relative humidity For books with hard cover only the fore-edge and the topbottom-edges are accessible for moisture buffering
2
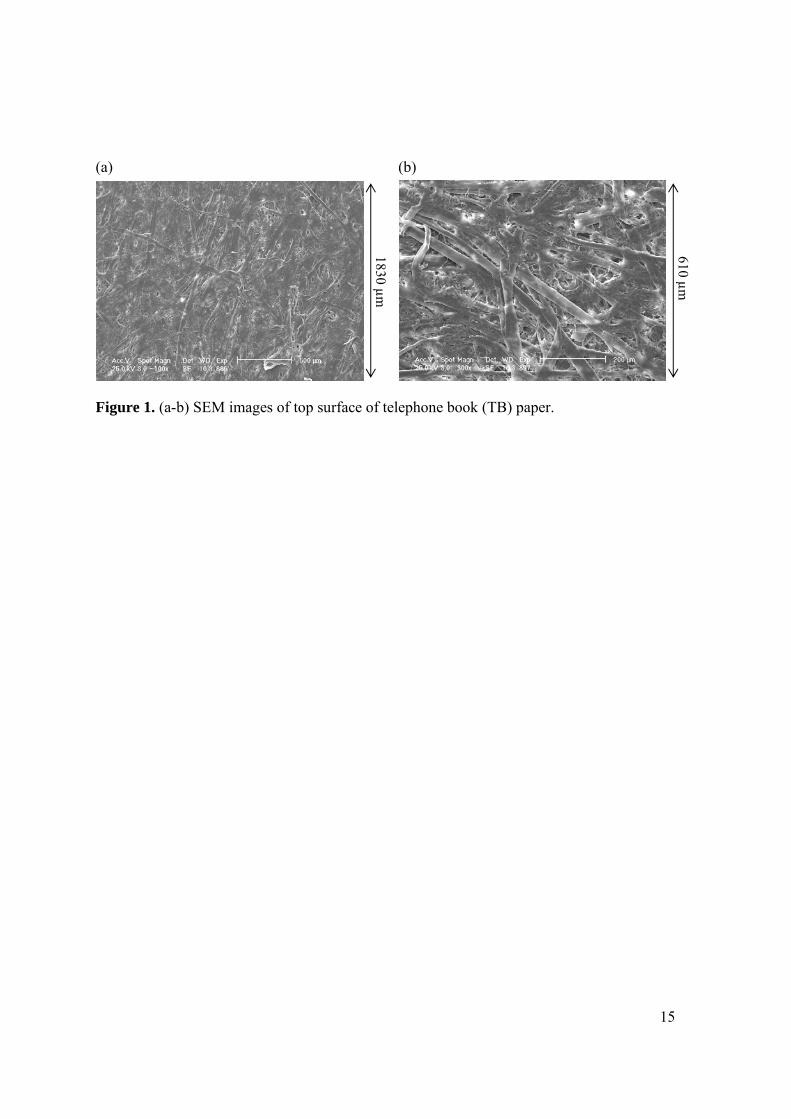
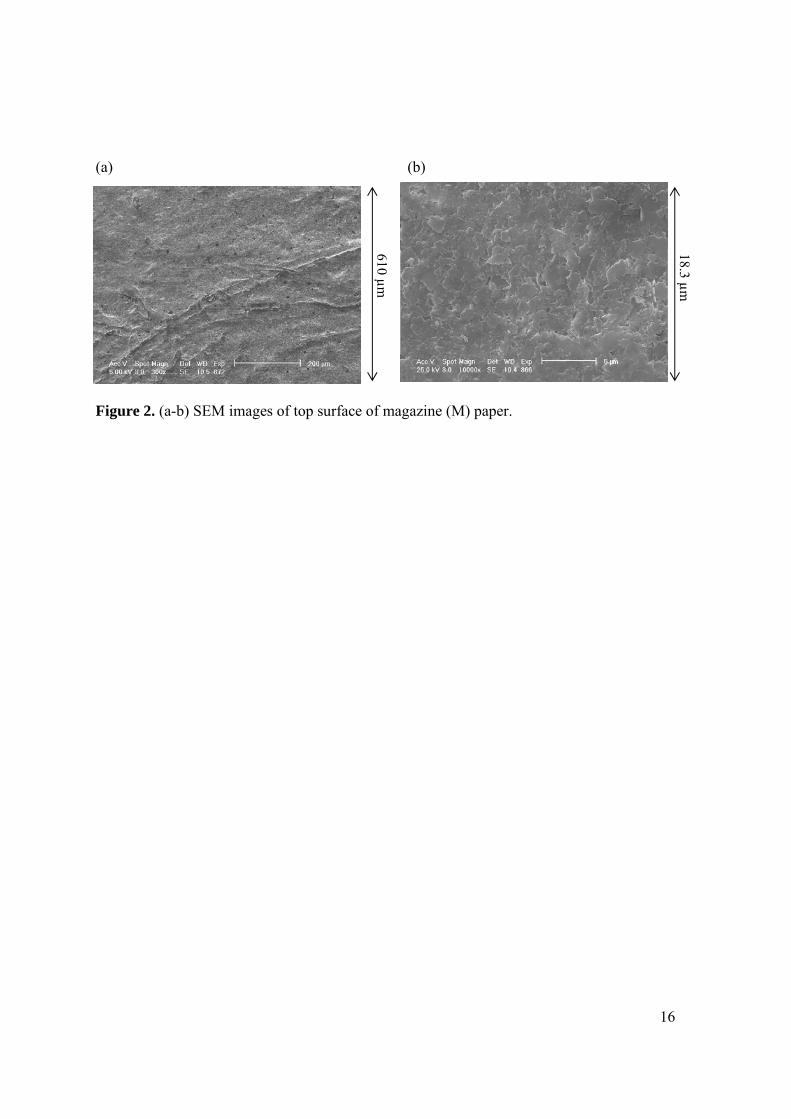
In the past several experimental and numerical methods and databases have been proposed to determine the moisture transport properties of building materials ([1]-[4] [12] [16]-[17]) However there is still a need for accurate moisture transport properties of paper magazines books and newspapers The moisture transport properties of paper itself may vary [7] The density of paper varies from 610-690 kgmsup3 for newsprint paper to 780 kgmsup3 for fine paper and up to 1150 kgmsup3 for coated super calendared paper Newsprint paper thickness may vary from 60 to 80 microns office paper is around 105 to 110 microns Porosity of paper can be as high as 70 It is reported in literature that especially water vapor permeability may vary due to differences in paper structure and surface treatment The paper structure is determined by the papermaking process which consists in pulping bleaching and beating Pulping is the process in which the wood is broken into wood fibers We distinguish mechanical and chemical pulping Bleaching whitens the pulp enhances brightness and eliminates impurities The structure of the fiber wall and surface is loosened by the beating process in order to ameliorate the mechanical properties of the paper As an example Figure 1 gives SEM images of a telephone book (TB) paper We clearly see the fibrous structure of paper The paper is made of 50 to 100 recycled fibers and has a matt finishing Figure 2 gives SEM images of a magazine (M) paper The paper has a pulp structure The paper is made of mechanical and chemical pulp color and fillers such as talc and calcium carbonate to make the paper smoother The paper is a machine finished coated paper and has a glossy finishing The glossy coating gives the paper a more closed surface In this study we first report on the moisture transport properties of paper Apart from a literature study we present a model to describe the hysteretic hygroscopic behavior of paper Two types of papers are measured a newsprint type paper and a magazine type paper (slightly glossy) In the second part we present a model to predict the moisture transport properties of books considered as multilayered air-paper systems The model is based on the properties of the paper itself and on the paper fraction defined as the ratio of paper volume to the total volume of the book Focus is on the transport through the fore-edge or the top-edge of a book ie with vapor transport parallel to the pages of the book
HYGROSCOPIC BEHAVIOR OF PAPER Theory Isothermal water vapor transport is described by
)( vpt
w
(1)
with w the moisture content [kgmsup3] t the time [s] the water vapor permeability [s] and pv the water vapor pressure [Pa] Further derivation gives
)( hpt
h
t
h
h
wvsat
a
(2)
3
with the moisture capacity [kgmsup3] h the relative humidity (RH) [-] a the water vapor permeability of dry air [s] the water vapor resistance factor [-] and pvsat the saturation water vapor pressure [Pa] The function describing w(h) is called the sorption isotherm A measure of the ability of a material to exchange moisture across its surface when the humidity changes at its surface is the moisture effusivity bm [kg(msup2Pasfrac12)]
vsatw
m pDb
(3)
with Dw the moisture diffusivity [msup2s] Literature data Sorption isotherm and water vapor permeability data for different types of paper were collected from literature The data are collected from [6] [10] [12] [13] and [15] The adsorption isotherms data were fitted using an equation of the van Genuchten type (see in [3])
mnhAww ln1)( max (4)
with A n parameters and wmax the moisture content at h = 1 We use the common assumption that m is given by nnm )1( The water vapor permeability data were fitted using the equation
cha
ebahwith
hh
1)(
)()(
(5)
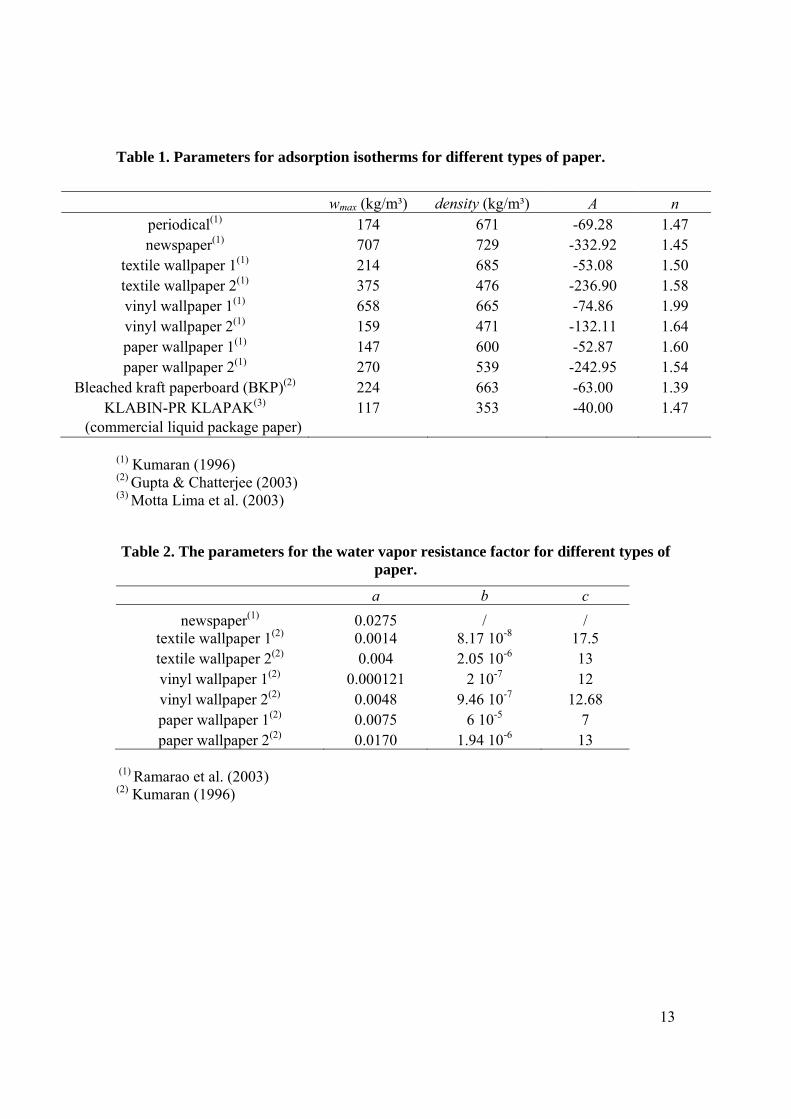
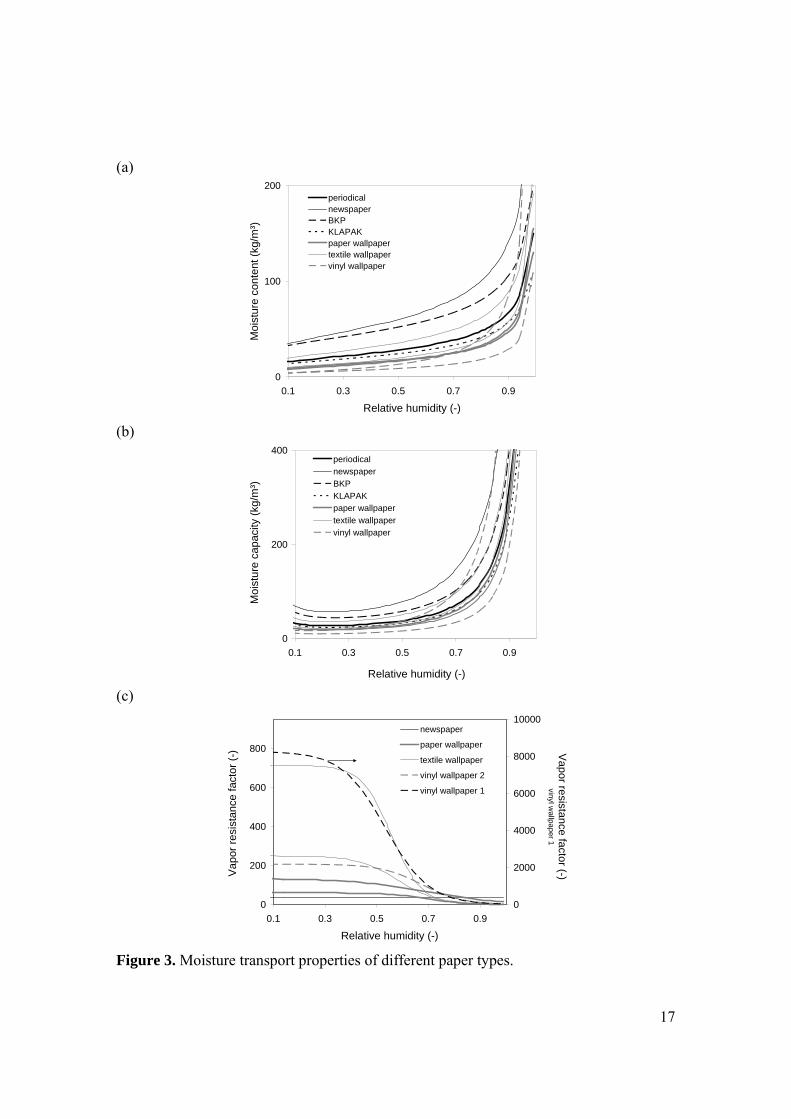
Tables 1 and 2 give the fitted parameters for the different types of papers Figure 3(a) gives the adsorption isotherms w(h) Different paper types show different ranges of moisture content but the shape of the curves is rather similar Figure 3(b) gives the moisture capacity hw The variation between the different types of paper is rather low At low relative humidity (lt 60 RH) the moisture capacity is almost constant The moisture capacity increases quickly above 60 RH Figure 3(c) gives the vapor resistance factor for different types of paper The dry water vapor resistance factor microdry differs a lot for the different types of paper microdry varies from 50 for regular wallpaper to more than 8000 for a vinyl paper Even between different types of vinyl paper microdry varies a lot (from 200 to 8000) For all paper types the water vapor resistance factor decreases at higher relative humidity and differences between different types become less important
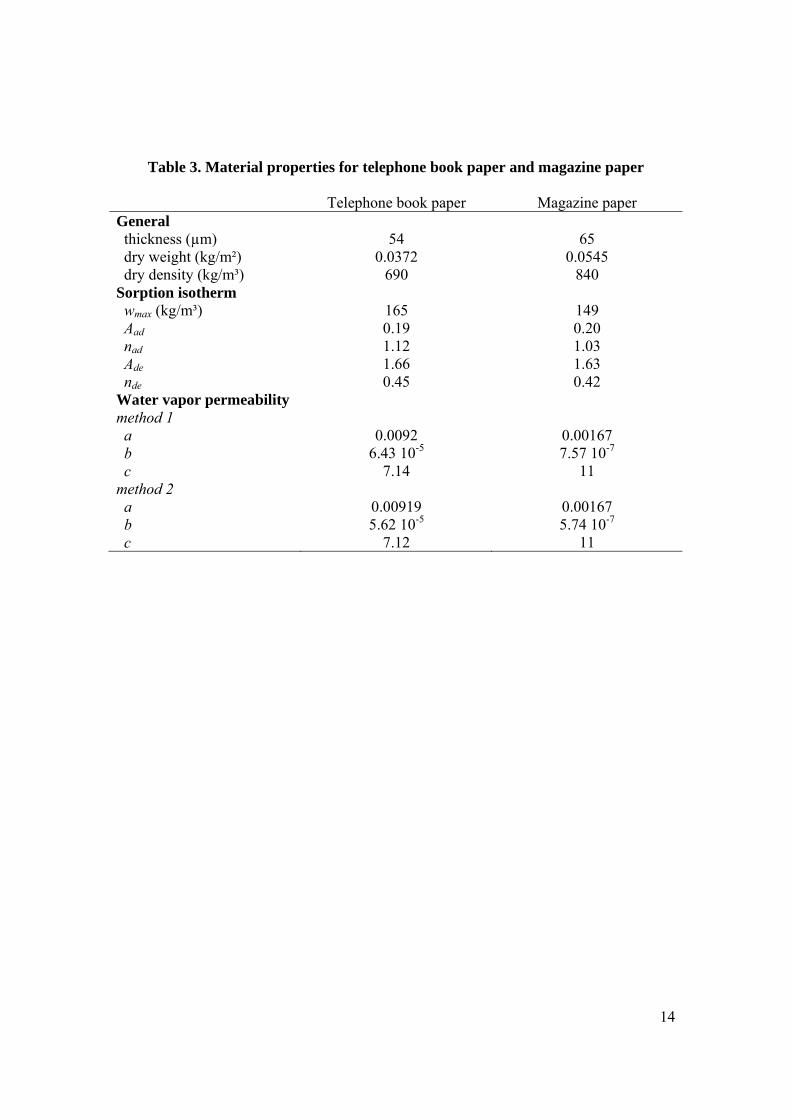
Material property measurements Two materials are measured a newsprint type paper referred to as telephone book (TB) paper and a magazine type paper (slightly glossy) referred to as magazine (M) paper The dry density was determined measuring the dry weight and the thickness of a paper sheet The thickness was determined using a micro-meter and also from SEM images The data are summarized in Table 3
4
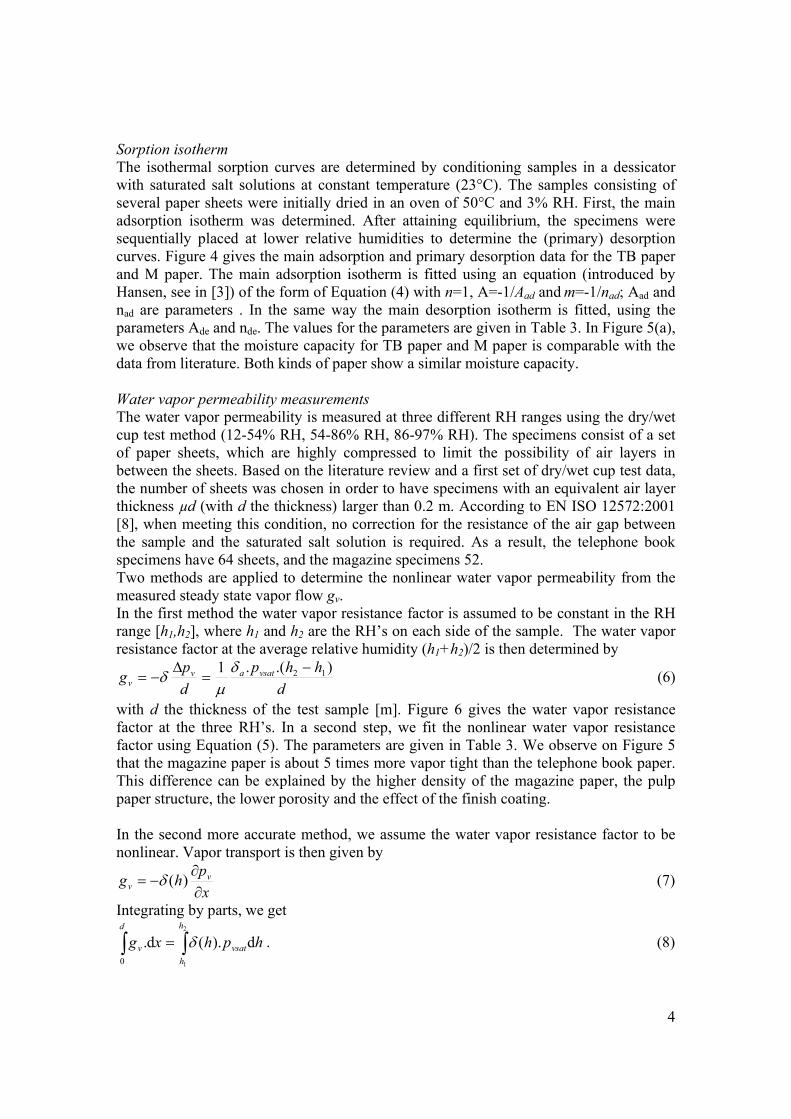
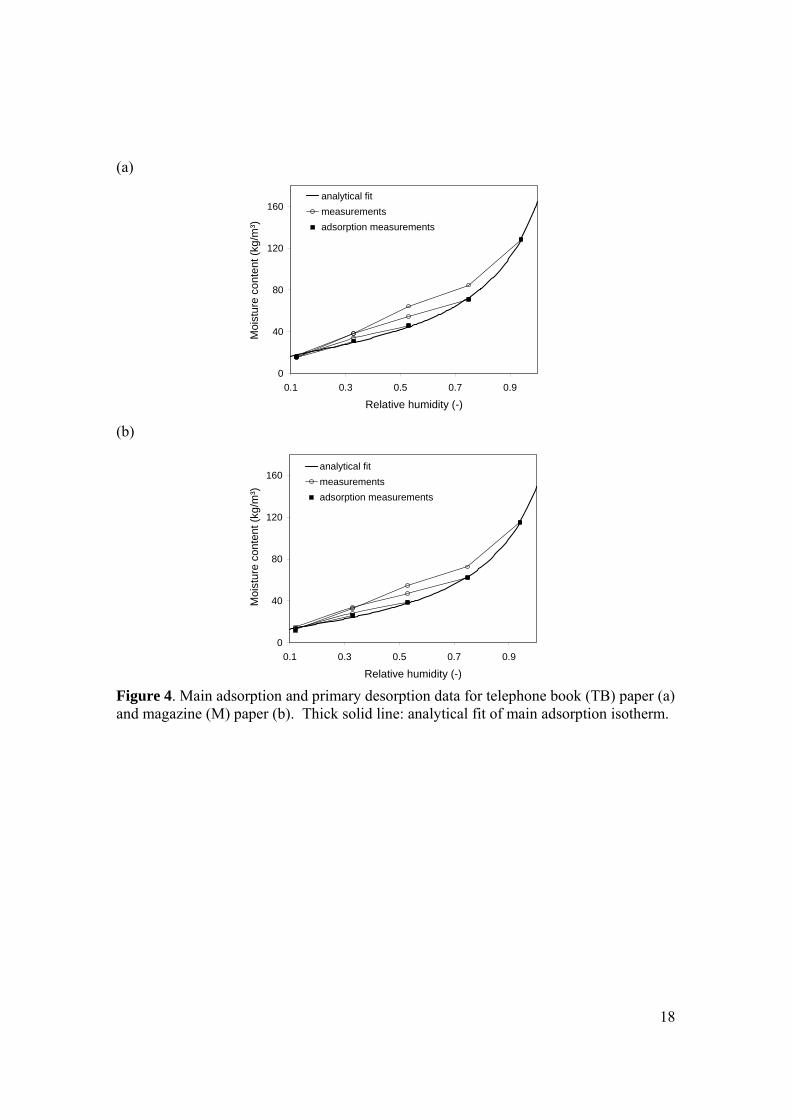
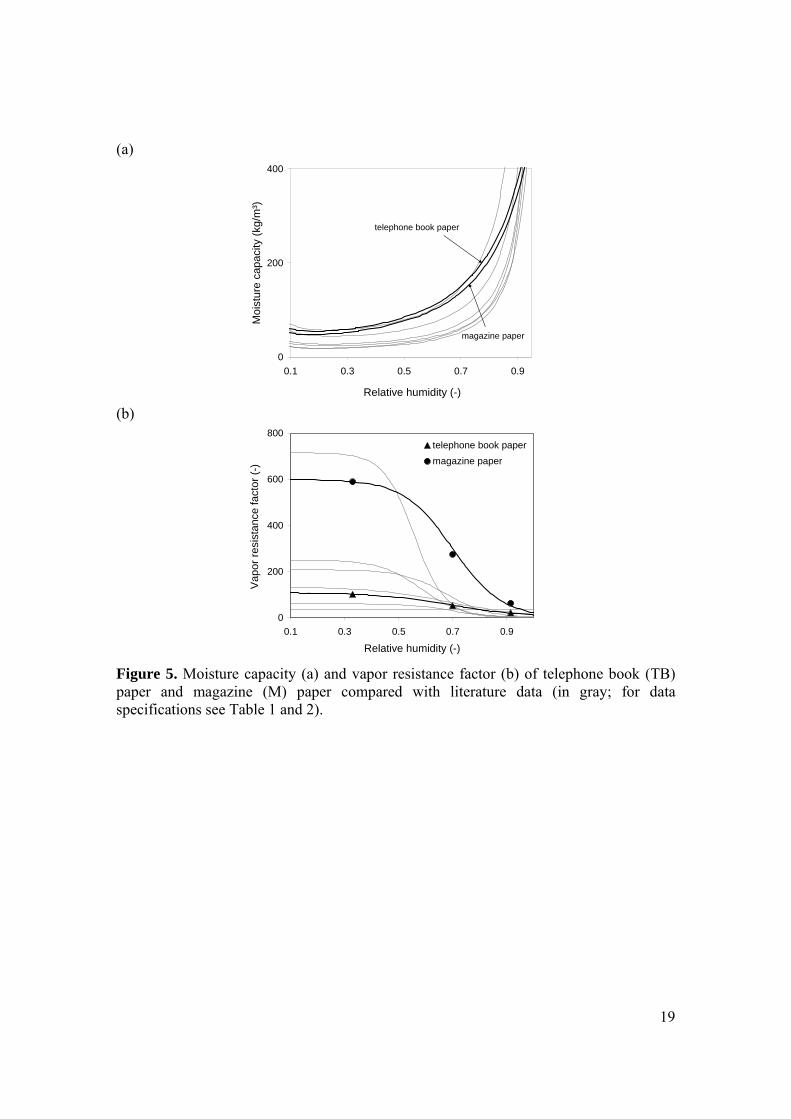
Sorption isotherm The isothermal sorption curves are determined by conditioning samples in a dessicator with saturated salt solutions at constant temperature (23degC) The samples consisting of several paper sheets were initially dried in an oven of 50degC and 3 RH First the main adsorption isotherm was determined After attaining equilibrium the specimens were sequentially placed at lower relative humidities to determine the (primary) desorption curves Figure 4 gives the main adsorption and primary desorption data for the TB paper and M paper The main adsorption isotherm is fitted using an equation (introduced by Hansen see in [3]) of the form of Equation (4) with n=1 A=-1Aad and m=-1nad Aad and nad are parameters In the same way the main desorption isotherm is fitted using the parameters Ade and nde The values for the parameters are given in Table 3 In Figure 5(a) we observe that the moisture capacity for TB paper and M paper is comparable with the data from literature Both kinds of paper show a similar moisture capacity Water vapor permeability measurements The water vapor permeability is measured at three different RH ranges using the drywet cup test method (12-54 RH 54-86 RH 86-97 RH) The specimens consist of a set of paper sheets which are highly compressed to limit the possibility of air layers in between the sheets Based on the literature review and a first set of drywet cup test data the number of sheets was chosen in order to have specimens with an equivalent air layer thickness microd (with d the thickness) larger than 02 m According to EN ISO 125722001 [8] when meeting this condition no correction for the resistance of the air gap between the sample and the saturated salt solution is required As a result the telephone book specimens have 64 sheets and the magazine specimens 52 Two methods are applied to determine the nonlinear water vapor permeability from the measured steady state vapor flow gv In the first method the water vapor resistance factor is assumed to be constant in the RH range [h1h2] where h1 and h2 are the RHrsquos on each side of the sample The water vapor resistance factor at the average relative humidity (h1+h2)2 is then determined by
d
hhp
d
pg vsatav
v
)(1 12
(6)
with d the thickness of the test sample [m] Figure 6 gives the water vapor resistance factor at the three RHrsquos In a second step we fit the nonlinear water vapor resistance factor using Equation (5) The parameters are given in Table 3 We observe on Figure 5 that the magazine paper is about 5 times more vapor tight than the telephone book paper This difference can be explained by the higher density of the magazine paper the pulp paper structure the lower porosity and the effect of the finish coating In the second more accurate method we assume the water vapor resistance factor to be nonlinear Vapor transport is then given by
x
phg v
v
)( (7)
Integrating by parts we get
d h
h
vsatv hphxg0
2
1
d)(d (8)
5
Knowing that in steady state gv is constant and using Equation (5) for the nonlinear water vapor permeability we get after integration
12
12chch
avsatv eec
bhhapdg (9)
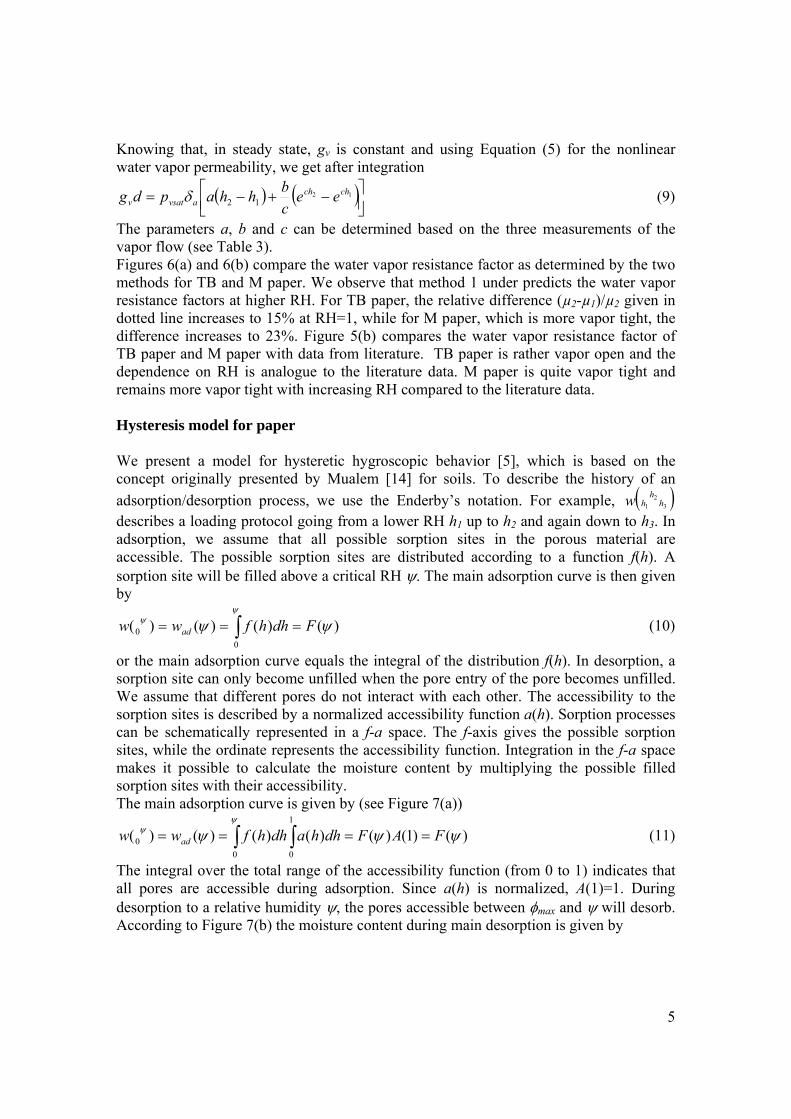
The parameters a b and c can be determined based on the three measurements of the vapor flow (see Table 3) Figures 6(a) and 6(b) compare the water vapor resistance factor as determined by the two methods for TB and M paper We observe that method 1 under predicts the water vapor resistance factors at higher RH For TB paper the relative difference (micro2-micro1)micro2 given in dotted line increases to 15 at RH=1 while for M paper which is more vapor tight the difference increases to 23 Figure 5(b) compares the water vapor resistance factor of TB paper and M paper with data from literature TB paper is rather vapor open and the dependence on RH is analogue to the literature data M paper is quite vapor tight and remains more vapor tight with increasing RH compared to the literature data Hysteresis model for paper We present a model for hysteretic hygroscopic behavior [5] which is based on the concept originally presented by Mualem [14] for soils To describe the history of an
adsorptiondesorption process we use the Enderbyrsquos notation For example 32
1 hh
hw describes a loading protocol going from a lower RH h1 up to h2 and again down to h3 In adsorption we assume that all possible sorption sites in the porous material are accessible The possible sorption sites are distributed according to a function f(h) A sorption site will be filled above a critical RH The main adsorption curve is then given by
)()()()(0
0
Fdhhfww ad (10)
or the main adsorption curve equals the integral of the distribution f(h) In desorption a sorption site can only become unfilled when the pore entry of the pore becomes unfilled We assume that different pores do not interact with each other The accessibility to the sorption sites is described by a normalized accessibility function a(h) Sorption processes can be schematically represented in a f-a space The f-axis gives the possible sorption sites while the ordinate represents the accessibility function Integration in the f-a space makes it possible to calculate the moisture content by multiplying the possible filled sorption sites with their accessibility The main adsorption curve is given by (see Figure 7(a))
)()1()()()()()(0
1
0
0
FAFdhhadhhfww ad (11)
The integral over the total range of the accessibility function (from 0 to 1) indicates that all pores are accessible during adsorption Since a(h) is normalized A(1)=1 During desorption to a relative humidity the pores accessible between max and will desorb According to Figure 7(b) the moisture content during main desorption is given by
6
1
maxmax )())(()(max
dhhawwwww addeh (12)
or
)())(()(
)(1))(()(
max
maxmaxmax
Awww
Awwwww
adad
addeh
(13)
The equation shows that the integral of the accessibility function A() can be determined from the main adsorption and main desorption curve or
)(
)()()(
max
ad
adde
ww
wwA
(14)
The process of primary desorption (desorption from the main adsorption curve) is given in Figure 7(c) Integration in the f-a space gives
)())()(()( 101 Awhwww adadad
h (15)
The process of primary adsorption (adsorption from the main desorption curve) is given in Figure 7(d) Integration in the f-a space gives
)())(()( 1max0 1max hAwwww adadh
h (16)
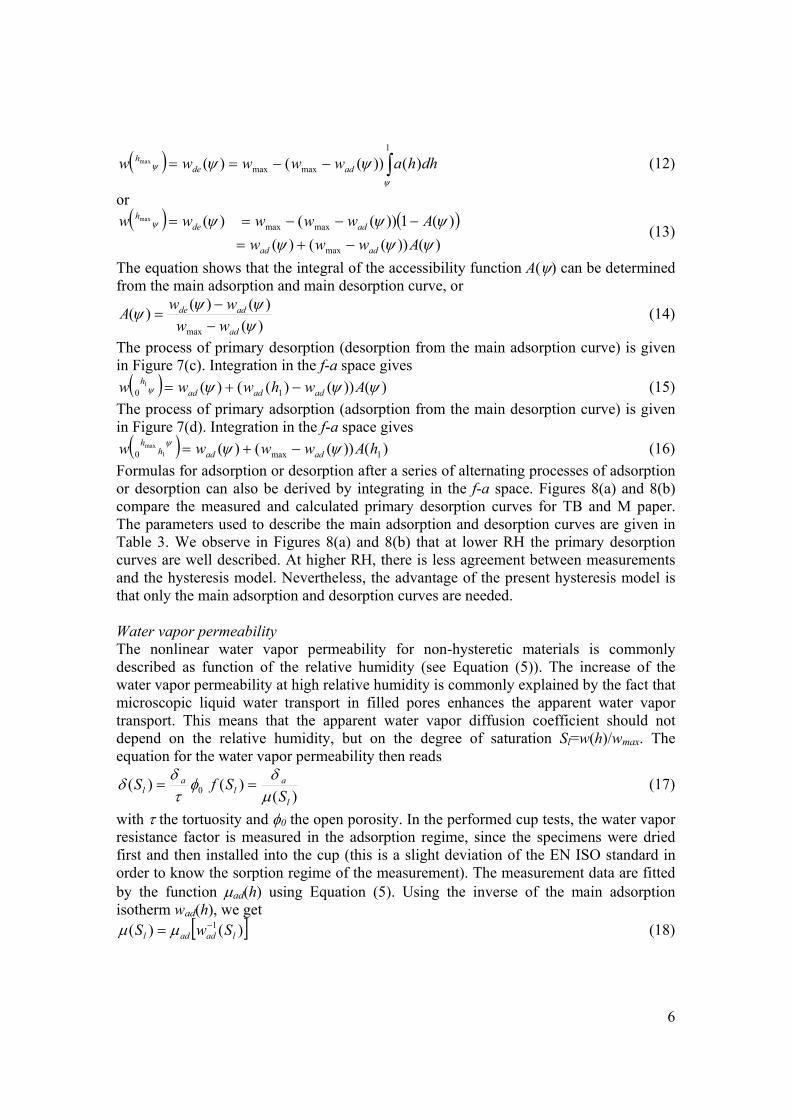
Formulas for adsorption or desorption after a series of alternating processes of adsorption or desorption can also be derived by integrating in the f-a space Figures 8(a) and 8(b) compare the measured and calculated primary desorption curves for TB and M paper The parameters used to describe the main adsorption and desorption curves are given in Table 3 We observe in Figures 8(a) and 8(b) that at lower RH the primary desorption curves are well described At higher RH there is less agreement between measurements and the hysteresis model Nevertheless the advantage of the present hysteresis model is that only the main adsorption and desorption curves are needed Water vapor permeability The nonlinear water vapor permeability for non-hysteretic materials is commonly described as function of the relative humidity (see Equation (5)) The increase of the water vapor permeability at high relative humidity is commonly explained by the fact that microscopic liquid water transport in filled pores enhances the apparent water vapor transport This means that the apparent water vapor diffusion coefficient should not depend on the relative humidity but on the degree of saturation Sl=w(h)wmax The equation for the water vapor permeability then reads
)()()( 0
l
al
al S
SfS
(17)
with the tortuosity and 0 the open porosity In the performed cup tests the water vapor resistance factor is measured in the adsorption regime since the specimens were dried first and then installed into the cup (this is a slight deviation of the EN ISO standard in order to know the sorption regime of the measurement) The measurement data are fitted by the function ad(h) using Equation (5) Using the inverse of the main adsorption isotherm wad(h) we get
)()( 1ladadl SwS (18)
7
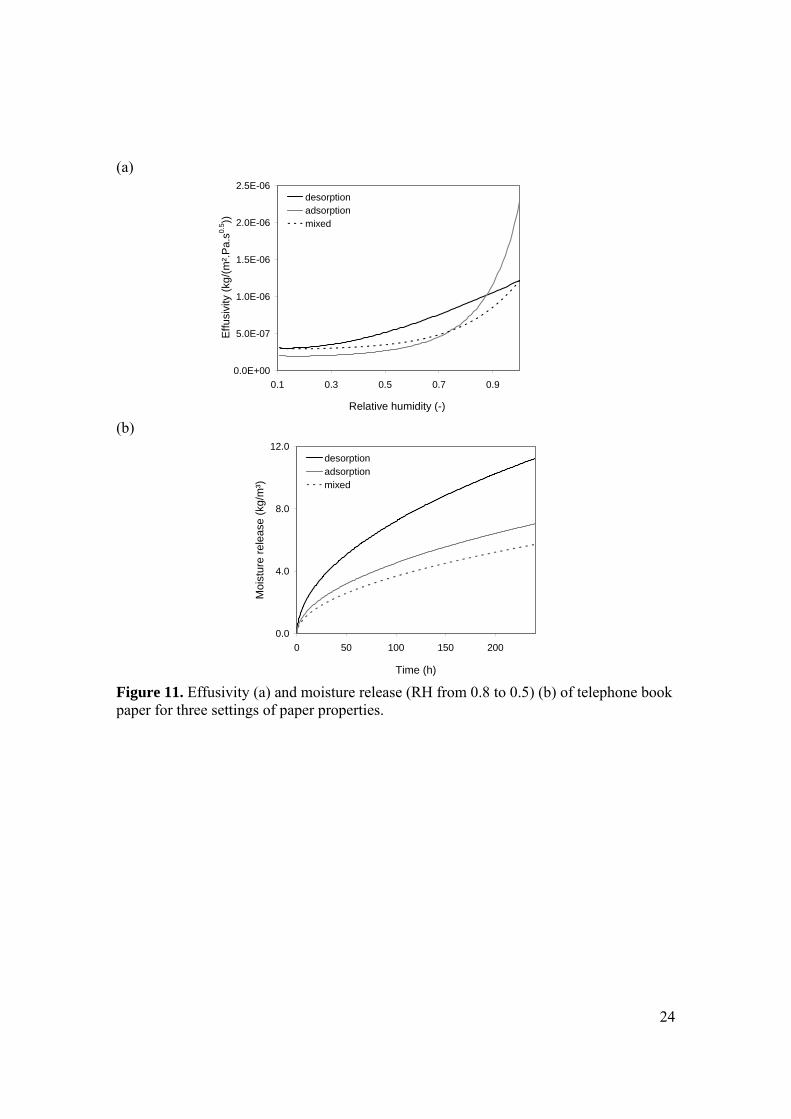
As example we analyze the material response during a RH loading protocol as given in Figure (9) The material is TB paper In figures 10(a)-(d) the hysteretic loops as well as the main adsorption and desorption curves are given for respectively the sorption isotherm (a) the water vapor resistance factor (b) the moisture capacity (c) and effusivity (d) We observe that after the cycling the material behavior evolves to an almost single curve For the sorption isotherm and water vapor resistance factor this curve is an intermediate curve between main adsorption and desorption curve The hysteretic material is thus more vapor open than the material in adsorption but more vapor tight than the material in desorption We observe in Figure 10(c) that the hysteretic material has after cycling a slightly lower moisture capacity than in adsorption but that the moisture capacity is much lower than in desorption In Figure 10(d) we see that with cyclic loading the effusivity comes close to the adsorption effusivity This is logical since hysteresis leads to two opposite effects the material becomes more vapor open than in the adsorption state but has less moisture capacity than in adsorption which means the effusivity might not change so much When we simulate the main desorption process desorption transport properties should be chosen We analyze what the influence is on the results when adsorption properties are used instead of desorption properties We distinguish three cases (1) desorption transport properties which is the reference case (2) adsorption transport properties (adsorption case) (3) desorption moisture capacity but adsorption water vapor resistance factor (mixed case) Figure 11(a) gives the effusivity for the three cases We observe that the mixed case under predicts the desorption effusivity With adsorption properties the effusivity is over predicted at high RH and under predicted at lower RH As example we simulate the desorption process for a step change from 08 to 05 RH The water vapor transport is one dimensional The water vapor surface coefficient = 510-8 sm The moisture transport properties of TB paper are used Figure 11(b) gives the moisture release w=w0-w with w0 the initial moisture content at RH=08 The adsorption and mixed case under predict w since the effusivity is under predicted in the RH range [05 08]
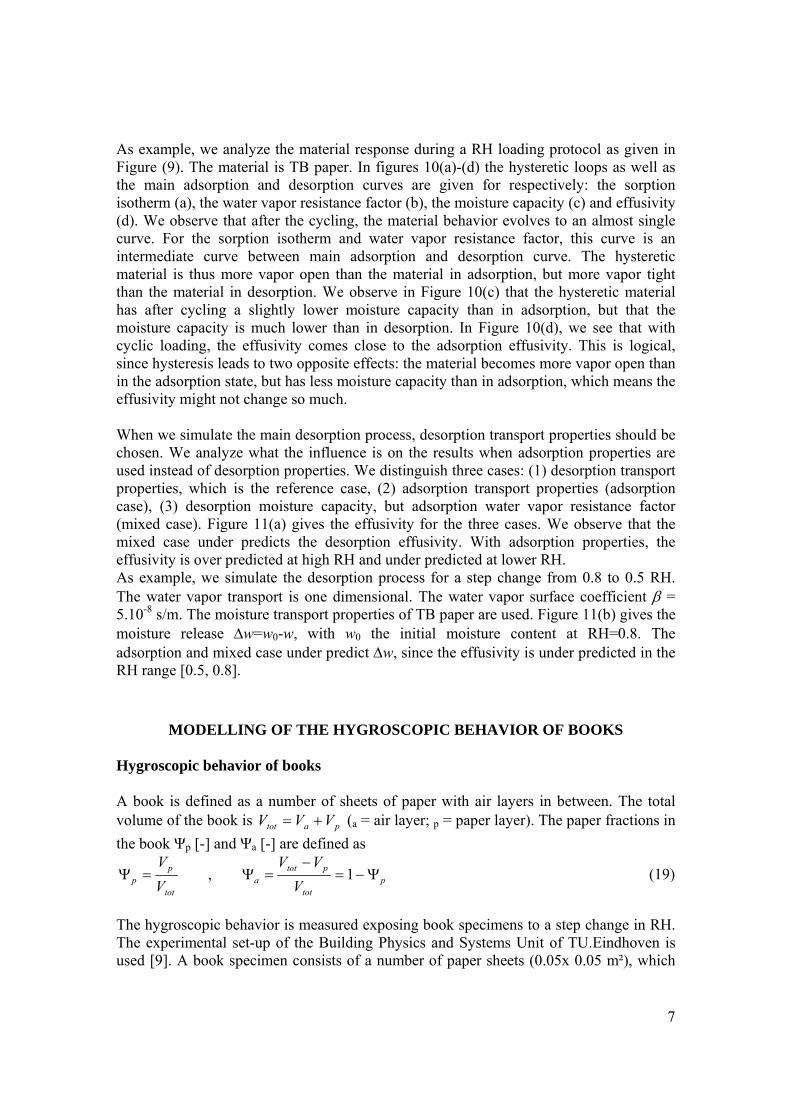
MODELLING OF THE HYGROSCOPIC BEHAVIOR OF BOOKS Hygroscopic behavior of books A book is defined as a number of sheets of paper with air layers in between The total volume of the book is patot VVV (a = air layer p = paper layer) The paper fractions in
the book Ψp [-] and Ψa [-] are defined as
ptot
ptota
tot
pp V
VV
V
V
1 (19)
The hygroscopic behavior is measured exposing book specimens to a step change in RH The experimental set-up of the Building Physics and Systems Unit of TUEindhoven is used [9] A book specimen consists of a number of paper sheets (005x 005 msup2) which
8
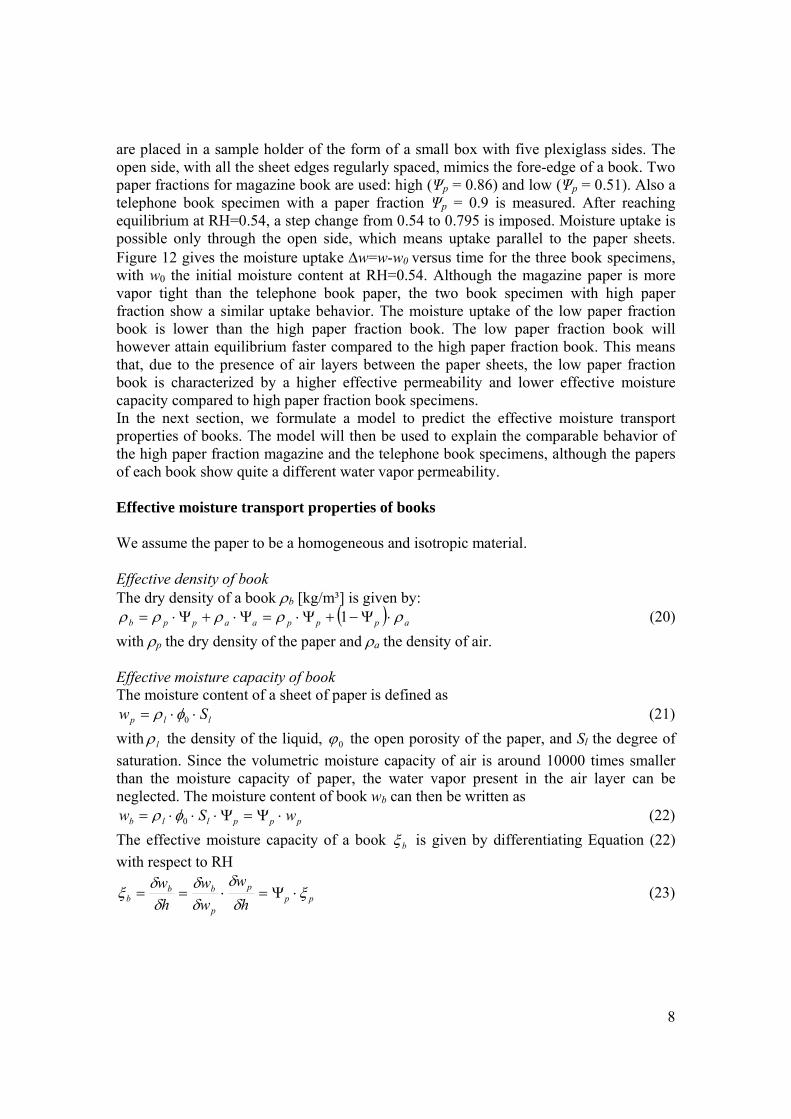
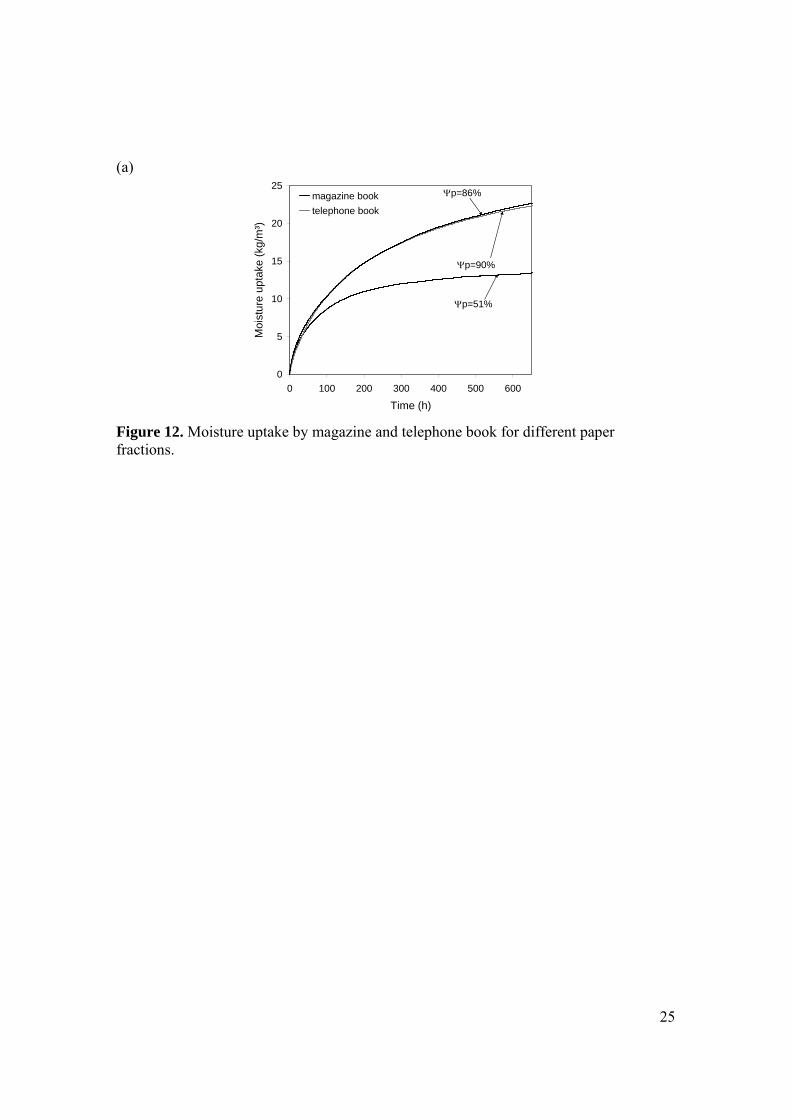
are placed in a sample holder of the form of a small box with five plexiglass sides The open side with all the sheet edges regularly spaced mimics the fore-edge of a book Two paper fractions for magazine book are used high (Ψp = 086) and low (Ψp = 051) Also a telephone book specimen with a paper fraction Ψp = 09 is measured After reaching equilibrium at RH=054 a step change from 054 to 0795 is imposed Moisture uptake is possible only through the open side which means uptake parallel to the paper sheets Figure 12 gives the moisture uptake w=w-w0 versus time for the three book specimens with w0 the initial moisture content at RH=054 Although the magazine paper is more vapor tight than the telephone book paper the two book specimen with high paper fraction show a similar uptake behavior The moisture uptake of the low paper fraction book is lower than the high paper fraction book The low paper fraction book will however attain equilibrium faster compared to the high paper fraction book This means that due to the presence of air layers between the paper sheets the low paper fraction book is characterized by a higher effective permeability and lower effective moisture capacity compared to high paper fraction book specimens In the next section we formulate a model to predict the effective moisture transport properties of books The model will then be used to explain the comparable behavior of the high paper fraction magazine and the telephone book specimens although the papers of each book show quite a different water vapor permeability Effective moisture transport properties of books We assume the paper to be a homogeneous and isotropic material Effective density of book The dry density of a book b [kgmsup3] is given by
apppaappb 1 (20)
with p the dry density of the paper and a the density of air Effective moisture capacity of book The moisture content of a sheet of paper is defined as
llp Sw 0 (21)
with l the density of the liquid 0 the open porosity of the paper and Sl the degree of
saturation Since the volumetric moisture capacity of air is around 10000 times smaller than the moisture capacity of paper the water vapor present in the air layer can be neglected The moisture content of book wb can then be written as
pppllb wSw 0 (22)
The effective moisture capacity of a book b is given by differentiating Equation (22)
with respect to RH
ppp
p
bbb h
w
w
w
h
w
(23)
9
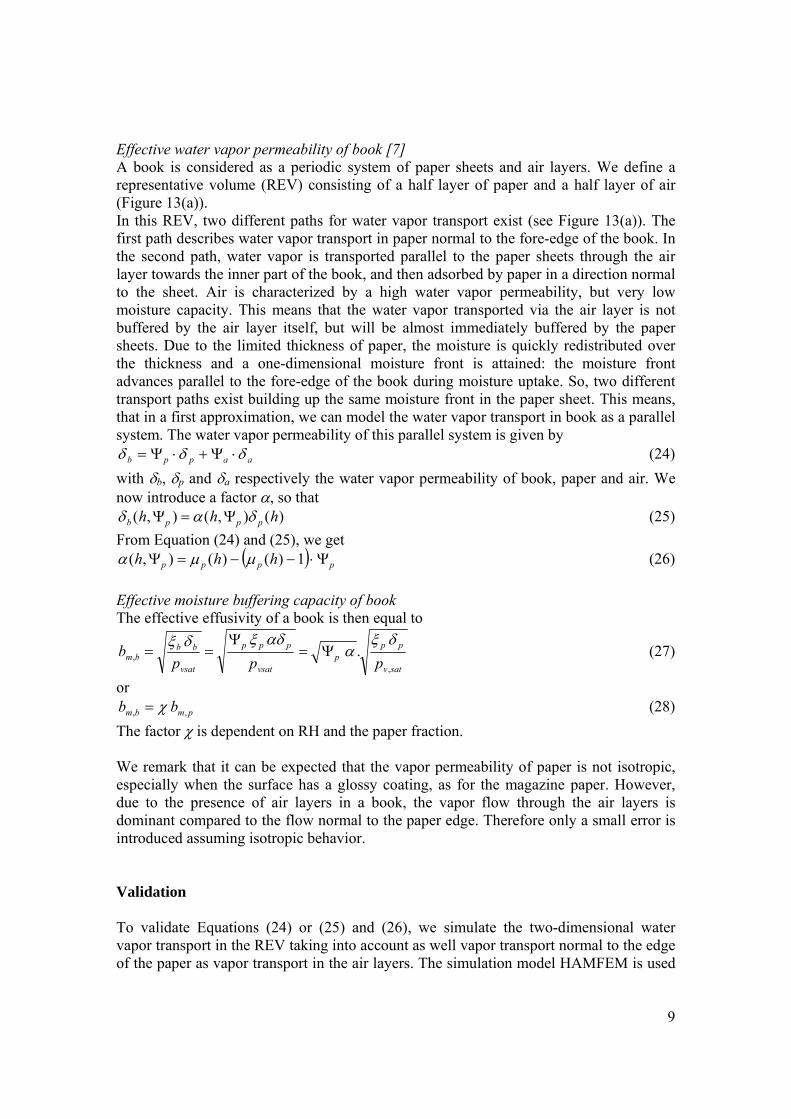
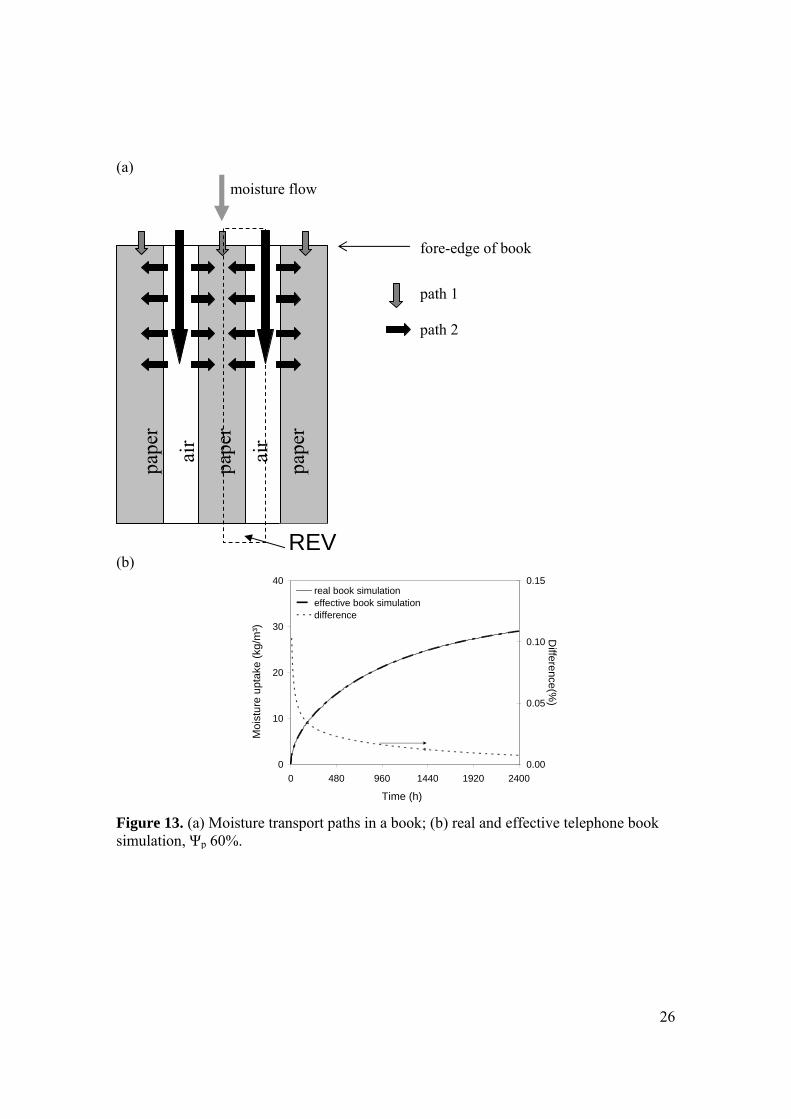
Effective water vapor permeability of book [7] A book is considered as a periodic system of paper sheets and air layers We define a representative volume (REV) consisting of a half layer of paper and a half layer of air (Figure 13(a)) In this REV two different paths for water vapor transport exist (see Figure 13(a)) The first path describes water vapor transport in paper normal to the fore-edge of the book In the second path water vapor is transported parallel to the paper sheets through the air layer towards the inner part of the book and then adsorbed by paper in a direction normal to the sheet Air is characterized by a high water vapor permeability but very low moisture capacity This means that the water vapor transported via the air layer is not buffered by the air layer itself but will be almost immediately buffered by the paper sheets Due to the limited thickness of paper the moisture is quickly redistributed over the thickness and a one-dimensional moisture front is attained the moisture front advances parallel to the fore-edge of the book during moisture uptake So two different transport paths exist building up the same moisture front in the paper sheet This means that in a first approximation we can model the water vapor transport in book as a parallel system The water vapor permeability of this parallel system is given by
aappb (24)
with b p and a respectively the water vapor permeability of book paper and air We now introduce a factor so that
)()()( hhh pppb (25)
From Equation (24) and (25) we get pppp hhh 1)()()( (26)
Effective moisture buffering capacity of book The effective effusivity of a book is then equal to
satv
ppp
vsat
ppp
vsat
bbbm ppp
b
(27)
or
pmbm bb (28)
The factor is dependent on RH and the paper fraction We remark that it can be expected that the vapor permeability of paper is not isotropic especially when the surface has a glossy coating as for the magazine paper However due to the presence of air layers in a book the vapor flow through the air layers is dominant compared to the flow normal to the paper edge Therefore only a small error is introduced assuming isotropic behavior Validation To validate Equations (24) or (25) and (26) we simulate the two-dimensional water vapor transport in the REV taking into account as well vapor transport normal to the edge of the paper as vapor transport in the air layers The simulation model HAMFEM is used
10
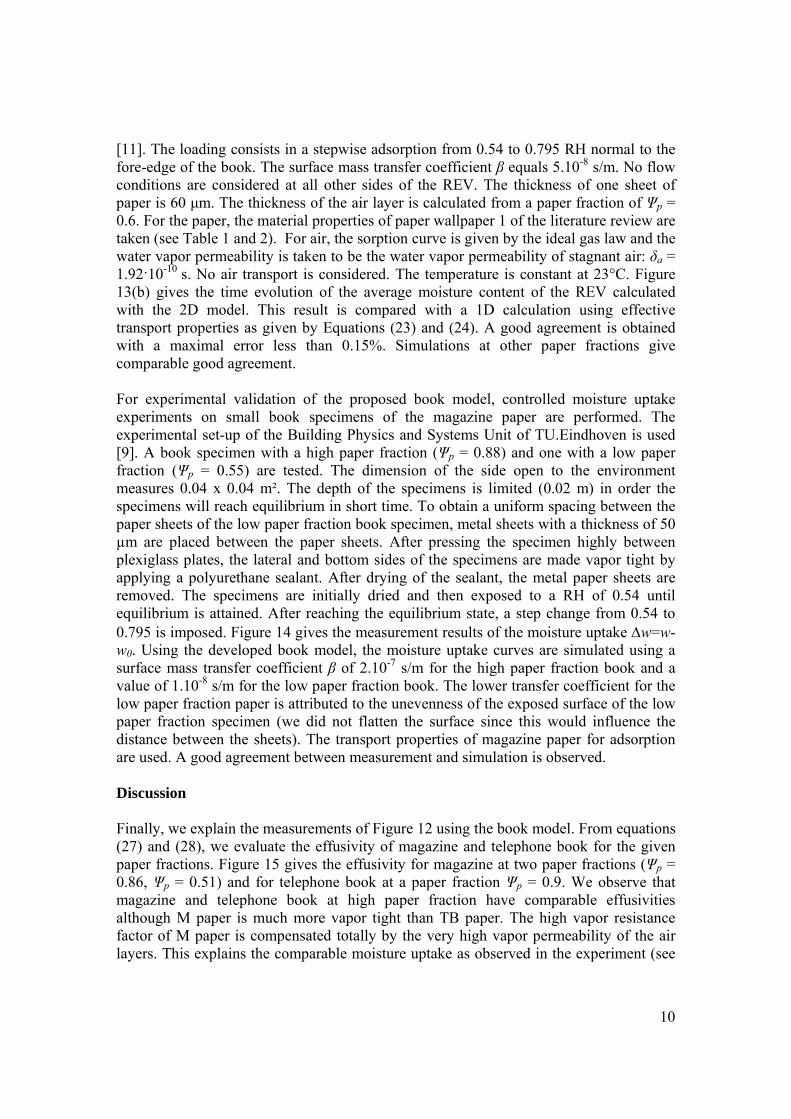
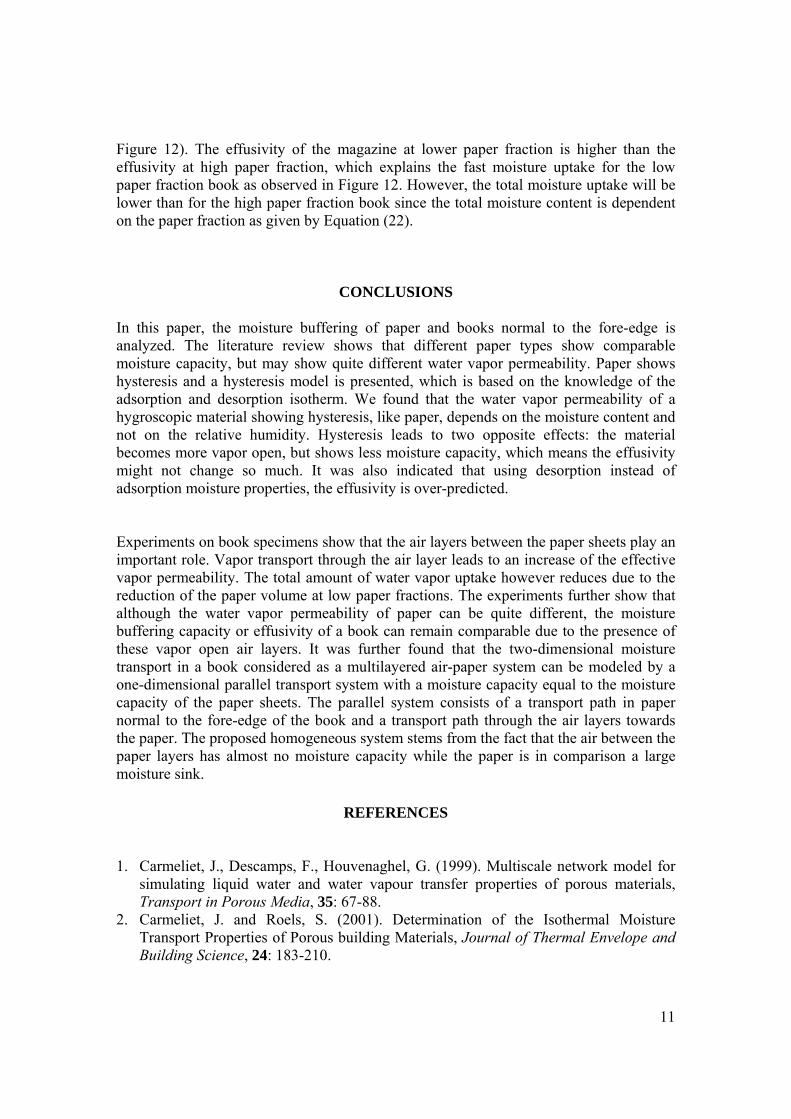
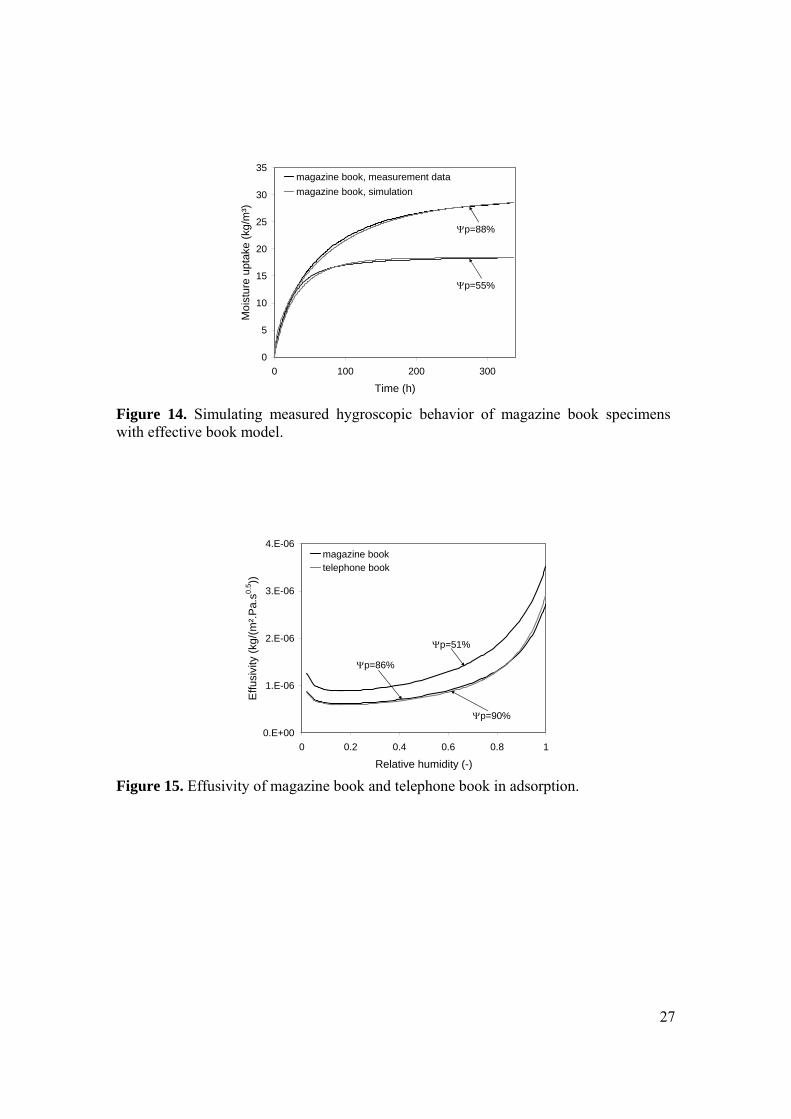
[11] The loading consists in a stepwise adsorption from 054 to 0795 RH normal to the fore-edge of the book The surface mass transfer coefficient β equals 510-8 sm No flow conditions are considered at all other sides of the REV The thickness of one sheet of paper is 60 μm The thickness of the air layer is calculated from a paper fraction of Ψp = 06 For the paper the material properties of paper wallpaper 1 of the literature review are taken (see Table 1 and 2) For air the sorption curve is given by the ideal gas law and the water vapor permeability is taken to be the water vapor permeability of stagnant air δa = 19210-10 s No air transport is considered The temperature is constant at 23degC Figure 13(b) gives the time evolution of the average moisture content of the REV calculated with the 2D model This result is compared with a 1D calculation using effective transport properties as given by Equations (23) and (24) A good agreement is obtained with a maximal error less than 015 Simulations at other paper fractions give comparable good agreement For experimental validation of the proposed book model controlled moisture uptake experiments on small book specimens of the magazine paper are performed The experimental set-up of the Building Physics and Systems Unit of TUEindhoven is used [9] A book specimen with a high paper fraction (Ψp = 088) and one with a low paper fraction (Ψp = 055) are tested The dimension of the side open to the environment measures 004 x 004 msup2 The depth of the specimens is limited (002 m) in order the specimens will reach equilibrium in short time To obtain a uniform spacing between the paper sheets of the low paper fraction book specimen metal sheets with a thickness of 50 microm are placed between the paper sheets After pressing the specimen highly between plexiglass plates the lateral and bottom sides of the specimens are made vapor tight by applying a polyurethane sealant After drying of the sealant the metal paper sheets are removed The specimens are initially dried and then exposed to a RH of 054 until equilibrium is attained After reaching the equilibrium state a step change from 054 to 0795 is imposed Figure 14 gives the measurement results of the moisture uptake w=w-w0 Using the developed book model the moisture uptake curves are simulated using a surface mass transfer coefficient β of 210-7 sm for the high paper fraction book and a value of 110-8 sm for the low paper fraction book The lower transfer coefficient for the low paper fraction paper is attributed to the unevenness of the exposed surface of the low paper fraction specimen (we did not flatten the surface since this would influence the distance between the sheets) The transport properties of magazine paper for adsorption are used A good agreement between measurement and simulation is observed Discussion Finally we explain the measurements of Figure 12 using the book model From equations (27) and (28) we evaluate the effusivity of magazine and telephone book for the given paper fractions Figure 15 gives the effusivity for magazine at two paper fractions (Ψp = 086 Ψp = 051) and for telephone book at a paper fraction Ψp = 09 We observe that magazine and telephone book at high paper fraction have comparable effusivities although M paper is much more vapor tight than TB paper The high vapor resistance factor of M paper is compensated totally by the very high vapor permeability of the air layers This explains the comparable moisture uptake as observed in the experiment (see
11
Figure 12) The effusivity of the magazine at lower paper fraction is higher than the effusivity at high paper fraction which explains the fast moisture uptake for the low paper fraction book as observed in Figure 12 However the total moisture uptake will be lower than for the high paper fraction book since the total moisture content is dependent on the paper fraction as given by Equation (22)
CONCLUSIONS In this paper the moisture buffering of paper and books normal to the fore-edge is analyzed The literature review shows that different paper types show comparable moisture capacity but may show quite different water vapor permeability Paper shows hysteresis and a hysteresis model is presented which is based on the knowledge of the adsorption and desorption isotherm We found that the water vapor permeability of a hygroscopic material showing hysteresis like paper depends on the moisture content and not on the relative humidity Hysteresis leads to two opposite effects the material becomes more vapor open but shows less moisture capacity which means the effusivity might not change so much It was also indicated that using desorption instead of adsorption moisture properties the effusivity is over-predicted Experiments on book specimens show that the air layers between the paper sheets play an important role Vapor transport through the air layer leads to an increase of the effective vapor permeability The total amount of water vapor uptake however reduces due to the reduction of the paper volume at low paper fractions The experiments further show that although the water vapor permeability of paper can be quite different the moisture buffering capacity or effusivity of a book can remain comparable due to the presence of these vapor open air layers It was further found that the two-dimensional moisture transport in a book considered as a multilayered air-paper system can be modeled by a one-dimensional parallel transport system with a moisture capacity equal to the moisture capacity of the paper sheets The parallel system consists of a transport path in paper normal to the fore-edge of the book and a transport path through the air layers towards the paper The proposed homogeneous system stems from the fact that the air between the paper layers has almost no moisture capacity while the paper is in comparison a large moisture sink
REFERENCES 1 Carmeliet J Descamps F Houvenaghel G (1999) Multiscale network model for
simulating liquid water and water vapour transfer properties of porous materials Transport in Porous Media 35 67-88
2 Carmeliet J and Roels S (2001) Determination of the Isothermal Moisture Transport Properties of Porous building Materials Journal of Thermal Envelope and Building Science 24 183-210
12
3 Carmeliet J and Roels S (2002) Determination of the moisture capacity of porous building materials Journal of Thermal Envelope and Building Science 25(3) 209-237
4 Carmeliet J Hens H Roels S Adan O Brocken H Cerny R Pavlik Z Hall C Kumaran K Pel L (2004) Determination of the Liquid Water Diffusivity from Transient Moisture Transfer Experiments Journal of Thermal Envelope and Building Science 27(4) 277-305
5 Carmeliet J de Wit M and Janssen H (2005) Hysteresis and moisture buffering of wood Symposium of Building Physics in the Nordic Countries June 13-15 2005 Reykjavik Iceland pp55-62
6 Chatterjee SG (2001) Comparison of Domain and Similarity Models for Characterizing Moisture Sorption Equilibria of Paper Industrial and Engineering Chemical Research 40 188-194
7 Derluyn H (2006) Role of textiles and paper for stabilizing the indoor environment MScthesis Katholieke Universiteit Leuven Leuven Belgium (httpwwwkuleuvenbebwfengteaching_msctheses)
8 EN ISO 12572 (2001) Hygrothermal performance of building materials and products ndash Determination of water vapour transmission properties
9 Goossens E (2003) Moisture transfer properties of coated gypsum PhD-thesis TUe Eindhoven The Netherlands
10 Gupta H Chatterjee SG (2003) Parallel Diffusion of Moisture in Paper Part 1 Steady-State Conditions Industrial and Engineering Chemical Research 42 6582-6592
11 Janssen H Carmeliet J Hens H (2004) The influence of soil moisture transfer on building heat loss via the ground Buildings and Environment 39(7) 825-836
12 Kumaran K (1996) International Energy Agency Condensation and energy ndash Catalogue of material properties Report Annex 24 Volume 3 Energy conservation in buildings
13 Motta Lima OC Monteiro AS Pereira NC Mendes ES (2003) Moisture Equilibrium Isotherms for a Commercial Liquid Package Paper Drying Technology 21(10) 1909-1922
14 Mualem Y (1974) A conceptual model of hysteresis Water Resources research 10(3) 514-520
15 Ramarao BV Massoquete A Lavrykov S and Ramaswamy S (2003) Moisture Diffusion Inside Paper Materials in the Hygroscopic Range and Characteristics of Diffusivity Parameters Drying Technology 21(10) 2007-2056
16 Roels S Carmeliet J Hens H Adan O Brocken H Cerny R Pavlik Z Ellis AT Hall C Kumaran K Pel L Plagge R (2004) A comparison of Different Techniques to Quantify Moisture Content Profiles in Porous Building Materials Journal of Thermal Envelope and Building Science 27(4) 261-276
17 Roels S Carmeliet J Hens H Adan O Brocken H Cerny R Pavlik Z Hall C Kumaran K Pel L Plagge R (2004) Interlaboratory Comparison of Hygric Properties of Porous Building Materials Journal of Thermal Envelope and Building Science 27(4) 307-325
13
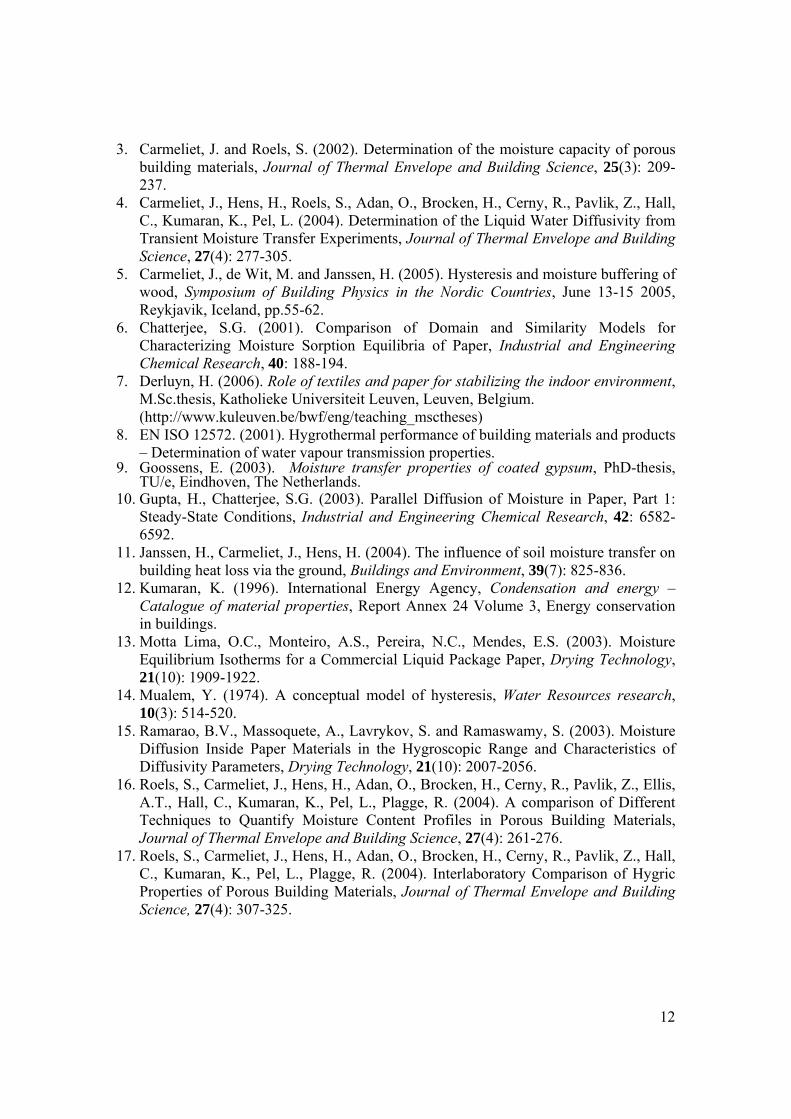
Table 1 Parameters for adsorption isotherms for different types of paper
Figure 3 Moisture transport properties of different paper types
18
(a)
0
40
80
120
160
01 03 05 07 09
Relative humidity (-)
Moi
stur
e co
nten
t (kg
msup3)
analytical fit
measurements
adsorption measurements
(b)
0
40
80
120
160
01 03 05 07 09
Relative humidity (-)
Moi
stur
e co
nten
t (kg
msup3)
analytical fit
measurements
adsorption measurements
Figure 4 Main adsorption and primary desorption data for telephone book (TB) paper (a) and magazine (M) paper (b) Thick solid line analytical fit of main adsorption isotherm
19
(a)
0
200
400
01 03 05 07 09
Relative humidity (-)
Mo
istu
re c
apac
ity (
kgm
sup3)
telephone book paper
magazine paper
(b)
0
200
400
600
800
01 03 05 07 09
Relative humidity (-)
Vap
or r
esis
tanc
e fa
cto
r (-
)
telephone book paper
magazine paper
Figure 5 Moisture capacity (a) and vapor resistance factor (b) of telephone book (TB) paper and magazine (M) paper compared with literature data (in gray for data specifications see Table 1 and 2)
20
(a)
0
20
40
60
80
100
120
01 03 05 07 09
Relative humidity (-)
Vap
or
resi
sta
nce
fact
or
(-)
0
10
20
30
40
50
Difference (
)method 1
method 2
difference
(b)
0
100
200
300
400
500
600
700
01 03 05 07 09
Relative humidity (-)
Vap
or r
esis
tanc
e fa
ctor
(-)
0
10
20
30
40
50
Difference (
)
method 1
method 2
difference
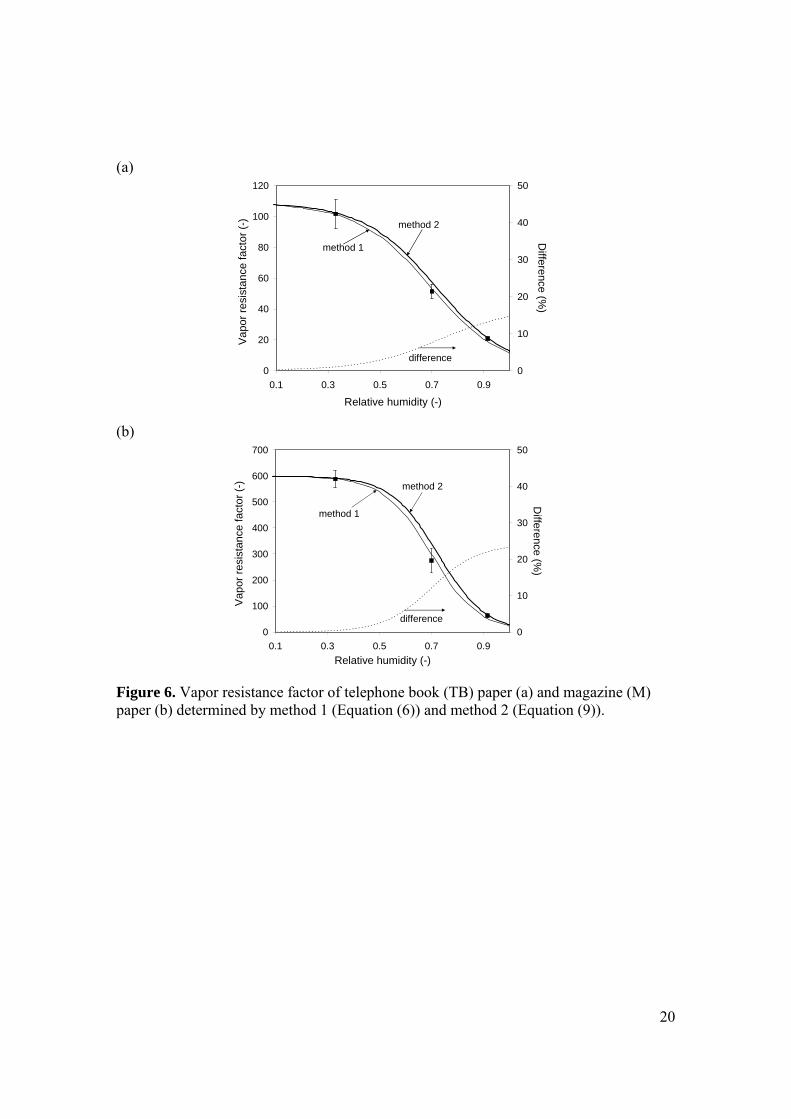
Figure 6 Vapor resistance factor of telephone book (TB) paper (a) and magazine (M) paper (b) determined by method 1 (Equation (6)) and method 2 (Equation (9))
21
(a)
0 10
1 a
f
main adsorption
(b) main desorption
0 10
1 a
f
(c)
0 10
1 a
f
primary desorption
1
(d)
0 10
1 a
f
primary adsorption
1
1
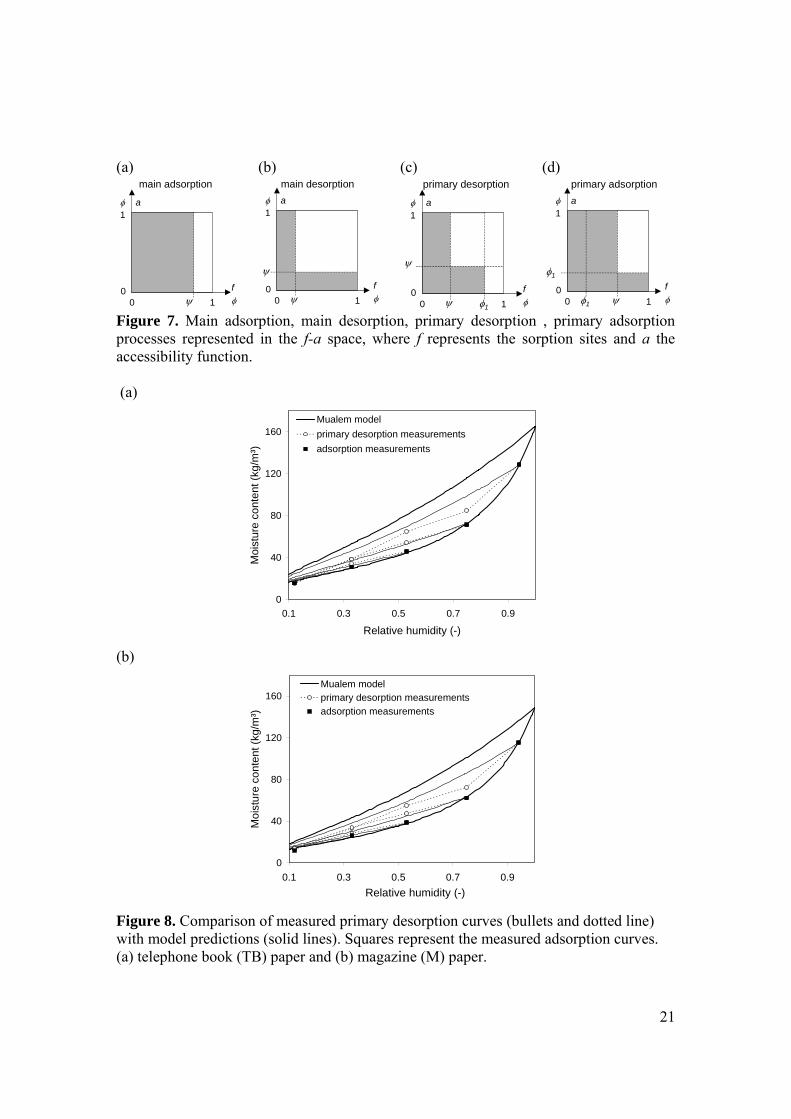
Figure 7 Main adsorption main desorption primary desorption primary adsorption processes represented in the f-a space where f represents the sorption sites and a the accessibility function (a)
0
40
80
120
160
01 03 05 07 09
Relative humidity (-)
Moi
stur
e co
nten
t (kg
msup3)
Mualem model
primary desorption measurements
adsorption measurements
(b)
0
40
80
120
160
01 03 05 07 09
Relative humidity (-)
Mo
istu
re c
on
ten
t (kg
msup3)
Mualem modelprimary desorption measurements
adsorption measurements
Figure 8 Comparison of measured primary desorption curves (bullets and dotted line) with model predictions (solid lines) Squares represent the measured adsorption curves (a) telephone book (TB) paper and (b) magazine (M) paper
22
0
02
04
06
08
1
Loading protocol
Rel
ativ
e h
umid
ity (
-)
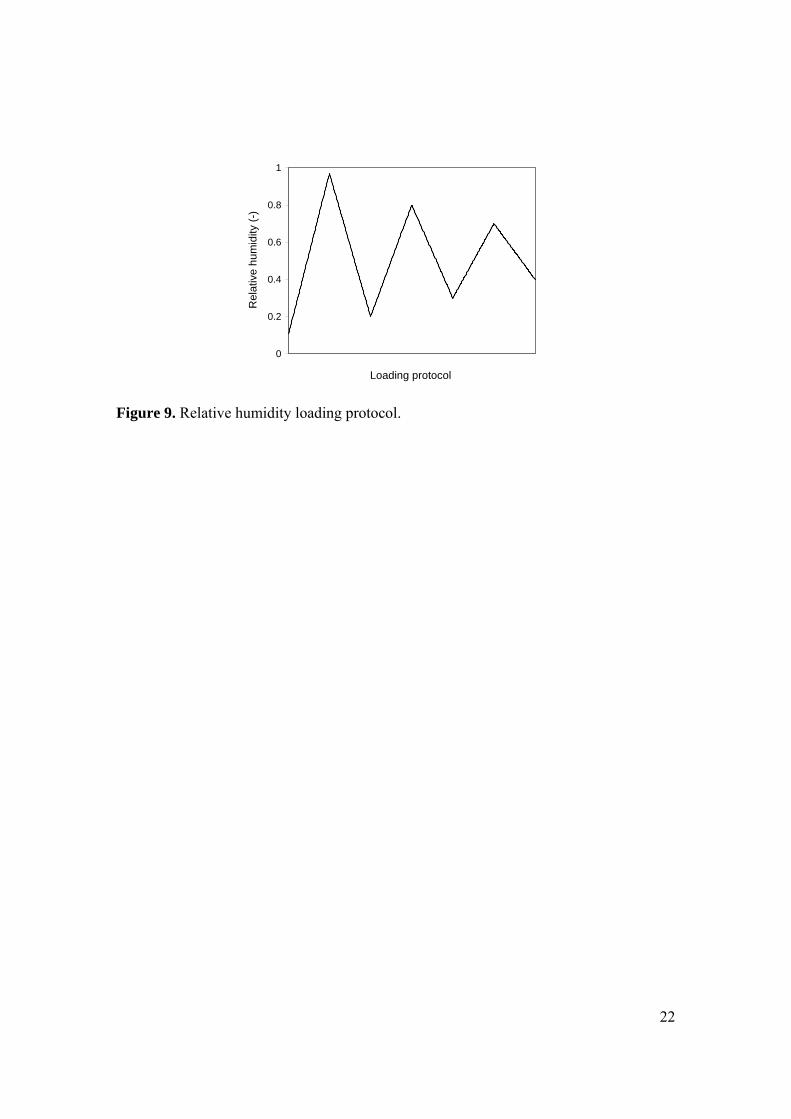
Figure 9 Relative humidity loading protocol
23
(a)
0
40
80
120
160
0 02 04 06 08 1
Relative humidity (-)
Moi
stur
e c
onte
nt (
kgm
sup3)
hysteresis
desorption
adsorption
(b)
0
20
40
60
80
100
120
0 02 04 06 08 1
Relative humidity (-)
Wa
ter
vap
or
resi
sta
nce
fact
or
(-) hysteresis
desorption
adsorption
(c)
0
200
400
600
0 02 04 06 08 1
Relative humidity (-)
Moi
stur
e ca
paci
ty (
kgm
sup3)
hysteresis
adsorption
desorption
(d)
00E+00
50E-07
10E-06
15E-06
20E-06
0 02 04 06 08 1
Relative humidity (-)
Effu
sivi
ty (
kg(
msup2
Pa
s05 ))
hysteresis
desorption
adsorption
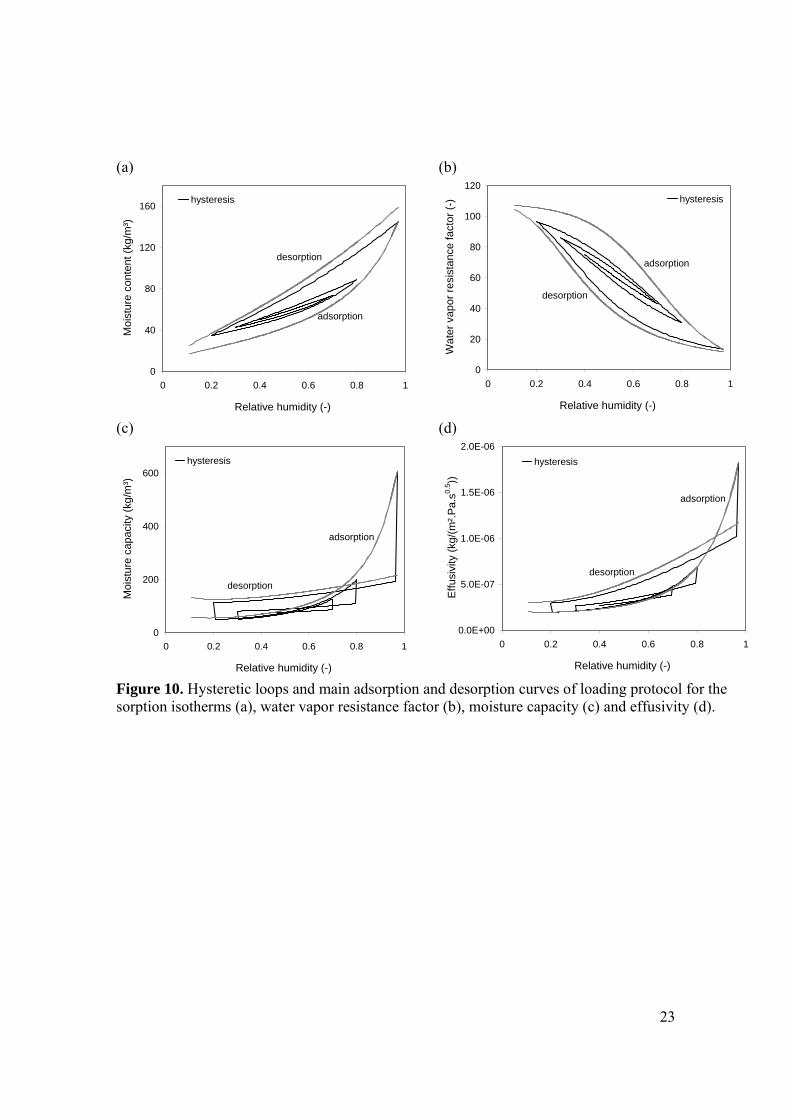
Figure 10 Hysteretic loops and main adsorption and desorption curves of loading protocol for the sorption isotherms (a) water vapor resistance factor (b) moisture capacity (c) and effusivity (d)
24
(a)
00E+00
50E-07
10E-06
15E-06
20E-06
25E-06
01 03 05 07 09
Relative humidity (-)
Effu
sivi
ty (
kg(
msup2
Pa
s0
5 ))
desorptionadsorptionmixed
(b)
00
40
80
120
0 50 100 150 200
Time (h)
Moi
stur
e re
leas
e (k
gm
sup3)
desorptionadsorptionmixed
Figure 11 Effusivity (a) and moisture release (RH from 08 to 05) (b) of telephone book paper for three settings of paper properties
25
(a)
0
5
10
15
20
25
0 100 200 300 400 500 600
Time (h)
Moi
stu
re u
ptak
e (k
gm
sup3)
magazine book
telephone book
p=51
p=86
p=90
Figure 12 Moisture uptake by magazine and telephone book for different paper fractions
26
(a)
(b)
0
10
20
30
40
0 480 960 1440 1920 2400
Time (h)
000
005
010
015
Diffe
rence
()
real book simulationeffective book simulationdifference
Mo
istu
re u
pta
ke (
kgm
sup3)
Figure 13 (a) Moisture transport paths in a book (b) real and effective telephone book simulation Ψp 60
pape
r
air
pape
r
air
pape
r
fore-edge of book
path 1 path 2
REV
moisture flow
27
0
5
10
15
20
25
30
35
0 100 200 300
Time (h)
Mo
istu
re u
ptak
e (k
gm
sup3)
magazine book measurement data
magazine book simulation
p=88
p=55
Figure 14 Simulating measured hygroscopic behavior of magazine book specimens with effective book model
0E+00
1E-06
2E-06
3E-06
4E-06
0 02 04 06 08 1
Relative humidity (-)
Effu
sivi
ty (
kg(
msup2
Pa
s05
))
magazine booktelephone book
p=51
p=86
p=90
Figure 15 Effusivity of magazine book and telephone book in adsorption
Postprint Derluyn H Janssen H Diepens J Derome D Carmeliet J (2007) Hygroscopic behavior of paper and books Journal of Building Physics 31 (9) 9-34 DOI 1011771744259107079143
1
Hygroscopic behavior of paper and books
H Derluyn(a) H Janssen(b) J Diepens(c) D Derome(d) and J Carmeliet(ac)
(a) Department of Civil Engineering Laboratory of Building Physics Katholieke Universiteit Leuven Kasteelpark Arenberg 40 3001 Heverlee Belgium
(b) Department of Civil Engineering Section of Building Physics and Services
Technical University of Denmark Brovej ndash Building 118 2800 Kgs Lyngby Denmark
(c) Faculty of Building and Architecture Building Physics and Systems TUEindhoven PO Box 513 5600 MB Eindhoven The Netherlands
(d) Building Envelope Performance Laboratory Department of Building Civil and
Environmental Engineering Concordia University 1455 de Maisonneuve blvd West Montreal Qc Canada H3C 1M8
ABSTRACT This paper presents experimental analysis and numerical modeling of hygroscopic moisture buffering by paper and books First a literature review of moisture transport properties of paper is presented Experimental work on two paper types includes SEM analysis of the paper structure determination of sorption isotherms and water vapor permeability measurements A hysteretic model for paper is presented which is based on the measurement of the main adsorption and desorption curves It is shown that the water vapor permeability in a hysteretic model is dependent on the moisture content and not on the relative humidity Books consist of several paper sheets with air layers between the sheets To take the air layers into account a parallel transport model is proposed to determine the effective moisture transport properties of books taking into account the air layers The dynamic hygroscopic behavior of small book samples was measured It is shown that although the water vapor permeability of different paper types can be quite different the effusivity of a book highly depends on the presence of the air layers and can therefore remain comparable for different paper types KEY WORDS paper book hygroscopic properties hysteresis moisture buffering effective material properties
INTRODUCTION Paper being made of organic fibers is a hygroscopic material Books magazines newspapers in a room may therefore represent a high potential for moisture buffering since they are composed of a large set of thin paper layers Small air layers between the sheets may exist enhancing the water vapor transport into the book and increasing the moisture buffering capacity Until now it is not clear which paper surface of a book or magazine is accessible for moisture buffering when exposed to varying indoor air relative humidity For books with hard cover only the fore-edge and the topbottom-edges are accessible for moisture buffering
2
In the past several experimental and numerical methods and databases have been proposed to determine the moisture transport properties of building materials ([1]-[4] [12] [16]-[17]) However there is still a need for accurate moisture transport properties of paper magazines books and newspapers The moisture transport properties of paper itself may vary [7] The density of paper varies from 610-690 kgmsup3 for newsprint paper to 780 kgmsup3 for fine paper and up to 1150 kgmsup3 for coated super calendared paper Newsprint paper thickness may vary from 60 to 80 microns office paper is around 105 to 110 microns Porosity of paper can be as high as 70 It is reported in literature that especially water vapor permeability may vary due to differences in paper structure and surface treatment The paper structure is determined by the papermaking process which consists in pulping bleaching and beating Pulping is the process in which the wood is broken into wood fibers We distinguish mechanical and chemical pulping Bleaching whitens the pulp enhances brightness and eliminates impurities The structure of the fiber wall and surface is loosened by the beating process in order to ameliorate the mechanical properties of the paper As an example Figure 1 gives SEM images of a telephone book (TB) paper We clearly see the fibrous structure of paper The paper is made of 50 to 100 recycled fibers and has a matt finishing Figure 2 gives SEM images of a magazine (M) paper The paper has a pulp structure The paper is made of mechanical and chemical pulp color and fillers such as talc and calcium carbonate to make the paper smoother The paper is a machine finished coated paper and has a glossy finishing The glossy coating gives the paper a more closed surface In this study we first report on the moisture transport properties of paper Apart from a literature study we present a model to describe the hysteretic hygroscopic behavior of paper Two types of papers are measured a newsprint type paper and a magazine type paper (slightly glossy) In the second part we present a model to predict the moisture transport properties of books considered as multilayered air-paper systems The model is based on the properties of the paper itself and on the paper fraction defined as the ratio of paper volume to the total volume of the book Focus is on the transport through the fore-edge or the top-edge of a book ie with vapor transport parallel to the pages of the book
HYGROSCOPIC BEHAVIOR OF PAPER Theory Isothermal water vapor transport is described by
)( vpt
w
(1)
with w the moisture content [kgmsup3] t the time [s] the water vapor permeability [s] and pv the water vapor pressure [Pa] Further derivation gives
)( hpt
h
t
h
h
wvsat
a
(2)
3
with the moisture capacity [kgmsup3] h the relative humidity (RH) [-] a the water vapor permeability of dry air [s] the water vapor resistance factor [-] and pvsat the saturation water vapor pressure [Pa] The function describing w(h) is called the sorption isotherm A measure of the ability of a material to exchange moisture across its surface when the humidity changes at its surface is the moisture effusivity bm [kg(msup2Pasfrac12)]
vsatw
m pDb
(3)
with Dw the moisture diffusivity [msup2s] Literature data Sorption isotherm and water vapor permeability data for different types of paper were collected from literature The data are collected from [6] [10] [12] [13] and [15] The adsorption isotherms data were fitted using an equation of the van Genuchten type (see in [3])
mnhAww ln1)( max (4)
with A n parameters and wmax the moisture content at h = 1 We use the common assumption that m is given by nnm )1( The water vapor permeability data were fitted using the equation
cha
ebahwith
hh
1)(
)()(
(5)
Tables 1 and 2 give the fitted parameters for the different types of papers Figure 3(a) gives the adsorption isotherms w(h) Different paper types show different ranges of moisture content but the shape of the curves is rather similar Figure 3(b) gives the moisture capacity hw The variation between the different types of paper is rather low At low relative humidity (lt 60 RH) the moisture capacity is almost constant The moisture capacity increases quickly above 60 RH Figure 3(c) gives the vapor resistance factor for different types of paper The dry water vapor resistance factor microdry differs a lot for the different types of paper microdry varies from 50 for regular wallpaper to more than 8000 for a vinyl paper Even between different types of vinyl paper microdry varies a lot (from 200 to 8000) For all paper types the water vapor resistance factor decreases at higher relative humidity and differences between different types become less important
Material property measurements Two materials are measured a newsprint type paper referred to as telephone book (TB) paper and a magazine type paper (slightly glossy) referred to as magazine (M) paper The dry density was determined measuring the dry weight and the thickness of a paper sheet The thickness was determined using a micro-meter and also from SEM images The data are summarized in Table 3
4
Sorption isotherm The isothermal sorption curves are determined by conditioning samples in a dessicator with saturated salt solutions at constant temperature (23degC) The samples consisting of several paper sheets were initially dried in an oven of 50degC and 3 RH First the main adsorption isotherm was determined After attaining equilibrium the specimens were sequentially placed at lower relative humidities to determine the (primary) desorption curves Figure 4 gives the main adsorption and primary desorption data for the TB paper and M paper The main adsorption isotherm is fitted using an equation (introduced by Hansen see in [3]) of the form of Equation (4) with n=1 A=-1Aad and m=-1nad Aad and nad are parameters In the same way the main desorption isotherm is fitted using the parameters Ade and nde The values for the parameters are given in Table 3 In Figure 5(a) we observe that the moisture capacity for TB paper and M paper is comparable with the data from literature Both kinds of paper show a similar moisture capacity Water vapor permeability measurements The water vapor permeability is measured at three different RH ranges using the drywet cup test method (12-54 RH 54-86 RH 86-97 RH) The specimens consist of a set of paper sheets which are highly compressed to limit the possibility of air layers in between the sheets Based on the literature review and a first set of drywet cup test data the number of sheets was chosen in order to have specimens with an equivalent air layer thickness microd (with d the thickness) larger than 02 m According to EN ISO 125722001 [8] when meeting this condition no correction for the resistance of the air gap between the sample and the saturated salt solution is required As a result the telephone book specimens have 64 sheets and the magazine specimens 52 Two methods are applied to determine the nonlinear water vapor permeability from the measured steady state vapor flow gv In the first method the water vapor resistance factor is assumed to be constant in the RH range [h1h2] where h1 and h2 are the RHrsquos on each side of the sample The water vapor resistance factor at the average relative humidity (h1+h2)2 is then determined by
d
hhp
d
pg vsatav
v
)(1 12
(6)
with d the thickness of the test sample [m] Figure 6 gives the water vapor resistance factor at the three RHrsquos In a second step we fit the nonlinear water vapor resistance factor using Equation (5) The parameters are given in Table 3 We observe on Figure 5 that the magazine paper is about 5 times more vapor tight than the telephone book paper This difference can be explained by the higher density of the magazine paper the pulp paper structure the lower porosity and the effect of the finish coating In the second more accurate method we assume the water vapor resistance factor to be nonlinear Vapor transport is then given by
x
phg v
v
)( (7)
Integrating by parts we get
d h
h
vsatv hphxg0
2
1
d)(d (8)
5
Knowing that in steady state gv is constant and using Equation (5) for the nonlinear water vapor permeability we get after integration
12
12chch
avsatv eec
bhhapdg (9)
The parameters a b and c can be determined based on the three measurements of the vapor flow (see Table 3) Figures 6(a) and 6(b) compare the water vapor resistance factor as determined by the two methods for TB and M paper We observe that method 1 under predicts the water vapor resistance factors at higher RH For TB paper the relative difference (micro2-micro1)micro2 given in dotted line increases to 15 at RH=1 while for M paper which is more vapor tight the difference increases to 23 Figure 5(b) compares the water vapor resistance factor of TB paper and M paper with data from literature TB paper is rather vapor open and the dependence on RH is analogue to the literature data M paper is quite vapor tight and remains more vapor tight with increasing RH compared to the literature data Hysteresis model for paper We present a model for hysteretic hygroscopic behavior [5] which is based on the concept originally presented by Mualem [14] for soils To describe the history of an
adsorptiondesorption process we use the Enderbyrsquos notation For example 32
1 hh
hw describes a loading protocol going from a lower RH h1 up to h2 and again down to h3 In adsorption we assume that all possible sorption sites in the porous material are accessible The possible sorption sites are distributed according to a function f(h) A sorption site will be filled above a critical RH The main adsorption curve is then given by
)()()()(0
0
Fdhhfww ad (10)
or the main adsorption curve equals the integral of the distribution f(h) In desorption a sorption site can only become unfilled when the pore entry of the pore becomes unfilled We assume that different pores do not interact with each other The accessibility to the sorption sites is described by a normalized accessibility function a(h) Sorption processes can be schematically represented in a f-a space The f-axis gives the possible sorption sites while the ordinate represents the accessibility function Integration in the f-a space makes it possible to calculate the moisture content by multiplying the possible filled sorption sites with their accessibility The main adsorption curve is given by (see Figure 7(a))
)()1()()()()()(0
1
0
0
FAFdhhadhhfww ad (11)
The integral over the total range of the accessibility function (from 0 to 1) indicates that all pores are accessible during adsorption Since a(h) is normalized A(1)=1 During desorption to a relative humidity the pores accessible between max and will desorb According to Figure 7(b) the moisture content during main desorption is given by
6
1
maxmax )())(()(max
dhhawwwww addeh (12)
or
)())(()(
)(1))(()(
max
maxmaxmax
Awww
Awwwww
adad
addeh
(13)
The equation shows that the integral of the accessibility function A() can be determined from the main adsorption and main desorption curve or
)(
)()()(
max
ad
adde
ww
wwA
(14)
The process of primary desorption (desorption from the main adsorption curve) is given in Figure 7(c) Integration in the f-a space gives
)())()(()( 101 Awhwww adadad
h (15)
The process of primary adsorption (adsorption from the main desorption curve) is given in Figure 7(d) Integration in the f-a space gives
)())(()( 1max0 1max hAwwww adadh
h (16)
Formulas for adsorption or desorption after a series of alternating processes of adsorption or desorption can also be derived by integrating in the f-a space Figures 8(a) and 8(b) compare the measured and calculated primary desorption curves for TB and M paper The parameters used to describe the main adsorption and desorption curves are given in Table 3 We observe in Figures 8(a) and 8(b) that at lower RH the primary desorption curves are well described At higher RH there is less agreement between measurements and the hysteresis model Nevertheless the advantage of the present hysteresis model is that only the main adsorption and desorption curves are needed Water vapor permeability The nonlinear water vapor permeability for non-hysteretic materials is commonly described as function of the relative humidity (see Equation (5)) The increase of the water vapor permeability at high relative humidity is commonly explained by the fact that microscopic liquid water transport in filled pores enhances the apparent water vapor transport This means that the apparent water vapor diffusion coefficient should not depend on the relative humidity but on the degree of saturation Sl=w(h)wmax The equation for the water vapor permeability then reads
)()()( 0
l
al
al S
SfS
(17)
with the tortuosity and 0 the open porosity In the performed cup tests the water vapor resistance factor is measured in the adsorption regime since the specimens were dried first and then installed into the cup (this is a slight deviation of the EN ISO standard in order to know the sorption regime of the measurement) The measurement data are fitted by the function ad(h) using Equation (5) Using the inverse of the main adsorption isotherm wad(h) we get
)()( 1ladadl SwS (18)
7
As example we analyze the material response during a RH loading protocol as given in Figure (9) The material is TB paper In figures 10(a)-(d) the hysteretic loops as well as the main adsorption and desorption curves are given for respectively the sorption isotherm (a) the water vapor resistance factor (b) the moisture capacity (c) and effusivity (d) We observe that after the cycling the material behavior evolves to an almost single curve For the sorption isotherm and water vapor resistance factor this curve is an intermediate curve between main adsorption and desorption curve The hysteretic material is thus more vapor open than the material in adsorption but more vapor tight than the material in desorption We observe in Figure 10(c) that the hysteretic material has after cycling a slightly lower moisture capacity than in adsorption but that the moisture capacity is much lower than in desorption In Figure 10(d) we see that with cyclic loading the effusivity comes close to the adsorption effusivity This is logical since hysteresis leads to two opposite effects the material becomes more vapor open than in the adsorption state but has less moisture capacity than in adsorption which means the effusivity might not change so much When we simulate the main desorption process desorption transport properties should be chosen We analyze what the influence is on the results when adsorption properties are used instead of desorption properties We distinguish three cases (1) desorption transport properties which is the reference case (2) adsorption transport properties (adsorption case) (3) desorption moisture capacity but adsorption water vapor resistance factor (mixed case) Figure 11(a) gives the effusivity for the three cases We observe that the mixed case under predicts the desorption effusivity With adsorption properties the effusivity is over predicted at high RH and under predicted at lower RH As example we simulate the desorption process for a step change from 08 to 05 RH The water vapor transport is one dimensional The water vapor surface coefficient = 510-8 sm The moisture transport properties of TB paper are used Figure 11(b) gives the moisture release w=w0-w with w0 the initial moisture content at RH=08 The adsorption and mixed case under predict w since the effusivity is under predicted in the RH range [05 08]
MODELLING OF THE HYGROSCOPIC BEHAVIOR OF BOOKS Hygroscopic behavior of books A book is defined as a number of sheets of paper with air layers in between The total volume of the book is patot VVV (a = air layer p = paper layer) The paper fractions in
the book Ψp [-] and Ψa [-] are defined as
ptot
ptota
tot
pp V
VV
V
V
1 (19)
The hygroscopic behavior is measured exposing book specimens to a step change in RH The experimental set-up of the Building Physics and Systems Unit of TUEindhoven is used [9] A book specimen consists of a number of paper sheets (005x 005 msup2) which
8
are placed in a sample holder of the form of a small box with five plexiglass sides The open side with all the sheet edges regularly spaced mimics the fore-edge of a book Two paper fractions for magazine book are used high (Ψp = 086) and low (Ψp = 051) Also a telephone book specimen with a paper fraction Ψp = 09 is measured After reaching equilibrium at RH=054 a step change from 054 to 0795 is imposed Moisture uptake is possible only through the open side which means uptake parallel to the paper sheets Figure 12 gives the moisture uptake w=w-w0 versus time for the three book specimens with w0 the initial moisture content at RH=054 Although the magazine paper is more vapor tight than the telephone book paper the two book specimen with high paper fraction show a similar uptake behavior The moisture uptake of the low paper fraction book is lower than the high paper fraction book The low paper fraction book will however attain equilibrium faster compared to the high paper fraction book This means that due to the presence of air layers between the paper sheets the low paper fraction book is characterized by a higher effective permeability and lower effective moisture capacity compared to high paper fraction book specimens In the next section we formulate a model to predict the effective moisture transport properties of books The model will then be used to explain the comparable behavior of the high paper fraction magazine and the telephone book specimens although the papers of each book show quite a different water vapor permeability Effective moisture transport properties of books We assume the paper to be a homogeneous and isotropic material Effective density of book The dry density of a book b [kgmsup3] is given by
apppaappb 1 (20)
with p the dry density of the paper and a the density of air Effective moisture capacity of book The moisture content of a sheet of paper is defined as
llp Sw 0 (21)
with l the density of the liquid 0 the open porosity of the paper and Sl the degree of
saturation Since the volumetric moisture capacity of air is around 10000 times smaller than the moisture capacity of paper the water vapor present in the air layer can be neglected The moisture content of book wb can then be written as
pppllb wSw 0 (22)
The effective moisture capacity of a book b is given by differentiating Equation (22)
with respect to RH
ppp
p
bbb h
w
w
w
h
w
(23)
9
Effective water vapor permeability of book [7] A book is considered as a periodic system of paper sheets and air layers We define a representative volume (REV) consisting of a half layer of paper and a half layer of air (Figure 13(a)) In this REV two different paths for water vapor transport exist (see Figure 13(a)) The first path describes water vapor transport in paper normal to the fore-edge of the book In the second path water vapor is transported parallel to the paper sheets through the air layer towards the inner part of the book and then adsorbed by paper in a direction normal to the sheet Air is characterized by a high water vapor permeability but very low moisture capacity This means that the water vapor transported via the air layer is not buffered by the air layer itself but will be almost immediately buffered by the paper sheets Due to the limited thickness of paper the moisture is quickly redistributed over the thickness and a one-dimensional moisture front is attained the moisture front advances parallel to the fore-edge of the book during moisture uptake So two different transport paths exist building up the same moisture front in the paper sheet This means that in a first approximation we can model the water vapor transport in book as a parallel system The water vapor permeability of this parallel system is given by
aappb (24)
with b p and a respectively the water vapor permeability of book paper and air We now introduce a factor so that
)()()( hhh pppb (25)
From Equation (24) and (25) we get pppp hhh 1)()()( (26)
Effective moisture buffering capacity of book The effective effusivity of a book is then equal to
satv
ppp
vsat
ppp
vsat
bbbm ppp
b
(27)
or
pmbm bb (28)
The factor is dependent on RH and the paper fraction We remark that it can be expected that the vapor permeability of paper is not isotropic especially when the surface has a glossy coating as for the magazine paper However due to the presence of air layers in a book the vapor flow through the air layers is dominant compared to the flow normal to the paper edge Therefore only a small error is introduced assuming isotropic behavior Validation To validate Equations (24) or (25) and (26) we simulate the two-dimensional water vapor transport in the REV taking into account as well vapor transport normal to the edge of the paper as vapor transport in the air layers The simulation model HAMFEM is used
10
[11] The loading consists in a stepwise adsorption from 054 to 0795 RH normal to the fore-edge of the book The surface mass transfer coefficient β equals 510-8 sm No flow conditions are considered at all other sides of the REV The thickness of one sheet of paper is 60 μm The thickness of the air layer is calculated from a paper fraction of Ψp = 06 For the paper the material properties of paper wallpaper 1 of the literature review are taken (see Table 1 and 2) For air the sorption curve is given by the ideal gas law and the water vapor permeability is taken to be the water vapor permeability of stagnant air δa = 19210-10 s No air transport is considered The temperature is constant at 23degC Figure 13(b) gives the time evolution of the average moisture content of the REV calculated with the 2D model This result is compared with a 1D calculation using effective transport properties as given by Equations (23) and (24) A good agreement is obtained with a maximal error less than 015 Simulations at other paper fractions give comparable good agreement For experimental validation of the proposed book model controlled moisture uptake experiments on small book specimens of the magazine paper are performed The experimental set-up of the Building Physics and Systems Unit of TUEindhoven is used [9] A book specimen with a high paper fraction (Ψp = 088) and one with a low paper fraction (Ψp = 055) are tested The dimension of the side open to the environment measures 004 x 004 msup2 The depth of the specimens is limited (002 m) in order the specimens will reach equilibrium in short time To obtain a uniform spacing between the paper sheets of the low paper fraction book specimen metal sheets with a thickness of 50 microm are placed between the paper sheets After pressing the specimen highly between plexiglass plates the lateral and bottom sides of the specimens are made vapor tight by applying a polyurethane sealant After drying of the sealant the metal paper sheets are removed The specimens are initially dried and then exposed to a RH of 054 until equilibrium is attained After reaching the equilibrium state a step change from 054 to 0795 is imposed Figure 14 gives the measurement results of the moisture uptake w=w-w0 Using the developed book model the moisture uptake curves are simulated using a surface mass transfer coefficient β of 210-7 sm for the high paper fraction book and a value of 110-8 sm for the low paper fraction book The lower transfer coefficient for the low paper fraction paper is attributed to the unevenness of the exposed surface of the low paper fraction specimen (we did not flatten the surface since this would influence the distance between the sheets) The transport properties of magazine paper for adsorption are used A good agreement between measurement and simulation is observed Discussion Finally we explain the measurements of Figure 12 using the book model From equations (27) and (28) we evaluate the effusivity of magazine and telephone book for the given paper fractions Figure 15 gives the effusivity for magazine at two paper fractions (Ψp = 086 Ψp = 051) and for telephone book at a paper fraction Ψp = 09 We observe that magazine and telephone book at high paper fraction have comparable effusivities although M paper is much more vapor tight than TB paper The high vapor resistance factor of M paper is compensated totally by the very high vapor permeability of the air layers This explains the comparable moisture uptake as observed in the experiment (see
11
Figure 12) The effusivity of the magazine at lower paper fraction is higher than the effusivity at high paper fraction which explains the fast moisture uptake for the low paper fraction book as observed in Figure 12 However the total moisture uptake will be lower than for the high paper fraction book since the total moisture content is dependent on the paper fraction as given by Equation (22)
CONCLUSIONS In this paper the moisture buffering of paper and books normal to the fore-edge is analyzed The literature review shows that different paper types show comparable moisture capacity but may show quite different water vapor permeability Paper shows hysteresis and a hysteresis model is presented which is based on the knowledge of the adsorption and desorption isotherm We found that the water vapor permeability of a hygroscopic material showing hysteresis like paper depends on the moisture content and not on the relative humidity Hysteresis leads to two opposite effects the material becomes more vapor open but shows less moisture capacity which means the effusivity might not change so much It was also indicated that using desorption instead of adsorption moisture properties the effusivity is over-predicted Experiments on book specimens show that the air layers between the paper sheets play an important role Vapor transport through the air layer leads to an increase of the effective vapor permeability The total amount of water vapor uptake however reduces due to the reduction of the paper volume at low paper fractions The experiments further show that although the water vapor permeability of paper can be quite different the moisture buffering capacity or effusivity of a book can remain comparable due to the presence of these vapor open air layers It was further found that the two-dimensional moisture transport in a book considered as a multilayered air-paper system can be modeled by a one-dimensional parallel transport system with a moisture capacity equal to the moisture capacity of the paper sheets The parallel system consists of a transport path in paper normal to the fore-edge of the book and a transport path through the air layers towards the paper The proposed homogeneous system stems from the fact that the air between the paper layers has almost no moisture capacity while the paper is in comparison a large moisture sink
REFERENCES 1 Carmeliet J Descamps F Houvenaghel G (1999) Multiscale network model for
simulating liquid water and water vapour transfer properties of porous materials Transport in Porous Media 35 67-88
2 Carmeliet J and Roels S (2001) Determination of the Isothermal Moisture Transport Properties of Porous building Materials Journal of Thermal Envelope and Building Science 24 183-210
12
3 Carmeliet J and Roels S (2002) Determination of the moisture capacity of porous building materials Journal of Thermal Envelope and Building Science 25(3) 209-237
4 Carmeliet J Hens H Roels S Adan O Brocken H Cerny R Pavlik Z Hall C Kumaran K Pel L (2004) Determination of the Liquid Water Diffusivity from Transient Moisture Transfer Experiments Journal of Thermal Envelope and Building Science 27(4) 277-305
5 Carmeliet J de Wit M and Janssen H (2005) Hysteresis and moisture buffering of wood Symposium of Building Physics in the Nordic Countries June 13-15 2005 Reykjavik Iceland pp55-62
6 Chatterjee SG (2001) Comparison of Domain and Similarity Models for Characterizing Moisture Sorption Equilibria of Paper Industrial and Engineering Chemical Research 40 188-194
7 Derluyn H (2006) Role of textiles and paper for stabilizing the indoor environment MScthesis Katholieke Universiteit Leuven Leuven Belgium (httpwwwkuleuvenbebwfengteaching_msctheses)
8 EN ISO 12572 (2001) Hygrothermal performance of building materials and products ndash Determination of water vapour transmission properties
9 Goossens E (2003) Moisture transfer properties of coated gypsum PhD-thesis TUe Eindhoven The Netherlands
10 Gupta H Chatterjee SG (2003) Parallel Diffusion of Moisture in Paper Part 1 Steady-State Conditions Industrial and Engineering Chemical Research 42 6582-6592
11 Janssen H Carmeliet J Hens H (2004) The influence of soil moisture transfer on building heat loss via the ground Buildings and Environment 39(7) 825-836
12 Kumaran K (1996) International Energy Agency Condensation and energy ndash Catalogue of material properties Report Annex 24 Volume 3 Energy conservation in buildings
13 Motta Lima OC Monteiro AS Pereira NC Mendes ES (2003) Moisture Equilibrium Isotherms for a Commercial Liquid Package Paper Drying Technology 21(10) 1909-1922
14 Mualem Y (1974) A conceptual model of hysteresis Water Resources research 10(3) 514-520
15 Ramarao BV Massoquete A Lavrykov S and Ramaswamy S (2003) Moisture Diffusion Inside Paper Materials in the Hygroscopic Range and Characteristics of Diffusivity Parameters Drying Technology 21(10) 2007-2056
16 Roels S Carmeliet J Hens H Adan O Brocken H Cerny R Pavlik Z Ellis AT Hall C Kumaran K Pel L Plagge R (2004) A comparison of Different Techniques to Quantify Moisture Content Profiles in Porous Building Materials Journal of Thermal Envelope and Building Science 27(4) 261-276
17 Roels S Carmeliet J Hens H Adan O Brocken H Cerny R Pavlik Z Hall C Kumaran K Pel L Plagge R (2004) Interlaboratory Comparison of Hygric Properties of Porous Building Materials Journal of Thermal Envelope and Building Science 27(4) 307-325
13
Table 1 Parameters for adsorption isotherms for different types of paper
Figure 3 Moisture transport properties of different paper types
18
(a)
0
40
80
120
160
01 03 05 07 09
Relative humidity (-)
Moi
stur
e co
nten
t (kg
msup3)
analytical fit
measurements
adsorption measurements
(b)
0
40
80
120
160
01 03 05 07 09
Relative humidity (-)
Moi
stur
e co
nten
t (kg
msup3)
analytical fit
measurements
adsorption measurements
Figure 4 Main adsorption and primary desorption data for telephone book (TB) paper (a) and magazine (M) paper (b) Thick solid line analytical fit of main adsorption isotherm
19
(a)
0
200
400
01 03 05 07 09
Relative humidity (-)
Mo
istu
re c
apac
ity (
kgm
sup3)
telephone book paper
magazine paper
(b)
0
200
400
600
800
01 03 05 07 09
Relative humidity (-)
Vap
or r
esis
tanc
e fa
cto
r (-
)
telephone book paper
magazine paper
Figure 5 Moisture capacity (a) and vapor resistance factor (b) of telephone book (TB) paper and magazine (M) paper compared with literature data (in gray for data specifications see Table 1 and 2)
20
(a)
0
20
40
60
80
100
120
01 03 05 07 09
Relative humidity (-)
Vap
or
resi
sta
nce
fact
or
(-)
0
10
20
30
40
50
Difference (
)method 1
method 2
difference
(b)
0
100
200
300
400
500
600
700
01 03 05 07 09
Relative humidity (-)
Vap
or r
esis
tanc
e fa
ctor
(-)
0
10
20
30
40
50
Difference (
)
method 1
method 2
difference
Figure 6 Vapor resistance factor of telephone book (TB) paper (a) and magazine (M) paper (b) determined by method 1 (Equation (6)) and method 2 (Equation (9))
21
(a)
0 10
1 a
f
main adsorption
(b) main desorption
0 10
1 a
f
(c)
0 10
1 a
f
primary desorption
1
(d)
0 10
1 a
f
primary adsorption
1
1
Figure 7 Main adsorption main desorption primary desorption primary adsorption processes represented in the f-a space where f represents the sorption sites and a the accessibility function (a)
0
40
80
120
160
01 03 05 07 09
Relative humidity (-)
Moi
stur
e co
nten
t (kg
msup3)
Mualem model
primary desorption measurements
adsorption measurements
(b)
0
40
80
120
160
01 03 05 07 09
Relative humidity (-)
Mo
istu
re c
on
ten
t (kg
msup3)
Mualem modelprimary desorption measurements
adsorption measurements
Figure 8 Comparison of measured primary desorption curves (bullets and dotted line) with model predictions (solid lines) Squares represent the measured adsorption curves (a) telephone book (TB) paper and (b) magazine (M) paper
22
0
02
04
06
08
1
Loading protocol
Rel
ativ
e h
umid
ity (
-)
Figure 9 Relative humidity loading protocol
23
(a)
0
40
80
120
160
0 02 04 06 08 1
Relative humidity (-)
Moi
stur
e c
onte
nt (
kgm
sup3)
hysteresis
desorption
adsorption
(b)
0
20
40
60
80
100
120
0 02 04 06 08 1
Relative humidity (-)
Wa
ter
vap
or
resi
sta
nce
fact
or
(-) hysteresis
desorption
adsorption
(c)
0
200
400
600
0 02 04 06 08 1
Relative humidity (-)
Moi
stur
e ca
paci
ty (
kgm
sup3)
hysteresis
adsorption
desorption
(d)
00E+00
50E-07
10E-06
15E-06
20E-06
0 02 04 06 08 1
Relative humidity (-)
Effu
sivi
ty (
kg(
msup2
Pa
s05 ))
hysteresis
desorption
adsorption
Figure 10 Hysteretic loops and main adsorption and desorption curves of loading protocol for the sorption isotherms (a) water vapor resistance factor (b) moisture capacity (c) and effusivity (d)
24
(a)
00E+00
50E-07
10E-06
15E-06
20E-06
25E-06
01 03 05 07 09
Relative humidity (-)
Effu
sivi
ty (
kg(
msup2
Pa
s0
5 ))
desorptionadsorptionmixed
(b)
00
40
80
120
0 50 100 150 200
Time (h)
Moi
stur
e re
leas
e (k
gm
sup3)
desorptionadsorptionmixed
Figure 11 Effusivity (a) and moisture release (RH from 08 to 05) (b) of telephone book paper for three settings of paper properties
25
(a)
0
5
10
15
20
25
0 100 200 300 400 500 600
Time (h)
Moi
stu
re u
ptak
e (k
gm
sup3)
magazine book
telephone book
p=51
p=86
p=90
Figure 12 Moisture uptake by magazine and telephone book for different paper fractions
26
(a)
(b)
0
10
20
30
40
0 480 960 1440 1920 2400
Time (h)
000
005
010
015
Diffe
rence
()
real book simulationeffective book simulationdifference
Mo
istu
re u
pta
ke (
kgm
sup3)
Figure 13 (a) Moisture transport paths in a book (b) real and effective telephone book simulation Ψp 60
pape
r
air
pape
r
air
pape
r
fore-edge of book
path 1 path 2
REV
moisture flow
27
0
5
10
15
20
25
30
35
0 100 200 300
Time (h)
Mo
istu
re u
ptak
e (k
gm
sup3)
magazine book measurement data
magazine book simulation
p=88
p=55
Figure 14 Simulating measured hygroscopic behavior of magazine book specimens with effective book model
0E+00
1E-06
2E-06
3E-06
4E-06
0 02 04 06 08 1
Relative humidity (-)
Effu
sivi
ty (
kg(
msup2
Pa
s05
))
magazine booktelephone book
p=51
p=86
p=90
Figure 15 Effusivity of magazine book and telephone book in adsorption
2
In the past several experimental and numerical methods and databases have been proposed to determine the moisture transport properties of building materials ([1]-[4] [12] [16]-[17]) However there is still a need for accurate moisture transport properties of paper magazines books and newspapers The moisture transport properties of paper itself may vary [7] The density of paper varies from 610-690 kgmsup3 for newsprint paper to 780 kgmsup3 for fine paper and up to 1150 kgmsup3 for coated super calendared paper Newsprint paper thickness may vary from 60 to 80 microns office paper is around 105 to 110 microns Porosity of paper can be as high as 70 It is reported in literature that especially water vapor permeability may vary due to differences in paper structure and surface treatment The paper structure is determined by the papermaking process which consists in pulping bleaching and beating Pulping is the process in which the wood is broken into wood fibers We distinguish mechanical and chemical pulping Bleaching whitens the pulp enhances brightness and eliminates impurities The structure of the fiber wall and surface is loosened by the beating process in order to ameliorate the mechanical properties of the paper As an example Figure 1 gives SEM images of a telephone book (TB) paper We clearly see the fibrous structure of paper The paper is made of 50 to 100 recycled fibers and has a matt finishing Figure 2 gives SEM images of a magazine (M) paper The paper has a pulp structure The paper is made of mechanical and chemical pulp color and fillers such as talc and calcium carbonate to make the paper smoother The paper is a machine finished coated paper and has a glossy finishing The glossy coating gives the paper a more closed surface In this study we first report on the moisture transport properties of paper Apart from a literature study we present a model to describe the hysteretic hygroscopic behavior of paper Two types of papers are measured a newsprint type paper and a magazine type paper (slightly glossy) In the second part we present a model to predict the moisture transport properties of books considered as multilayered air-paper systems The model is based on the properties of the paper itself and on the paper fraction defined as the ratio of paper volume to the total volume of the book Focus is on the transport through the fore-edge or the top-edge of a book ie with vapor transport parallel to the pages of the book
HYGROSCOPIC BEHAVIOR OF PAPER Theory Isothermal water vapor transport is described by
)( vpt
w
(1)
with w the moisture content [kgmsup3] t the time [s] the water vapor permeability [s] and pv the water vapor pressure [Pa] Further derivation gives
)( hpt
h
t
h
h
wvsat
a
(2)
3
with the moisture capacity [kgmsup3] h the relative humidity (RH) [-] a the water vapor permeability of dry air [s] the water vapor resistance factor [-] and pvsat the saturation water vapor pressure [Pa] The function describing w(h) is called the sorption isotherm A measure of the ability of a material to exchange moisture across its surface when the humidity changes at its surface is the moisture effusivity bm [kg(msup2Pasfrac12)]
vsatw
m pDb
(3)
with Dw the moisture diffusivity [msup2s] Literature data Sorption isotherm and water vapor permeability data for different types of paper were collected from literature The data are collected from [6] [10] [12] [13] and [15] The adsorption isotherms data were fitted using an equation of the van Genuchten type (see in [3])
mnhAww ln1)( max (4)
with A n parameters and wmax the moisture content at h = 1 We use the common assumption that m is given by nnm )1( The water vapor permeability data were fitted using the equation
cha
ebahwith
hh
1)(
)()(
(5)
Tables 1 and 2 give the fitted parameters for the different types of papers Figure 3(a) gives the adsorption isotherms w(h) Different paper types show different ranges of moisture content but the shape of the curves is rather similar Figure 3(b) gives the moisture capacity hw The variation between the different types of paper is rather low At low relative humidity (lt 60 RH) the moisture capacity is almost constant The moisture capacity increases quickly above 60 RH Figure 3(c) gives the vapor resistance factor for different types of paper The dry water vapor resistance factor microdry differs a lot for the different types of paper microdry varies from 50 for regular wallpaper to more than 8000 for a vinyl paper Even between different types of vinyl paper microdry varies a lot (from 200 to 8000) For all paper types the water vapor resistance factor decreases at higher relative humidity and differences between different types become less important
Material property measurements Two materials are measured a newsprint type paper referred to as telephone book (TB) paper and a magazine type paper (slightly glossy) referred to as magazine (M) paper The dry density was determined measuring the dry weight and the thickness of a paper sheet The thickness was determined using a micro-meter and also from SEM images The data are summarized in Table 3
4
Sorption isotherm The isothermal sorption curves are determined by conditioning samples in a dessicator with saturated salt solutions at constant temperature (23degC) The samples consisting of several paper sheets were initially dried in an oven of 50degC and 3 RH First the main adsorption isotherm was determined After attaining equilibrium the specimens were sequentially placed at lower relative humidities to determine the (primary) desorption curves Figure 4 gives the main adsorption and primary desorption data for the TB paper and M paper The main adsorption isotherm is fitted using an equation (introduced by Hansen see in [3]) of the form of Equation (4) with n=1 A=-1Aad and m=-1nad Aad and nad are parameters In the same way the main desorption isotherm is fitted using the parameters Ade and nde The values for the parameters are given in Table 3 In Figure 5(a) we observe that the moisture capacity for TB paper and M paper is comparable with the data from literature Both kinds of paper show a similar moisture capacity Water vapor permeability measurements The water vapor permeability is measured at three different RH ranges using the drywet cup test method (12-54 RH 54-86 RH 86-97 RH) The specimens consist of a set of paper sheets which are highly compressed to limit the possibility of air layers in between the sheets Based on the literature review and a first set of drywet cup test data the number of sheets was chosen in order to have specimens with an equivalent air layer thickness microd (with d the thickness) larger than 02 m According to EN ISO 125722001 [8] when meeting this condition no correction for the resistance of the air gap between the sample and the saturated salt solution is required As a result the telephone book specimens have 64 sheets and the magazine specimens 52 Two methods are applied to determine the nonlinear water vapor permeability from the measured steady state vapor flow gv In the first method the water vapor resistance factor is assumed to be constant in the RH range [h1h2] where h1 and h2 are the RHrsquos on each side of the sample The water vapor resistance factor at the average relative humidity (h1+h2)2 is then determined by
d
hhp
d
pg vsatav
v
)(1 12
(6)
with d the thickness of the test sample [m] Figure 6 gives the water vapor resistance factor at the three RHrsquos In a second step we fit the nonlinear water vapor resistance factor using Equation (5) The parameters are given in Table 3 We observe on Figure 5 that the magazine paper is about 5 times more vapor tight than the telephone book paper This difference can be explained by the higher density of the magazine paper the pulp paper structure the lower porosity and the effect of the finish coating In the second more accurate method we assume the water vapor resistance factor to be nonlinear Vapor transport is then given by
x
phg v
v
)( (7)
Integrating by parts we get
d h
h
vsatv hphxg0
2
1
d)(d (8)
5
Knowing that in steady state gv is constant and using Equation (5) for the nonlinear water vapor permeability we get after integration
12
12chch
avsatv eec
bhhapdg (9)
The parameters a b and c can be determined based on the three measurements of the vapor flow (see Table 3) Figures 6(a) and 6(b) compare the water vapor resistance factor as determined by the two methods for TB and M paper We observe that method 1 under predicts the water vapor resistance factors at higher RH For TB paper the relative difference (micro2-micro1)micro2 given in dotted line increases to 15 at RH=1 while for M paper which is more vapor tight the difference increases to 23 Figure 5(b) compares the water vapor resistance factor of TB paper and M paper with data from literature TB paper is rather vapor open and the dependence on RH is analogue to the literature data M paper is quite vapor tight and remains more vapor tight with increasing RH compared to the literature data Hysteresis model for paper We present a model for hysteretic hygroscopic behavior [5] which is based on the concept originally presented by Mualem [14] for soils To describe the history of an
adsorptiondesorption process we use the Enderbyrsquos notation For example 32
1 hh
hw describes a loading protocol going from a lower RH h1 up to h2 and again down to h3 In adsorption we assume that all possible sorption sites in the porous material are accessible The possible sorption sites are distributed according to a function f(h) A sorption site will be filled above a critical RH The main adsorption curve is then given by
)()()()(0
0
Fdhhfww ad (10)
or the main adsorption curve equals the integral of the distribution f(h) In desorption a sorption site can only become unfilled when the pore entry of the pore becomes unfilled We assume that different pores do not interact with each other The accessibility to the sorption sites is described by a normalized accessibility function a(h) Sorption processes can be schematically represented in a f-a space The f-axis gives the possible sorption sites while the ordinate represents the accessibility function Integration in the f-a space makes it possible to calculate the moisture content by multiplying the possible filled sorption sites with their accessibility The main adsorption curve is given by (see Figure 7(a))
)()1()()()()()(0
1
0
0
FAFdhhadhhfww ad (11)
The integral over the total range of the accessibility function (from 0 to 1) indicates that all pores are accessible during adsorption Since a(h) is normalized A(1)=1 During desorption to a relative humidity the pores accessible between max and will desorb According to Figure 7(b) the moisture content during main desorption is given by
6
1
maxmax )())(()(max
dhhawwwww addeh (12)
or
)())(()(
)(1))(()(
max
maxmaxmax
Awww
Awwwww
adad
addeh
(13)
The equation shows that the integral of the accessibility function A() can be determined from the main adsorption and main desorption curve or
)(
)()()(
max
ad
adde
ww
wwA
(14)
The process of primary desorption (desorption from the main adsorption curve) is given in Figure 7(c) Integration in the f-a space gives
)())()(()( 101 Awhwww adadad
h (15)
The process of primary adsorption (adsorption from the main desorption curve) is given in Figure 7(d) Integration in the f-a space gives
)())(()( 1max0 1max hAwwww adadh
h (16)
Formulas for adsorption or desorption after a series of alternating processes of adsorption or desorption can also be derived by integrating in the f-a space Figures 8(a) and 8(b) compare the measured and calculated primary desorption curves for TB and M paper The parameters used to describe the main adsorption and desorption curves are given in Table 3 We observe in Figures 8(a) and 8(b) that at lower RH the primary desorption curves are well described At higher RH there is less agreement between measurements and the hysteresis model Nevertheless the advantage of the present hysteresis model is that only the main adsorption and desorption curves are needed Water vapor permeability The nonlinear water vapor permeability for non-hysteretic materials is commonly described as function of the relative humidity (see Equation (5)) The increase of the water vapor permeability at high relative humidity is commonly explained by the fact that microscopic liquid water transport in filled pores enhances the apparent water vapor transport This means that the apparent water vapor diffusion coefficient should not depend on the relative humidity but on the degree of saturation Sl=w(h)wmax The equation for the water vapor permeability then reads
)()()( 0
l
al
al S
SfS
(17)
with the tortuosity and 0 the open porosity In the performed cup tests the water vapor resistance factor is measured in the adsorption regime since the specimens were dried first and then installed into the cup (this is a slight deviation of the EN ISO standard in order to know the sorption regime of the measurement) The measurement data are fitted by the function ad(h) using Equation (5) Using the inverse of the main adsorption isotherm wad(h) we get
)()( 1ladadl SwS (18)
7
As example we analyze the material response during a RH loading protocol as given in Figure (9) The material is TB paper In figures 10(a)-(d) the hysteretic loops as well as the main adsorption and desorption curves are given for respectively the sorption isotherm (a) the water vapor resistance factor (b) the moisture capacity (c) and effusivity (d) We observe that after the cycling the material behavior evolves to an almost single curve For the sorption isotherm and water vapor resistance factor this curve is an intermediate curve between main adsorption and desorption curve The hysteretic material is thus more vapor open than the material in adsorption but more vapor tight than the material in desorption We observe in Figure 10(c) that the hysteretic material has after cycling a slightly lower moisture capacity than in adsorption but that the moisture capacity is much lower than in desorption In Figure 10(d) we see that with cyclic loading the effusivity comes close to the adsorption effusivity This is logical since hysteresis leads to two opposite effects the material becomes more vapor open than in the adsorption state but has less moisture capacity than in adsorption which means the effusivity might not change so much When we simulate the main desorption process desorption transport properties should be chosen We analyze what the influence is on the results when adsorption properties are used instead of desorption properties We distinguish three cases (1) desorption transport properties which is the reference case (2) adsorption transport properties (adsorption case) (3) desorption moisture capacity but adsorption water vapor resistance factor (mixed case) Figure 11(a) gives the effusivity for the three cases We observe that the mixed case under predicts the desorption effusivity With adsorption properties the effusivity is over predicted at high RH and under predicted at lower RH As example we simulate the desorption process for a step change from 08 to 05 RH The water vapor transport is one dimensional The water vapor surface coefficient = 510-8 sm The moisture transport properties of TB paper are used Figure 11(b) gives the moisture release w=w0-w with w0 the initial moisture content at RH=08 The adsorption and mixed case under predict w since the effusivity is under predicted in the RH range [05 08]
MODELLING OF THE HYGROSCOPIC BEHAVIOR OF BOOKS Hygroscopic behavior of books A book is defined as a number of sheets of paper with air layers in between The total volume of the book is patot VVV (a = air layer p = paper layer) The paper fractions in
the book Ψp [-] and Ψa [-] are defined as
ptot
ptota
tot
pp V
VV
V
V
1 (19)
The hygroscopic behavior is measured exposing book specimens to a step change in RH The experimental set-up of the Building Physics and Systems Unit of TUEindhoven is used [9] A book specimen consists of a number of paper sheets (005x 005 msup2) which
8
are placed in a sample holder of the form of a small box with five plexiglass sides The open side with all the sheet edges regularly spaced mimics the fore-edge of a book Two paper fractions for magazine book are used high (Ψp = 086) and low (Ψp = 051) Also a telephone book specimen with a paper fraction Ψp = 09 is measured After reaching equilibrium at RH=054 a step change from 054 to 0795 is imposed Moisture uptake is possible only through the open side which means uptake parallel to the paper sheets Figure 12 gives the moisture uptake w=w-w0 versus time for the three book specimens with w0 the initial moisture content at RH=054 Although the magazine paper is more vapor tight than the telephone book paper the two book specimen with high paper fraction show a similar uptake behavior The moisture uptake of the low paper fraction book is lower than the high paper fraction book The low paper fraction book will however attain equilibrium faster compared to the high paper fraction book This means that due to the presence of air layers between the paper sheets the low paper fraction book is characterized by a higher effective permeability and lower effective moisture capacity compared to high paper fraction book specimens In the next section we formulate a model to predict the effective moisture transport properties of books The model will then be used to explain the comparable behavior of the high paper fraction magazine and the telephone book specimens although the papers of each book show quite a different water vapor permeability Effective moisture transport properties of books We assume the paper to be a homogeneous and isotropic material Effective density of book The dry density of a book b [kgmsup3] is given by
apppaappb 1 (20)
with p the dry density of the paper and a the density of air Effective moisture capacity of book The moisture content of a sheet of paper is defined as
llp Sw 0 (21)
with l the density of the liquid 0 the open porosity of the paper and Sl the degree of
saturation Since the volumetric moisture capacity of air is around 10000 times smaller than the moisture capacity of paper the water vapor present in the air layer can be neglected The moisture content of book wb can then be written as
pppllb wSw 0 (22)
The effective moisture capacity of a book b is given by differentiating Equation (22)
with respect to RH
ppp
p
bbb h
w
w
w
h
w
(23)
9
Effective water vapor permeability of book [7] A book is considered as a periodic system of paper sheets and air layers We define a representative volume (REV) consisting of a half layer of paper and a half layer of air (Figure 13(a)) In this REV two different paths for water vapor transport exist (see Figure 13(a)) The first path describes water vapor transport in paper normal to the fore-edge of the book In the second path water vapor is transported parallel to the paper sheets through the air layer towards the inner part of the book and then adsorbed by paper in a direction normal to the sheet Air is characterized by a high water vapor permeability but very low moisture capacity This means that the water vapor transported via the air layer is not buffered by the air layer itself but will be almost immediately buffered by the paper sheets Due to the limited thickness of paper the moisture is quickly redistributed over the thickness and a one-dimensional moisture front is attained the moisture front advances parallel to the fore-edge of the book during moisture uptake So two different transport paths exist building up the same moisture front in the paper sheet This means that in a first approximation we can model the water vapor transport in book as a parallel system The water vapor permeability of this parallel system is given by
aappb (24)
with b p and a respectively the water vapor permeability of book paper and air We now introduce a factor so that
)()()( hhh pppb (25)
From Equation (24) and (25) we get pppp hhh 1)()()( (26)
Effective moisture buffering capacity of book The effective effusivity of a book is then equal to
satv
ppp
vsat
ppp
vsat
bbbm ppp
b
(27)
or
pmbm bb (28)
The factor is dependent on RH and the paper fraction We remark that it can be expected that the vapor permeability of paper is not isotropic especially when the surface has a glossy coating as for the magazine paper However due to the presence of air layers in a book the vapor flow through the air layers is dominant compared to the flow normal to the paper edge Therefore only a small error is introduced assuming isotropic behavior Validation To validate Equations (24) or (25) and (26) we simulate the two-dimensional water vapor transport in the REV taking into account as well vapor transport normal to the edge of the paper as vapor transport in the air layers The simulation model HAMFEM is used
10
[11] The loading consists in a stepwise adsorption from 054 to 0795 RH normal to the fore-edge of the book The surface mass transfer coefficient β equals 510-8 sm No flow conditions are considered at all other sides of the REV The thickness of one sheet of paper is 60 μm The thickness of the air layer is calculated from a paper fraction of Ψp = 06 For the paper the material properties of paper wallpaper 1 of the literature review are taken (see Table 1 and 2) For air the sorption curve is given by the ideal gas law and the water vapor permeability is taken to be the water vapor permeability of stagnant air δa = 19210-10 s No air transport is considered The temperature is constant at 23degC Figure 13(b) gives the time evolution of the average moisture content of the REV calculated with the 2D model This result is compared with a 1D calculation using effective transport properties as given by Equations (23) and (24) A good agreement is obtained with a maximal error less than 015 Simulations at other paper fractions give comparable good agreement For experimental validation of the proposed book model controlled moisture uptake experiments on small book specimens of the magazine paper are performed The experimental set-up of the Building Physics and Systems Unit of TUEindhoven is used [9] A book specimen with a high paper fraction (Ψp = 088) and one with a low paper fraction (Ψp = 055) are tested The dimension of the side open to the environment measures 004 x 004 msup2 The depth of the specimens is limited (002 m) in order the specimens will reach equilibrium in short time To obtain a uniform spacing between the paper sheets of the low paper fraction book specimen metal sheets with a thickness of 50 microm are placed between the paper sheets After pressing the specimen highly between plexiglass plates the lateral and bottom sides of the specimens are made vapor tight by applying a polyurethane sealant After drying of the sealant the metal paper sheets are removed The specimens are initially dried and then exposed to a RH of 054 until equilibrium is attained After reaching the equilibrium state a step change from 054 to 0795 is imposed Figure 14 gives the measurement results of the moisture uptake w=w-w0 Using the developed book model the moisture uptake curves are simulated using a surface mass transfer coefficient β of 210-7 sm for the high paper fraction book and a value of 110-8 sm for the low paper fraction book The lower transfer coefficient for the low paper fraction paper is attributed to the unevenness of the exposed surface of the low paper fraction specimen (we did not flatten the surface since this would influence the distance between the sheets) The transport properties of magazine paper for adsorption are used A good agreement between measurement and simulation is observed Discussion Finally we explain the measurements of Figure 12 using the book model From equations (27) and (28) we evaluate the effusivity of magazine and telephone book for the given paper fractions Figure 15 gives the effusivity for magazine at two paper fractions (Ψp = 086 Ψp = 051) and for telephone book at a paper fraction Ψp = 09 We observe that magazine and telephone book at high paper fraction have comparable effusivities although M paper is much more vapor tight than TB paper The high vapor resistance factor of M paper is compensated totally by the very high vapor permeability of the air layers This explains the comparable moisture uptake as observed in the experiment (see
11
Figure 12) The effusivity of the magazine at lower paper fraction is higher than the effusivity at high paper fraction which explains the fast moisture uptake for the low paper fraction book as observed in Figure 12 However the total moisture uptake will be lower than for the high paper fraction book since the total moisture content is dependent on the paper fraction as given by Equation (22)
CONCLUSIONS In this paper the moisture buffering of paper and books normal to the fore-edge is analyzed The literature review shows that different paper types show comparable moisture capacity but may show quite different water vapor permeability Paper shows hysteresis and a hysteresis model is presented which is based on the knowledge of the adsorption and desorption isotherm We found that the water vapor permeability of a hygroscopic material showing hysteresis like paper depends on the moisture content and not on the relative humidity Hysteresis leads to two opposite effects the material becomes more vapor open but shows less moisture capacity which means the effusivity might not change so much It was also indicated that using desorption instead of adsorption moisture properties the effusivity is over-predicted Experiments on book specimens show that the air layers between the paper sheets play an important role Vapor transport through the air layer leads to an increase of the effective vapor permeability The total amount of water vapor uptake however reduces due to the reduction of the paper volume at low paper fractions The experiments further show that although the water vapor permeability of paper can be quite different the moisture buffering capacity or effusivity of a book can remain comparable due to the presence of these vapor open air layers It was further found that the two-dimensional moisture transport in a book considered as a multilayered air-paper system can be modeled by a one-dimensional parallel transport system with a moisture capacity equal to the moisture capacity of the paper sheets The parallel system consists of a transport path in paper normal to the fore-edge of the book and a transport path through the air layers towards the paper The proposed homogeneous system stems from the fact that the air between the paper layers has almost no moisture capacity while the paper is in comparison a large moisture sink
REFERENCES 1 Carmeliet J Descamps F Houvenaghel G (1999) Multiscale network model for
simulating liquid water and water vapour transfer properties of porous materials Transport in Porous Media 35 67-88
2 Carmeliet J and Roels S (2001) Determination of the Isothermal Moisture Transport Properties of Porous building Materials Journal of Thermal Envelope and Building Science 24 183-210
12
3 Carmeliet J and Roels S (2002) Determination of the moisture capacity of porous building materials Journal of Thermal Envelope and Building Science 25(3) 209-237
4 Carmeliet J Hens H Roels S Adan O Brocken H Cerny R Pavlik Z Hall C Kumaran K Pel L (2004) Determination of the Liquid Water Diffusivity from Transient Moisture Transfer Experiments Journal of Thermal Envelope and Building Science 27(4) 277-305
5 Carmeliet J de Wit M and Janssen H (2005) Hysteresis and moisture buffering of wood Symposium of Building Physics in the Nordic Countries June 13-15 2005 Reykjavik Iceland pp55-62
6 Chatterjee SG (2001) Comparison of Domain and Similarity Models for Characterizing Moisture Sorption Equilibria of Paper Industrial and Engineering Chemical Research 40 188-194
7 Derluyn H (2006) Role of textiles and paper for stabilizing the indoor environment MScthesis Katholieke Universiteit Leuven Leuven Belgium (httpwwwkuleuvenbebwfengteaching_msctheses)
8 EN ISO 12572 (2001) Hygrothermal performance of building materials and products ndash Determination of water vapour transmission properties
9 Goossens E (2003) Moisture transfer properties of coated gypsum PhD-thesis TUe Eindhoven The Netherlands
10 Gupta H Chatterjee SG (2003) Parallel Diffusion of Moisture in Paper Part 1 Steady-State Conditions Industrial and Engineering Chemical Research 42 6582-6592
11 Janssen H Carmeliet J Hens H (2004) The influence of soil moisture transfer on building heat loss via the ground Buildings and Environment 39(7) 825-836
12 Kumaran K (1996) International Energy Agency Condensation and energy ndash Catalogue of material properties Report Annex 24 Volume 3 Energy conservation in buildings
13 Motta Lima OC Monteiro AS Pereira NC Mendes ES (2003) Moisture Equilibrium Isotherms for a Commercial Liquid Package Paper Drying Technology 21(10) 1909-1922
14 Mualem Y (1974) A conceptual model of hysteresis Water Resources research 10(3) 514-520
15 Ramarao BV Massoquete A Lavrykov S and Ramaswamy S (2003) Moisture Diffusion Inside Paper Materials in the Hygroscopic Range and Characteristics of Diffusivity Parameters Drying Technology 21(10) 2007-2056
16 Roels S Carmeliet J Hens H Adan O Brocken H Cerny R Pavlik Z Ellis AT Hall C Kumaran K Pel L Plagge R (2004) A comparison of Different Techniques to Quantify Moisture Content Profiles in Porous Building Materials Journal of Thermal Envelope and Building Science 27(4) 261-276
17 Roels S Carmeliet J Hens H Adan O Brocken H Cerny R Pavlik Z Hall C Kumaran K Pel L Plagge R (2004) Interlaboratory Comparison of Hygric Properties of Porous Building Materials Journal of Thermal Envelope and Building Science 27(4) 307-325
13
Table 1 Parameters for adsorption isotherms for different types of paper
Figure 3 Moisture transport properties of different paper types
18
(a)
0
40
80
120
160
01 03 05 07 09
Relative humidity (-)
Moi
stur
e co
nten
t (kg
msup3)
analytical fit
measurements
adsorption measurements
(b)
0
40
80
120
160
01 03 05 07 09
Relative humidity (-)
Moi
stur
e co
nten
t (kg
msup3)
analytical fit
measurements
adsorption measurements
Figure 4 Main adsorption and primary desorption data for telephone book (TB) paper (a) and magazine (M) paper (b) Thick solid line analytical fit of main adsorption isotherm
19
(a)
0
200
400
01 03 05 07 09
Relative humidity (-)
Mo
istu
re c
apac
ity (
kgm
sup3)
telephone book paper
magazine paper
(b)
0
200
400
600
800
01 03 05 07 09
Relative humidity (-)
Vap
or r
esis
tanc
e fa
cto
r (-
)
telephone book paper
magazine paper
Figure 5 Moisture capacity (a) and vapor resistance factor (b) of telephone book (TB) paper and magazine (M) paper compared with literature data (in gray for data specifications see Table 1 and 2)
20
(a)
0
20
40
60
80
100
120
01 03 05 07 09
Relative humidity (-)
Vap
or
resi
sta
nce
fact
or
(-)
0
10
20
30
40
50
Difference (
)method 1
method 2
difference
(b)
0
100
200
300
400
500
600
700
01 03 05 07 09
Relative humidity (-)
Vap
or r
esis
tanc
e fa
ctor
(-)
0
10
20
30
40
50
Difference (
)
method 1
method 2
difference
Figure 6 Vapor resistance factor of telephone book (TB) paper (a) and magazine (M) paper (b) determined by method 1 (Equation (6)) and method 2 (Equation (9))
21
(a)
0 10
1 a
f
main adsorption
(b) main desorption
0 10
1 a
f
(c)
0 10
1 a
f
primary desorption
1
(d)
0 10
1 a
f
primary adsorption
1
1
Figure 7 Main adsorption main desorption primary desorption primary adsorption processes represented in the f-a space where f represents the sorption sites and a the accessibility function (a)
0
40
80
120
160
01 03 05 07 09
Relative humidity (-)
Moi
stur
e co
nten
t (kg
msup3)
Mualem model
primary desorption measurements
adsorption measurements
(b)
0
40
80
120
160
01 03 05 07 09
Relative humidity (-)
Mo
istu
re c
on
ten
t (kg
msup3)
Mualem modelprimary desorption measurements
adsorption measurements
Figure 8 Comparison of measured primary desorption curves (bullets and dotted line) with model predictions (solid lines) Squares represent the measured adsorption curves (a) telephone book (TB) paper and (b) magazine (M) paper
22
0
02
04
06
08
1
Loading protocol
Rel
ativ
e h
umid
ity (
-)
Figure 9 Relative humidity loading protocol
23
(a)
0
40
80
120
160
0 02 04 06 08 1
Relative humidity (-)
Moi
stur
e c
onte
nt (
kgm
sup3)
hysteresis
desorption
adsorption
(b)
0
20
40
60
80
100
120
0 02 04 06 08 1
Relative humidity (-)
Wa
ter
vap
or
resi
sta
nce
fact
or
(-) hysteresis
desorption
adsorption
(c)
0
200
400
600
0 02 04 06 08 1
Relative humidity (-)
Moi
stur
e ca
paci
ty (
kgm
sup3)
hysteresis
adsorption
desorption
(d)
00E+00
50E-07
10E-06
15E-06
20E-06
0 02 04 06 08 1
Relative humidity (-)
Effu
sivi
ty (
kg(
msup2
Pa
s05 ))
hysteresis
desorption
adsorption
Figure 10 Hysteretic loops and main adsorption and desorption curves of loading protocol for the sorption isotherms (a) water vapor resistance factor (b) moisture capacity (c) and effusivity (d)
24
(a)
00E+00
50E-07
10E-06
15E-06
20E-06
25E-06
01 03 05 07 09
Relative humidity (-)
Effu
sivi
ty (
kg(
msup2
Pa
s0
5 ))
desorptionadsorptionmixed
(b)
00
40
80
120
0 50 100 150 200
Time (h)
Moi
stur
e re
leas
e (k
gm
sup3)
desorptionadsorptionmixed
Figure 11 Effusivity (a) and moisture release (RH from 08 to 05) (b) of telephone book paper for three settings of paper properties
25
(a)
0
5
10
15
20
25
0 100 200 300 400 500 600
Time (h)
Moi
stu
re u
ptak
e (k
gm
sup3)
magazine book
telephone book
p=51
p=86
p=90
Figure 12 Moisture uptake by magazine and telephone book for different paper fractions
26
(a)
(b)
0
10
20
30
40
0 480 960 1440 1920 2400
Time (h)
000
005
010
015
Diffe
rence
()
real book simulationeffective book simulationdifference
Mo
istu
re u
pta
ke (
kgm
sup3)
Figure 13 (a) Moisture transport paths in a book (b) real and effective telephone book simulation Ψp 60
pape
r
air
pape
r
air
pape
r
fore-edge of book
path 1 path 2
REV
moisture flow
27
0
5
10
15
20
25
30
35
0 100 200 300
Time (h)
Mo
istu
re u
ptak
e (k
gm
sup3)
magazine book measurement data
magazine book simulation
p=88
p=55
Figure 14 Simulating measured hygroscopic behavior of magazine book specimens with effective book model
0E+00
1E-06
2E-06
3E-06
4E-06
0 02 04 06 08 1
Relative humidity (-)
Effu
sivi
ty (
kg(
msup2
Pa
s05
))
magazine booktelephone book
p=51
p=86
p=90
Figure 15 Effusivity of magazine book and telephone book in adsorption
5
Knowing that in steady state gv is constant and using Equation (5) for the nonlinear water vapor permeability we get after integration
12
12chch
avsatv eec
bhhapdg (9)
The parameters a b and c can be determined based on the three measurements of the vapor flow (see Table 3) Figures 6(a) and 6(b) compare the water vapor resistance factor as determined by the two methods for TB and M paper We observe that method 1 under predicts the water vapor resistance factors at higher RH For TB paper the relative difference (micro2-micro1)micro2 given in dotted line increases to 15 at RH=1 while for M paper which is more vapor tight the difference increases to 23 Figure 5(b) compares the water vapor resistance factor of TB paper and M paper with data from literature TB paper is rather vapor open and the dependence on RH is analogue to the literature data M paper is quite vapor tight and remains more vapor tight with increasing RH compared to the literature data Hysteresis model for paper We present a model for hysteretic hygroscopic behavior [5] which is based on the concept originally presented by Mualem [14] for soils To describe the history of an
adsorptiondesorption process we use the Enderbyrsquos notation For example 32
1 hh
hw describes a loading protocol going from a lower RH h1 up to h2 and again down to h3 In adsorption we assume that all possible sorption sites in the porous material are accessible The possible sorption sites are distributed according to a function f(h) A sorption site will be filled above a critical RH The main adsorption curve is then given by
)()()()(0
0
Fdhhfww ad (10)
or the main adsorption curve equals the integral of the distribution f(h) In desorption a sorption site can only become unfilled when the pore entry of the pore becomes unfilled We assume that different pores do not interact with each other The accessibility to the sorption sites is described by a normalized accessibility function a(h) Sorption processes can be schematically represented in a f-a space The f-axis gives the possible sorption sites while the ordinate represents the accessibility function Integration in the f-a space makes it possible to calculate the moisture content by multiplying the possible filled sorption sites with their accessibility The main adsorption curve is given by (see Figure 7(a))
)()1()()()()()(0
1
0
0
FAFdhhadhhfww ad (11)
The integral over the total range of the accessibility function (from 0 to 1) indicates that all pores are accessible during adsorption Since a(h) is normalized A(1)=1 During desorption to a relative humidity the pores accessible between max and will desorb According to Figure 7(b) the moisture content during main desorption is given by
6
1
maxmax )())(()(max
dhhawwwww addeh (12)
or
)())(()(
)(1))(()(
max
maxmaxmax
Awww
Awwwww
adad
addeh
(13)
The equation shows that the integral of the accessibility function A() can be determined from the main adsorption and main desorption curve or
)(
)()()(
max
ad
adde
ww
wwA
(14)
The process of primary desorption (desorption from the main adsorption curve) is given in Figure 7(c) Integration in the f-a space gives
)())()(()( 101 Awhwww adadad
h (15)
The process of primary adsorption (adsorption from the main desorption curve) is given in Figure 7(d) Integration in the f-a space gives
)())(()( 1max0 1max hAwwww adadh
h (16)
Formulas for adsorption or desorption after a series of alternating processes of adsorption or desorption can also be derived by integrating in the f-a space Figures 8(a) and 8(b) compare the measured and calculated primary desorption curves for TB and M paper The parameters used to describe the main adsorption and desorption curves are given in Table 3 We observe in Figures 8(a) and 8(b) that at lower RH the primary desorption curves are well described At higher RH there is less agreement between measurements and the hysteresis model Nevertheless the advantage of the present hysteresis model is that only the main adsorption and desorption curves are needed Water vapor permeability The nonlinear water vapor permeability for non-hysteretic materials is commonly described as function of the relative humidity (see Equation (5)) The increase of the water vapor permeability at high relative humidity is commonly explained by the fact that microscopic liquid water transport in filled pores enhances the apparent water vapor transport This means that the apparent water vapor diffusion coefficient should not depend on the relative humidity but on the degree of saturation Sl=w(h)wmax The equation for the water vapor permeability then reads
)()()( 0
l
al
al S
SfS
(17)
with the tortuosity and 0 the open porosity In the performed cup tests the water vapor resistance factor is measured in the adsorption regime since the specimens were dried first and then installed into the cup (this is a slight deviation of the EN ISO standard in order to know the sorption regime of the measurement) The measurement data are fitted by the function ad(h) using Equation (5) Using the inverse of the main adsorption isotherm wad(h) we get
)()( 1ladadl SwS (18)
7
As example we analyze the material response during a RH loading protocol as given in Figure (9) The material is TB paper In figures 10(a)-(d) the hysteretic loops as well as the main adsorption and desorption curves are given for respectively the sorption isotherm (a) the water vapor resistance factor (b) the moisture capacity (c) and effusivity (d) We observe that after the cycling the material behavior evolves to an almost single curve For the sorption isotherm and water vapor resistance factor this curve is an intermediate curve between main adsorption and desorption curve The hysteretic material is thus more vapor open than the material in adsorption but more vapor tight than the material in desorption We observe in Figure 10(c) that the hysteretic material has after cycling a slightly lower moisture capacity than in adsorption but that the moisture capacity is much lower than in desorption In Figure 10(d) we see that with cyclic loading the effusivity comes close to the adsorption effusivity This is logical since hysteresis leads to two opposite effects the material becomes more vapor open than in the adsorption state but has less moisture capacity than in adsorption which means the effusivity might not change so much When we simulate the main desorption process desorption transport properties should be chosen We analyze what the influence is on the results when adsorption properties are used instead of desorption properties We distinguish three cases (1) desorption transport properties which is the reference case (2) adsorption transport properties (adsorption case) (3) desorption moisture capacity but adsorption water vapor resistance factor (mixed case) Figure 11(a) gives the effusivity for the three cases We observe that the mixed case under predicts the desorption effusivity With adsorption properties the effusivity is over predicted at high RH and under predicted at lower RH As example we simulate the desorption process for a step change from 08 to 05 RH The water vapor transport is one dimensional The water vapor surface coefficient = 510-8 sm The moisture transport properties of TB paper are used Figure 11(b) gives the moisture release w=w0-w with w0 the initial moisture content at RH=08 The adsorption and mixed case under predict w since the effusivity is under predicted in the RH range [05 08]
MODELLING OF THE HYGROSCOPIC BEHAVIOR OF BOOKS Hygroscopic behavior of books A book is defined as a number of sheets of paper with air layers in between The total volume of the book is patot VVV (a = air layer p = paper layer) The paper fractions in
the book Ψp [-] and Ψa [-] are defined as
ptot
ptota
tot
pp V
VV
V
V
1 (19)
The hygroscopic behavior is measured exposing book specimens to a step change in RH The experimental set-up of the Building Physics and Systems Unit of TUEindhoven is used [9] A book specimen consists of a number of paper sheets (005x 005 msup2) which
8
are placed in a sample holder of the form of a small box with five plexiglass sides The open side with all the sheet edges regularly spaced mimics the fore-edge of a book Two paper fractions for magazine book are used high (Ψp = 086) and low (Ψp = 051) Also a telephone book specimen with a paper fraction Ψp = 09 is measured After reaching equilibrium at RH=054 a step change from 054 to 0795 is imposed Moisture uptake is possible only through the open side which means uptake parallel to the paper sheets Figure 12 gives the moisture uptake w=w-w0 versus time for the three book specimens with w0 the initial moisture content at RH=054 Although the magazine paper is more vapor tight than the telephone book paper the two book specimen with high paper fraction show a similar uptake behavior The moisture uptake of the low paper fraction book is lower than the high paper fraction book The low paper fraction book will however attain equilibrium faster compared to the high paper fraction book This means that due to the presence of air layers between the paper sheets the low paper fraction book is characterized by a higher effective permeability and lower effective moisture capacity compared to high paper fraction book specimens In the next section we formulate a model to predict the effective moisture transport properties of books The model will then be used to explain the comparable behavior of the high paper fraction magazine and the telephone book specimens although the papers of each book show quite a different water vapor permeability Effective moisture transport properties of books We assume the paper to be a homogeneous and isotropic material Effective density of book The dry density of a book b [kgmsup3] is given by
apppaappb 1 (20)
with p the dry density of the paper and a the density of air Effective moisture capacity of book The moisture content of a sheet of paper is defined as
llp Sw 0 (21)
with l the density of the liquid 0 the open porosity of the paper and Sl the degree of
saturation Since the volumetric moisture capacity of air is around 10000 times smaller than the moisture capacity of paper the water vapor present in the air layer can be neglected The moisture content of book wb can then be written as
pppllb wSw 0 (22)
The effective moisture capacity of a book b is given by differentiating Equation (22)
with respect to RH
ppp
p
bbb h
w
w
w
h
w
(23)
9
Effective water vapor permeability of book [7] A book is considered as a periodic system of paper sheets and air layers We define a representative volume (REV) consisting of a half layer of paper and a half layer of air (Figure 13(a)) In this REV two different paths for water vapor transport exist (see Figure 13(a)) The first path describes water vapor transport in paper normal to the fore-edge of the book In the second path water vapor is transported parallel to the paper sheets through the air layer towards the inner part of the book and then adsorbed by paper in a direction normal to the sheet Air is characterized by a high water vapor permeability but very low moisture capacity This means that the water vapor transported via the air layer is not buffered by the air layer itself but will be almost immediately buffered by the paper sheets Due to the limited thickness of paper the moisture is quickly redistributed over the thickness and a one-dimensional moisture front is attained the moisture front advances parallel to the fore-edge of the book during moisture uptake So two different transport paths exist building up the same moisture front in the paper sheet This means that in a first approximation we can model the water vapor transport in book as a parallel system The water vapor permeability of this parallel system is given by
aappb (24)
with b p and a respectively the water vapor permeability of book paper and air We now introduce a factor so that
)()()( hhh pppb (25)
From Equation (24) and (25) we get pppp hhh 1)()()( (26)
Effective moisture buffering capacity of book The effective effusivity of a book is then equal to
satv
ppp
vsat
ppp
vsat
bbbm ppp
b
(27)
or
pmbm bb (28)
The factor is dependent on RH and the paper fraction We remark that it can be expected that the vapor permeability of paper is not isotropic especially when the surface has a glossy coating as for the magazine paper However due to the presence of air layers in a book the vapor flow through the air layers is dominant compared to the flow normal to the paper edge Therefore only a small error is introduced assuming isotropic behavior Validation To validate Equations (24) or (25) and (26) we simulate the two-dimensional water vapor transport in the REV taking into account as well vapor transport normal to the edge of the paper as vapor transport in the air layers The simulation model HAMFEM is used
10
[11] The loading consists in a stepwise adsorption from 054 to 0795 RH normal to the fore-edge of the book The surface mass transfer coefficient β equals 510-8 sm No flow conditions are considered at all other sides of the REV The thickness of one sheet of paper is 60 μm The thickness of the air layer is calculated from a paper fraction of Ψp = 06 For the paper the material properties of paper wallpaper 1 of the literature review are taken (see Table 1 and 2) For air the sorption curve is given by the ideal gas law and the water vapor permeability is taken to be the water vapor permeability of stagnant air δa = 19210-10 s No air transport is considered The temperature is constant at 23degC Figure 13(b) gives the time evolution of the average moisture content of the REV calculated with the 2D model This result is compared with a 1D calculation using effective transport properties as given by Equations (23) and (24) A good agreement is obtained with a maximal error less than 015 Simulations at other paper fractions give comparable good agreement For experimental validation of the proposed book model controlled moisture uptake experiments on small book specimens of the magazine paper are performed The experimental set-up of the Building Physics and Systems Unit of TUEindhoven is used [9] A book specimen with a high paper fraction (Ψp = 088) and one with a low paper fraction (Ψp = 055) are tested The dimension of the side open to the environment measures 004 x 004 msup2 The depth of the specimens is limited (002 m) in order the specimens will reach equilibrium in short time To obtain a uniform spacing between the paper sheets of the low paper fraction book specimen metal sheets with a thickness of 50 microm are placed between the paper sheets After pressing the specimen highly between plexiglass plates the lateral and bottom sides of the specimens are made vapor tight by applying a polyurethane sealant After drying of the sealant the metal paper sheets are removed The specimens are initially dried and then exposed to a RH of 054 until equilibrium is attained After reaching the equilibrium state a step change from 054 to 0795 is imposed Figure 14 gives the measurement results of the moisture uptake w=w-w0 Using the developed book model the moisture uptake curves are simulated using a surface mass transfer coefficient β of 210-7 sm for the high paper fraction book and a value of 110-8 sm for the low paper fraction book The lower transfer coefficient for the low paper fraction paper is attributed to the unevenness of the exposed surface of the low paper fraction specimen (we did not flatten the surface since this would influence the distance between the sheets) The transport properties of magazine paper for adsorption are used A good agreement between measurement and simulation is observed Discussion Finally we explain the measurements of Figure 12 using the book model From equations (27) and (28) we evaluate the effusivity of magazine and telephone book for the given paper fractions Figure 15 gives the effusivity for magazine at two paper fractions (Ψp = 086 Ψp = 051) and for telephone book at a paper fraction Ψp = 09 We observe that magazine and telephone book at high paper fraction have comparable effusivities although M paper is much more vapor tight than TB paper The high vapor resistance factor of M paper is compensated totally by the very high vapor permeability of the air layers This explains the comparable moisture uptake as observed in the experiment (see
11
Figure 12) The effusivity of the magazine at lower paper fraction is higher than the effusivity at high paper fraction which explains the fast moisture uptake for the low paper fraction book as observed in Figure 12 However the total moisture uptake will be lower than for the high paper fraction book since the total moisture content is dependent on the paper fraction as given by Equation (22)
CONCLUSIONS In this paper the moisture buffering of paper and books normal to the fore-edge is analyzed The literature review shows that different paper types show comparable moisture capacity but may show quite different water vapor permeability Paper shows hysteresis and a hysteresis model is presented which is based on the knowledge of the adsorption and desorption isotherm We found that the water vapor permeability of a hygroscopic material showing hysteresis like paper depends on the moisture content and not on the relative humidity Hysteresis leads to two opposite effects the material becomes more vapor open but shows less moisture capacity which means the effusivity might not change so much It was also indicated that using desorption instead of adsorption moisture properties the effusivity is over-predicted Experiments on book specimens show that the air layers between the paper sheets play an important role Vapor transport through the air layer leads to an increase of the effective vapor permeability The total amount of water vapor uptake however reduces due to the reduction of the paper volume at low paper fractions The experiments further show that although the water vapor permeability of paper can be quite different the moisture buffering capacity or effusivity of a book can remain comparable due to the presence of these vapor open air layers It was further found that the two-dimensional moisture transport in a book considered as a multilayered air-paper system can be modeled by a one-dimensional parallel transport system with a moisture capacity equal to the moisture capacity of the paper sheets The parallel system consists of a transport path in paper normal to the fore-edge of the book and a transport path through the air layers towards the paper The proposed homogeneous system stems from the fact that the air between the paper layers has almost no moisture capacity while the paper is in comparison a large moisture sink
REFERENCES 1 Carmeliet J Descamps F Houvenaghel G (1999) Multiscale network model for
simulating liquid water and water vapour transfer properties of porous materials Transport in Porous Media 35 67-88
2 Carmeliet J and Roels S (2001) Determination of the Isothermal Moisture Transport Properties of Porous building Materials Journal of Thermal Envelope and Building Science 24 183-210
12
3 Carmeliet J and Roels S (2002) Determination of the moisture capacity of porous building materials Journal of Thermal Envelope and Building Science 25(3) 209-237
4 Carmeliet J Hens H Roels S Adan O Brocken H Cerny R Pavlik Z Hall C Kumaran K Pel L (2004) Determination of the Liquid Water Diffusivity from Transient Moisture Transfer Experiments Journal of Thermal Envelope and Building Science 27(4) 277-305
5 Carmeliet J de Wit M and Janssen H (2005) Hysteresis and moisture buffering of wood Symposium of Building Physics in the Nordic Countries June 13-15 2005 Reykjavik Iceland pp55-62
6 Chatterjee SG (2001) Comparison of Domain and Similarity Models for Characterizing Moisture Sorption Equilibria of Paper Industrial and Engineering Chemical Research 40 188-194
7 Derluyn H (2006) Role of textiles and paper for stabilizing the indoor environment MScthesis Katholieke Universiteit Leuven Leuven Belgium (httpwwwkuleuvenbebwfengteaching_msctheses)
8 EN ISO 12572 (2001) Hygrothermal performance of building materials and products ndash Determination of water vapour transmission properties
9 Goossens E (2003) Moisture transfer properties of coated gypsum PhD-thesis TUe Eindhoven The Netherlands
10 Gupta H Chatterjee SG (2003) Parallel Diffusion of Moisture in Paper Part 1 Steady-State Conditions Industrial and Engineering Chemical Research 42 6582-6592
11 Janssen H Carmeliet J Hens H (2004) The influence of soil moisture transfer on building heat loss via the ground Buildings and Environment 39(7) 825-836
12 Kumaran K (1996) International Energy Agency Condensation and energy ndash Catalogue of material properties Report Annex 24 Volume 3 Energy conservation in buildings
13 Motta Lima OC Monteiro AS Pereira NC Mendes ES (2003) Moisture Equilibrium Isotherms for a Commercial Liquid Package Paper Drying Technology 21(10) 1909-1922
14 Mualem Y (1974) A conceptual model of hysteresis Water Resources research 10(3) 514-520
15 Ramarao BV Massoquete A Lavrykov S and Ramaswamy S (2003) Moisture Diffusion Inside Paper Materials in the Hygroscopic Range and Characteristics of Diffusivity Parameters Drying Technology 21(10) 2007-2056
16 Roels S Carmeliet J Hens H Adan O Brocken H Cerny R Pavlik Z Ellis AT Hall C Kumaran K Pel L Plagge R (2004) A comparison of Different Techniques to Quantify Moisture Content Profiles in Porous Building Materials Journal of Thermal Envelope and Building Science 27(4) 261-276
17 Roels S Carmeliet J Hens H Adan O Brocken H Cerny R Pavlik Z Hall C Kumaran K Pel L Plagge R (2004) Interlaboratory Comparison of Hygric Properties of Porous Building Materials Journal of Thermal Envelope and Building Science 27(4) 307-325
13
Table 1 Parameters for adsorption isotherms for different types of paper
Figure 3 Moisture transport properties of different paper types
18
(a)
0
40
80
120
160
01 03 05 07 09
Relative humidity (-)
Moi
stur
e co
nten
t (kg
msup3)
analytical fit
measurements
adsorption measurements
(b)
0
40
80
120
160
01 03 05 07 09
Relative humidity (-)
Moi
stur
e co
nten
t (kg
msup3)
analytical fit
measurements
adsorption measurements
Figure 4 Main adsorption and primary desorption data for telephone book (TB) paper (a) and magazine (M) paper (b) Thick solid line analytical fit of main adsorption isotherm
19
(a)
0
200
400
01 03 05 07 09
Relative humidity (-)
Mo
istu
re c
apac
ity (
kgm
sup3)
telephone book paper
magazine paper
(b)
0
200
400
600
800
01 03 05 07 09
Relative humidity (-)
Vap
or r
esis
tanc
e fa
cto
r (-
)
telephone book paper
magazine paper
Figure 5 Moisture capacity (a) and vapor resistance factor (b) of telephone book (TB) paper and magazine (M) paper compared with literature data (in gray for data specifications see Table 1 and 2)
20
(a)
0
20
40
60
80
100
120
01 03 05 07 09
Relative humidity (-)
Vap
or
resi
sta
nce
fact
or
(-)
0
10
20
30
40
50
Difference (
)method 1
method 2
difference
(b)
0
100
200
300
400
500
600
700
01 03 05 07 09
Relative humidity (-)
Vap
or r
esis
tanc
e fa
ctor
(-)
0
10
20
30
40
50
Difference (
)
method 1
method 2
difference
Figure 6 Vapor resistance factor of telephone book (TB) paper (a) and magazine (M) paper (b) determined by method 1 (Equation (6)) and method 2 (Equation (9))
21
(a)
0 10
1 a
f
main adsorption
(b) main desorption
0 10
1 a
f
(c)
0 10
1 a
f
primary desorption
1
(d)
0 10
1 a
f
primary adsorption
1
1
Figure 7 Main adsorption main desorption primary desorption primary adsorption processes represented in the f-a space where f represents the sorption sites and a the accessibility function (a)
0
40
80
120
160
01 03 05 07 09
Relative humidity (-)
Moi
stur
e co
nten
t (kg
msup3)
Mualem model
primary desorption measurements
adsorption measurements
(b)
0
40
80
120
160
01 03 05 07 09
Relative humidity (-)
Mo
istu
re c
on
ten
t (kg
msup3)
Mualem modelprimary desorption measurements
adsorption measurements
Figure 8 Comparison of measured primary desorption curves (bullets and dotted line) with model predictions (solid lines) Squares represent the measured adsorption curves (a) telephone book (TB) paper and (b) magazine (M) paper
22
0
02
04
06
08
1
Loading protocol
Rel
ativ
e h
umid
ity (
-)
Figure 9 Relative humidity loading protocol
23
(a)
0
40
80
120
160
0 02 04 06 08 1
Relative humidity (-)
Moi
stur
e c
onte
nt (
kgm
sup3)
hysteresis
desorption
adsorption
(b)
0
20
40
60
80
100
120
0 02 04 06 08 1
Relative humidity (-)
Wa
ter
vap
or
resi
sta
nce
fact
or
(-) hysteresis
desorption
adsorption
(c)
0
200
400
600
0 02 04 06 08 1
Relative humidity (-)
Moi
stur
e ca
paci
ty (
kgm
sup3)
hysteresis
adsorption
desorption
(d)
00E+00
50E-07
10E-06
15E-06
20E-06
0 02 04 06 08 1
Relative humidity (-)
Effu
sivi
ty (
kg(
msup2
Pa
s05 ))
hysteresis
desorption
adsorption
Figure 10 Hysteretic loops and main adsorption and desorption curves of loading protocol for the sorption isotherms (a) water vapor resistance factor (b) moisture capacity (c) and effusivity (d)
24
(a)
00E+00
50E-07
10E-06
15E-06
20E-06
25E-06
01 03 05 07 09
Relative humidity (-)
Effu
sivi
ty (
kg(
msup2
Pa
s0
5 ))
desorptionadsorptionmixed
(b)
00
40
80
120
0 50 100 150 200
Time (h)
Moi
stur
e re
leas
e (k
gm
sup3)
desorptionadsorptionmixed
Figure 11 Effusivity (a) and moisture release (RH from 08 to 05) (b) of telephone book paper for three settings of paper properties
25
(a)
0
5
10
15
20
25
0 100 200 300 400 500 600
Time (h)
Moi
stu
re u
ptak
e (k
gm
sup3)
magazine book
telephone book
p=51
p=86
p=90
Figure 12 Moisture uptake by magazine and telephone book for different paper fractions
26
(a)
(b)
0
10
20
30
40
0 480 960 1440 1920 2400
Time (h)
000
005
010
015
Diffe
rence
()
real book simulationeffective book simulationdifference
Mo
istu
re u
pta
ke (
kgm
sup3)
Figure 13 (a) Moisture transport paths in a book (b) real and effective telephone book simulation Ψp 60
pape
r
air
pape
r
air
pape
r
fore-edge of book
path 1 path 2
REV
moisture flow
27
0
5
10
15
20
25
30
35
0 100 200 300
Time (h)
Mo
istu
re u
ptak
e (k
gm
sup3)
magazine book measurement data
magazine book simulation
p=88
p=55
Figure 14 Simulating measured hygroscopic behavior of magazine book specimens with effective book model
0E+00
1E-06
2E-06
3E-06
4E-06
0 02 04 06 08 1
Relative humidity (-)
Effu
sivi
ty (
kg(
msup2
Pa
s05
))
magazine booktelephone book
p=51
p=86
p=90
Figure 15 Effusivity of magazine book and telephone book in adsorption
10
[11] The loading consists in a stepwise adsorption from 054 to 0795 RH normal to the fore-edge of the book The surface mass transfer coefficient β equals 510-8 sm No flow conditions are considered at all other sides of the REV The thickness of one sheet of paper is 60 μm The thickness of the air layer is calculated from a paper fraction of Ψp = 06 For the paper the material properties of paper wallpaper 1 of the literature review are taken (see Table 1 and 2) For air the sorption curve is given by the ideal gas law and the water vapor permeability is taken to be the water vapor permeability of stagnant air δa = 19210-10 s No air transport is considered The temperature is constant at 23degC Figure 13(b) gives the time evolution of the average moisture content of the REV calculated with the 2D model This result is compared with a 1D calculation using effective transport properties as given by Equations (23) and (24) A good agreement is obtained with a maximal error less than 015 Simulations at other paper fractions give comparable good agreement For experimental validation of the proposed book model controlled moisture uptake experiments on small book specimens of the magazine paper are performed The experimental set-up of the Building Physics and Systems Unit of TUEindhoven is used [9] A book specimen with a high paper fraction (Ψp = 088) and one with a low paper fraction (Ψp = 055) are tested The dimension of the side open to the environment measures 004 x 004 msup2 The depth of the specimens is limited (002 m) in order the specimens will reach equilibrium in short time To obtain a uniform spacing between the paper sheets of the low paper fraction book specimen metal sheets with a thickness of 50 microm are placed between the paper sheets After pressing the specimen highly between plexiglass plates the lateral and bottom sides of the specimens are made vapor tight by applying a polyurethane sealant After drying of the sealant the metal paper sheets are removed The specimens are initially dried and then exposed to a RH of 054 until equilibrium is attained After reaching the equilibrium state a step change from 054 to 0795 is imposed Figure 14 gives the measurement results of the moisture uptake w=w-w0 Using the developed book model the moisture uptake curves are simulated using a surface mass transfer coefficient β of 210-7 sm for the high paper fraction book and a value of 110-8 sm for the low paper fraction book The lower transfer coefficient for the low paper fraction paper is attributed to the unevenness of the exposed surface of the low paper fraction specimen (we did not flatten the surface since this would influence the distance between the sheets) The transport properties of magazine paper for adsorption are used A good agreement between measurement and simulation is observed Discussion Finally we explain the measurements of Figure 12 using the book model From equations (27) and (28) we evaluate the effusivity of magazine and telephone book for the given paper fractions Figure 15 gives the effusivity for magazine at two paper fractions (Ψp = 086 Ψp = 051) and for telephone book at a paper fraction Ψp = 09 We observe that magazine and telephone book at high paper fraction have comparable effusivities although M paper is much more vapor tight than TB paper The high vapor resistance factor of M paper is compensated totally by the very high vapor permeability of the air layers This explains the comparable moisture uptake as observed in the experiment (see
11
Figure 12) The effusivity of the magazine at lower paper fraction is higher than the effusivity at high paper fraction which explains the fast moisture uptake for the low paper fraction book as observed in Figure 12 However the total moisture uptake will be lower than for the high paper fraction book since the total moisture content is dependent on the paper fraction as given by Equation (22)
CONCLUSIONS In this paper the moisture buffering of paper and books normal to the fore-edge is analyzed The literature review shows that different paper types show comparable moisture capacity but may show quite different water vapor permeability Paper shows hysteresis and a hysteresis model is presented which is based on the knowledge of the adsorption and desorption isotherm We found that the water vapor permeability of a hygroscopic material showing hysteresis like paper depends on the moisture content and not on the relative humidity Hysteresis leads to two opposite effects the material becomes more vapor open but shows less moisture capacity which means the effusivity might not change so much It was also indicated that using desorption instead of adsorption moisture properties the effusivity is over-predicted Experiments on book specimens show that the air layers between the paper sheets play an important role Vapor transport through the air layer leads to an increase of the effective vapor permeability The total amount of water vapor uptake however reduces due to the reduction of the paper volume at low paper fractions The experiments further show that although the water vapor permeability of paper can be quite different the moisture buffering capacity or effusivity of a book can remain comparable due to the presence of these vapor open air layers It was further found that the two-dimensional moisture transport in a book considered as a multilayered air-paper system can be modeled by a one-dimensional parallel transport system with a moisture capacity equal to the moisture capacity of the paper sheets The parallel system consists of a transport path in paper normal to the fore-edge of the book and a transport path through the air layers towards the paper The proposed homogeneous system stems from the fact that the air between the paper layers has almost no moisture capacity while the paper is in comparison a large moisture sink
REFERENCES 1 Carmeliet J Descamps F Houvenaghel G (1999) Multiscale network model for
simulating liquid water and water vapour transfer properties of porous materials Transport in Porous Media 35 67-88
2 Carmeliet J and Roels S (2001) Determination of the Isothermal Moisture Transport Properties of Porous building Materials Journal of Thermal Envelope and Building Science 24 183-210
12
3 Carmeliet J and Roels S (2002) Determination of the moisture capacity of porous building materials Journal of Thermal Envelope and Building Science 25(3) 209-237
4 Carmeliet J Hens H Roels S Adan O Brocken H Cerny R Pavlik Z Hall C Kumaran K Pel L (2004) Determination of the Liquid Water Diffusivity from Transient Moisture Transfer Experiments Journal of Thermal Envelope and Building Science 27(4) 277-305
5 Carmeliet J de Wit M and Janssen H (2005) Hysteresis and moisture buffering of wood Symposium of Building Physics in the Nordic Countries June 13-15 2005 Reykjavik Iceland pp55-62
6 Chatterjee SG (2001) Comparison of Domain and Similarity Models for Characterizing Moisture Sorption Equilibria of Paper Industrial and Engineering Chemical Research 40 188-194
7 Derluyn H (2006) Role of textiles and paper for stabilizing the indoor environment MScthesis Katholieke Universiteit Leuven Leuven Belgium (httpwwwkuleuvenbebwfengteaching_msctheses)
8 EN ISO 12572 (2001) Hygrothermal performance of building materials and products ndash Determination of water vapour transmission properties
9 Goossens E (2003) Moisture transfer properties of coated gypsum PhD-thesis TUe Eindhoven The Netherlands
10 Gupta H Chatterjee SG (2003) Parallel Diffusion of Moisture in Paper Part 1 Steady-State Conditions Industrial and Engineering Chemical Research 42 6582-6592
11 Janssen H Carmeliet J Hens H (2004) The influence of soil moisture transfer on building heat loss via the ground Buildings and Environment 39(7) 825-836
12 Kumaran K (1996) International Energy Agency Condensation and energy ndash Catalogue of material properties Report Annex 24 Volume 3 Energy conservation in buildings
13 Motta Lima OC Monteiro AS Pereira NC Mendes ES (2003) Moisture Equilibrium Isotherms for a Commercial Liquid Package Paper Drying Technology 21(10) 1909-1922
14 Mualem Y (1974) A conceptual model of hysteresis Water Resources research 10(3) 514-520
15 Ramarao BV Massoquete A Lavrykov S and Ramaswamy S (2003) Moisture Diffusion Inside Paper Materials in the Hygroscopic Range and Characteristics of Diffusivity Parameters Drying Technology 21(10) 2007-2056
16 Roels S Carmeliet J Hens H Adan O Brocken H Cerny R Pavlik Z Ellis AT Hall C Kumaran K Pel L Plagge R (2004) A comparison of Different Techniques to Quantify Moisture Content Profiles in Porous Building Materials Journal of Thermal Envelope and Building Science 27(4) 261-276
17 Roels S Carmeliet J Hens H Adan O Brocken H Cerny R Pavlik Z Hall C Kumaran K Pel L Plagge R (2004) Interlaboratory Comparison of Hygric Properties of Porous Building Materials Journal of Thermal Envelope and Building Science 27(4) 307-325
13
Table 1 Parameters for adsorption isotherms for different types of paper
Figure 3 Moisture transport properties of different paper types
18
(a)
0
40
80
120
160
01 03 05 07 09
Relative humidity (-)
Moi
stur
e co
nten
t (kg
msup3)
analytical fit
measurements
adsorption measurements
(b)
0
40
80
120
160
01 03 05 07 09
Relative humidity (-)
Moi
stur
e co
nten
t (kg
msup3)
analytical fit
measurements
adsorption measurements
Figure 4 Main adsorption and primary desorption data for telephone book (TB) paper (a) and magazine (M) paper (b) Thick solid line analytical fit of main adsorption isotherm
19
(a)
0
200
400
01 03 05 07 09
Relative humidity (-)
Mo
istu
re c
apac
ity (
kgm
sup3)
telephone book paper
magazine paper
(b)
0
200
400
600
800
01 03 05 07 09
Relative humidity (-)
Vap
or r
esis
tanc
e fa
cto
r (-
)
telephone book paper
magazine paper
Figure 5 Moisture capacity (a) and vapor resistance factor (b) of telephone book (TB) paper and magazine (M) paper compared with literature data (in gray for data specifications see Table 1 and 2)
20
(a)
0
20
40
60
80
100
120
01 03 05 07 09
Relative humidity (-)
Vap
or
resi
sta
nce
fact
or
(-)
0
10
20
30
40
50
Difference (
)method 1
method 2
difference
(b)
0
100
200
300
400
500
600
700
01 03 05 07 09
Relative humidity (-)
Vap
or r
esis
tanc
e fa
ctor
(-)
0
10
20
30
40
50
Difference (
)
method 1
method 2
difference
Figure 6 Vapor resistance factor of telephone book (TB) paper (a) and magazine (M) paper (b) determined by method 1 (Equation (6)) and method 2 (Equation (9))
21
(a)
0 10
1 a
f
main adsorption
(b) main desorption
0 10
1 a
f
(c)
0 10
1 a
f
primary desorption
1
(d)
0 10
1 a
f
primary adsorption
1
1
Figure 7 Main adsorption main desorption primary desorption primary adsorption processes represented in the f-a space where f represents the sorption sites and a the accessibility function (a)
0
40
80
120
160
01 03 05 07 09
Relative humidity (-)
Moi
stur
e co
nten
t (kg
msup3)
Mualem model
primary desorption measurements
adsorption measurements
(b)
0
40
80
120
160
01 03 05 07 09
Relative humidity (-)
Mo
istu
re c
on
ten
t (kg
msup3)
Mualem modelprimary desorption measurements
adsorption measurements
Figure 8 Comparison of measured primary desorption curves (bullets and dotted line) with model predictions (solid lines) Squares represent the measured adsorption curves (a) telephone book (TB) paper and (b) magazine (M) paper
22
0
02
04
06
08
1
Loading protocol
Rel
ativ
e h
umid
ity (
-)
Figure 9 Relative humidity loading protocol
23
(a)
0
40
80
120
160
0 02 04 06 08 1
Relative humidity (-)
Moi
stur
e c
onte
nt (
kgm
sup3)
hysteresis
desorption
adsorption
(b)
0
20
40
60
80
100
120
0 02 04 06 08 1
Relative humidity (-)
Wa
ter
vap
or
resi
sta
nce
fact
or
(-) hysteresis
desorption
adsorption
(c)
0
200
400
600
0 02 04 06 08 1
Relative humidity (-)
Moi
stur
e ca
paci
ty (
kgm
sup3)
hysteresis
adsorption
desorption
(d)
00E+00
50E-07
10E-06
15E-06
20E-06
0 02 04 06 08 1
Relative humidity (-)
Effu
sivi
ty (
kg(
msup2
Pa
s05 ))
hysteresis
desorption
adsorption
Figure 10 Hysteretic loops and main adsorption and desorption curves of loading protocol for the sorption isotherms (a) water vapor resistance factor (b) moisture capacity (c) and effusivity (d)
24
(a)
00E+00
50E-07
10E-06
15E-06
20E-06
25E-06
01 03 05 07 09
Relative humidity (-)
Effu
sivi
ty (
kg(
msup2
Pa
s0
5 ))
desorptionadsorptionmixed
(b)
00
40
80
120
0 50 100 150 200
Time (h)
Moi
stur
e re
leas
e (k
gm
sup3)
desorptionadsorptionmixed
Figure 11 Effusivity (a) and moisture release (RH from 08 to 05) (b) of telephone book paper for three settings of paper properties
25
(a)
0
5
10
15
20
25
0 100 200 300 400 500 600
Time (h)
Moi
stu
re u
ptak
e (k
gm
sup3)
magazine book
telephone book
p=51
p=86
p=90
Figure 12 Moisture uptake by magazine and telephone book for different paper fractions
26
(a)
(b)
0
10
20
30
40
0 480 960 1440 1920 2400
Time (h)
000
005
010
015
Diffe
rence
()
real book simulationeffective book simulationdifference
Mo
istu
re u
pta
ke (
kgm
sup3)
Figure 13 (a) Moisture transport paths in a book (b) real and effective telephone book simulation Ψp 60
pape
r
air
pape
r
air
pape
r
fore-edge of book
path 1 path 2
REV
moisture flow
27
0
5
10
15
20
25
30
35
0 100 200 300
Time (h)
Mo
istu
re u
ptak
e (k
gm
sup3)
magazine book measurement data
magazine book simulation
p=88
p=55
Figure 14 Simulating measured hygroscopic behavior of magazine book specimens with effective book model
0E+00
1E-06
2E-06
3E-06
4E-06
0 02 04 06 08 1
Relative humidity (-)
Effu
sivi
ty (
kg(
msup2
Pa
s05
))
magazine booktelephone book
p=51
p=86
p=90
Figure 15 Effusivity of magazine book and telephone book in adsorption
14
Table 3 Material properties for telephone book paper and magazine paper
Telephone book paper Magazine paper General thickness (microm) 54 65 dry weight (kgmsup2) 00372 00545 dry density (kgmsup3) 690 840 Sorption isotherm wmax (kgmsup3) 165 149 Aad 019 020 nad 112 103 Ade 166 163 nde 045 042 Water vapor permeability method 1 a 00092 000167 b 643 10-5 757 10-7
c 714 11 method 2 a 000919 000167 b 562 10-5 574 10-7
c 712 11
15
1830 microm
610 microm
(a) (b)
Figure 1 (a-b) SEM images of top surface of telephone book (TB) paper
16
(a)
(b)
Figure 2 (a-b) SEM images of top surface of magazine (M) paper
Figure 3 Moisture transport properties of different paper types
18
(a)
0
40
80
120
160
01 03 05 07 09
Relative humidity (-)
Moi
stur
e co
nten
t (kg
msup3)
analytical fit
measurements
adsorption measurements
(b)
0
40
80
120
160
01 03 05 07 09
Relative humidity (-)
Moi
stur
e co
nten
t (kg
msup3)
analytical fit
measurements
adsorption measurements
Figure 4 Main adsorption and primary desorption data for telephone book (TB) paper (a) and magazine (M) paper (b) Thick solid line analytical fit of main adsorption isotherm
19
(a)
0
200
400
01 03 05 07 09
Relative humidity (-)
Mo
istu
re c
apac
ity (
kgm
sup3)
telephone book paper
magazine paper
(b)
0
200
400
600
800
01 03 05 07 09
Relative humidity (-)
Vap
or r
esis
tanc
e fa
cto
r (-
)
telephone book paper
magazine paper
Figure 5 Moisture capacity (a) and vapor resistance factor (b) of telephone book (TB) paper and magazine (M) paper compared with literature data (in gray for data specifications see Table 1 and 2)
20
(a)
0
20
40
60
80
100
120
01 03 05 07 09
Relative humidity (-)
Vap
or
resi
sta
nce
fact
or
(-)
0
10
20
30
40
50
Difference (
)method 1
method 2
difference
(b)
0
100
200
300
400
500
600
700
01 03 05 07 09
Relative humidity (-)
Vap
or r
esis
tanc
e fa
ctor
(-)
0
10
20
30
40
50
Difference (
)
method 1
method 2
difference
Figure 6 Vapor resistance factor of telephone book (TB) paper (a) and magazine (M) paper (b) determined by method 1 (Equation (6)) and method 2 (Equation (9))
21
(a)
0 10
1 a
f
main adsorption
(b) main desorption
0 10
1 a
f
(c)
0 10
1 a
f
primary desorption
1
(d)
0 10
1 a
f
primary adsorption
1
1
Figure 7 Main adsorption main desorption primary desorption primary adsorption processes represented in the f-a space where f represents the sorption sites and a the accessibility function (a)
0
40
80
120
160
01 03 05 07 09
Relative humidity (-)
Moi
stur
e co
nten
t (kg
msup3)
Mualem model
primary desorption measurements
adsorption measurements
(b)
0
40
80
120
160
01 03 05 07 09
Relative humidity (-)
Mo
istu
re c
on
ten
t (kg
msup3)
Mualem modelprimary desorption measurements
adsorption measurements
Figure 8 Comparison of measured primary desorption curves (bullets and dotted line) with model predictions (solid lines) Squares represent the measured adsorption curves (a) telephone book (TB) paper and (b) magazine (M) paper
22
0
02
04
06
08
1
Loading protocol
Rel
ativ
e h
umid
ity (
-)
Figure 9 Relative humidity loading protocol
23
(a)
0
40
80
120
160
0 02 04 06 08 1
Relative humidity (-)
Moi
stur
e c
onte
nt (
kgm
sup3)
hysteresis
desorption
adsorption
(b)
0
20
40
60
80
100
120
0 02 04 06 08 1
Relative humidity (-)
Wa
ter
vap
or
resi
sta
nce
fact
or
(-) hysteresis
desorption
adsorption
(c)
0
200
400
600
0 02 04 06 08 1
Relative humidity (-)
Moi
stur
e ca
paci
ty (
kgm
sup3)
hysteresis
adsorption
desorption
(d)
00E+00
50E-07
10E-06
15E-06
20E-06
0 02 04 06 08 1
Relative humidity (-)
Effu
sivi
ty (
kg(
msup2
Pa
s05 ))
hysteresis
desorption
adsorption
Figure 10 Hysteretic loops and main adsorption and desorption curves of loading protocol for the sorption isotherms (a) water vapor resistance factor (b) moisture capacity (c) and effusivity (d)
24
(a)
00E+00
50E-07
10E-06
15E-06
20E-06
25E-06
01 03 05 07 09
Relative humidity (-)
Effu
sivi
ty (
kg(
msup2
Pa
s0
5 ))
desorptionadsorptionmixed
(b)
00
40
80
120
0 50 100 150 200
Time (h)
Moi
stur
e re
leas
e (k
gm
sup3)
desorptionadsorptionmixed
Figure 11 Effusivity (a) and moisture release (RH from 08 to 05) (b) of telephone book paper for three settings of paper properties
25
(a)
0
5
10
15
20
25
0 100 200 300 400 500 600
Time (h)
Moi
stu
re u
ptak
e (k
gm
sup3)
magazine book
telephone book
p=51
p=86
p=90
Figure 12 Moisture uptake by magazine and telephone book for different paper fractions
26
(a)
(b)
0
10
20
30
40
0 480 960 1440 1920 2400
Time (h)
000
005
010
015
Diffe
rence
()
real book simulationeffective book simulationdifference
Mo
istu
re u
pta
ke (
kgm
sup3)
Figure 13 (a) Moisture transport paths in a book (b) real and effective telephone book simulation Ψp 60
pape
r
air
pape
r
air
pape
r
fore-edge of book
path 1 path 2
REV
moisture flow
27
0
5
10
15
20
25
30
35
0 100 200 300
Time (h)
Mo
istu
re u
ptak
e (k
gm
sup3)
magazine book measurement data
magazine book simulation
p=88
p=55
Figure 14 Simulating measured hygroscopic behavior of magazine book specimens with effective book model
0E+00
1E-06
2E-06
3E-06
4E-06
0 02 04 06 08 1
Relative humidity (-)
Effu
sivi
ty (
kg(
msup2
Pa
s05
))
magazine booktelephone book
p=51
p=86
p=90
Figure 15 Effusivity of magazine book and telephone book in adsorption
15
1830 microm
610 microm
(a) (b)
Figure 1 (a-b) SEM images of top surface of telephone book (TB) paper
16
(a)
(b)
Figure 2 (a-b) SEM images of top surface of magazine (M) paper
Figure 3 Moisture transport properties of different paper types
18
(a)
0
40
80
120
160
01 03 05 07 09
Relative humidity (-)
Moi
stur
e co
nten
t (kg
msup3)
analytical fit
measurements
adsorption measurements
(b)
0
40
80
120
160
01 03 05 07 09
Relative humidity (-)
Moi
stur
e co
nten
t (kg
msup3)
analytical fit
measurements
adsorption measurements
Figure 4 Main adsorption and primary desorption data for telephone book (TB) paper (a) and magazine (M) paper (b) Thick solid line analytical fit of main adsorption isotherm
19
(a)
0
200
400
01 03 05 07 09
Relative humidity (-)
Mo
istu
re c
apac
ity (
kgm
sup3)
telephone book paper
magazine paper
(b)
0
200
400
600
800
01 03 05 07 09
Relative humidity (-)
Vap
or r
esis
tanc
e fa
cto
r (-
)
telephone book paper
magazine paper
Figure 5 Moisture capacity (a) and vapor resistance factor (b) of telephone book (TB) paper and magazine (M) paper compared with literature data (in gray for data specifications see Table 1 and 2)
20
(a)
0
20
40
60
80
100
120
01 03 05 07 09
Relative humidity (-)
Vap
or
resi
sta
nce
fact
or
(-)
0
10
20
30
40
50
Difference (
)method 1
method 2
difference
(b)
0
100
200
300
400
500
600
700
01 03 05 07 09
Relative humidity (-)
Vap
or r
esis
tanc
e fa
ctor
(-)
0
10
20
30
40
50
Difference (
)
method 1
method 2
difference
Figure 6 Vapor resistance factor of telephone book (TB) paper (a) and magazine (M) paper (b) determined by method 1 (Equation (6)) and method 2 (Equation (9))
21
(a)
0 10
1 a
f
main adsorption
(b) main desorption
0 10
1 a
f
(c)
0 10
1 a
f
primary desorption
1
(d)
0 10
1 a
f
primary adsorption
1
1
Figure 7 Main adsorption main desorption primary desorption primary adsorption processes represented in the f-a space where f represents the sorption sites and a the accessibility function (a)
0
40
80
120
160
01 03 05 07 09
Relative humidity (-)
Moi
stur
e co
nten
t (kg
msup3)
Mualem model
primary desorption measurements
adsorption measurements
(b)
0
40
80
120
160
01 03 05 07 09
Relative humidity (-)
Mo
istu
re c
on
ten
t (kg
msup3)
Mualem modelprimary desorption measurements
adsorption measurements
Figure 8 Comparison of measured primary desorption curves (bullets and dotted line) with model predictions (solid lines) Squares represent the measured adsorption curves (a) telephone book (TB) paper and (b) magazine (M) paper
22
0
02
04
06
08
1
Loading protocol
Rel
ativ
e h
umid
ity (
-)
Figure 9 Relative humidity loading protocol
23
(a)
0
40
80
120
160
0 02 04 06 08 1
Relative humidity (-)
Moi
stur
e c
onte
nt (
kgm
sup3)
hysteresis
desorption
adsorption
(b)
0
20
40
60
80
100
120
0 02 04 06 08 1
Relative humidity (-)
Wa
ter
vap
or
resi
sta
nce
fact
or
(-) hysteresis
desorption
adsorption
(c)
0
200
400
600
0 02 04 06 08 1
Relative humidity (-)
Moi
stur
e ca
paci
ty (
kgm
sup3)
hysteresis
adsorption
desorption
(d)
00E+00
50E-07
10E-06
15E-06
20E-06
0 02 04 06 08 1
Relative humidity (-)
Effu
sivi
ty (
kg(
msup2
Pa
s05 ))
hysteresis
desorption
adsorption
Figure 10 Hysteretic loops and main adsorption and desorption curves of loading protocol for the sorption isotherms (a) water vapor resistance factor (b) moisture capacity (c) and effusivity (d)
24
(a)
00E+00
50E-07
10E-06
15E-06
20E-06
25E-06
01 03 05 07 09
Relative humidity (-)
Effu
sivi
ty (
kg(
msup2
Pa
s0
5 ))
desorptionadsorptionmixed
(b)
00
40
80
120
0 50 100 150 200
Time (h)
Moi
stur
e re
leas
e (k
gm
sup3)
desorptionadsorptionmixed
Figure 11 Effusivity (a) and moisture release (RH from 08 to 05) (b) of telephone book paper for three settings of paper properties
25
(a)
0
5
10
15
20
25
0 100 200 300 400 500 600
Time (h)
Moi
stu
re u
ptak
e (k
gm
sup3)
magazine book
telephone book
p=51
p=86
p=90
Figure 12 Moisture uptake by magazine and telephone book for different paper fractions
26
(a)
(b)
0
10
20
30
40
0 480 960 1440 1920 2400
Time (h)
000
005
010
015
Diffe
rence
()
real book simulationeffective book simulationdifference
Mo
istu
re u
pta
ke (
kgm
sup3)
Figure 13 (a) Moisture transport paths in a book (b) real and effective telephone book simulation Ψp 60
pape
r
air
pape
r
air
pape
r
fore-edge of book
path 1 path 2
REV
moisture flow
27
0
5
10
15
20
25
30
35
0 100 200 300
Time (h)
Mo
istu
re u
ptak
e (k
gm
sup3)
magazine book measurement data
magazine book simulation
p=88
p=55
Figure 14 Simulating measured hygroscopic behavior of magazine book specimens with effective book model
0E+00
1E-06
2E-06
3E-06
4E-06
0 02 04 06 08 1
Relative humidity (-)
Effu
sivi
ty (
kg(
msup2
Pa
s05
))
magazine booktelephone book
p=51
p=86
p=90
Figure 15 Effusivity of magazine book and telephone book in adsorption
20
(a)
0
20
40
60
80
100
120
01 03 05 07 09
Relative humidity (-)
Vap
or
resi
sta
nce
fact
or
(-)
0
10
20
30
40
50
Difference (
)method 1
method 2
difference
(b)
0
100
200
300
400
500
600
700
01 03 05 07 09
Relative humidity (-)
Vap
or r
esis
tanc
e fa
ctor
(-)
0
10
20
30
40
50
Difference (
)
method 1
method 2
difference
Figure 6 Vapor resistance factor of telephone book (TB) paper (a) and magazine (M) paper (b) determined by method 1 (Equation (6)) and method 2 (Equation (9))
21
(a)
0 10
1 a
f
main adsorption
(b) main desorption
0 10
1 a
f
(c)
0 10
1 a
f
primary desorption
1
(d)
0 10
1 a
f
primary adsorption
1
1
Figure 7 Main adsorption main desorption primary desorption primary adsorption processes represented in the f-a space where f represents the sorption sites and a the accessibility function (a)
0
40
80
120
160
01 03 05 07 09
Relative humidity (-)
Moi
stur
e co
nten
t (kg
msup3)
Mualem model
primary desorption measurements
adsorption measurements
(b)
0
40
80
120
160
01 03 05 07 09
Relative humidity (-)
Mo
istu
re c
on
ten
t (kg
msup3)
Mualem modelprimary desorption measurements
adsorption measurements
Figure 8 Comparison of measured primary desorption curves (bullets and dotted line) with model predictions (solid lines) Squares represent the measured adsorption curves (a) telephone book (TB) paper and (b) magazine (M) paper
22
0
02
04
06
08
1
Loading protocol
Rel
ativ
e h
umid
ity (
-)
Figure 9 Relative humidity loading protocol
23
(a)
0
40
80
120
160
0 02 04 06 08 1
Relative humidity (-)
Moi
stur
e c
onte
nt (
kgm
sup3)
hysteresis
desorption
adsorption
(b)
0
20
40
60
80
100
120
0 02 04 06 08 1
Relative humidity (-)
Wa
ter
vap
or
resi
sta
nce
fact
or
(-) hysteresis
desorption
adsorption
(c)
0
200
400
600
0 02 04 06 08 1
Relative humidity (-)
Moi
stur
e ca
paci
ty (
kgm
sup3)
hysteresis
adsorption
desorption
(d)
00E+00
50E-07
10E-06
15E-06
20E-06
0 02 04 06 08 1
Relative humidity (-)
Effu
sivi
ty (
kg(
msup2
Pa
s05 ))
hysteresis
desorption
adsorption
Figure 10 Hysteretic loops and main adsorption and desorption curves of loading protocol for the sorption isotherms (a) water vapor resistance factor (b) moisture capacity (c) and effusivity (d)
24
(a)
00E+00
50E-07
10E-06
15E-06
20E-06
25E-06
01 03 05 07 09
Relative humidity (-)
Effu
sivi
ty (
kg(
msup2
Pa
s0
5 ))
desorptionadsorptionmixed
(b)
00
40
80
120
0 50 100 150 200
Time (h)
Moi
stur
e re
leas
e (k
gm
sup3)
desorptionadsorptionmixed
Figure 11 Effusivity (a) and moisture release (RH from 08 to 05) (b) of telephone book paper for three settings of paper properties
25
(a)
0
5
10
15
20
25
0 100 200 300 400 500 600
Time (h)
Moi
stu
re u
ptak
e (k
gm
sup3)
magazine book
telephone book
p=51
p=86
p=90
Figure 12 Moisture uptake by magazine and telephone book for different paper fractions
26
(a)
(b)
0
10
20
30
40
0 480 960 1440 1920 2400
Time (h)
000
005
010
015
Diffe
rence
()
real book simulationeffective book simulationdifference
Mo
istu
re u
pta
ke (
kgm
sup3)
Figure 13 (a) Moisture transport paths in a book (b) real and effective telephone book simulation Ψp 60
pape
r
air
pape
r
air
pape
r
fore-edge of book
path 1 path 2
REV
moisture flow
27
0
5
10
15
20
25
30
35
0 100 200 300
Time (h)
Mo
istu
re u
ptak
e (k
gm
sup3)
magazine book measurement data
magazine book simulation
p=88
p=55
Figure 14 Simulating measured hygroscopic behavior of magazine book specimens with effective book model
0E+00
1E-06
2E-06
3E-06
4E-06
0 02 04 06 08 1
Relative humidity (-)
Effu
sivi
ty (
kg(
msup2
Pa
s05
))
magazine booktelephone book
p=51
p=86
p=90
Figure 15 Effusivity of magazine book and telephone book in adsorption
25
(a)
0
5
10
15
20
25
0 100 200 300 400 500 600
Time (h)
Moi
stu
re u
ptak
e (k
gm
sup3)
magazine book
telephone book
p=51
p=86
p=90
Figure 12 Moisture uptake by magazine and telephone book for different paper fractions
26
(a)
(b)
0
10
20
30
40
0 480 960 1440 1920 2400
Time (h)
000
005
010
015
Diffe
rence
()
real book simulationeffective book simulationdifference
Mo
istu
re u
pta
ke (
kgm
sup3)
Figure 13 (a) Moisture transport paths in a book (b) real and effective telephone book simulation Ψp 60
pape
r
air
pape
r
air
pape
r
fore-edge of book
path 1 path 2
REV
moisture flow
27
0
5
10
15
20
25
30
35
0 100 200 300
Time (h)
Mo
istu
re u
ptak
e (k
gm
sup3)
magazine book measurement data
magazine book simulation
p=88
p=55
Figure 14 Simulating measured hygroscopic behavior of magazine book specimens with effective book model
0E+00
1E-06
2E-06
3E-06
4E-06
0 02 04 06 08 1
Relative humidity (-)
Effu
sivi
ty (
kg(
msup2
Pa
s05
))
magazine booktelephone book
p=51
p=86
p=90
Figure 15 Effusivity of magazine book and telephone book in adsorption