63
HYS 201. Digging Deeper Into Your HYS Results March 20 th , 2013
| Date post: | 25-Dec-2015 |
| Category: |
Documents |
| Upload: | barrie-hunter |
| View: | 232 times |
| Download: | 1 times |

HYS 201. Digging Deeper Into Your
HYS Results
March 20th, 2013

1. Statistical issues
2. Data analysis with the Q x Q
3. Message communication
Training Overview
HYS Statistical Issues
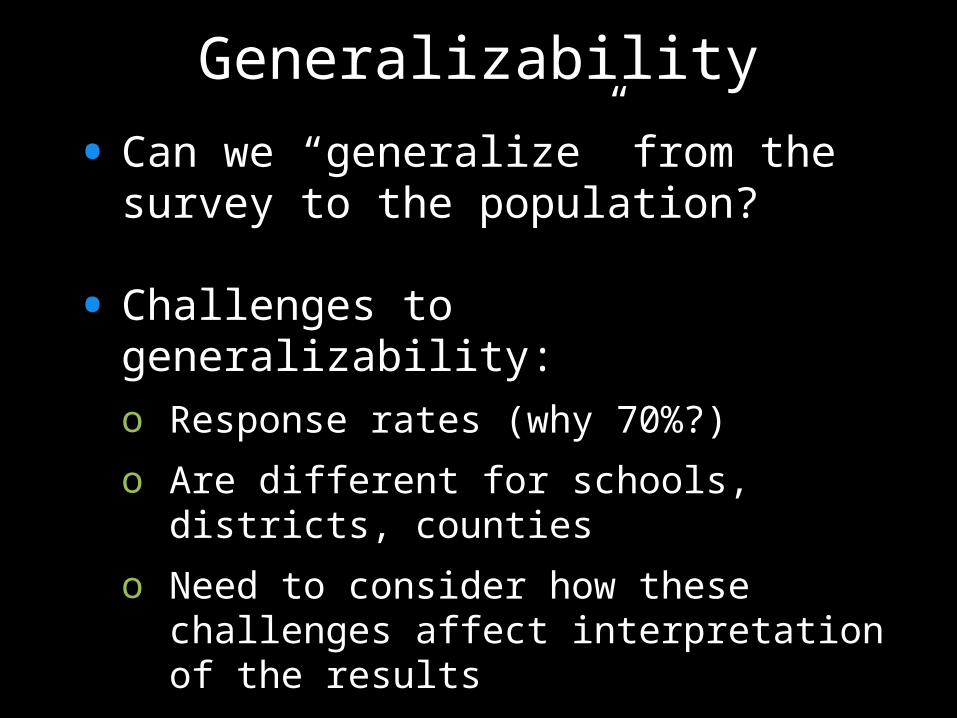
Generalizability
• Can we “generalize” from the survey to the population?
• Challenges to generalizability: o Response rates (why 70%?)o Are different for schools, districts, countieso Need to consider how these challenges affect
interpretation of the results

Do I need to generalize?
• Yes, if you want to apply the results to a larger population.o 8th graders in our district said….
• Yes, if you want to compare to others or results over time
• No, if you want to just describe the students surveyed, in that moment, without confidence intervals:o Students at our school who took the survey said….

Understanding N’s
“N” is shorthand for “number” --- the number of students who took this survey or who answered a survey question.
There are multiple reasons why different questions have different “N’s”:• Maybe a question is near the end of the
survey…• Maybe a question is difficult to answer, or
too personal…
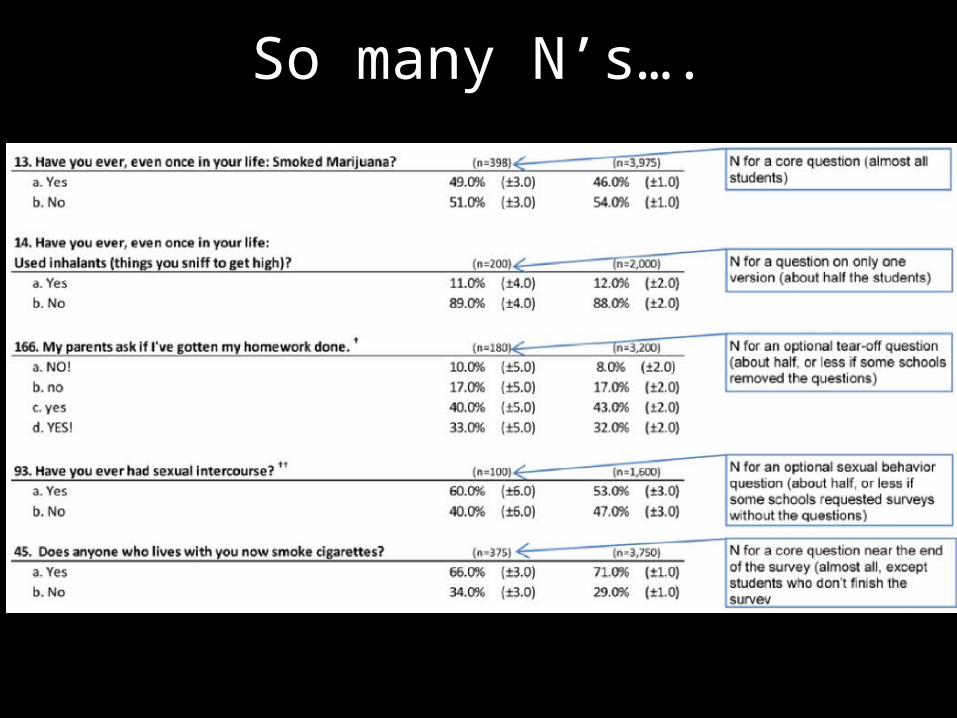
So many N’s….

Converting N’s into students
Each question has an “N” for the number of students who answered it.
Using your “N”, you can translate your point estimate (%) into the number of students• For example,
o If 10% of students in your district used inhalants,
o 200 10th graders , o Then 20 students in your district used
inhalants (20 X 0.10)

Confidence intervals

What are “confidence intervals”?
HYS results include a “±” after the number for each answer in the survey results.
It is unlikely that the point estimate (%) is exact. Confidence intervals (CI) describe uncertainty.
• Results are different than the “true” value.• “We are 95% sure that….”
±
±
±
±±

Why do we need confidence intervals if data are valid?
• CIs account for variability, NOT the validity of the data.
• Variability causes uncertainty in the results.
• CIs allow for the comparison of results to others and to ourselves over time.

“Doubt is not a pleasant condition, but certainty is absurd.”
– Voltaire

Why are confidence intervals different sizes?
The size of a confidence interval is affected by:
• Number of students. o In general, the more students surveyed, the
smaller the confidence interval.
• Inherent variability. o If most students answer a survey question in
the same way, then there is less variability. The more variable the answers, the wider the CIs.
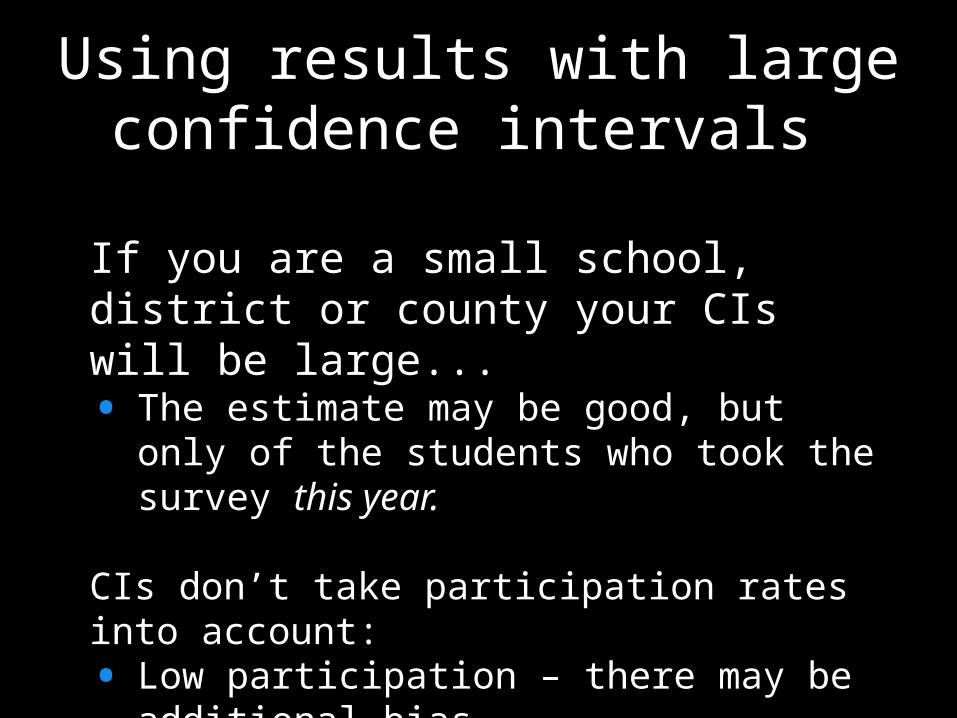
Using results with large confidence intervals
If you are a small school, district or county your CIs will be large... • The estimate may be good, but only of the
students who took the survey this year.
CIs don’t take participation rates into account:• Low participation – there may be additional bias• High participation – you can feel more confident
in your point estimates.

Statistical significance

What is “statistical significance”, and when does it matter?
• The probability that differences in results are not due to chance alone.
• When using 95% confidence intervals, a difference between two groups is considered statistically significant if chance could explain it only 5% of the time or less.

Using confidence intervals
• CIs help you decide if the difference between your students and the state are statistically significant.
• Example, your students report 25% ±5%. o So your CI is between 20% and 30%o Math: 25% - 5% = 20%, 25% + 5% = 30%
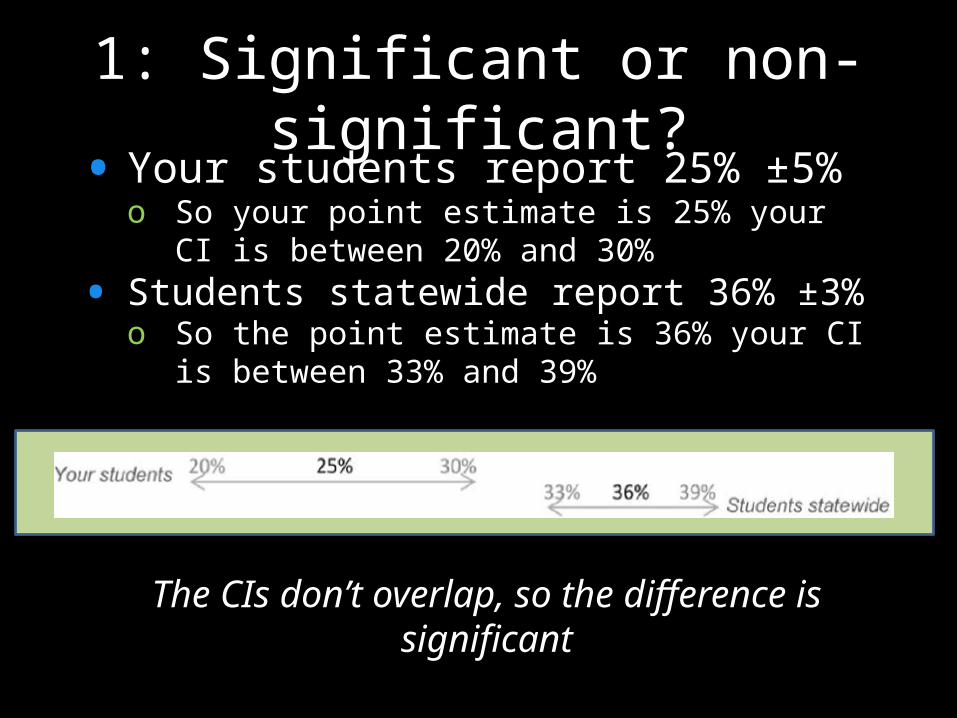
1: Significant or non-significant?
• Your students report 25% ±5% o So your point estimate is 25% your CI is between 20%
and 30%• Students statewide report 36% ±3%
o So the point estimate is 36% your CI is between 33% and 39%
The CIs don’t overlap, so the difference is significant
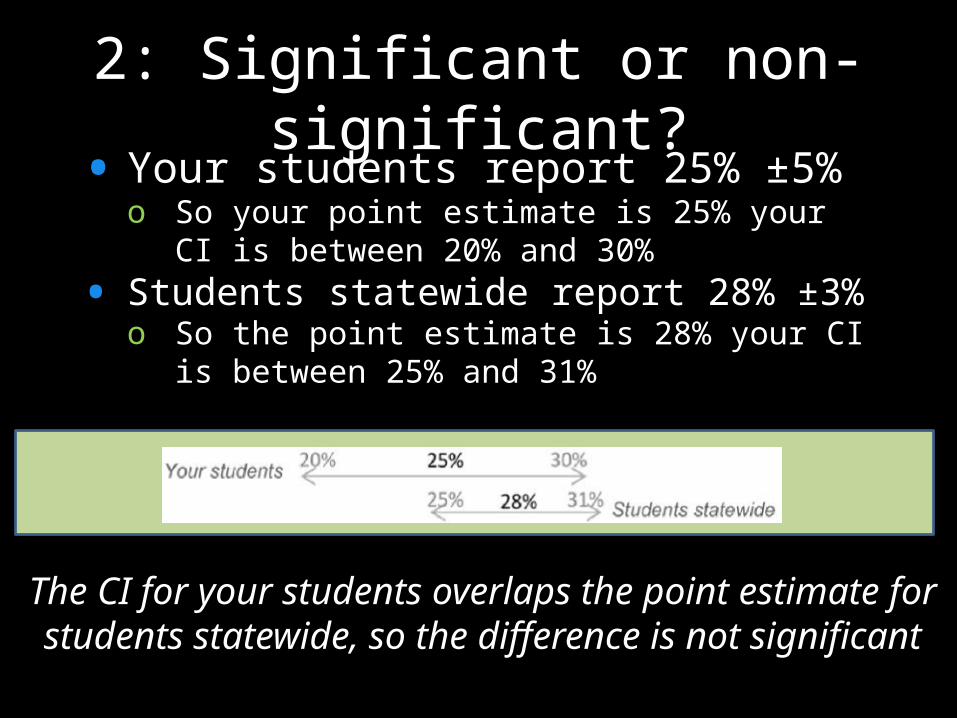
2: Significant or non-significant?
• Your students report 25% ±5% o So your point estimate is 25% your CI is between 20%
and 30%• Students statewide report 28% ±3%
o So the point estimate is 28% your CI is between 25% and 31%
The CI for your students overlaps the point estimate for students statewide, so the difference is not significant
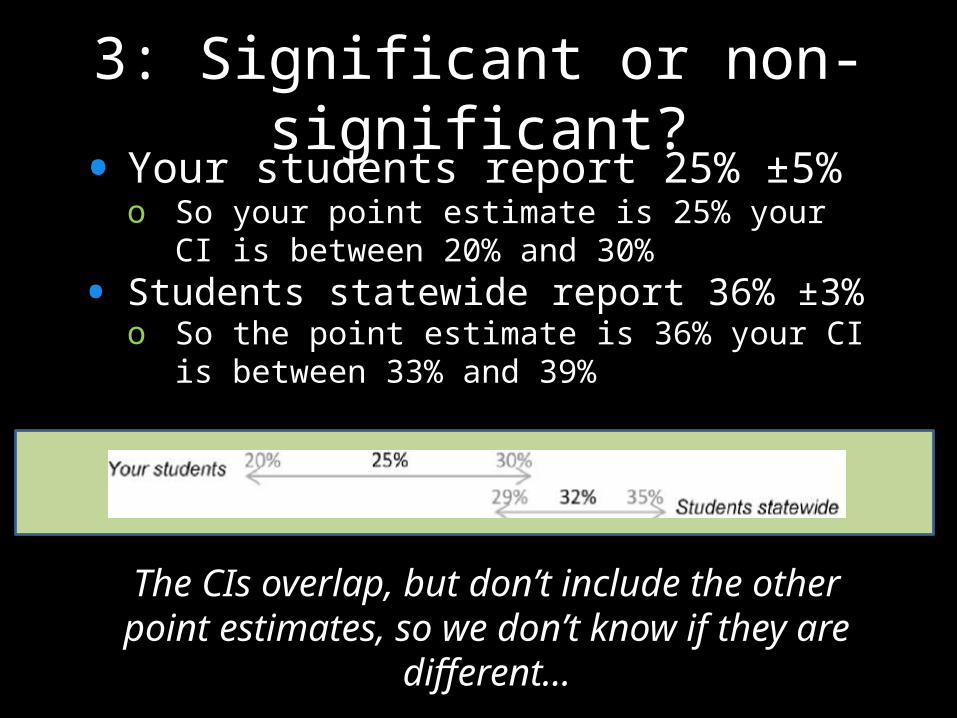
3: Significant or non-significant?
• Your students report 25% ±5% o So your point estimate is 25% your CI is between 20%
and 30%• Students statewide report 36% ±3%
o So the point estimate is 36% your CI is between 33% and 39%
The CIs overlap, but don’t include the other point estimates, so we don’t know if they are different…
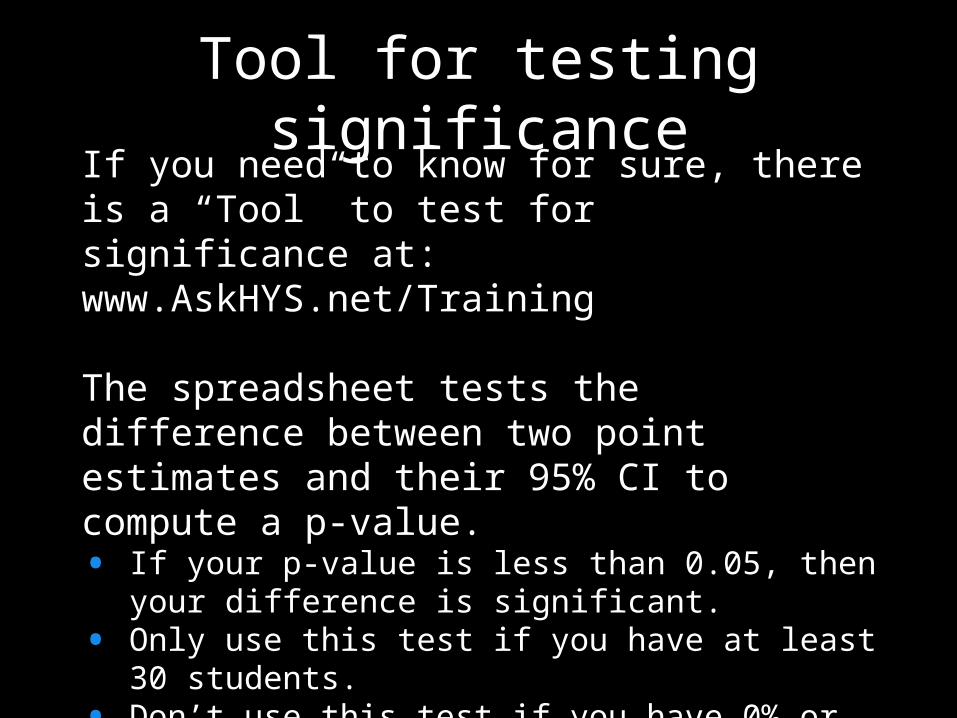
Tool for testing significance
If you need to know for sure, there is a “Tool” to test for significance at: www.AskHYS.net/Training
The spreadsheet tests the difference between two point estimates and their 95% CI to compute a p-value. • If your p-value is less than 0.05, then your difference is
significant.• Only use this test if you have at least 30 students. • Don’t use this test if you have 0% or 100%
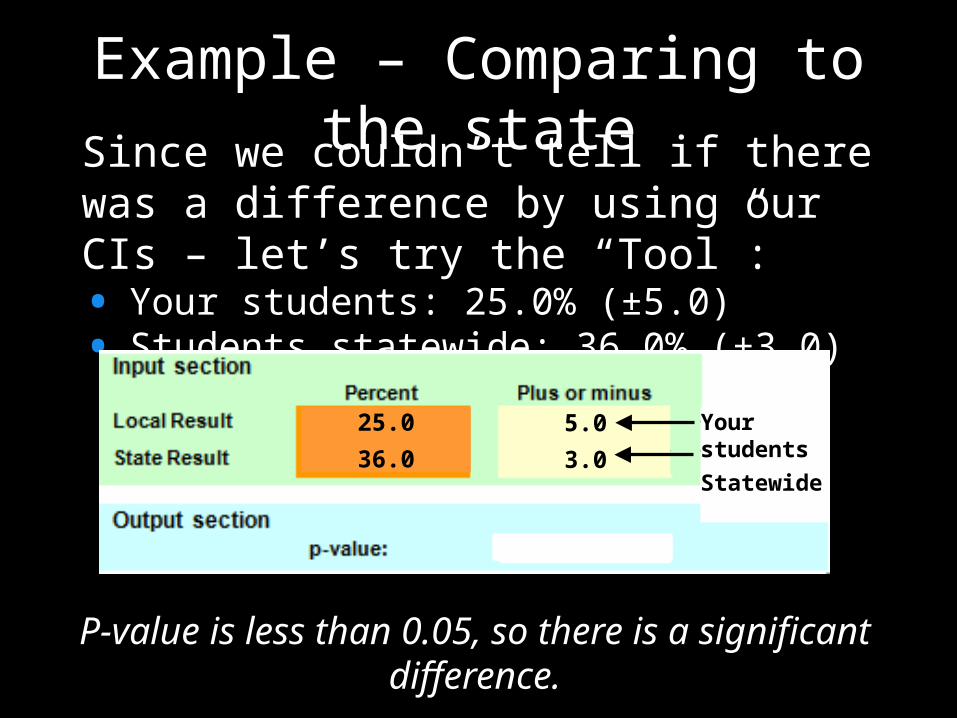
Example – Comparing to the stateSince we couldn’t tell if there was a difference by using our CIs – let’s try the “Tool”:• Your students: 25.0% (±5.0)• Students statewide: 36.0% (±3.0)
P-value is less than 0.05, so there is a significant difference.
25.0
36.05.0
3.0
Your studentsStatewide
0.0002177

Example – Comparing gradesAre their differences in drinking 2 or more sodas between 10th and 12th graders?• 10th grade: 15.3% (±1.7)• 12th grade: 14.7% (±1.9)
P-value is greater than 0.05, so there is no difference between 10th and 12th graders.
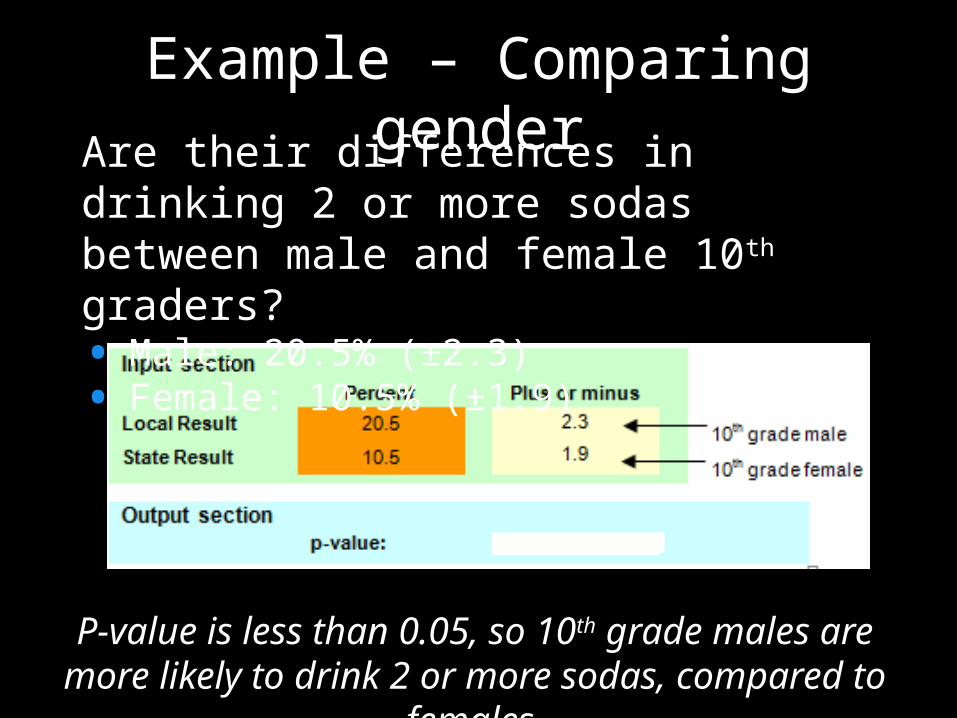
Example – Comparing genderAre their differences in drinking 2 or more sodas between male and female 10th graders?• Male: 20.5% (±2.3)• Female: 10.5% (±1.9)
P-value is less than 0.05, so 10th grade males are more likely to drink 2 or more sodas, compared to females.

Comparisons over timeA few things to think about first:
• Did the survey change?
• Were challenges to generalizability similar?o Response rateso Groups of students missing
• Do you expect a change?
Trends
• Fact sheets do provide data back to 2002 for some questions – but do not provide trend results (only year to year comparisons)
• To measure trends you need statistical softwareo Free software from the National Cancer
Institute – uses your point estimates and confidence intervals:
http://surveillance.cancer.gov/joinpoint

Questions?

QxQ Online Data Query System

Q x Q = Question by Question
What can you do with it?
• Run frequencies: responses to individual questions. Just like the results in your Frequency Reports.
• Run crosstabs: looking at the relationship between two questions - crossing one question by the second question.

Availability and access
What is available?• Grades 6, 8 , 10 and 12• Years from 2002 to 2012 (2012 almost ready….)• Locations with results (must meet minimum qualifications)
Anyone can access:• State, Educational Service District, and County results
A username/password are required to access:• School District and Building results (permission provided by District Superintendent)

Before you start, ask yourself…
What do you want to know?
Do you have results to analyze?• Check Past Participation
Can the questions you’re interested in be crossed?• Check the Crosswalk

Past participation

Opening the Q x Qwww.AskHYS.net/Analyzer
Fact SheetsFrequency ReportsQxQ AnalysisPast Participation

Opening the Q x Qwww.AskHYS.net/Analyzer

Opening the Q x Qwww.AskHYS.net/Analyzer
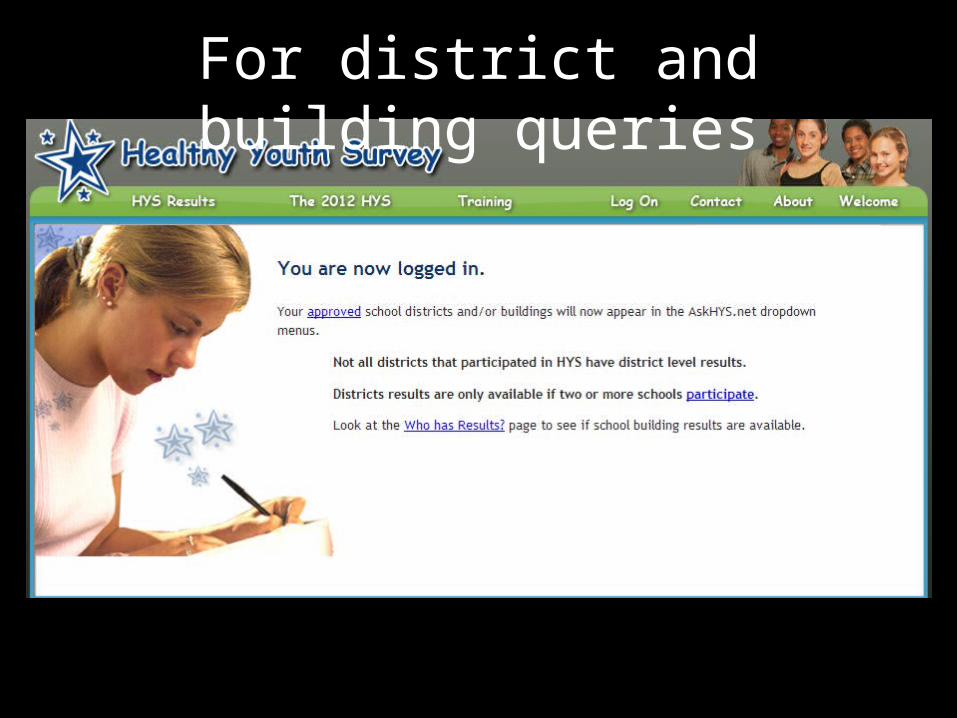
For district and building queries

For district and building queries
Run a frequency

Frequency - Selecting analysis variables

Frequency - Question selection

Frequency - Drag and drop

Frequency - Response selection
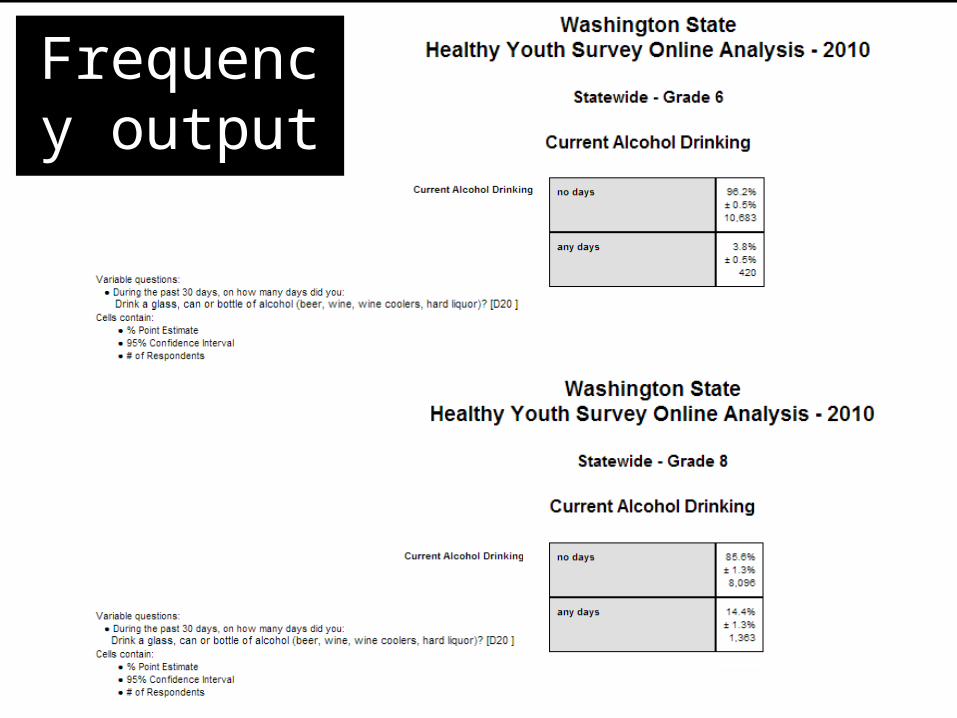
Frequency output
What are crosstabs

Relationship between drinking and marijuana
Among kids who didn’t drank:• 3.5% used marijuana (cell 2)
Among kids who drank:• 44.8% used marijuana (cell 4)
Current Alcohol Drinking and Current Marijuana Use

Relationship between marijuana and drinking
Among kids who didn’t use marijuana:• 8.8% drank (cell 2)
Among kids used marijuana:• 68.5% drank (cell 4)

HYS crosstab requirements
Cell size• State level minimum 5 per cell. • Sub-state level minimum 10 per cell.
**NOTE**• The squares that have results in them are the
“cells”. • The number of respondents in each cell is called
the “n”, or also the “cell size”.
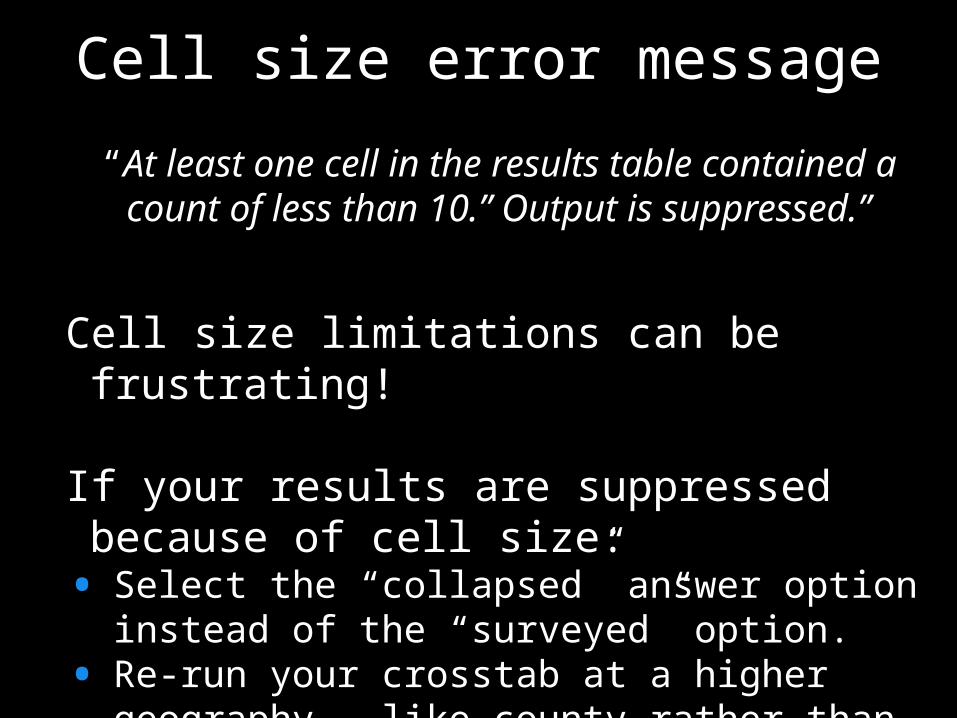
Cell size error message
“At least one cell in the results table contained a count of less than 10.” Output is suppressed.”
Cell size limitations can be frustrating!
If your results are suppressed because of cell size: • Select the “collapsed” answer option instead of the
“surveyed” option.• Re-run your crosstab at a higher geography – like
county rather than district.
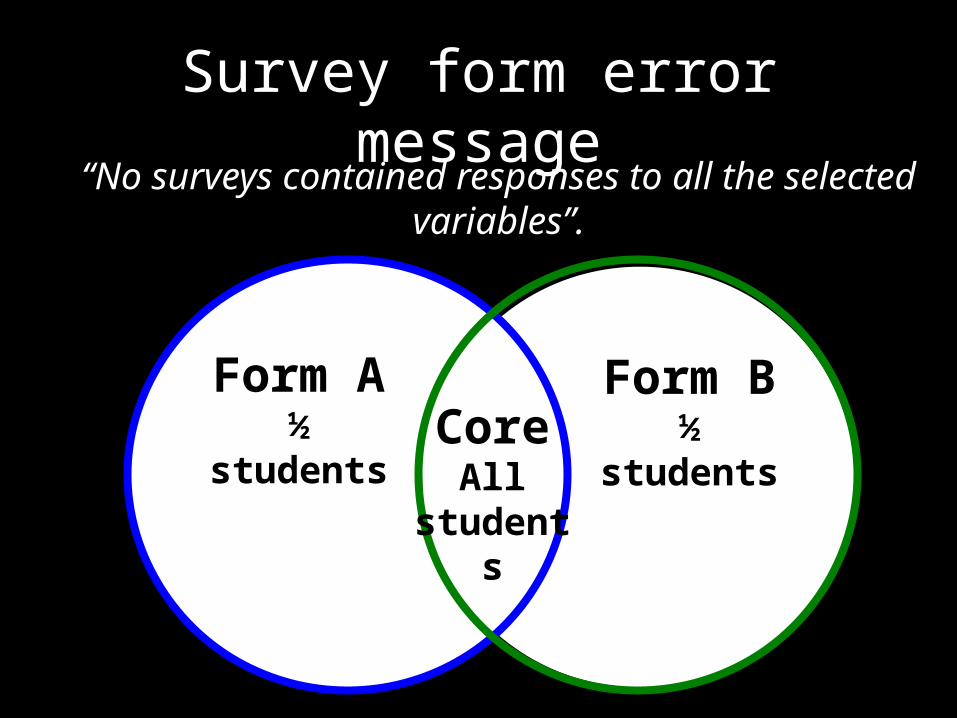
Survey form error message
Form A½ students Core
All students
Form B½ students
“No surveys contained responses to all the selected variables”.

Run a Crosstab

1: Choose analysis variables
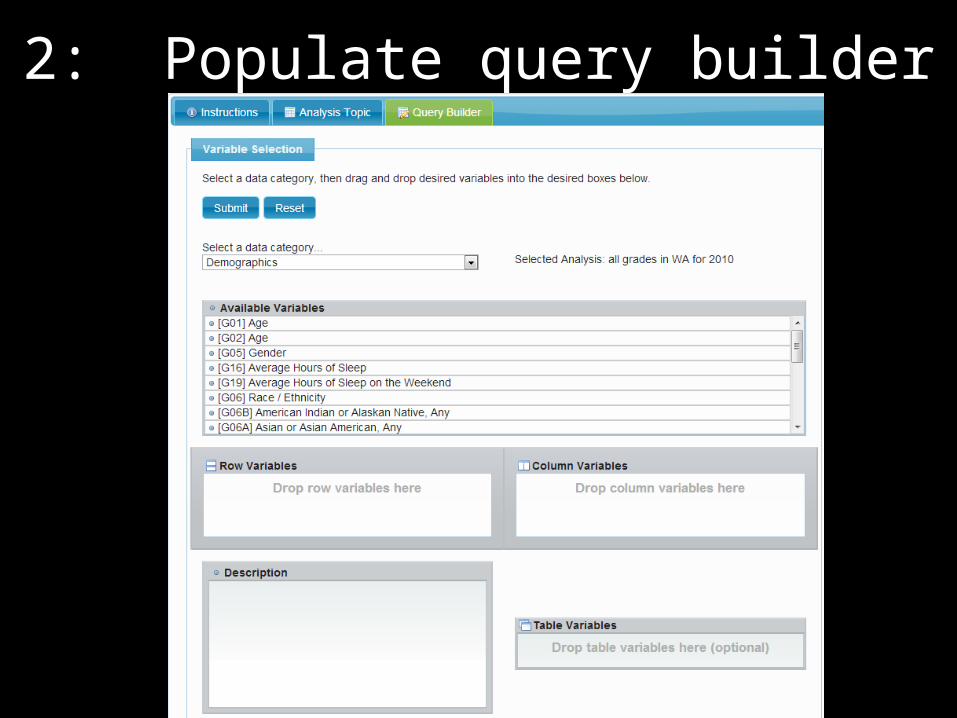
2: Populate query builder

3: Add row and column variables
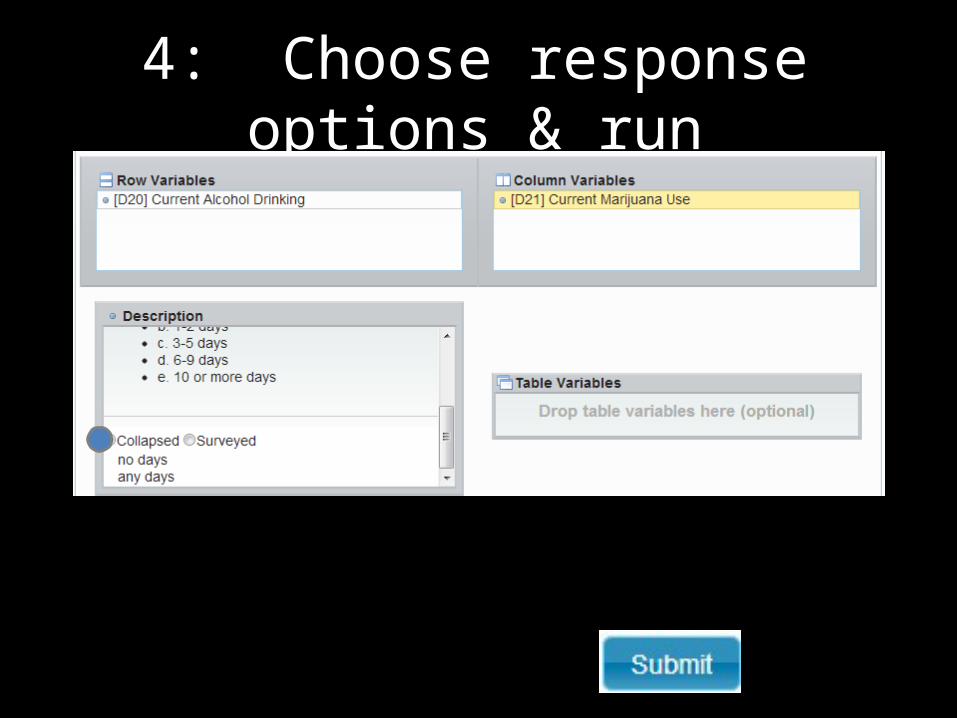
4: Choose response options & run
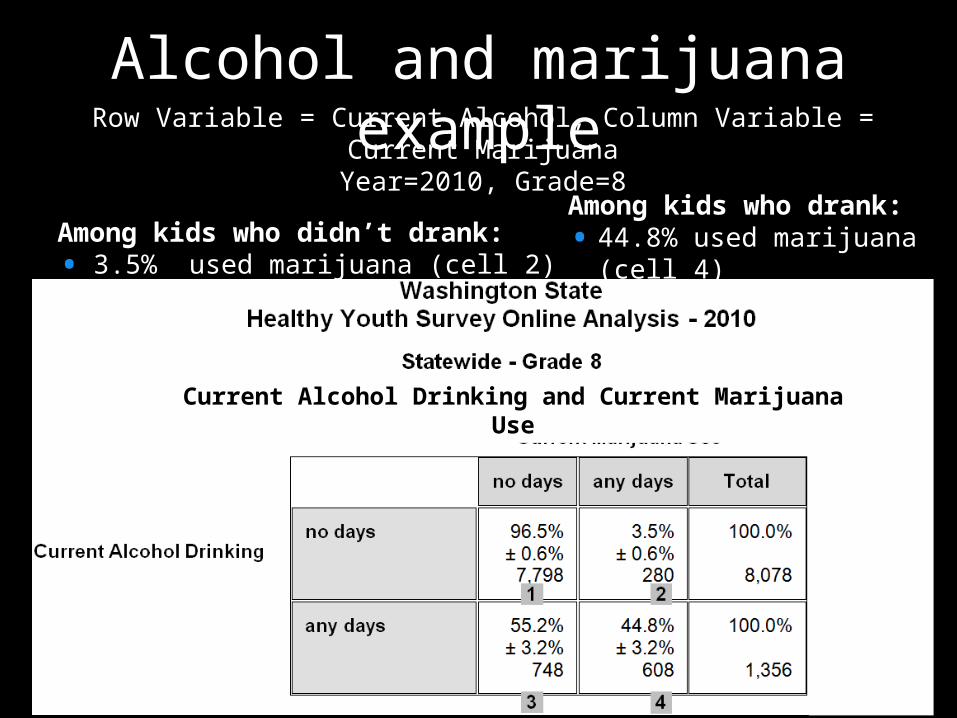
Alcohol and marijuana exampleRow Variable = Current Alcohol, Column Variable = Current Marijuana
Year=2010, Grade=8
Among kids who didn’t drank:• 3.5% used marijuana (cell 2)
Among kids who drank:• 44.8% used marijuana (cell 4)
Current Alcohol Drinking and Current Marijuana Use
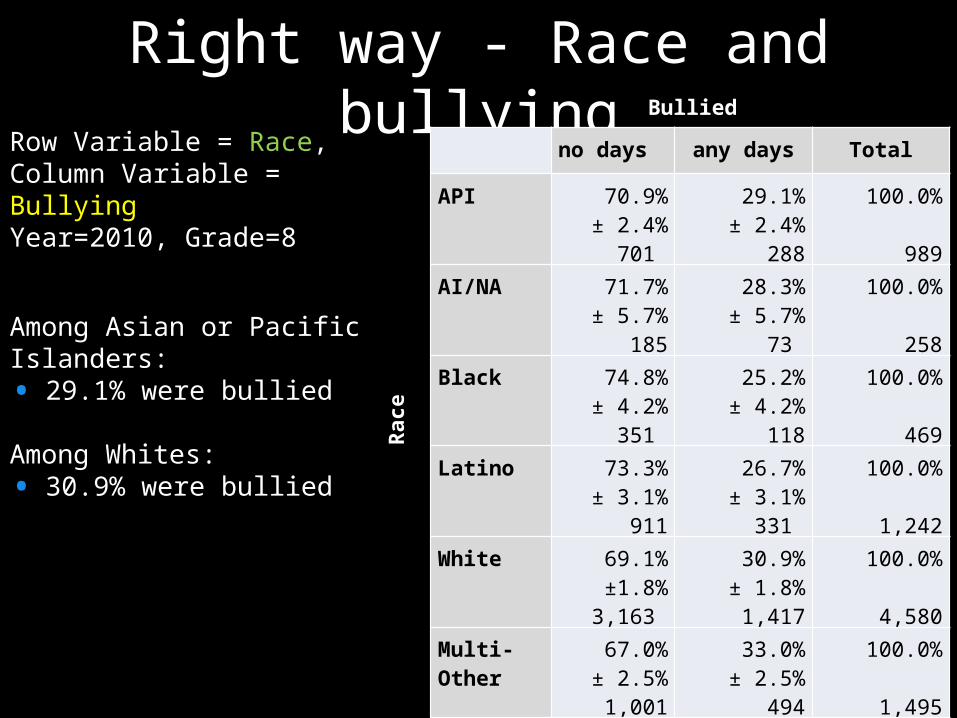
Right way - Race and bullyingRow Variable = Race, Column Variable = BullyingYear=2010, Grade=8
Among Asian or Pacific Islanders:• 29.1% were bullied
Among Whites:• 30.9% were bullied
no days any days Total
API 70.9%± 2.4%
701
29.1%± 2.4%
288
100.0%
989
AI/NA 71.7%± 5.7%
185
28.3%± 5.7%
73
100.0%
258
Black 74.8%± 4.2%
351
25.2%± 4.2%
118
100.0%
469
Latino 73.3%± 3.1%
911
26.7%± 3.1%
331
100.0%
1,242
White 69.1%±1.8%3,163
30.9%± 1.8%1,417
100.0%
4,580
Multi-Other 67.0%± 2.5%1,001
33.0%± 2.5%
494
100.0%
1,495
Race
Bullied

Wrong way - Race and bullyingRow Variable = Bullying, Column Variable = Race,
Year=2010, Grade=8
Among Asian or Pacific Islanders:• 10.6% were bullied
API AI/NA Black Latino White Multi-Other
Total
no days
11.1%± 2.8%
701
2.9%± 0.5%
185
5.6% ± 1.5%
351
14.4%± 1.3%
911
50.1%± 5.4%3,163
14.9%± 1.3%
1,001
100.0%
6,312
any days
10.6%± 2.8%
288
2.7%± 0.7%
73
4.3%± 1.3%
118
12.2%± 3.4%
331
52.1%± 5.2%1,417
18.2% ± 1.8%
494
100.0%
2,721
Among Whites:• 52.1% were bullied
Bulli
ed
Race

Two ways to look at itRow Variable = Weapons at School, Column Variable = Grades Last Year,Year=2010, Grade=8
• 47.5% of youth who carried weapons at school had low grades (C-D-F’s)
• 24.5% of youth who did not carry weapons at school had low grades (C-D-F’s)
Row Variable = Grades Last Year, Column Variable = Weapons at School,Year=2010, Grade=8
• 3.8% of youth who had high grades (A-B’s) carried a weapon at school
• 10.0% of youth who had low grades (C-D-F’s) carried a weapon at school
Mostly A-B’s
Mostly C-D-F’s
Total
no days
75.5%± 2.5%6,521
24.5%± 2.5%2,111
100.0%
8,632
any days
52.5%± 4.6%
259
47.5%± 4.6%
234
100.0%
493
no days any days
Total
Mostly A-B’s
96.2%± 0.7%6,521
3.8%± 0.7%
259
100.0%
6,780
Mostly C-D-F’s
90.0%± 1.1%2,111
10.0%± 1.1%
243
100.0%
2,345
Grades Last Year
Gra
des
Last
Yea
r
Wea
pon
at S
choo
l
Weapon at School
Check you Q x Q results
You can compare your Q x Q frequency results with your Frequency Reports (www.AskHYS.net/Reports)• Page 4 in your reports includes crosstabs by gender
Ask someone to review your results
**NOTE**There may be slight differences because of the way different statistical programs round numbers.

Questions?

Thank you!
From the Joint Survey Planning Committee
DASA-DBHR: Linda Becker, Steve Smothers, Grace HongOSPI: Dixie GrunenfelderCommerce: Ramona LeberDOH: Kevin Beck, Vivian Hawkins, Lillian Bensley, Juliet VanEenwykLiquor Control Board: Mary SegawaLooking Glass: Joe KabelRainier Theory: Susan Richardson

Questions?
About this training:
Linda Becker: [email protected] Grunenfelder: [email protected] Richardson: [email protected]
Other HYS questions:


