32
Hysan Development 2015 Interim Results Analyst Briefing 5. 8. 2015
Hysan Development
2015 Interim Results
Analyst Briefing
5. 8. 2015
Disclaimer
This document has been prepared for general information purposes, and is not, and should not be construed as
an offer to sell, or a solicitation of an offer to buy any securities.
Information contained and opinions expressed herein have been complied in good faith by Hysan Development
Company Limited from sources believed by it to be reliable, but no representation or warranty, expressed or
implied, is made as to their accuracy, completeness or correctness. All opinions and estimates contained in this
document are provided in good faith but without any legal liability, specifically, they are not intended to create,
and should not be construed as creating, any legal relationship (whether contractual or otherwise) with you nor
should they be regarded as providing you with any advice or recommendation and are subject to changes
without notice.
Neither Hysan Development Company Limited or any of its subsidiaries or affiliates, nor any of its or their
directors, officers or any other persons, accepts any responsibility or liability whatsoever from any actions or
claims arising from any use or interpretation of the information contained herein. You may not distribute,
reproduce, modify or otherwise use the content of the document for public or commercial use without the
consent of Hysan Development Company Limited.

Agenda
1. Hysan Portfolio
2. 2015 Interim Results Highlights
3. 2015 1H Performance By Portfolio
4. Indicative Cap Rates
5. Hysan Business Update
6. Financial Position
7. 2015 Outlook
3
4
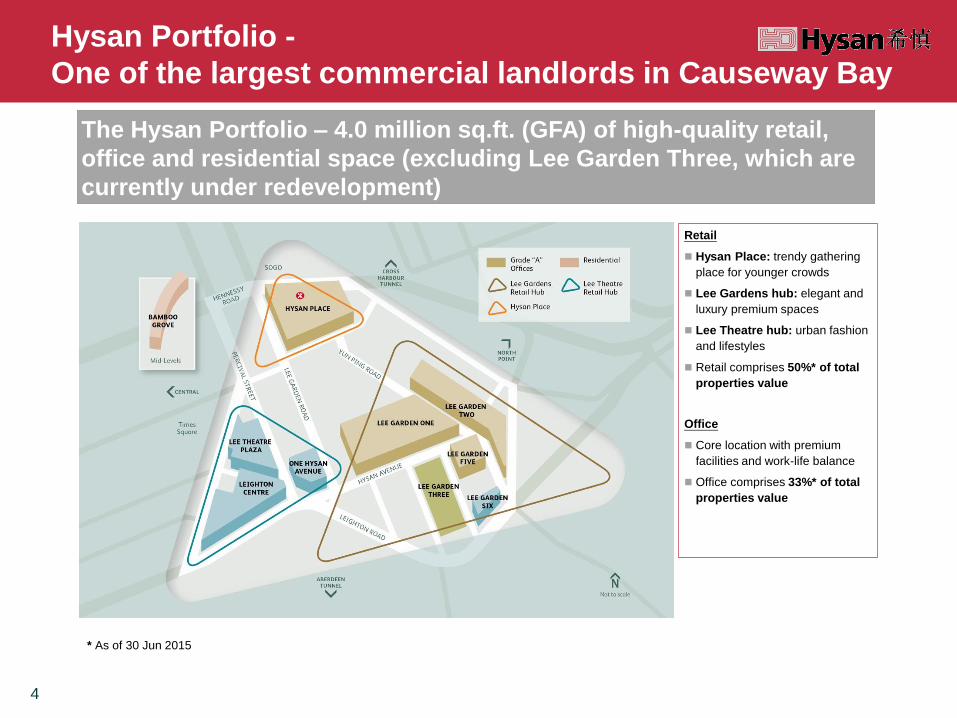
The Hysan Portfolio – 4.0 million sq.ft. (GFA) of high-quality retail,
office and residential space (excluding Lee Garden Three, which are
currently under redevelopment)
* As of 30 Jun 2015
Hysan Portfolio -
One of the largest commercial landlords in Causeway Bay
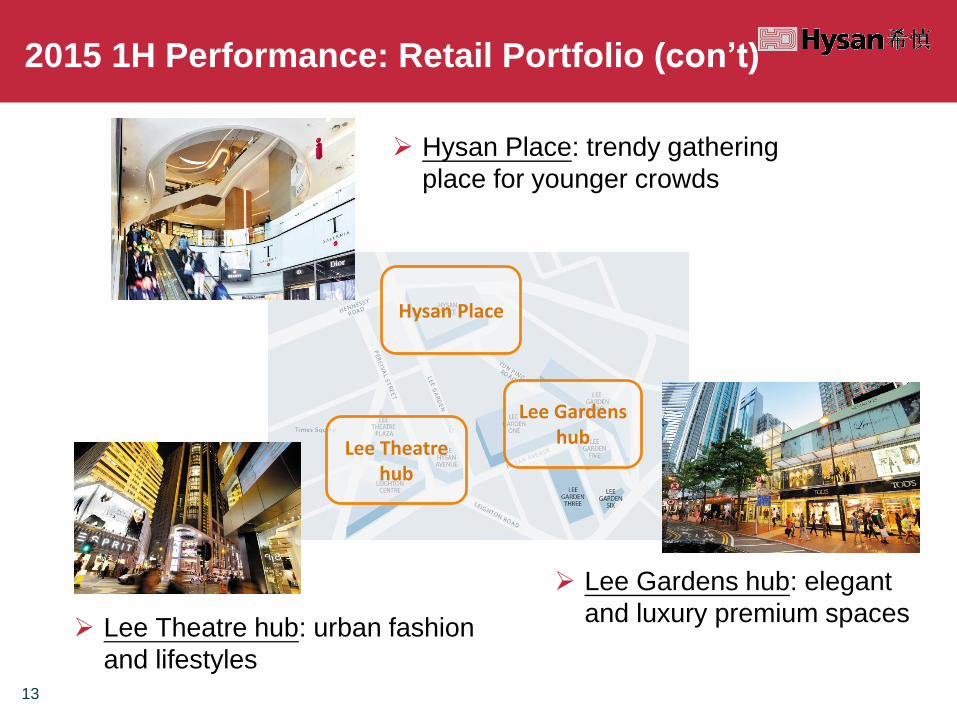
Retail
Hysan Place: trendy gathering
place for younger crowds
Lee Gardens hub: elegant and
luxury premium spaces
Lee Theatre hub: urban fashion
and lifestyles
Retail comprises 50%* of total
properties value
Office
Core location with premium
facilities and work-life balance
Office comprises 33%* of total
properties value

5
2015 Interim Results Highlights ● Turnover up 7.4% year-on-year; Recurring Underlying Profit up 7.5%
● Strong occupancy across our portfolio (Retail: 98%; Office: fully let;
Residential: 95%)
● Steady performance expected for full year: majority of 2015 expiring
commercial leases already committed

6
2015 Interim Results Highlights (con’t)
● Achieved steady growth in our portfolio against mixed results in Hong
Kong’s economic indicators, including weakened retail sales
generally
● Strived to provide retail tenants with an environment within which
they can prosper
We work closely with and provide support through our marketing
and tenant service, as well as customer loyalty programme
This is important especially when shop owners are weathering
market uncertainty

7
2015 Interim Results Highlights (con’t)
● Continued to strengthen all aspects of our business to provide our
tenants, shoppers and visitors with unique and satisfying experience
(“U.S.E.”)
● In recent years, added a number of carefully-curated office, retail and
leisure destinations, reconfigured and enhanced our existing
commercial spaces, as well as improved the feel of the surrounding
environment

8
2015 Interim Results Highlights (con’t)
● Our iconic brand is powered by our ownership cluster
● This area concentration magnifies our ability to extract synergies
among our retail, food and beverage and office tenant mix
9
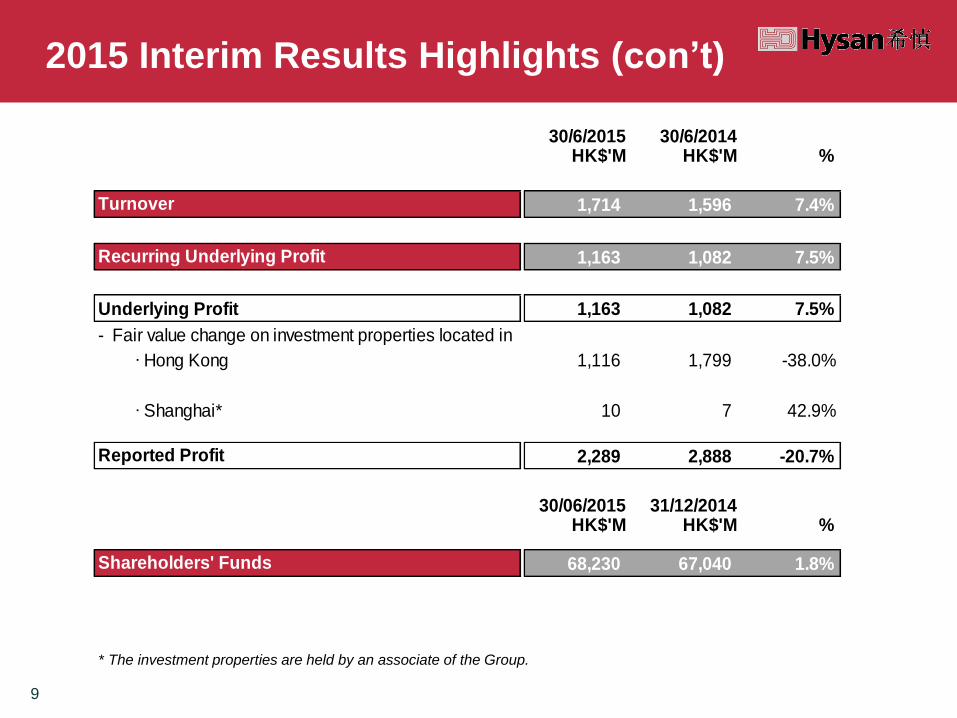
30/6/2015 30/6/2014HK$'M HK$'M %
1,714 1,596 7.4%
1,163 1,082 7.5%
Underlying Profit 1,163 1,082 7.5%
- Fair value change on investment properties located in
‧ Hong Kong 1,116 1,799 -38.0%
‧ Shanghai* 10 7 42.9%
2,289 2,888 -20.7%
30/06/2015 31/12/2014HK$'M HK$'M %
68,230 67,040 1.8%Shareholders' Funds
Reported Profit
Turnover
Recurring Underlying Profit
* The investment properties are held by an associate of the Group.
2015 Interim Results Highlights (con’t)
10
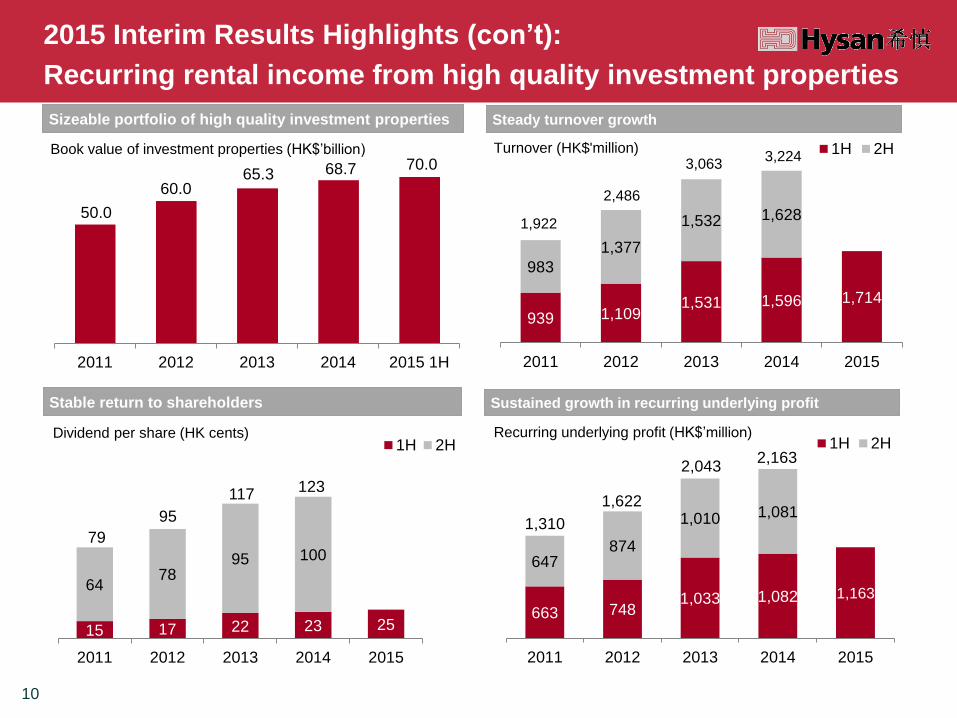
939 1,109 1,531 1,596 1,714
983
1,377
1,532 1,628
2011 2012 2013 2014 2015
1H 2H3,224
Steady turnover growth
2015 Interim Results Highlights (con’t):
Recurring rental income from high quality investment properties
50.0
60.0 65.3 68.7 70.0
2011 2012 2013 2014 2015 1H
Sizeable portfolio of high quality investment properties
Book value of investment properties (HK$’billion) Turnover (HK$'million)
1,922
2,486
3,063
Sustained growth in recurring underlying profit
15 17 22 23 25
64 78
95 100
2011 2012 2013 2014 2015
1H 2H
Stable return to shareholders
Dividend per share (HK cents)
663 748 1,033 1,082 1,163
647 874
1,010 1,081
2011 2012 2013 2014 2015
1H 2H
1,310
1,622
2,043 2,163
79
95
117 123
Recurring underlying profit (HK$’million)

11
2015 1H Performance: By Portfolio
1,596 1,628 1,714
Residential
Office
Retail
HK$950M (55%)
HK$561M (35%)
HK$893M (56%) HK$908M (56%)
HK$575M (35%)
HK$145M (9%)
2015 1H
2014 2H 2014 1H
Turnover (HK$’M)
HK$142M (9%)
HK$618M (36%)
HK$146M (9%)

12
2015 1H Performance: Retail Portfolio
Market overview: Hong Kong Retail Sales
● 2015 1H: overall decline of 1.6% when compared to same period 2014
● Reflected fall in luxury items (e.g. the sales of jewellery and watches)
● Mid-priced and basic products still recorded growth
Type of retail outlet Jan-Jun 2015
(YoY)
Jewellery, watches and clocks, and valuable gifts -15.9%
Other consumer durable goods (include electronic goods and
computers)
+23.2%
Food, alcoholic drinks and tobacco (other than supermarkets) +7.9%
13
Hysan Place: trendy gathering
place for younger crowds
Lee Gardens hub: elegant
and luxury premium spaces Lee Theatre hub: urban fashion
and lifestyles
Lee Gardens hub
Lee Theatre hub
Hysan Place
2015 1H Performance: Retail Portfolio (con’t)

14
● Retail portfolio turnover increased by
6.4% to HK$950 million (2014 1H :
HK$893 million)
Turnover rent of HK$50 million
(2014 1H: HK$60 million)
● Occupancy: 98% as at 30 Jun 2015
(31 Dec 2014: fully let)
Retail Portfolio Turnover
893 908 950
0
200
400
600
800
1,000
2014 1H 2014 2H 2015 1H
HK$’M
Turnover
6.4%
2015 1H Performance: Retail Portfolio (con’t)
15
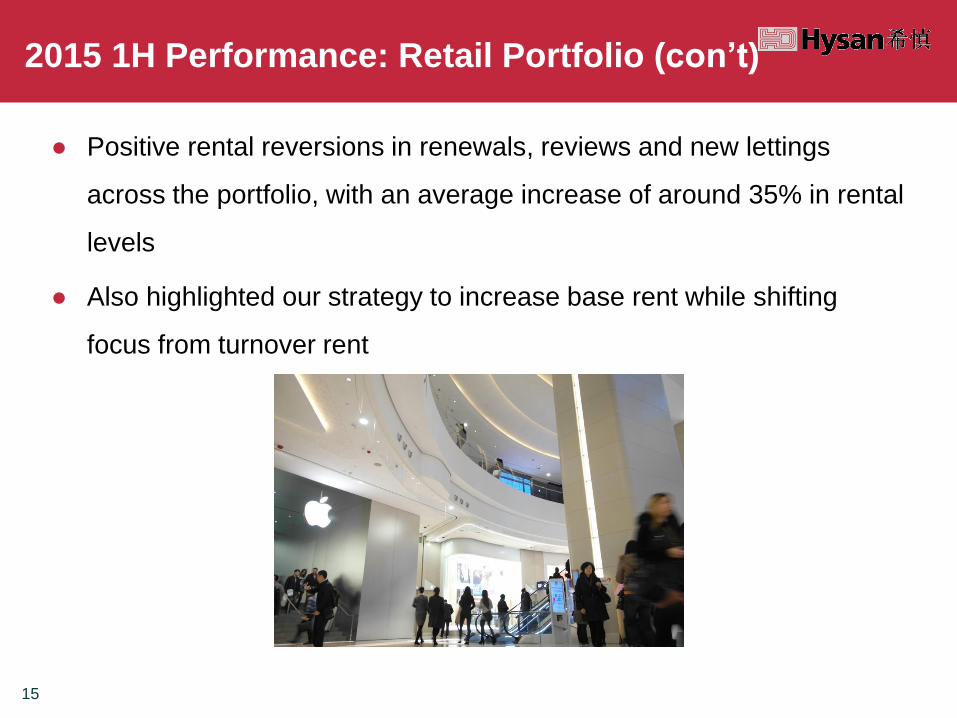
● Positive rental reversions in renewals, reviews and new lettings
across the portfolio, with an average increase of around 35% in rental
levels
● Also highlighted our strategy to increase base rent while shifting
focus from turnover rent
2015 1H Performance: Retail Portfolio (con’t)
16
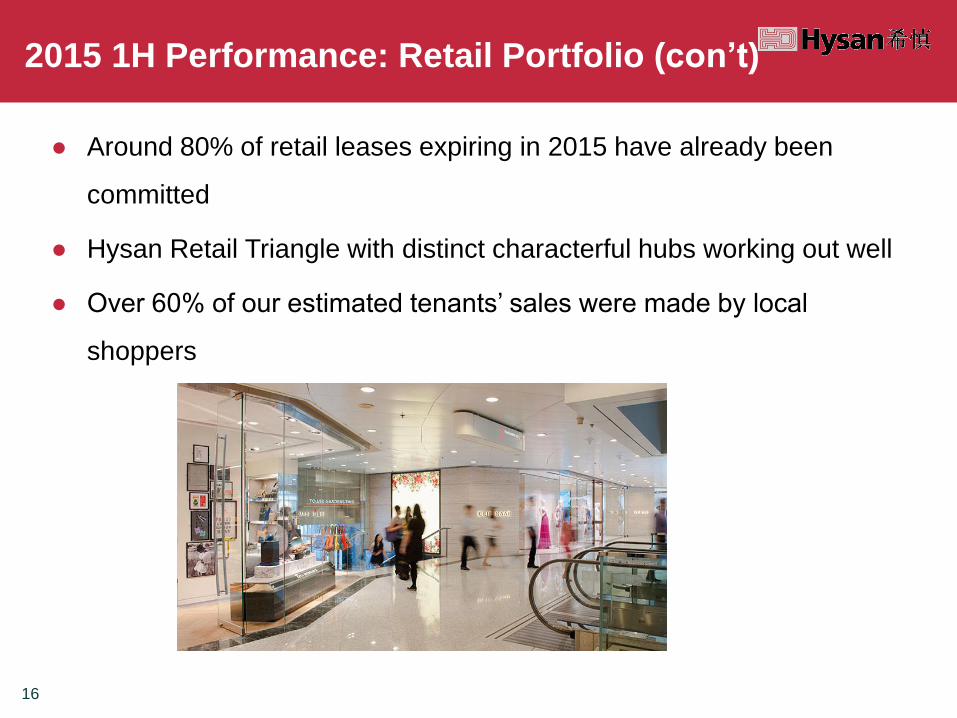
● Around 80% of retail leases expiring in 2015 have already been
committed
● Hysan Retail Triangle with distinct characterful hubs working out well
● Over 60% of our estimated tenants’ sales were made by local
shoppers
2015 1H Performance: Retail Portfolio (con’t)

17
● Good foot traffic translated into satisfactory sales
● Estimated overall tenant sales increase in retail portfolio was around
40% in the first half of the year, when compared to same period in
2014
2015 1H Performance: Retail Portfolio (con’t)

18
● Lee Theatre hub
Around 10% increase in estimated tenant sales
Lee Theatre Plaza flagship stores and Leighton Centre “sports-
themed street” popular; created new home for sporty apparel and
footwear brands, such as adidas Originals, Asics and Onitsuka
Tiger
2015 1H Performance: Retail Portfolio (con’t)

19
2015 1H Performance: Retail Portfolio (con’t)
● Hysan Place
Around 80% growth in estimated tenant sales
Refining tenant mix and actively managing with a focus on unisex
sports and leisure offerings
o lululemon, top yoga apparel brand, opening largest Hong
Kong store
o T Galleria by DFS revamped entire floor of beauty offerings
with a new experiential format
20
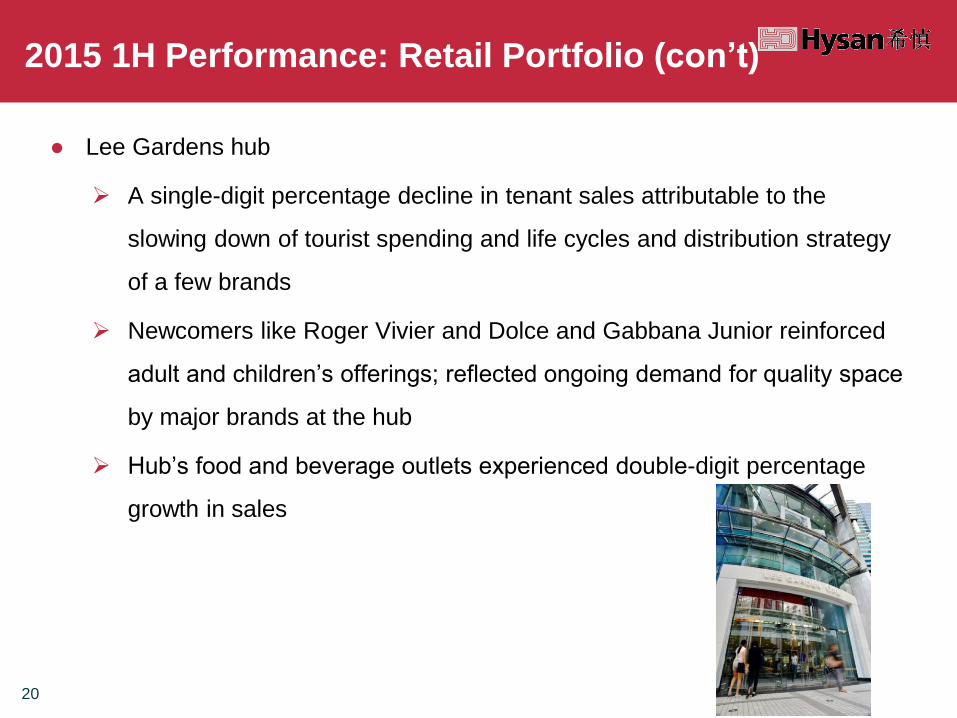
● Lee Gardens hub
A single-digit percentage decline in tenant sales attributable to the
slowing down of tourist spending and life cycles and distribution strategy
of a few brands
Newcomers like Roger Vivier and Dolce and Gabbana Junior reinforced
adult and children’s offerings; reflected ongoing demand for quality space
by major brands at the hub
Hub’s food and beverage outlets experienced double-digit percentage
growth in sales
2015 1H Performance: Retail Portfolio (con’t)

21
● Hysan’s office space accounts for more than 50% of its overall
portfolio’s gross floor area
● Contributes 36% of its turnover
2015 1H Performance: Office Portfolio

22
Office Portfolio Turnover ● Office portfolio revenue increased by
10.2% to HK$618 million (2014 1H:
HK$561 million)
● Occupancy: fully let as at 30 Jun
2015 (31 Dec 2014: 98%)
561 575 618
0
200
400
600
800
1,000
2014 1H 2014 2H 2015 1H
HK$’M
Turnover
10.2%
2015 1H Performance: Office Portfolio (con’t)

23
2015 1H Performance: Office Portfolio (con’t)
● Office space vacancies tightened in Central due to strong Mainland China
financial firms’ demand
● Being a credible alternative to Central and Admiralty as a premium office
address, Hysan’s portfolio is attracting local and overseas companies
● Good work-life integration well-liked by technology and financial companies
that thrive on inspirational setting and locational convenience
● Recent new tenants include Commerzbank and Bank of Communications
24
● Balanced tenant mix:
Insurance
Professional and Consulting
High-end Retailers
Banking and Finance
Represented 54% of our office lettable floor area
● No single category took up more than 20% of total lettable area
2015 1H Performance: Office Portfolio (con’t)
25
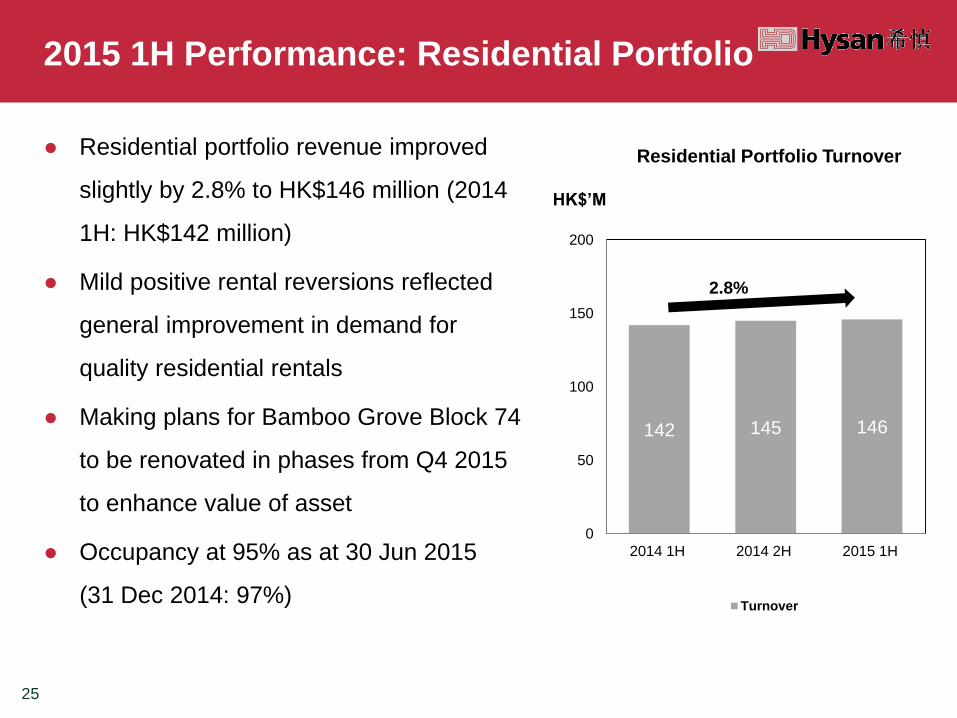
● Residential portfolio revenue improved
slightly by 2.8% to HK$146 million (2014
1H: HK$142 million)
● Mild positive rental reversions reflected
general improvement in demand for
quality residential rentals
● Making plans for Bamboo Grove Block 74
to be renovated in phases from Q4 2015
to enhance value of asset
● Occupancy at 95% as at 30 Jun 2015
(31 Dec 2014: 97%)
Residential Portfolio Turnover
2015 1H Performance: Residential Portfolio
142 145 146
0
50
100
150
200
2014 1H 2014 2H 2015 1H
HK$’M
Turnover
2.8%

26
● No change in Cap rate from 31 Dec 2014
30 Jun 2015 31 Dec 2014
Office
The Lee Gardens
Caroline Centre
4.25%
4.75%
4.25%
4.75%
Retail
Lee Gardens One
Lee Gardens Two
5.00%
5.25%
5.00%
5.25%
Residential
Bamboo Grove
3.75% 3.75%
Indicative Cap Rates

27
Hysan Business Update: Lee Garden Three
● Strutting, excavation and other foundation works for former Sunning
Redevelopment Project continued in 2015 1H, and will be completed
by early 2016
● Project expected to be completed around 2018
● Building to have a five-level retail podium, 20 floors of offices and five
levels of basement

28
Hysan Business Update: Asset Enhancement
Project
● Enhancement project for Lee Garden One ground floor lobby and higher
floors retail space making good progress
● Accessibility and circulation of the office and retail areas will be improved,
also create new shop space and retail offerings. First phase revamping G/F
lobby and adding elevators completed on 28 July 2015
● Project anticipated to be completed by the second half of 2016
Before After

29
Strong Financial Position
● Net Interest Coverage: 20.3 times (2014: 15.4 times)
● Net Debt to Equity: 3.2% (31 Dec 2014: 4.2%)
● Total Gross Debt: HK$5,825 million (31 Dec 2014: HK$6,457 million)
● Average Finance Costs: 3.3% (2014: 3.1%)
● Average Debt Maturity: 5.7 years (31 Dec 2014: 5.6 years)
● Fixed Rate Debt: 81.1% of the total gross debt (31 Dec 2014: 76.3% of
the total gross debt )
● Capital Market Issuance: 86.3% (31 Dec 2014: 83.0%)
● Moody’s: A3;
Standard and Poor’s: BBB+
30
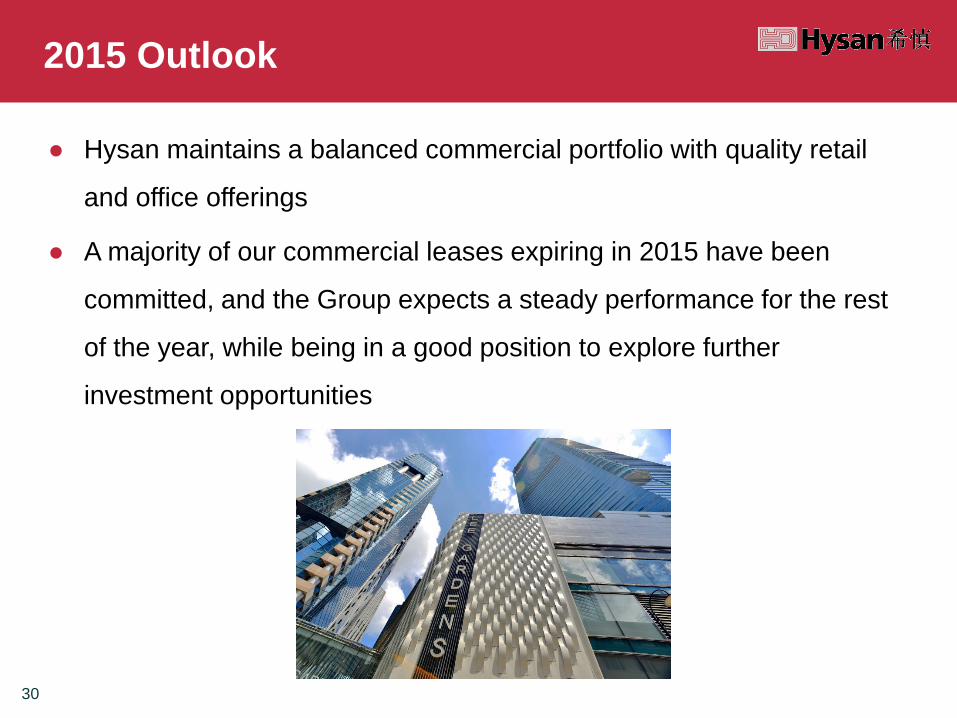
2015 Outlook
● Hysan maintains a balanced commercial portfolio with quality retail
and office offerings
● A majority of our commercial leases expiring in 2015 have been
committed, and the Group expects a steady performance for the rest
of the year, while being in a good position to explore further
investment opportunities

31
2015 Outlook (con’t)
● As for the macro picture and in the longer term, Hong Kong’s office
leasing will continue to benefit from China’s financial market
liberalisation, resulting in strong office space demand
● China’s GDP growth should ensure its middle class will continue to
expand, and with it, greater consumption power
● Hong Kong’s retail market is also underpinned by solid local support
and demand
● With retailers and landlords adapting to changes in shopping
patterns, we are confident the retail sector will weather the market
volatility

Thank You


