Material for FY2016 Second Quarter Financial Results Briefing Nov 2016 TADANO Ltd. I. Basic Business Vision & Mid-Term Management Plan 䠄pp. 1-16䠅 II. FY2016 Interim and Beyond 䠄pp.17-27䠅 Content
Transcript
Material for FY2016 Second Quarter Financial Results Briefing
Nov 2016 TADANO Ltd.
I. Basic Business Vision & Mid-Term Management Plan pp. 1-16 II. FY2016 Interim and Beyond pp.17-27
Content
1
I. Basic Business Vision & Mid-Term Management Plan
2
1948 Tadano Ltd. established 1955 Developed Japan’s first hydraulic truck
crane
Current Business Domain: Lifting Equipment (LE) Industry
1. Business Domain
2. Corporate Philosophy
3
3. Vision
4
Pursuing Further Excellence for the World and the Future.
4. Core Values
5
5. Long-Term Goals
6
No.1 worldwide in the LE Industry
Outside Japan Sales Ratio: 80%
Company with stable and high
profitability
(Constant 20% Operating Income ratio) (C
6. LE industry
Both the LE industry and Tadano have big potential Uptrends in the long term… However, in the mid- and short-term, demand is volatile
From the perspective of demographics, LE is a GROWTH INDUSTRY
Volatile Up-Down Trends
7
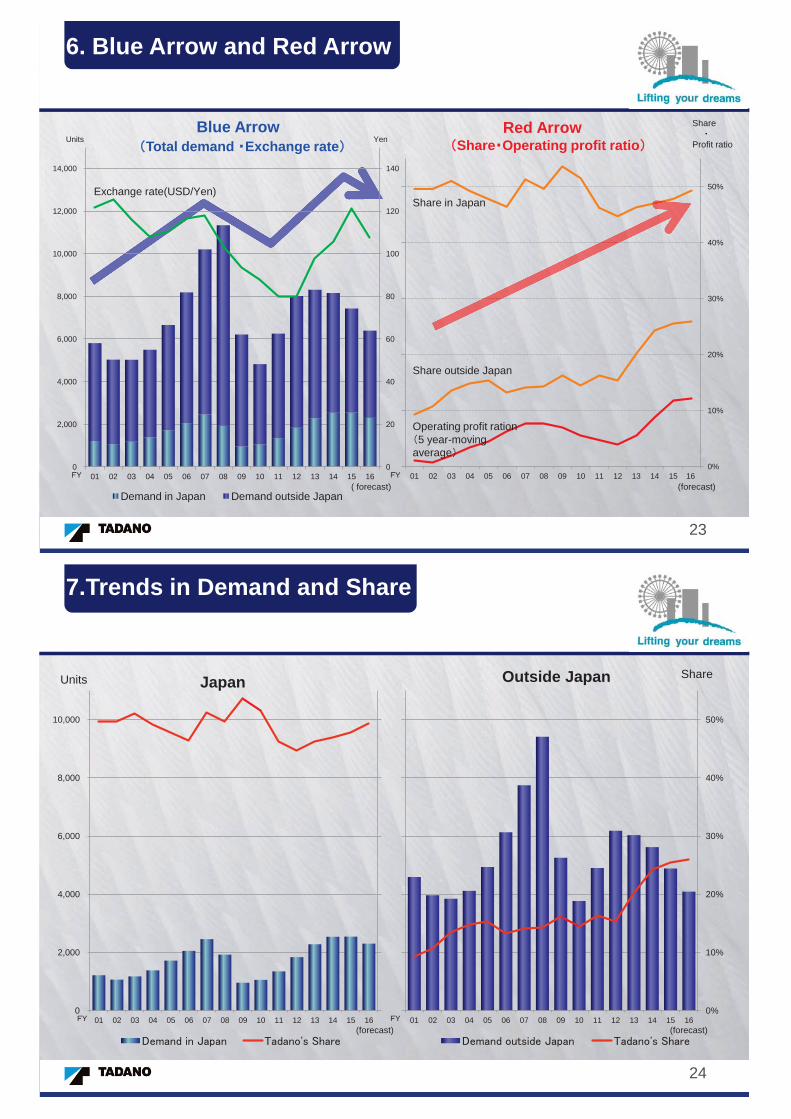
Market Demand Exchange rate
Self-Support Effort
Performance
Investment New Plant M & A
8
7. Self-Support Effort (The Red Arrow)
8. Crane Characteristics
Number of parts: Many Complicated, Difficult : Process Accuracy: High
Demand Fluctuation: Volatile
Parts Sales Ratio: Low
Used Machine Value: High
9
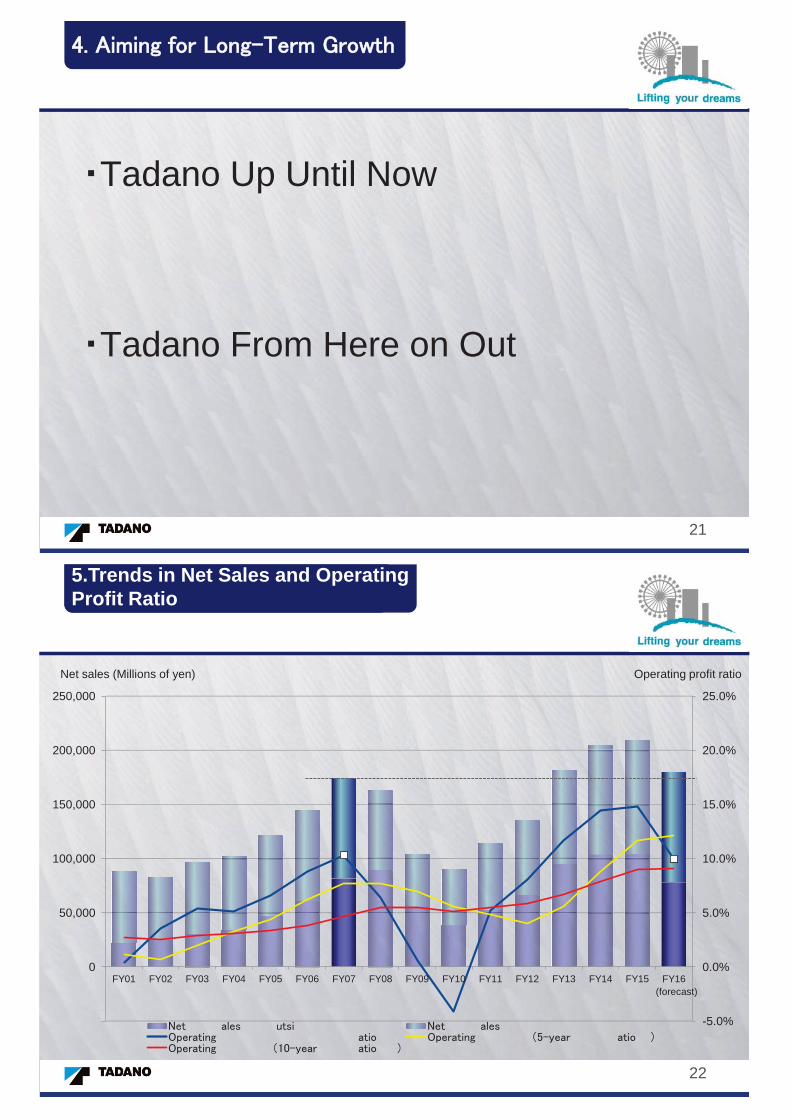
0
50,000
100,000
150,000
200,000
250,000
05 06 07 08 09 10 11 12 13 14 15 16
Demand for Excavator
Units
Mobile Crane
10
0
2,000
4,000
6,000
8,000
10,000
12,000
05 06 07 08 09 10 11 12 13 14 15 16
Demand for Mobile Crane
Based on Tadano research. Mobile cranes produced in China and Russia are excluded
Units
9. Trends in Demand
(forecast) (forecast)
Excavator
10. Parts Sales Ratio Consolidated)
FY2014 FY2015 FY2016.2Q
Komatsu 19.6% 21.4% 22.1%
HCM 21.4% 23.2% 23.3%
TADANO 6.3% 6.3% 6.4%
11
*HCM: Hitachi Construction Machinery
12
Product Competitiveness
Product Quality
CS Capability
Used Crane
Value
11. Manufacturer With Four Synergistic Strengths
Competitiveness that can be attained after a long-term effort
A manufacturer with
four synergistic strengths!
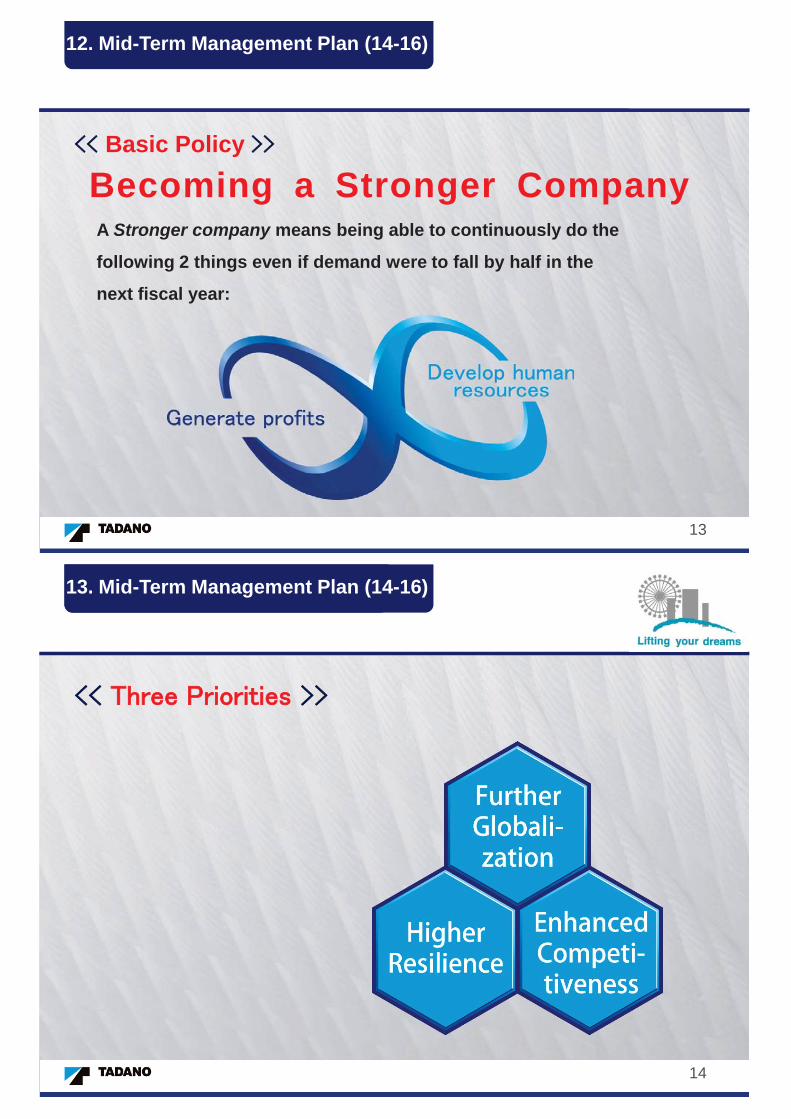
A Stronger company means being able to continuously do the
following 2 things even if demand were to fall by half in the
next fiscal year:
Becoming a Stronger Company Basic Policy
12. Mid-Term Management Plan (14-16)
13
14
13. Mid-Term Management Plan (14-16)
Seven Strategies
15
Enhance volume & quality in Core Market, Expand volume in Strategic Market
Provide No.1 products and expand our sales lineup
Pursue global & flexible MONOZUKURI
Provide Outstanding Quality & Service
Improve life-cycle value of our products
Raise profitability level
Strengthen the TADANO group & global management structure
14. Mid-Term Management Plan (14-16)
16
15.Mid –Term Management Plan (14-16)Target and Results
Inside Japan ¥88.0billion ¥100.5billion ¥104.9billion ¥102.0billion
Outside Japan ¥132.0billion ¥103.5billion ¥104.4billion ¥78.0billion
Outside Japan Ratio 60.0% 50.7% 49.9% 43.3%
Operating Income ¥30.0billion ¥29.4billion ¥31.0billion ¥18.0billion
Operating Income Ratio 13.6% 14.4% 14.8% 10.0%
Inventory Turnover Ratio 5.0 4.0 3.9 3.7
ROA 13.0% 13.9% 13.5% 7.7%
FY2016 nterim and Beyond
17
Japanese Market: Stable
Outside the Japanese Market: Market peak in FY2012
Demand has been decreasing for three consecutive fiscal years (starting in FY2013)
Demand decreased further in FY2016 Tadano’s market share is up Up through FY2015 Tadano’s revenues and profits reached record highs
for three consecutive fiscal years. However, in the first half of FY2016, we posted decrease in revenues and profits for the first time in six years.
18
1. FY2016 Interim
2. FY2016 & FY2017
•Current Outlook: Severe conditions for next two years Japanese Market: Stable
(High plateau through FY2018. Decline expected from FY2019) Markets Outside Japan: Severe (Decline through FY2017. Recovery expected from FY2018)
•We seek to improve our market position outside of Japan while we continue to benefit from favorable conditions within the Japanese market •FY2017 results will be on par with those of FY2016
•The external market environment is unclear, but we expect to maintain sales and profits at or above the FY2007 levels (record highs at the time) that preceded the Lehman Shock
19
FY2007 FY2016 Forecast
Sales Inside Japan Outside Japan
¥174.3billion ¥92.8billion ¥81.5billion
¥180.0billion ¥102.0billion
¥78.0billion
Operating Income ¥17.9billion ¥18.0billion
World Demand Japan fiscal year base Outside Japan calendar year base
Sales ¥300billion Inside Japan ¥100billion Outside Japan ¥200billion Operating Income ¥50billion Operating income rate 16.7%
10. Strategies
In order to Become a Manufacturer with Four Synergistic Strengths Establish more sales, parts, and service locations Enhance our Used Crane Operation Establish a new plant M&A 2 companies
Further increase for rough terrain crane (RC) market share There are growth opportunities in all terrain crane (AC) and truck crane (TC)
markets -AC: Establish stronger foundation over next 2 years, then begin increasing
share from FY2018 -TC: Re-establish TC strategy and start to expand sales from FY2017
Increase truck loader crane sales outside of Japan Expand solution-based business through information and communication technology
27
28
Pursuing Further Excellence for the World and the Future.


![Venous Thromboembolism Treatment- Handout · ] u ] } o } P Ç õ ì ì U ì ì ì sd ] v ] v v v µ o o Ç & ] sd } µ ] v í ì ì l í ì ì U ì ì ì } v v v µ o o Ç](https://static.documents.pub/doc/80x56/5f7631aa942d59310e7cd1f8/venous-thromboembolism-treatment-handout-u-o-p-u-sd.jpg)


![QUREQD6 - Santa Clara County, California · ì ì ì ì ì ì ì ì ì ì ì ì ì ì ì ì ì ì ì ì ì ì ììîï ì µ Ç l } } l l ^ v } v l ^ v } v l } v P ^ ] v P](https://static.documents.pub/doc/80x56/5f7e8ea4df862a52d11eb765/qureqd6-santa-clara-county-california-.jpg)


![VCE presentation bis [modalità compatibilità ]...ì ñ ì ì í ì ì ì í ñ ì ì î ì ì ì î ñ ì ì ï ì ì ì ï ñ ì ì ð ì ì ì ð ñ ì ì ñ ì ì ì ì ñ ì](https://static.documents.pub/doc/80x56/5e378739bcb7c064f14877d2/vce-presentation-bis-modalitf-compatibilitf-.jpg)


