52
By Tiago Henriques, Filipa Rodrigues Florentino Bexiga, Ana Barbosa I, for one, welcome our new Cyber Overlords! An introduction to the use of data science in cybersecurity
| Date post: | 16-Apr-2017 |
| Category: |
Technology |
| Upload: | tiago-henriques |
| View: | 466 times |
| Download: | 1 times |

By Tiago Henriques, Filipa Rodrigues Florentino Bexiga, Ana Barbosa
I, for one, welcome our new Cyber Overlords!
An introduction to the use of data science in cybersecurity

WHO ARE WE?
MACHINE LEARNING AND CYBERSECURITY
IMAGE WORKFLOW
IMAGE ANALYSIS IN DETAIL
DATA VISUALISATION
Agenda
Tiago is the CEO and Data necromancer at BinaryEdge however he gets to meddle in the intersection of data science and cybersecurity by providing his team with lovely problems that they solve on a daily basis.
Tiago Henriques
Presenter

Florentino is the Data MacGyver at BinaryEdge. On a daily basis he needs to deploy infrastructure used to analyse big and realtime data. When not doing that, he can be found creating models to analyse data. Give him an orange, he’ll give you a skynet. Why an orange you ask? He’s hungry and likes oranges, there!
Florentino Bexiga
Presenter

Filipa is the Data Diva at BinaryEdge, she dances the macarena with numbers to get them to tell her all their dirty secret.
Filipa Rodrigues
Presenter

Ana is the Data Ferret at BinaryEdge. She is small and hides between the 110th and 111th characters of the ascii code to see and show data in that unique perspective of someone who can’t reach the box of cookies stored on top of the capitol 'I'
Ana Barbosa
Presenter

Earlier today

BinaryEdge
HACKINGSKILLS
SECURITY DOMAINEXPERTISE
STATISTICSKNOWLEDGE
MACHINELEARNING
TRADITIONALRESEARCH
DANGER
ZONE!
DATASCIENCE
Source: Data-Driven Security: Analysis, visualisation and Dashboards (adapted)

How we got here....
200 port scan of the entire internet/ month1,400,000,000 scanning events/ month *746,000 torrents monitored and increasing1,362,225,600 torrent events/ month
* at a minimum
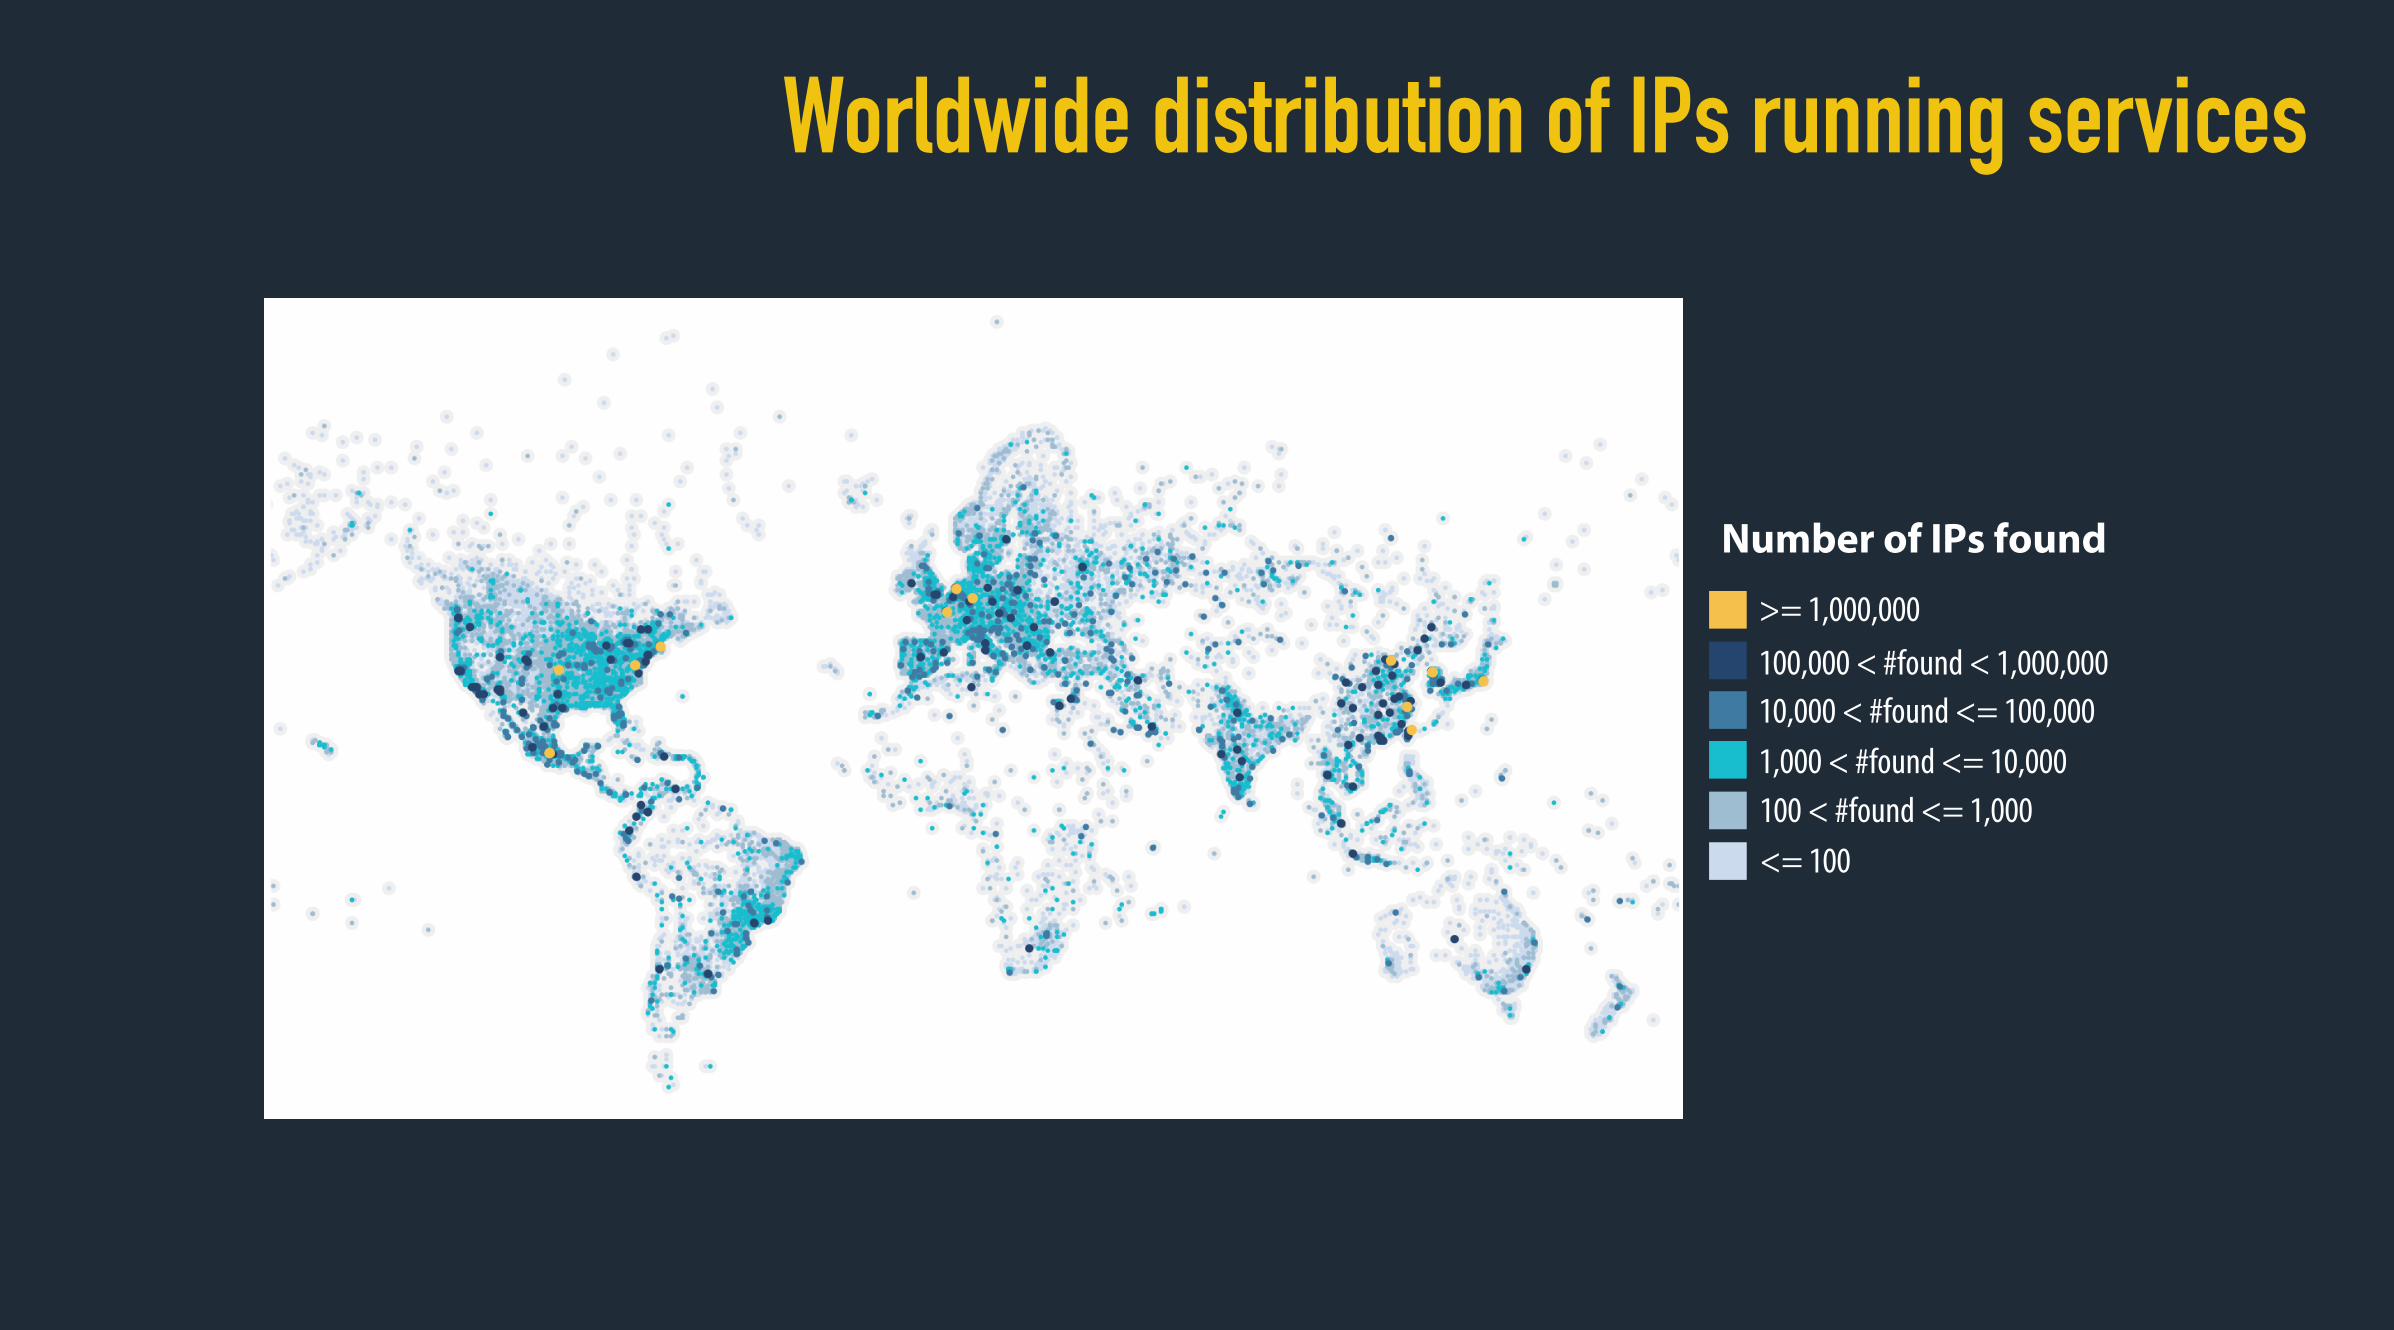
Worldwide distribution of IPs running services
<= 100
Number of IPs found
>= 1,000,000100,000 < #found < 1,000,00010,000 < #found <= 100,0001,000 < #found <= 10,000100 < #found <= 1,000

Map IPv4 addresses to Hilbert curves
% of coverage100%90%80%70%60%50%40%30%20%10%0%

Data Science & Machine Learning
How many IP addresses did job X had vs. job Y?What is the average duration of the scans?Can we extract more from all the screenshots we get?Can we have a more optimized job distribution?
We can only identify X% of services because we’re using static signatures, can we do better?
Can we find similar images?
MULTIPLE WILD QUESTIONS APPEAR... ...ONE COMMON ANSWER
DATA SCIENCE
&MACHINE LEARNING

Data Science & Machine Learning
DATA SCIENCE MACHINE LEARNING
INITIAL ANALYSIS AND CLEAN UP
EXPLORATORY DATA ANALYSIS
DATA VISUALISATION
KNOWLEDGE DISCOVERY
CLASSIFICATION
CLUSTERING
SIMILARITY MATCHING
REGRESSION
IDENTIFICATION

Problems and Limitations of Machine Learning in CyberSecurity
Lots of adversarial scenarios – Attacks to the classifiers, goes against the foundation of machine learning
Prediction – Scenarios and data too volatile, not enough proper sources of data
Lack of data in quantity and quality to train models

Good use cases
further work needs to be done, but will allow to move antivirus from a static/ signature based system into a much improved dynamic/ learning based system
If a computer is hacked certain behaviors will change, if constant data is being monitored and fed into a system the hack could be detected
detection of vulnerable patterns during development
sentiment analysis applied to emails, tweets, social networks of employees
PATTERN DETECTION/OUTLIER DETECTION (IDS/IPS)
ANTIVIRUS
ANTI-SPAM
SMARTER FUZZERS
SOURCE CODE ANALYSIS
INTERNAL ATTACKERS
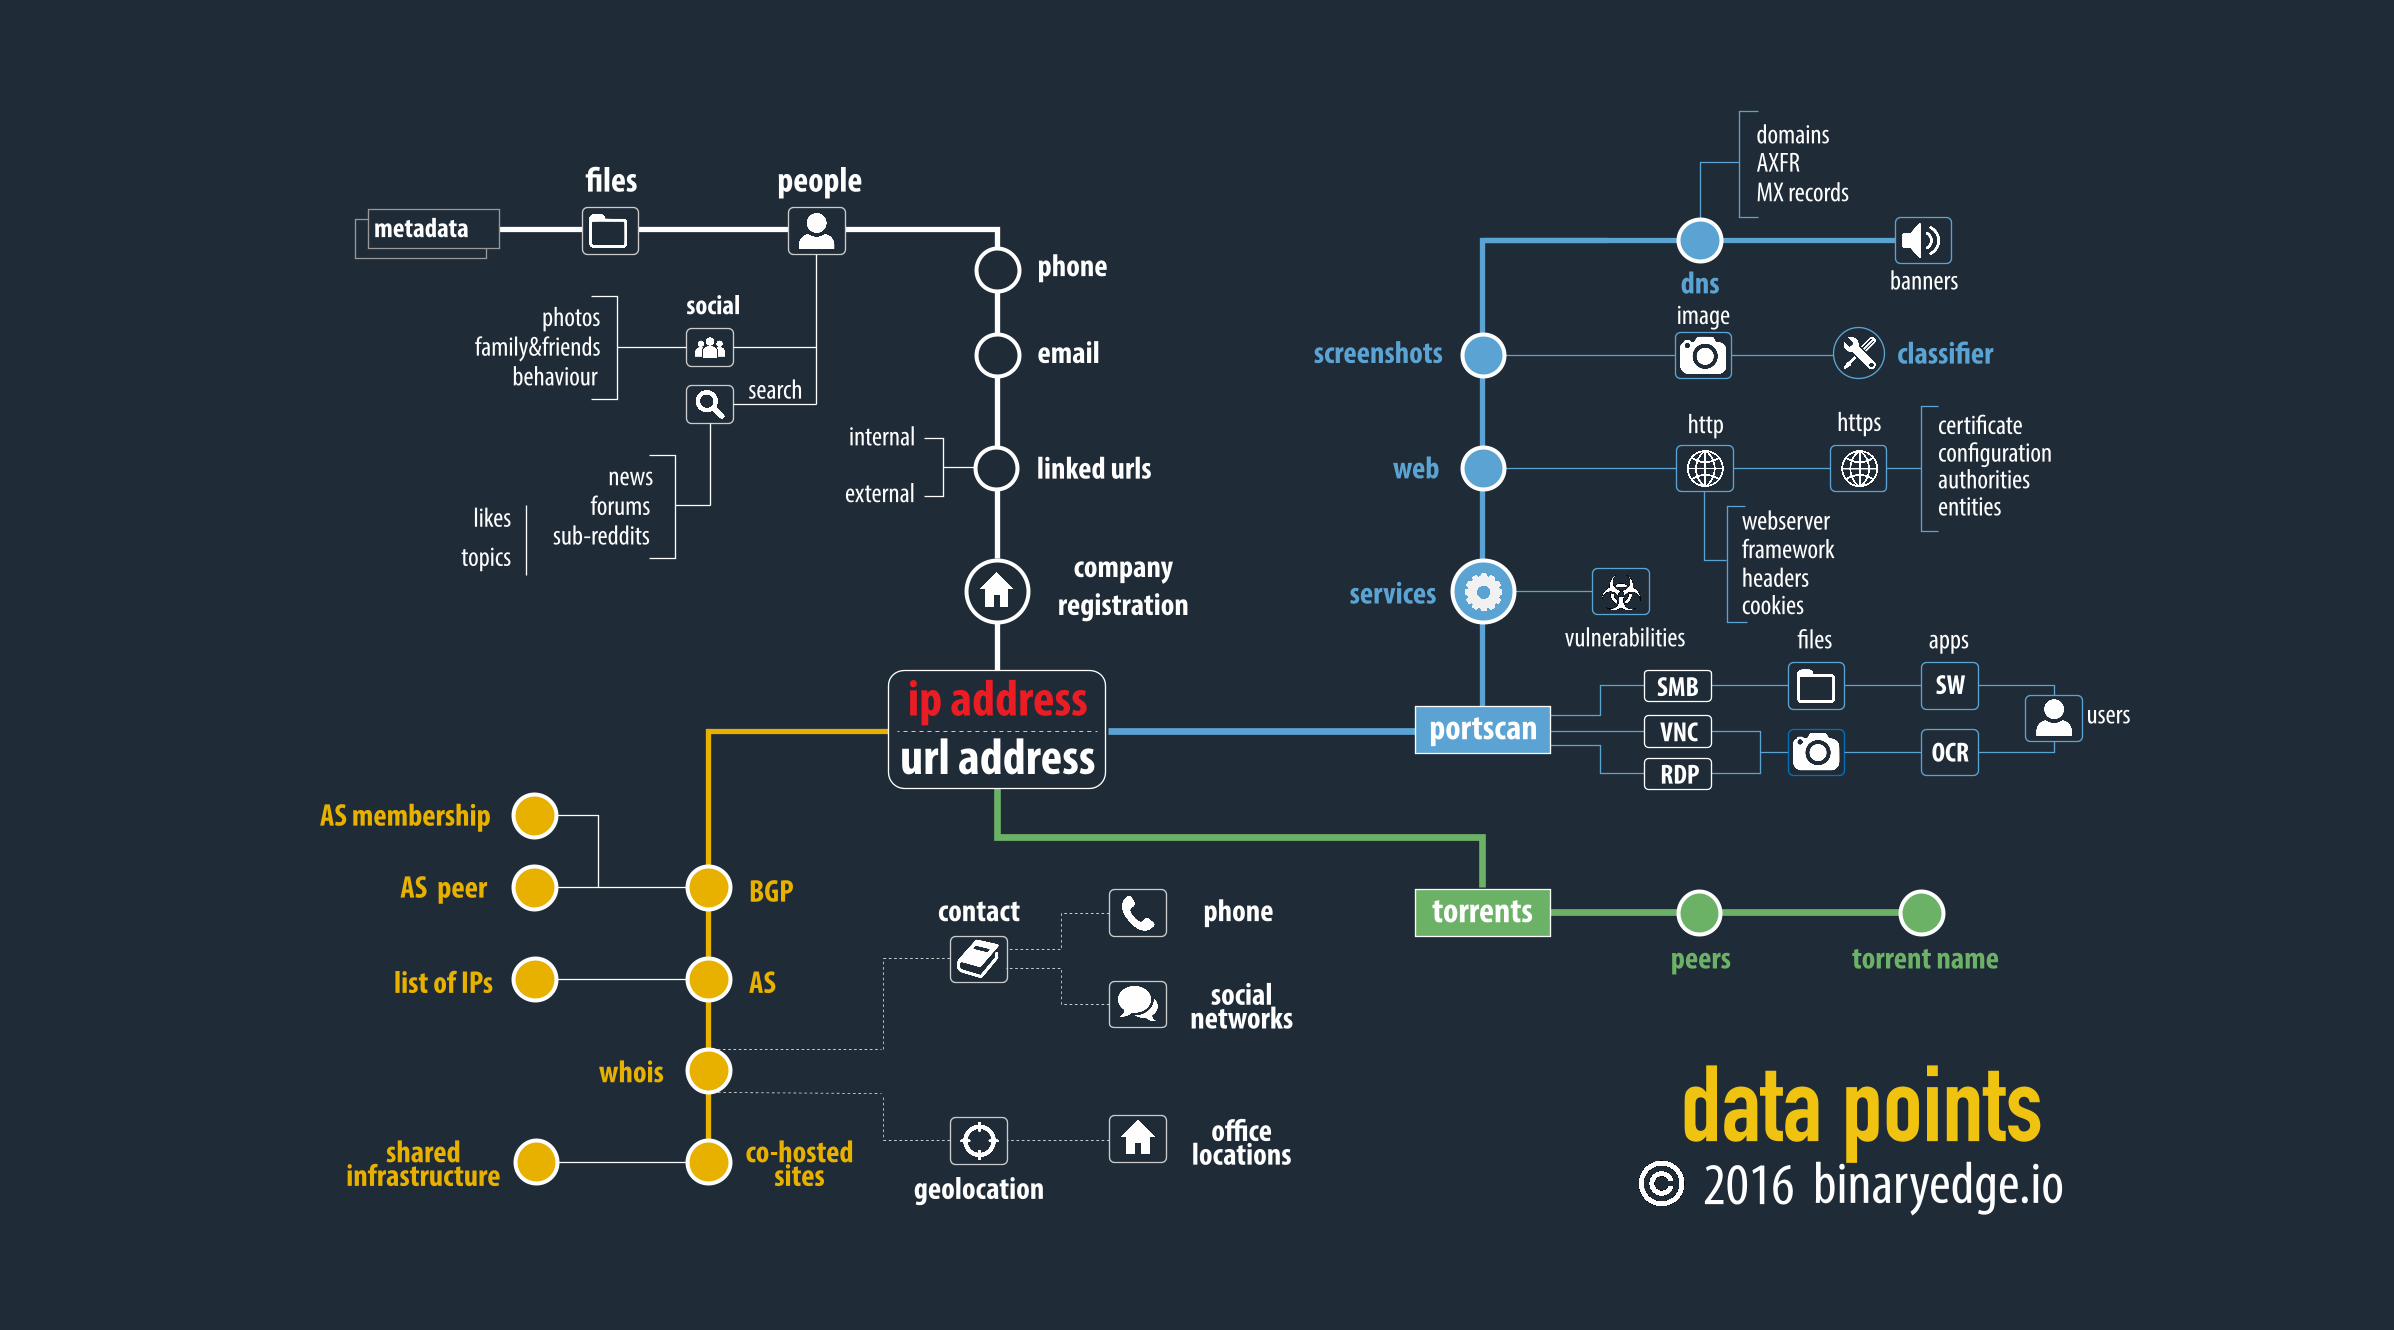
metadata
�les people
photosfamily&friends
behaviour
social
search
companyregistration
ip addressurl address
newsforums
sub-reddits
internal
external
phone
linked urls
likestopics
BGP
AS
whois
AS membership
AS peer
list of IPs
sharedinfrastructure
co-hostedsites
contact
geolocation
o�celocations
socialnetworks
phone
portscan
dns
torrents
binaryedge.io2016
domainsAXFRMX records
screenshots
web
services
http https
webserverframeworkheaderscookies
certi�catecon�gurationauthoritiesentities
SMB
VNC
RDP
users
apps�les
peers torrent name
OCR
SW
bannersimage
classi�er
vulnerabilities
data points

Torrent Correlation

Torrent Correlation
China or Military

Data correlation

Data correlation
Turkish IP


DEMO

At PixelsCamp
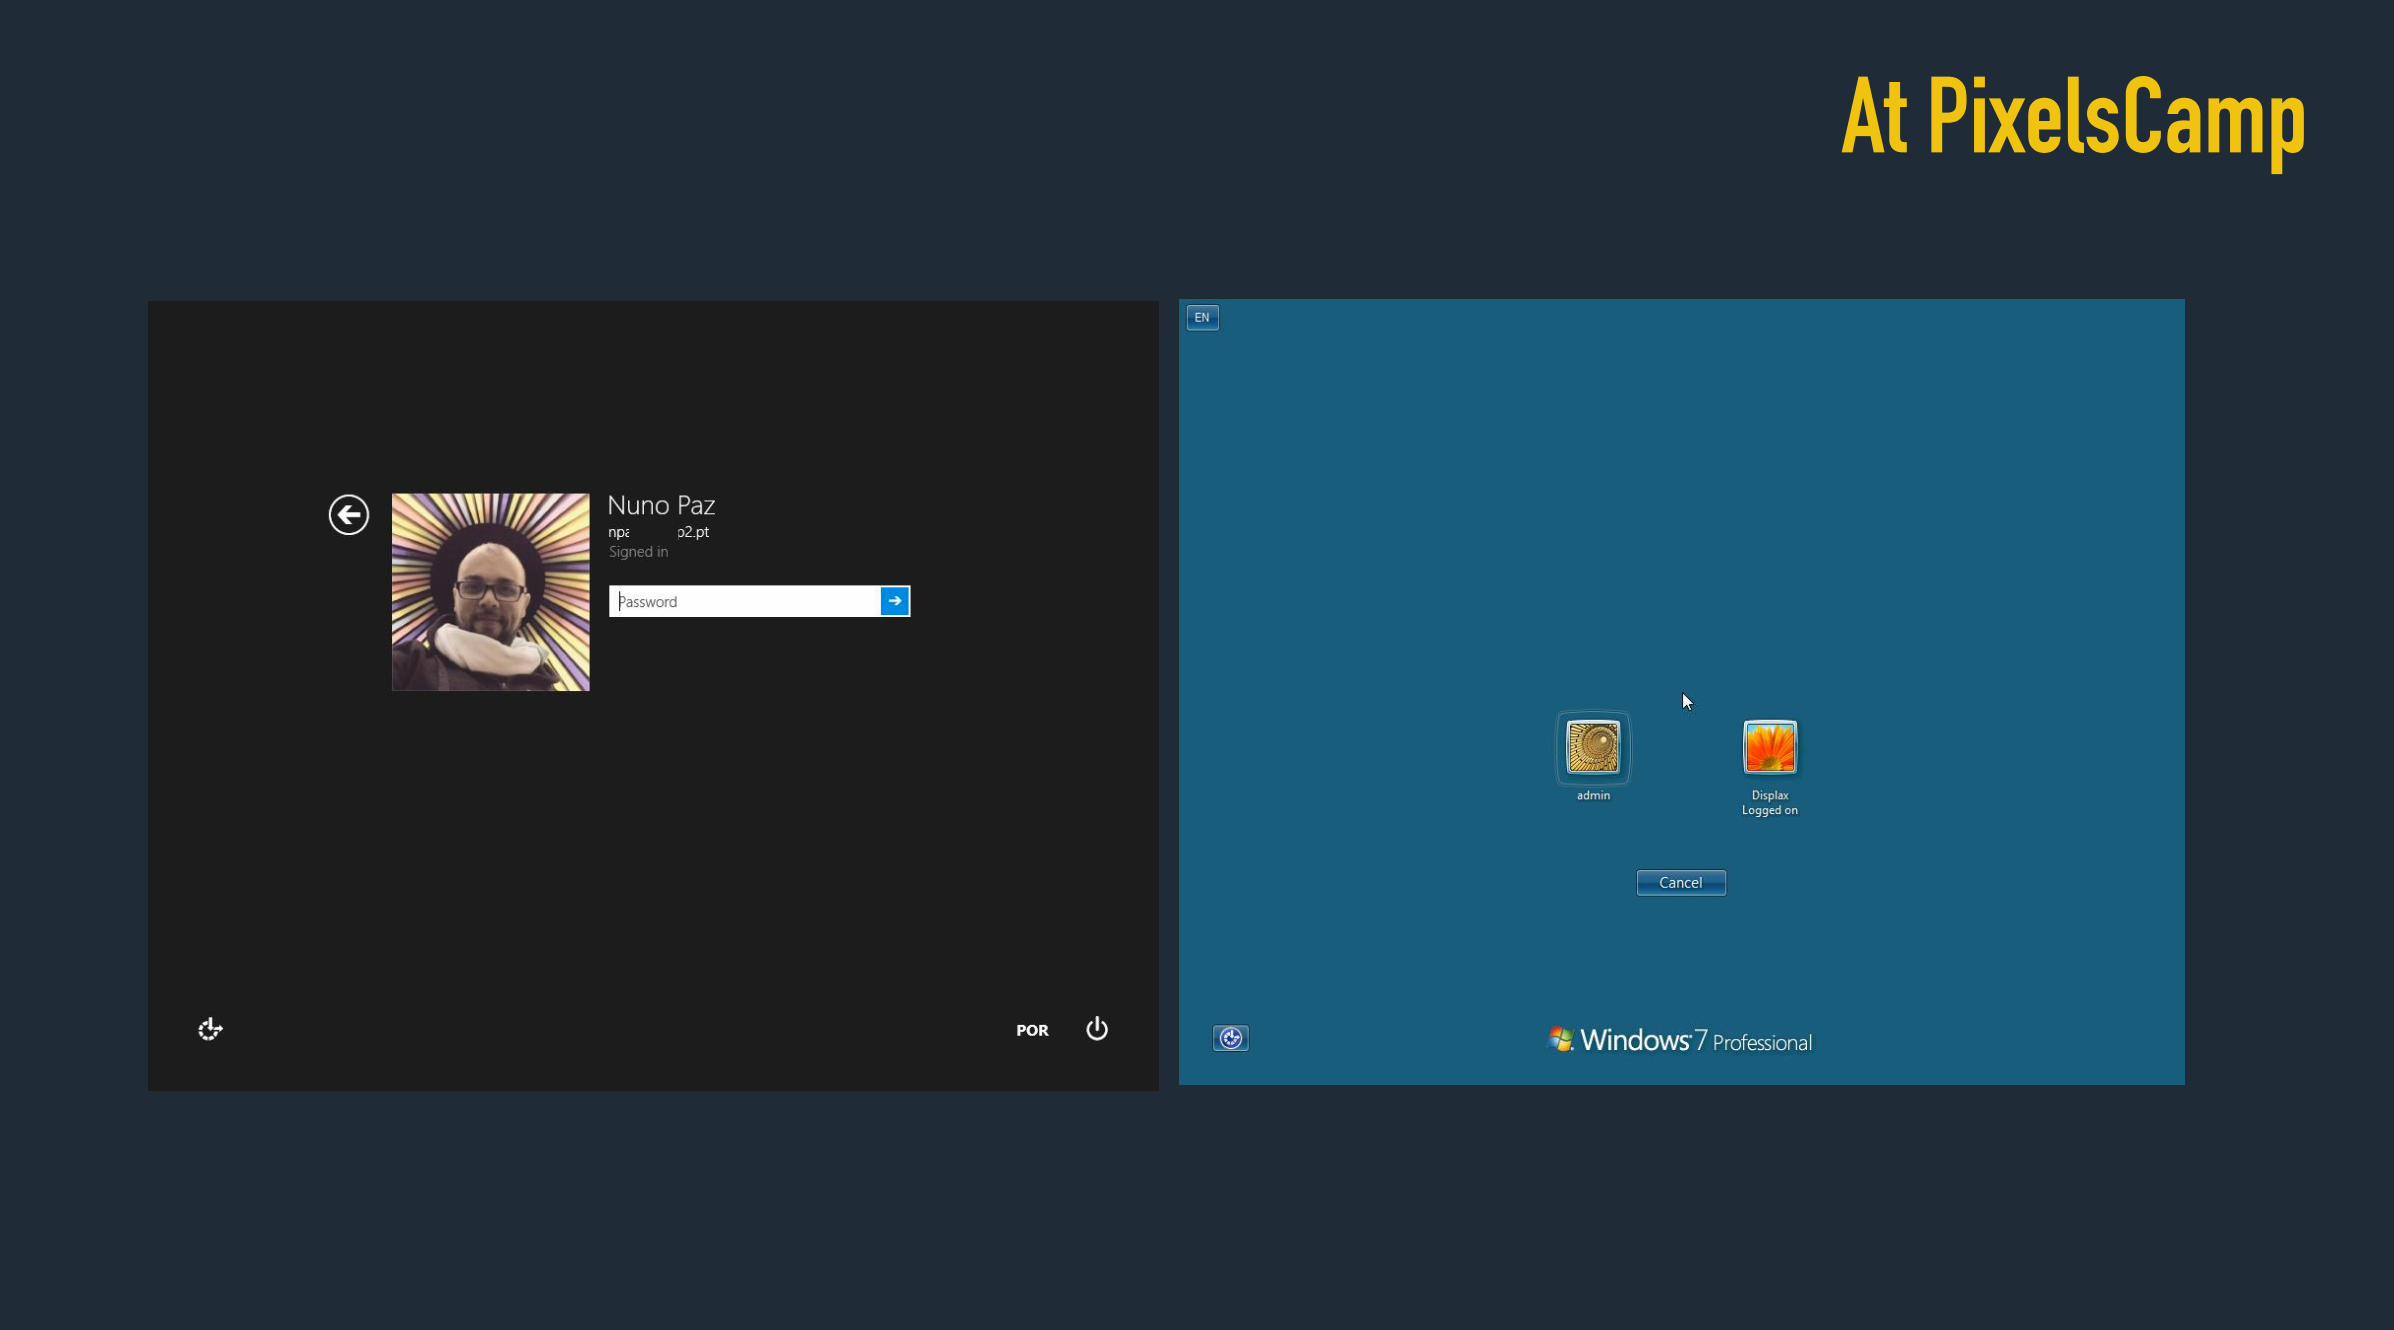
At PixelsCamp

metadata
�les people
photosfamily&friends
behaviour
social
search
companyregistration
ip addressurl address
newsforums
sub-reddits
internal
external
phone
linked urls
likestopics
BGP
AS
whois
AS membership
AS peer
list of IPs
sharedinfrastructure
co-hostedsites
contact
geolocation
o�celocations
socialnetworks
phone
portscan
dns
torrents
binaryedge.io2016
domainsAXFRMX records
screenshots
web
services
http https
webserverframeworkheaderscookies
certi�catecon�gurationauthoritiesentities
SMB
VNC
RDP
users
apps�les
peers torrent name
OCR
SW
bannersimage
classi�er
vulnerabilities
data points

Microservices (REST API)
MICROSERVICES(REST API)PORT WORD
TAG
FACECOUNTRY LOGO
IP
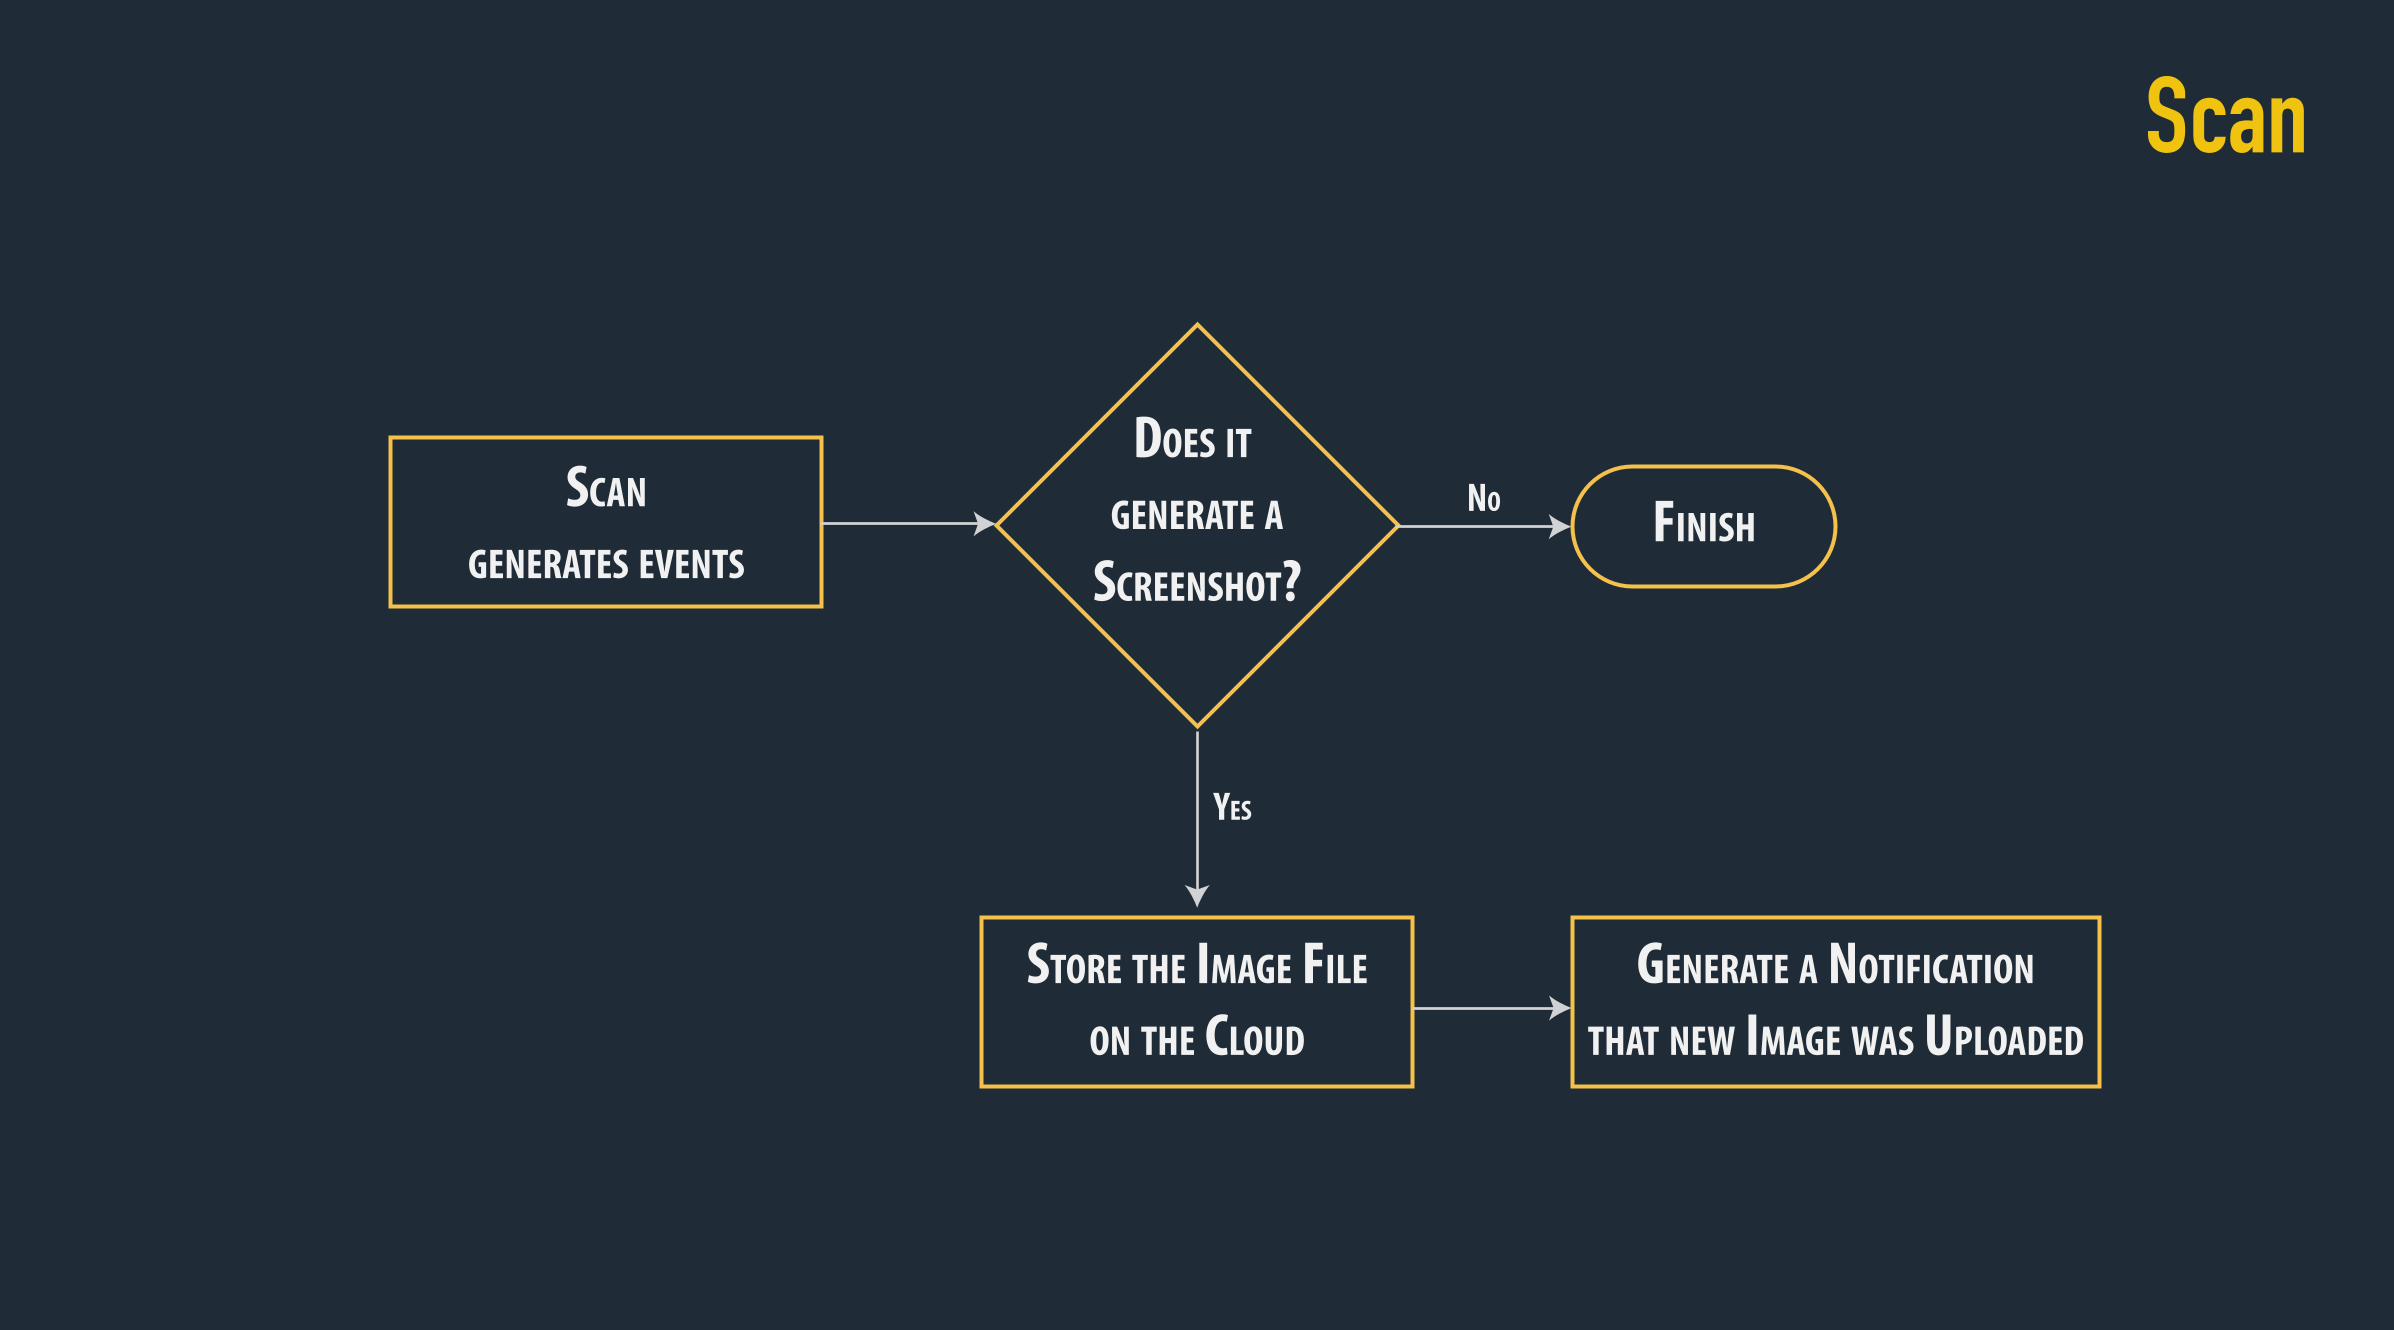
Scan
SCAN
GENERATES EVENTS
DOES IT GENERATE A
SCREENSHOT?
STORE THE IMAGE FILE
ON THE CLOUD
YES
NO
GENERATE A NOTIFICATION
THAT NEW IMAGE WAS UPLOADED
FINISH

Image Workflow
INITIALIZER FILTER LOGO DETECTION
FACE DETECTION
OPTICAL CHARACTER
RECOGNITION (OCR)

INITIALIZER FILTER LOGO DETECTION
FACE DETECTION
OPTICAL CHARACTERRECOGNITION (OCR)
Image Workflow
PULL MESSAGE
FROM QUEUE
IS THERE
A NEW IMAGE?
DECRYPT AND STORE IMAGE
METADATA ON A DATABASE
YES
NO
GENERATE IMAGE SIGNATURE
FOR SIMILARITY COMPARISON
FINISH
MESSAGE QUEUE
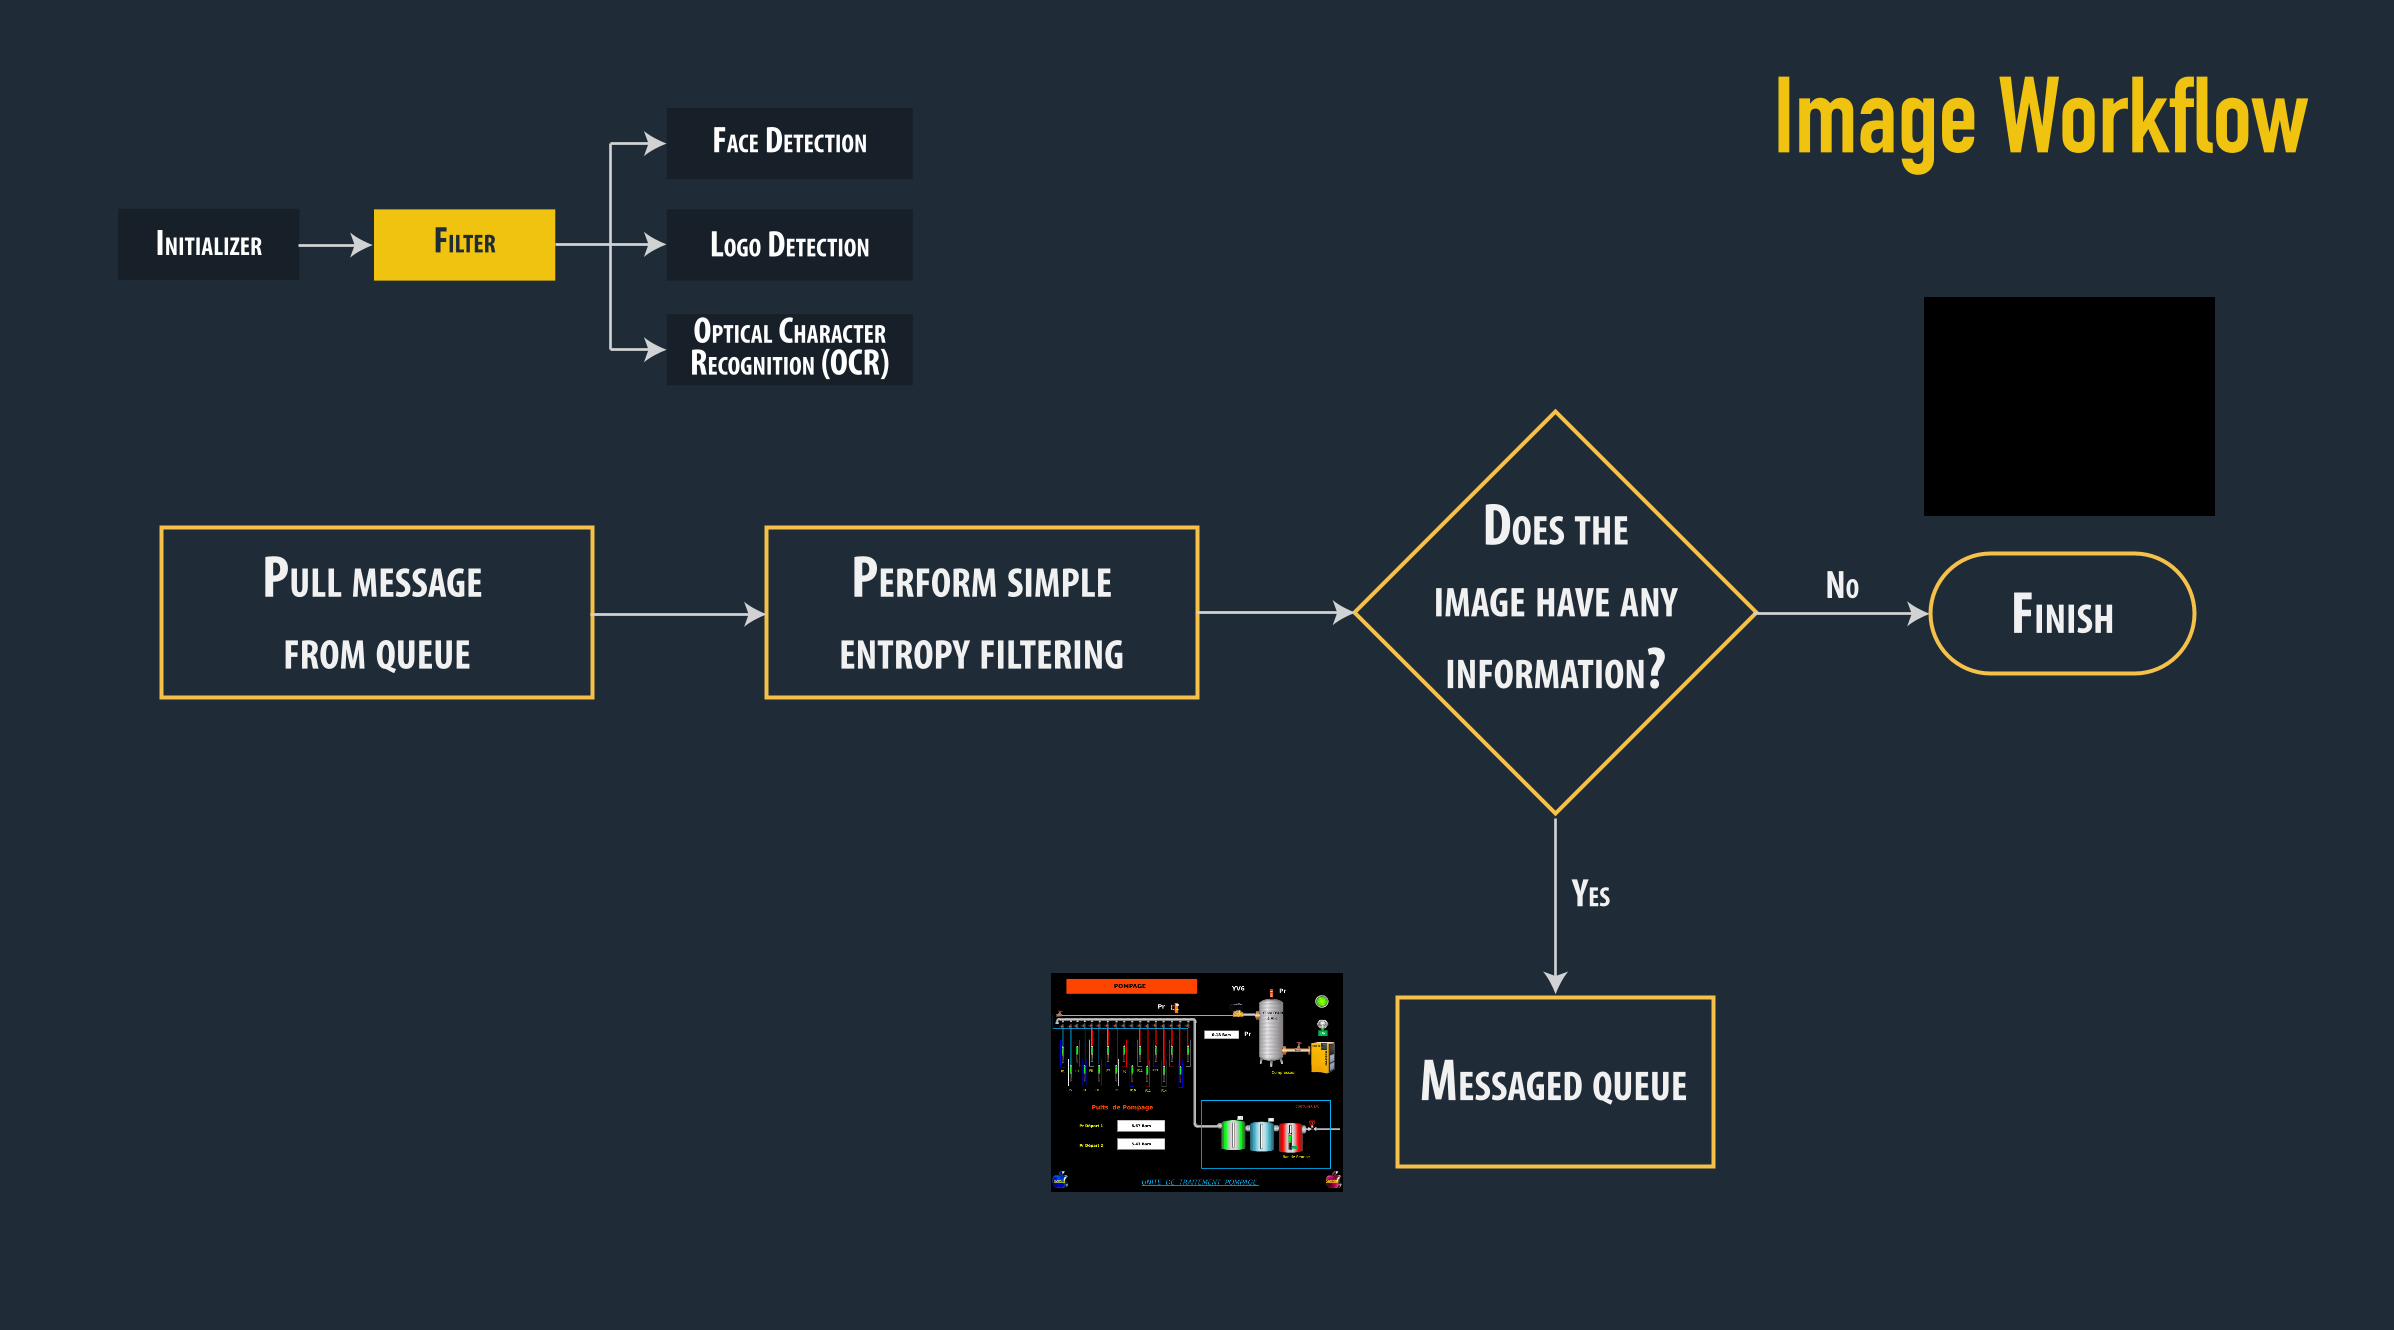
Image Workflow
PULL MESSAGE FROM QUEUE
DOES THE
IMAGE HAVE ANY
INFORMATION?
PERFORM SIMPLE
ENTROPY FILTERING
YES
NO FINISH
MESSAGED QUEUE
INITIALIZER FILTER LOGO DETECTION
FACE DETECTION
OPTICAL CHARACTERRECOGNITION (OCR)

PULL MESSAGE
FROM QUEUE
ENHANCE IMAGE WITH
APPLICATION OF SOME FILTERS
RUN FACE AND LOGO DETECTION
AND OCR ALGORITHMS
STORE RESULTS
IN DATABASE
PERFORM ADDITIONAL
ACTIONS WITH THE RESULTS
Image WorkflowINITIALIZER FILTER LOGO DETECTION
FACE DETECTION
OPTICAL CHARACTER
RECOGNITION (OCR)

Image Workflow
[{"BreachDate": "2013-10-04", "DataClasses": ["Email addresses", "Password hints", "Passwords", "Usernames"], "Title": "Adobe", "IsAc-tive": true, "Description": "In October 2013, 153 million Adobe accounts were breached with each containing an internal ID, username, email, <em>encrypted</em> password and a password hint in plain text. The password cryptography was poorly done and <a href=\"http://stric-ture-group.com/files/adobe-top100.txt\" target=\"_blank\">many were quickly resolved back to plain text</a>. The unencrypted hints also <a h r e f = \ " h t t p : / / w w w. t r o y h u n t . c o m / 2 0 1 3 / 11 / a d o b e - c r e d e n -tials-and-serious.html\" target=\"_blank\">disclosed much about the passwords</a> adding further to the risk that hundreds of millions of Adobe customers already faced.", "Domain": "adobe.com", "Added-Date": "2013-12-04T00:00:00Z", "PwnCount": 152445165, "IsRetired": false, "IsVerified": true, "LogoType": "svg", "IsSensitive": false, "Name": "Adobe"}]
DataLeak API

Image WorkflowImage Workflow
INITIALIZER FILTER LOGO DETECTION
FACE DETECTION
OPTICAL CHARACTER
RECOGNITION (OCR)

Shannon’s Entropy
Entropy = 0.00 bits Entropy ~ 0.03 bits Entropy ~ 2.13 bits
Filter

Data Visualization
EXPLORATION REPRESENTATION DETAILS FINISHING UPTOOLS
“a multidisciplinary recipe of art, science, math, technology, and many other interesting ingredients.” Andy Kirk, “Data Visualization: a successful design process”

EXPLORATION REPRESENTATION DETAILS TOOLS FINISHING UP
DATA TYPE
RELEVANCE
FILTER
What is the most interesting?What is most important?Audience’s Profile
What is the most relevant information in the context?
Show all values or just a few?Define periods?Define a threshold?
HierarchicalRelationalTemporalSpatial
Categorical
Exploration
Data Visualization

Representation
Experimentation is important
Conceive ideasStoryboarding
Do multipe iterationsPrototype
Test
design can be used in the future
Data VisualizationEXPLORATION REPRESENTATION DETAILS TOOLS FINISHING UP
69,543,915 25,436,974 7,008,108 3,475,472 1,287,446 1,043,331
951,629 854,817 789,515 759,115 490,290 288,885
266,827 257,105 219,025 198,898 186,286 141,474
How many open ports does an IP have?Number of IPs with X open portsport
Number of IPs
Representation
EXPLORATION REPRESENTATION DETAILS TOOLS FINISHING UP
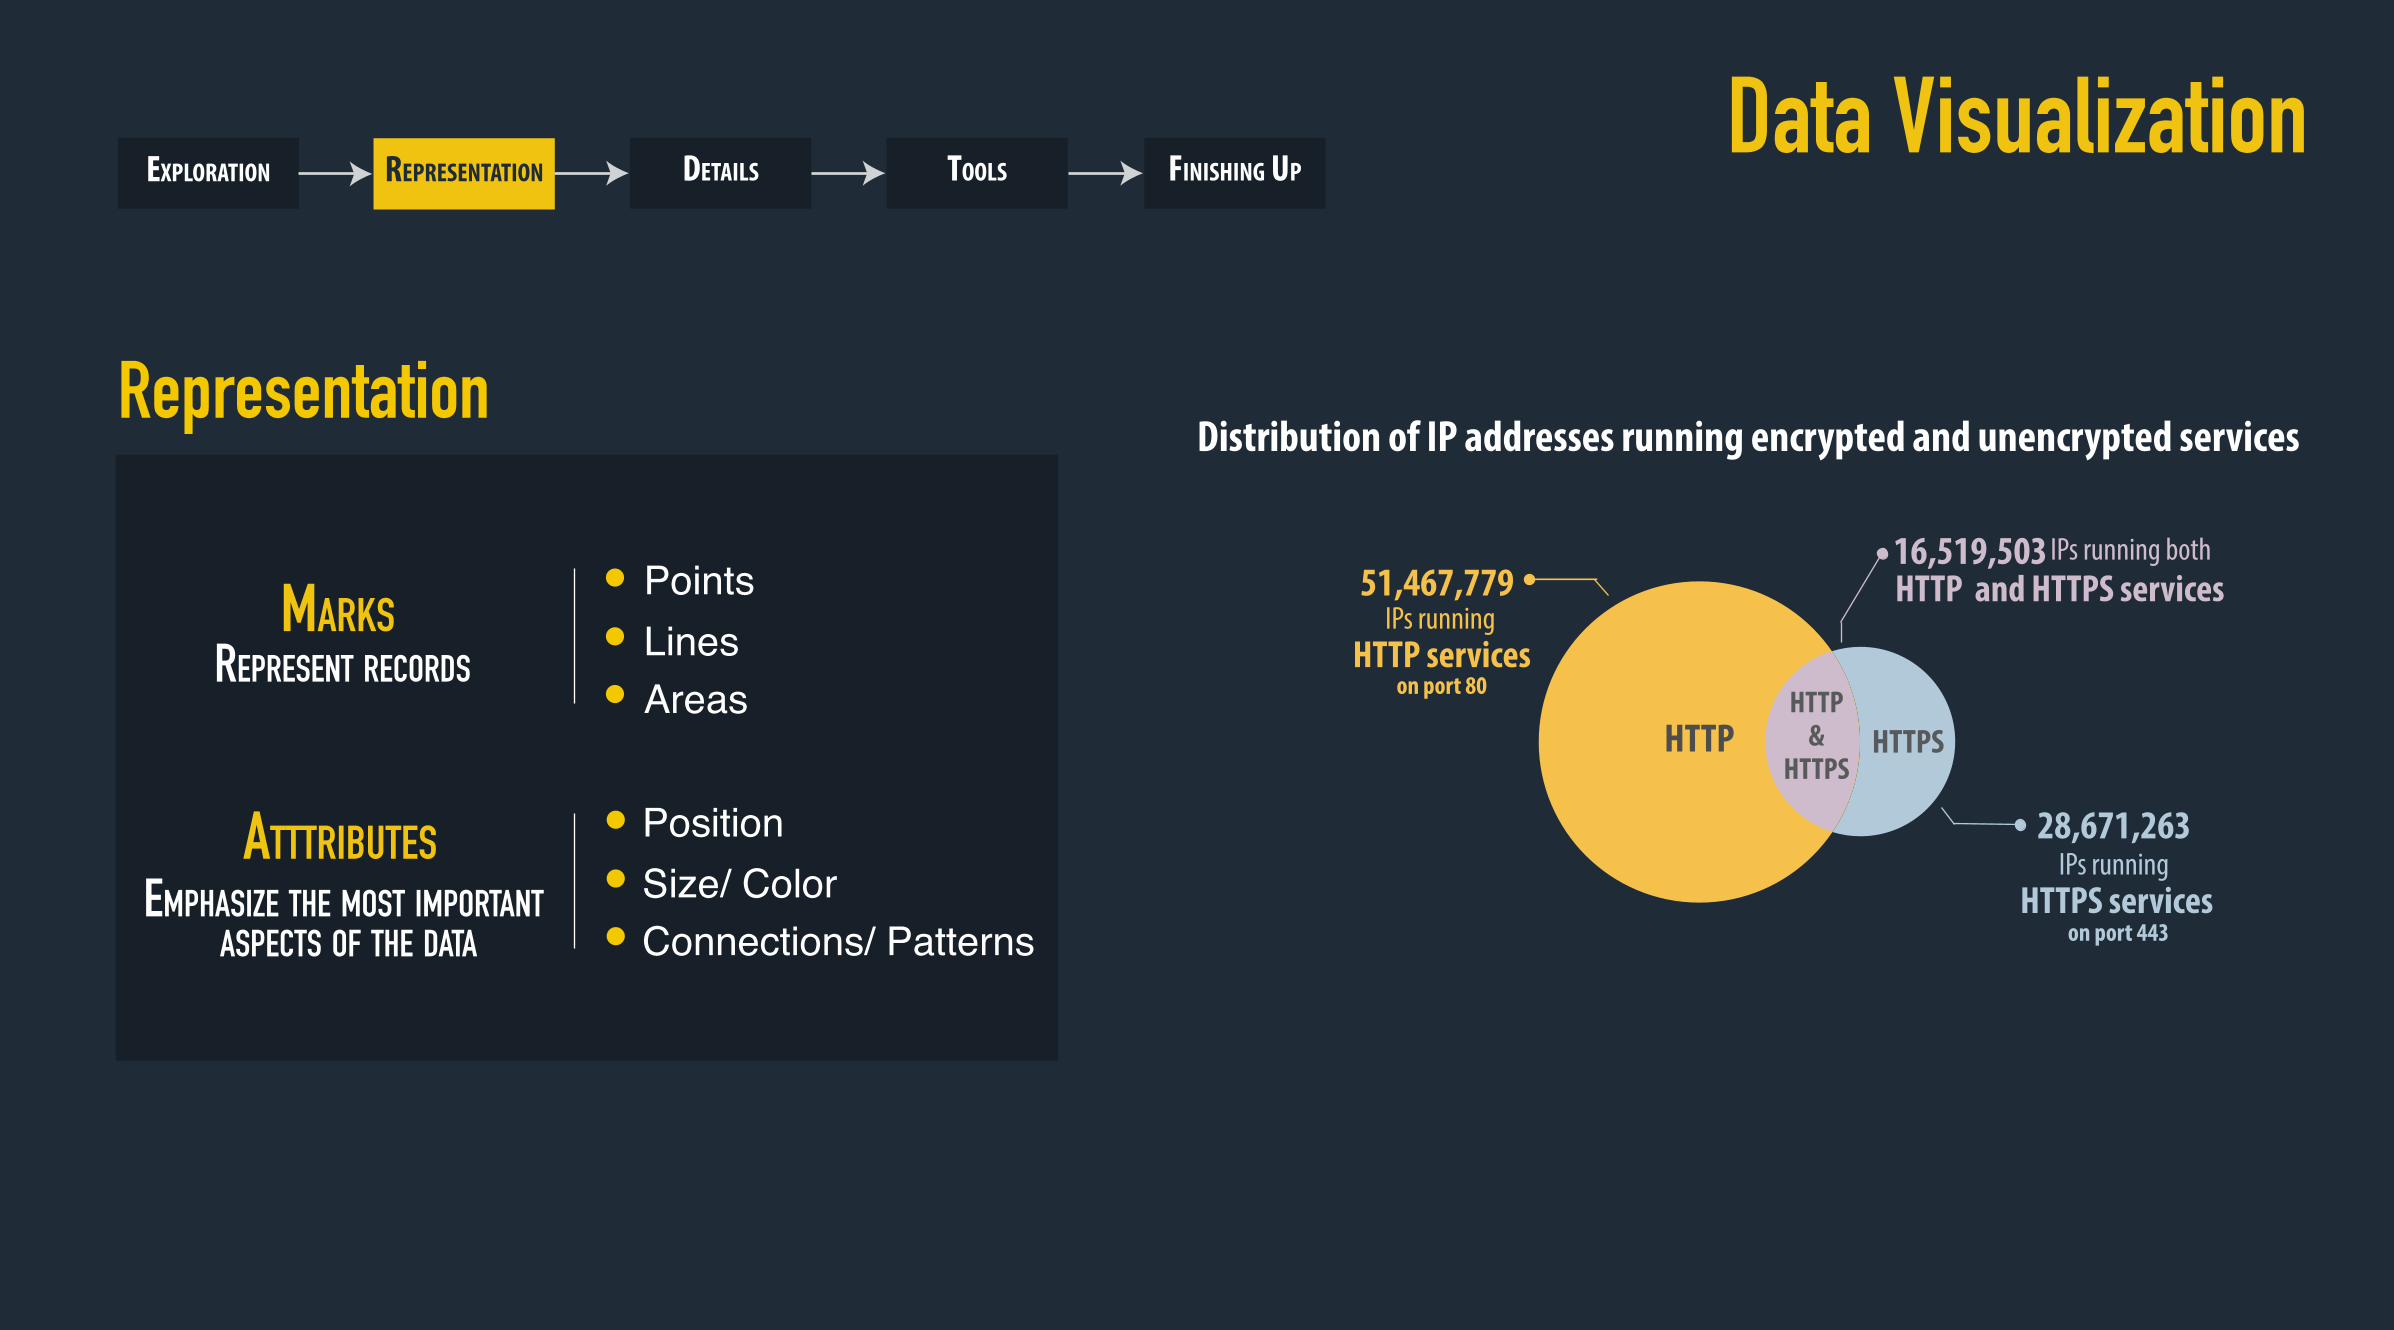
Distribution of IP addresses running encrypted and unencrypted services
MARKSPoints
AreasLines
ATTTRIBUTES Position
Connections/ PatternsSize/ Color
REPRESENT RECORDS
EMPHASIZE THE MOST IMPORTANT ASPECTS OF THE DATA on port 443
on port 80
51,467,779
HTTP
28,671,263
IPs runningHTTP services
IPs runningHTTPS services
16,519,503 IPs running bothHTTP and HTTPS services
HTTP&
HTTPSHTTPS
Data Visualization
Data Visualization
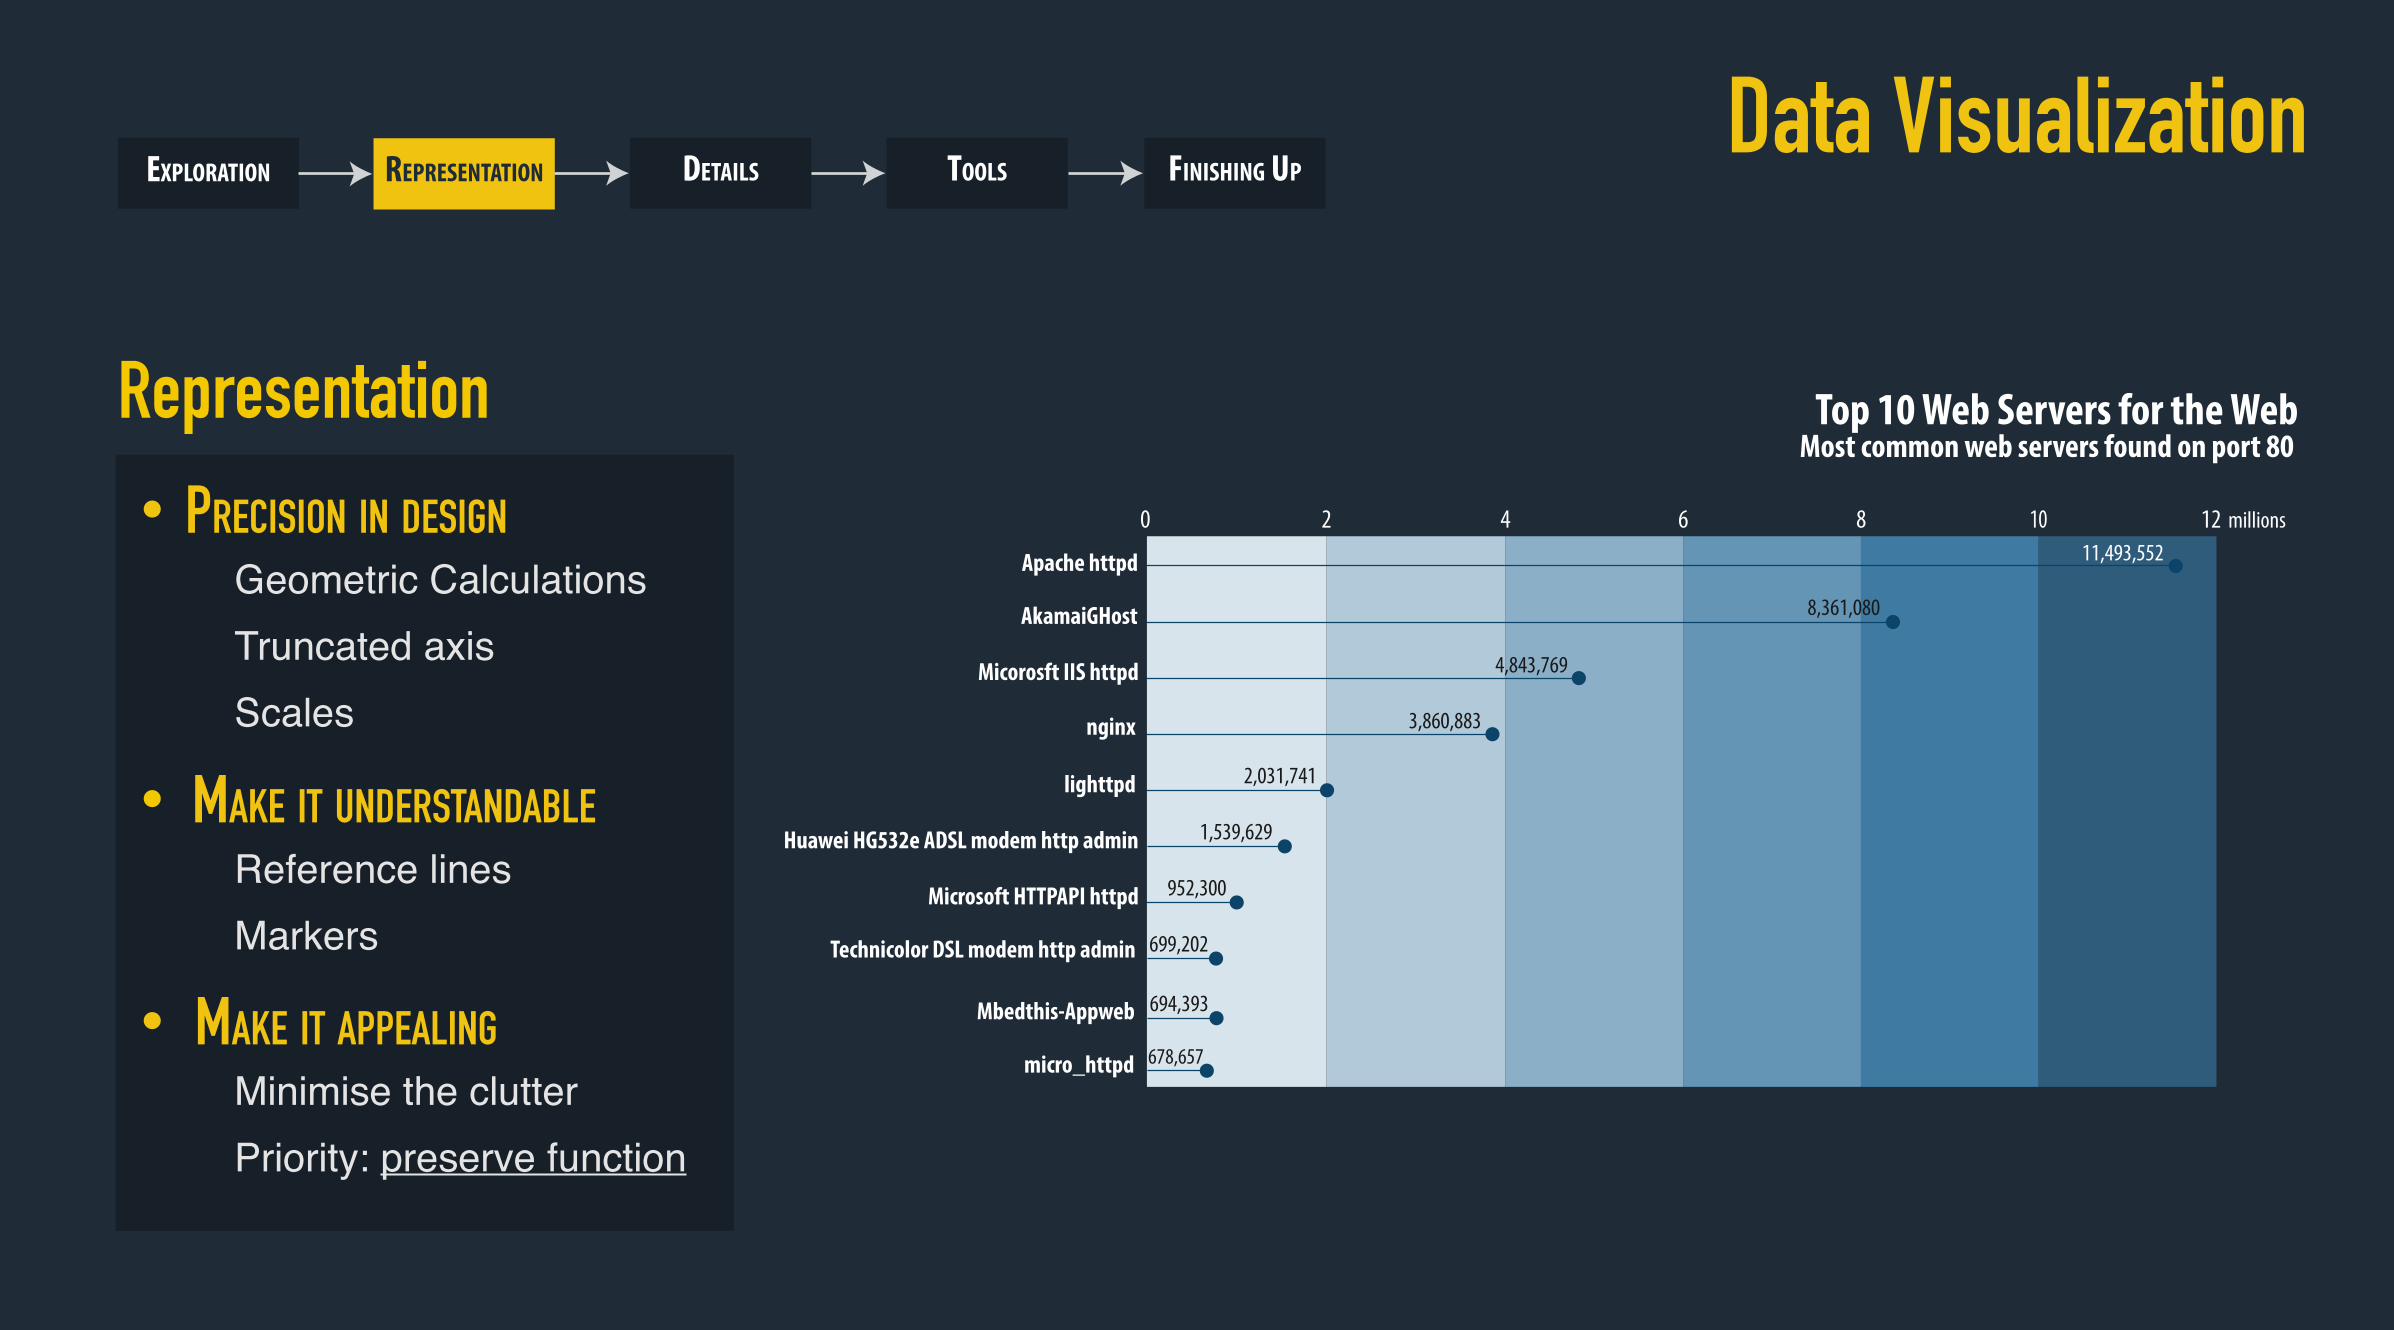
RepresentationPRECISION IN DESIGN
Geometric CalculationsTruncated axisScales
MAKE IT UNDERSTANDABLEReference linesMarkers
MAKE IT APPEALINGMinimise the clutterPriority: preserve function
Top 10 Web Servers for the WebMost common web servers found on port 80
Apache httpd
AkamaiGHost
Micorosft IIS httpd
nginx
lighttpd
Huawei HG532e ADSL modem http admin
Microsoft HTTPAPI httpd
Technicolor DSL modem http admin
Mbedthis-Appweb
micro_httpd
2 4 6 80 10 12 millions11,493,552
8,361,080
4,843,769
3,860,883
2,031,741
1,539,629
952,300
699,202
694,393
678,657
EXPLORATION REPRESENTATION DETAILS TOOLS FINISHING UP
EXPLORATION REPRESENTATION DETAILS TOOLS FINISHING UP
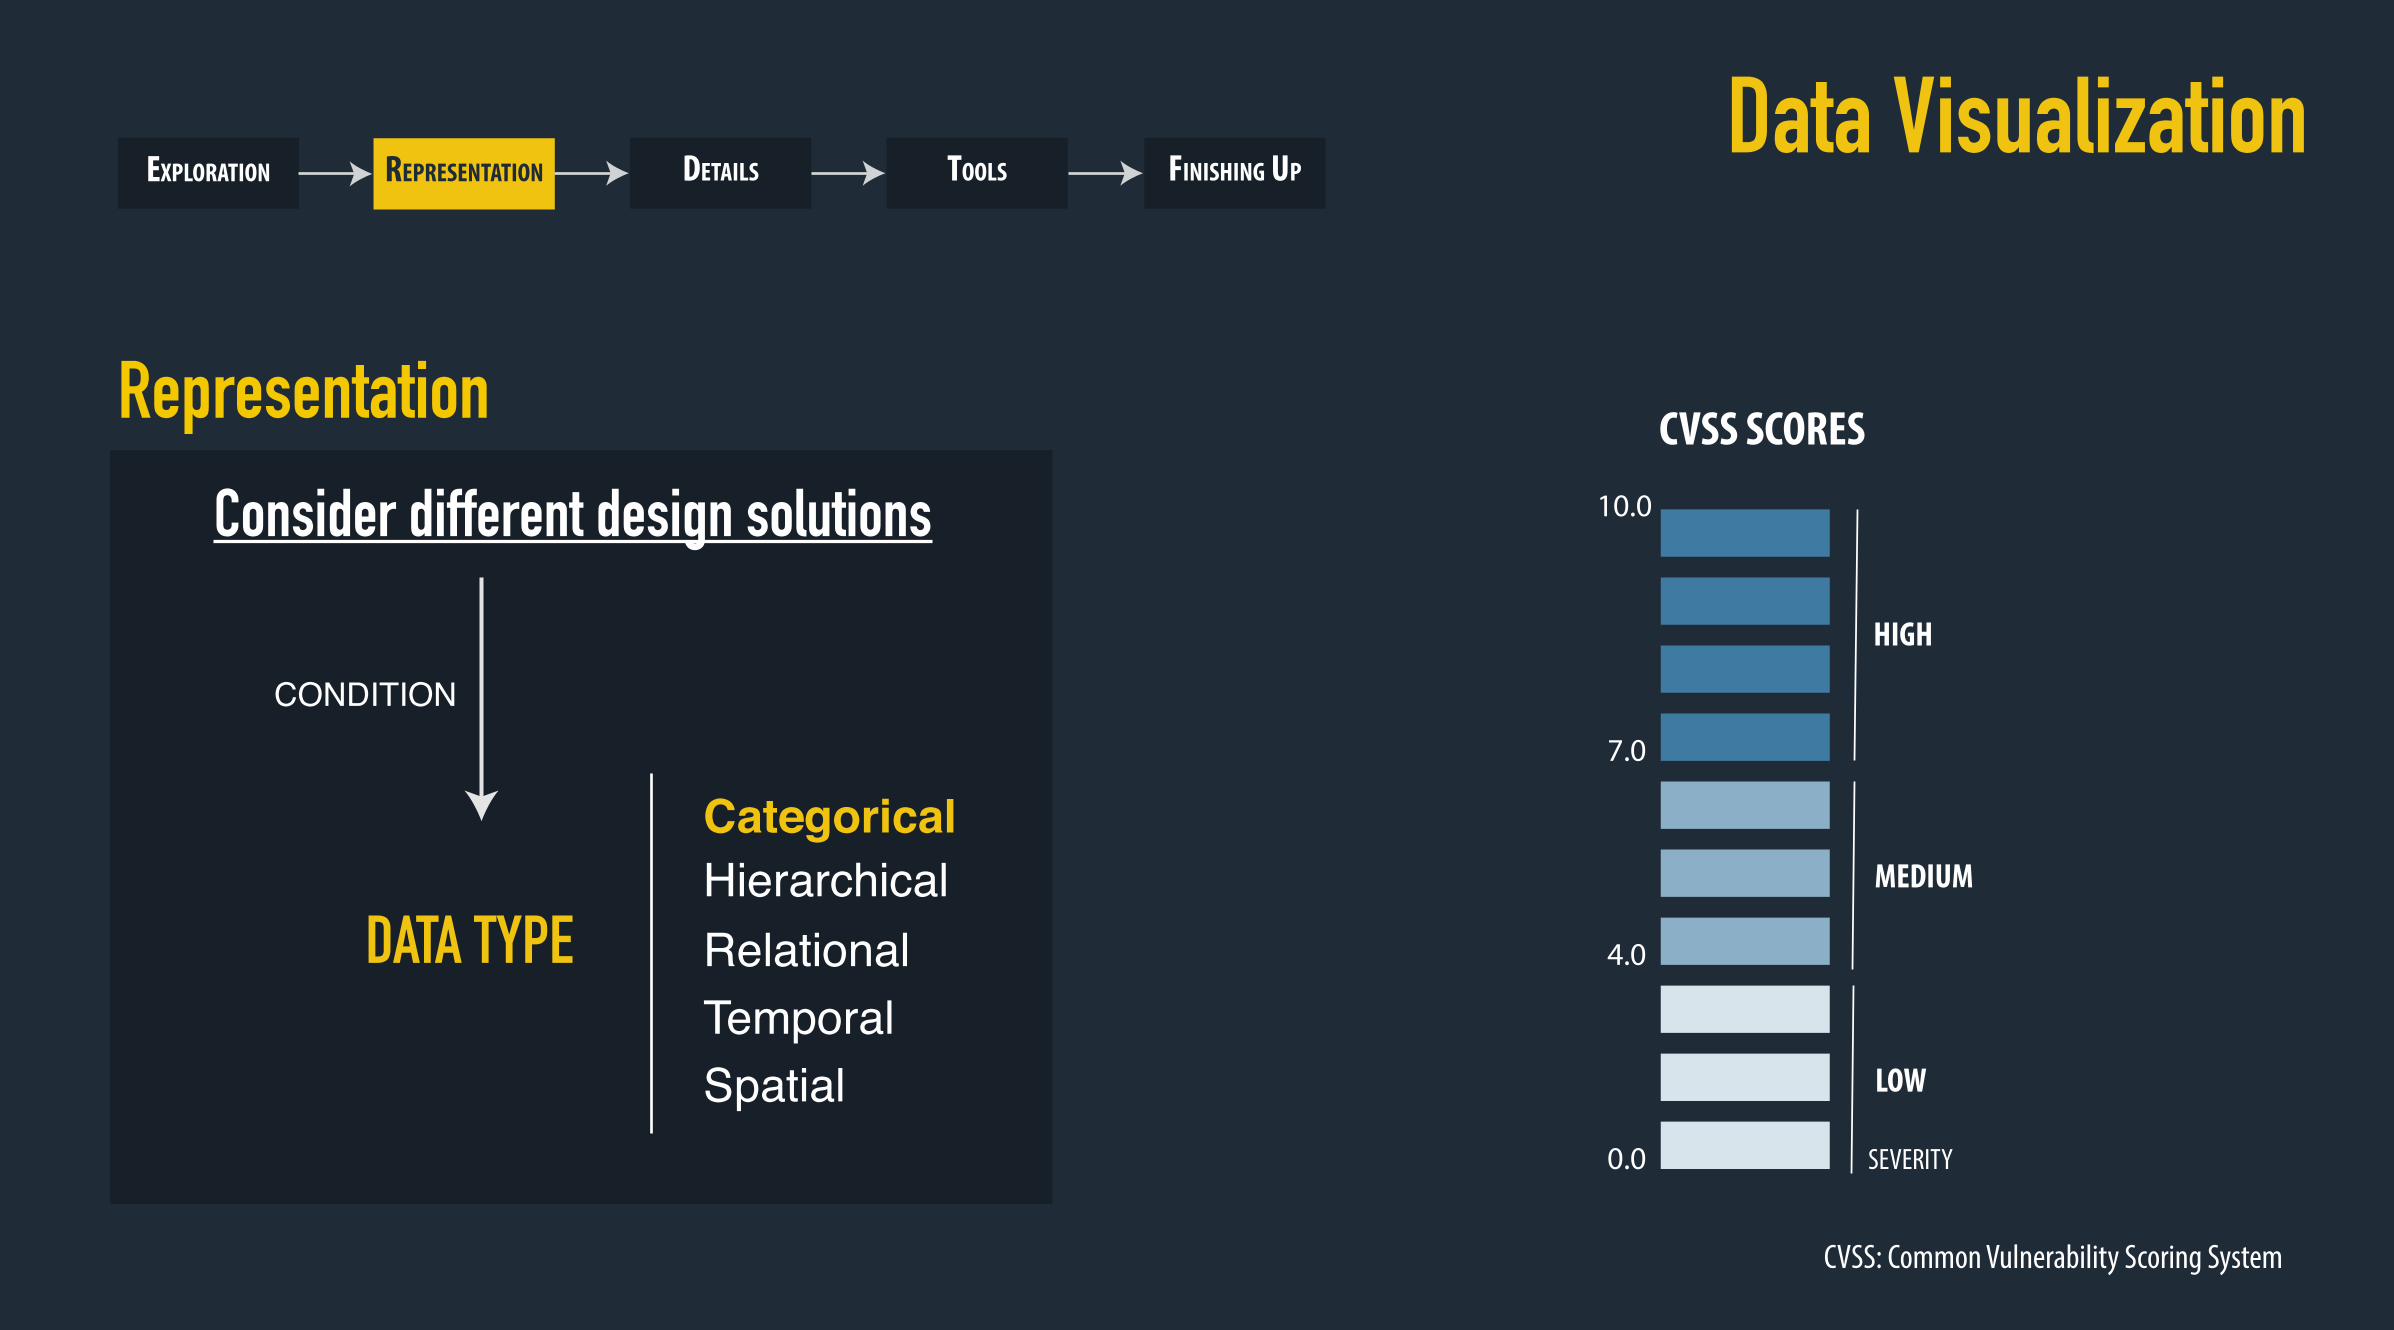
Representation
Consider different design solutions
DATA TYPE
CONDITION
HierarchicalRelationalTemporalSpatial
Categorical
CVSS SCORES
LOW
MEDIUM
HIGH
0.0
10.0
4.0
7.0
SEVERITY
CVSS: Common Vulnerability Scoring System
Data Visualization

CVE
Identi�er Number
References
Description
EXPLORATION REPRESENTATION DETAILS TOOLS FINISHING UP
CVE: Common Vulnerabilities and Exposure
Representation
Consider different design solutions
DATA TYPE
CONDITION
HierarchicalRelationalTemporalSpatial
Categorical
Data Visualization

EXPLORATION REPRESENTATION DETAILS TOOLS FINISHING UP
Overview of protocols used for email, according to encryption usedEmail Protocols
ENCRYPTED UNENCRYPTED
POP3 POP3S SMTP SMTPS IMAP IMAPS4,572,161 3,742,289 3,531,071 2,971,159 4,131,737 3,703,364
10,416,812 12,234,969
SERVICE
COUNT
Representation
Consider different design solutions
DATA TYPE
CONDITION
HierarchicalRelationalTemporalSpatial
Categorical
Data Visualization

Representation
Consider different design solutions
DATA TYPE
CONDITION
HierarchicalRelationalTemporalSpatial
Categorical
EXPLORATION REPRESENTATION DETAILS TOOLS FINISHING UP
Big Data TechnologiesChanges in amount of data exposed without security
MongoDB Memcached Redis 2 TB
644.3 TB
Aug 2015 Jan 2016 July 2016
724.7 TB 627.7 TB
13.2 TB11.3 TB
710.9 TB 12.0 TB
598.7 TB 27.5 TB 1.5 TB
1.8 TB
619.8 TB
Data Visualization

Representation
Consider different design solutions
DATA TYPE
CONDITION
HierarchicalRelationalTemporalSpatial
Categorical
EXPLORATION REPRESENTATION DETAILS TOOLS FINISHING UP
HeartbleedCountries with higher number of IPs vulnerable to Heartbleed
Russia5,264
Republic of Korea4,564China
6,790
United States23,649
Italy2,508
Germany6,382
France5,622
Netherlands2,779United Kingdom
3,459
Japan2,484
Data Visualization

Data VisualizationEXPLORATION REPRESENTATION DETAILS TOOLS FINISHING UP
VNC wordcloud
loginwindows
edition
2016delete
ctrl
server
press
microsoft
system
welcomeyour help
�lelinux
googlekernel
from
ubuntu

DetailsANNOTATION
Titles and subtitlesLabelsLegends
TYPOGRAPHYUse fonts that are easy to readDon’t use fonts that are considered sloppy
SSH Banners
SSH-2.0-OpenSSH_5.3
SSH-2.0-OpenSSH_6.6.1p1
SSH-2.0-OpenSSH_6.6.1
SSH-2.0-OpenSSH_4.3
SSH-2.0-OpenSSH_6.0p1
SSH-2.0-OpenSSH_6.7p1
SSH-2.0-dropbear_2014.63
SSH-2.0-OpenSSH_5.5p1
SSH-2.0-ROSSSH
SSH-2.0-OpenSSH_5.9p1202,361
352,978
436,700449,570
462,616
537,667555,779
604,579
1,501,749
2,632,270
countbanner
Most common SSH Banners found
EXPLORATION REPRESENTATION DETAILS TOOLS FINISHING UPData Visualization

DetailsANNOTATION
Titles and subtitlesLabelsLegends
TYPOGRAPHYUse fonts that are easy to readDon’t use fonts that are considered sloppy
SSH-2.0-
OpenS
SH_5.3
SSH-2.0-
OpenS
SH_6.6.
1p1
SSH-2.0-
OpenS
SH_6.6.
1
SSH-2.0-
OpenS
SH_4.3
SSH-2.0-
OpenS
SH_6.0p
1
SSH-2.0-
OpenS
SH_6.7p
1
SSH-2.0-
drop
bear_
2014
.63
SSH-2.0-O
penSSH_5
.5p1
SSH-2.0-
ROSSSH
SSH-2.0-
OpenS
SH_5.9p
1
202,361
352,978
436,700449,570
462,616
537,667555,779
604,579
1,501,749
2,632,270
EXPLORATION REPRESENTATION DETAILS TOOLS FINISHING UPData Visualization

DetailsCOLOR
LegibilityFunctional purposeSalienceConsistencyColor Blindness
COMPOSITIONChart size/ orientationAlignments
EXPLORATION REPRESENTATION DETAILS TOOLS FINISHING UP
SSH Key LengthsMost common key lengths found
Key lengthcount
641,719
1040
186,070
1032
13,845
4096
5,068,711
1024
3,740,593
2048
9,064
512
7,830
2056
6,265
2064
6,212
1016
4,755
768
Data Visualization

Tools
EXPLORATION REPRESENTATION DETAILS TOOLS FINISHING UP
BALANCE
Automation
Programming Language to create plots
Fine tunning in illustrator(make it better for the audience)
Hand-editing process
Human error
Originality
Automated Analysis
Illustrator (or other tool) to create visualization solution
Human error
Data Visualization

EXPLORATION REPRESENTATION DETAILS TOOLS FINISHING UP
DOCUMENT EVERY STEP OF THE PROCESSCalculationsChoices of visualisationsChoices of data points
REVIEW EVERYTHINGWhat could have been done differently?What could be better?
TAKE CONSTRUCTIVE FEEDBACKEven if it means to start overA visualization can be used in the future
Data Visualization

INTERNET SECURITY EXPOSURE2016
BinaryEdge.ioBe Ready. Be Safe. Be Secure.
ise.binaryedge.io

THE SCIENCE BEHIND THE DATA
CREATED BYBINARYEDGE


