suri.ChartSimulator (Daily) TradeStation suriNotes.com ● Simulate/Pause/Forward/Back ● All Symbols, Daily Charts ● Any Indicators, ShowMes, Paint Bars and Strategies ● Bar and Candlestick Chart Styles ● Main and Sub-graph indicators ● User Adjustable Speed Settings ● Customizable Date Ranges ● Cross Hair Functionality for DataView ● TS 9.+ OOEL compatible Version 1.0
Transcript
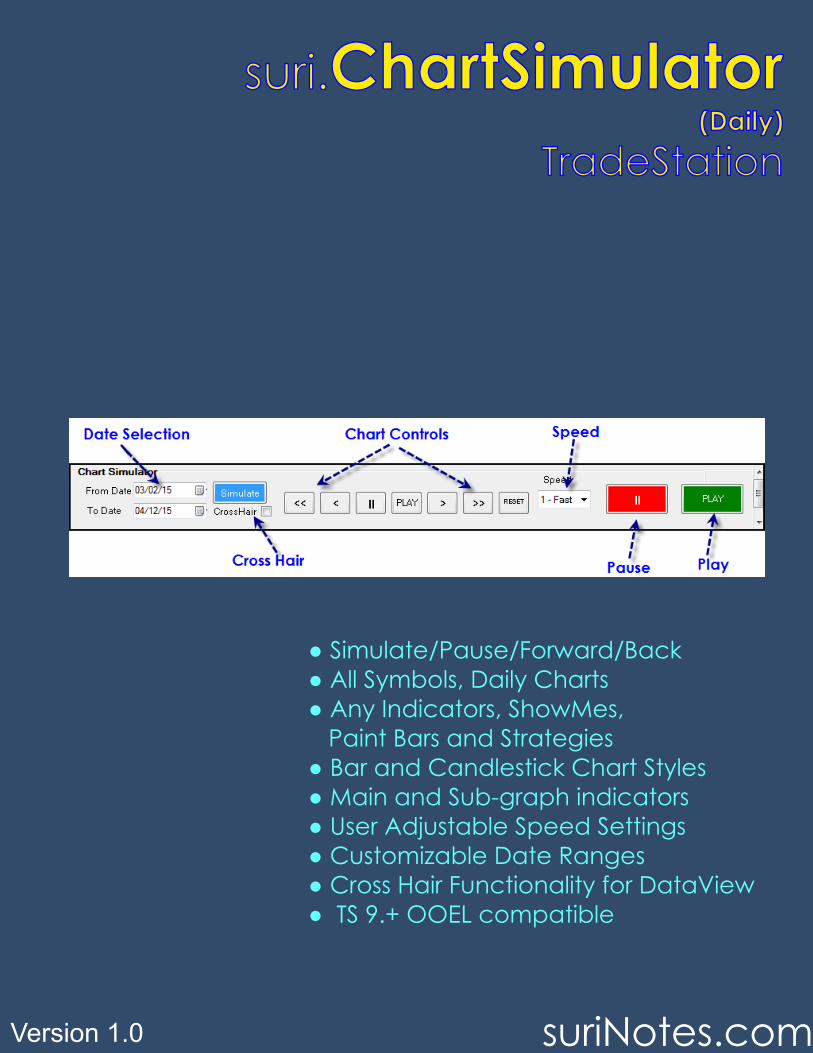
suri.ChartSimulator(Daily)
TradeStation
suriNotes.com
● Simulate/Pause/Forward/Back● All Symbols, Daily Charts● Any Indicators, ShowMes,
Paint Bars and Strategies● Bar and Candlestick Chart Styles● Main and Sub-graph indicators● User Adjustable Speed Settings● Customizable Date Ranges● Cross Hair Functionality for DataView● TS 9.+ OOEL compatible
Version 1.0
Legal Notices and Disclaimer
Chart Simulation (Daily) in TradeStation, 2015 ALL RIGHTS RESERVED
No part of this document may be reproduced or transmitted without a writtenconsent of the suriNotes.com or Suri Duddella.
This document relies on sources and information reasonably believed to beaccurate, but neither the author nor publisher guarantees accuracy orcompleteness.
Trading is risky. You are 100% responsible for your own trading. suriNotes.com orSuri Duddella, specifically disclaims any and all express and implied warranties.Your trades may entail substantial loss. Nothing in this document should beconstrued as a recommendation to buy or sell any security or other instrument,or a determination that any trade is suitable for you.
The examples in this document could be considered hypothetical trades. TheCFTCwarns that:
HYPOTHETICAL PERFORMANCE RESULTS HAVE MANY INHERENT LIMITATIONS,SOME OF WHICH ARE DESCRIBED BELOW. NO REPRESENTATION IS BEING MADETHAT ANY ACCOUNT WILL OR ISLIKELY TO ACHIEVE PROFITS OR LOSSES SIMILARTO THOSE SHOWN. IN FACT, THERE ARE FREQUENTLY SHARP DIFFERENCES BETWEENHYPOTHETICAL PERFORMANCE RESULTS AND THE ACTUAL RESULTS SUBSEQUENTLYACHIEVED BY ANY PARTICULAR TRADING PROGRAM. ONE OF THE LIMITATIONSOF HYPOTHETICAL PERFORMANCE RESULTS IS THAT THEY ARE GENERALLYPREPARED WITH THE BENEFIT OF HINDSIGHT. IN ADDITION, HYPOTHETICALTRADING DOES NOT INVOLVE FINANCIAL RISK, AND NO HYPOTHETICAL TRADINGRECORD CAN COMPLETELY ACCOUNT FOR THE IMPACT OF FINANCIAL RISK INACTUAL TRADING. FOR EXAMPLE, THE ABILITY TO WITHSTAND LOSSES OR TOADHERE TO A PARTICULAR TRADING PROGRAM IN SPITE OF TRADING LOSSES AREMATERIAL POINTS WHICH CAN ALSO ADVERSELY AFFECT ACTUAL TRADINGRESULTS. THERE ARE NUMEROUS OTHER FACTORS RELATED TO THE MARKETS INGENERAL OR TO THE IMPLEMENTATION OF ANY SPECIFIC TRADING PROGRAMWHICH CANNOT BE FULLY ACCOUNTED FOR IN THE PREPARATION OFHYPOTHETICAL PERFORMANCE RESULTS AND ALL OF WHICH CAN ADVERSELYAFFECT ACTUAL TRADING RESULTS.
Charts are created by TradeStation Software from TradeStation Securities.Printed in the United States of America
Chart Simulation
IntroductionEducation is one of the key elements for successful trading. Practicingand reading charts may lead to perfecting the art of trading. Traders canhone their entry, exit strategies and get familiar with its nuances. Simula-tion software is used to build confidence and tweak their trading modelsfor optimal outcome. Trading simulator shortens a traders learning experi-ence in the markets. Traders learn many nuances in simulation mode oftrade execution which may not be visible in building a trading theory ormodels.
Trading models or trading systems are built on a set of rules with specifictrade execution methods. To achieve the successful trading results tradersspend thousands of hours to find key opportunities and optimal setups.Execution of their trade setups and results can be only realized throughlive trading. Unfortunately, this method could be very expensive to learnthe nuances and errors in their models. An alternative way is to simulatetheir trading models, practice and learn their nuances.
Chart Simulation for TradeStation software will show bar by bar simulationin an intuitive way to simulate and learn trading any market instrument indaily time-frame with any user built indicators in user selected speed.
Chart Simulation software allows users to enter any symbol, (daily time-frame) in to a clean TS Chart along with user built Indicators to simulatethe data in Bar charts, Candle stick charts. User controls to pause, playbars backward/forward, control speed and re-wind the chart features areadded. You can also load multiple indicators in a chart or in sub-graphswith adjustable settings. Third-party data of daily time-frame can be alsosimulated.
● Learn Key Trading Methods● Learn Key Indicator usage and its nuances● Reduce the learning time● Educate Indicators or Trade Setups● Find Best and Optimal Trade Setups
Installation
Installation
suri.ChartSimulator is available from TradeStation Appstore. Subscribe tosuri.ChartSimulator indicator from TradeStation AppStore and follow installation in-structions. Once the indicator is subscribed, you can insert suri.ChartSimulator in anyTradeStation Chart (Daily Time Frame).
Simulation Settings
Simulation Settings
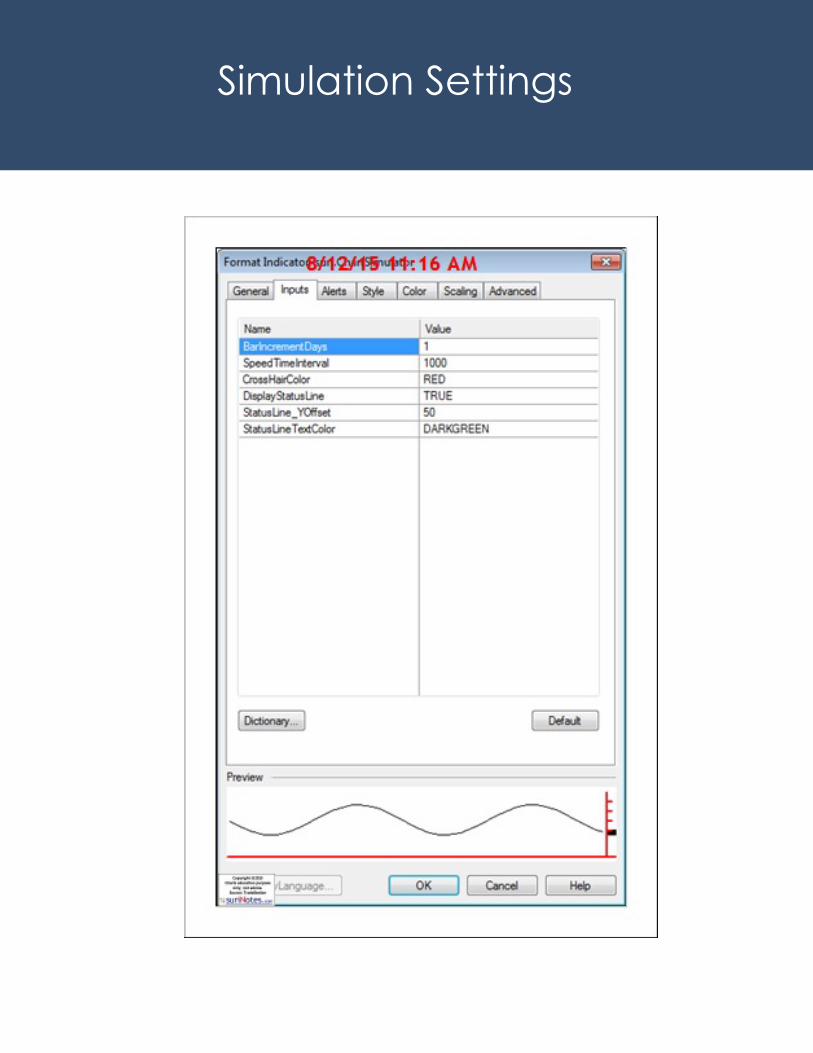
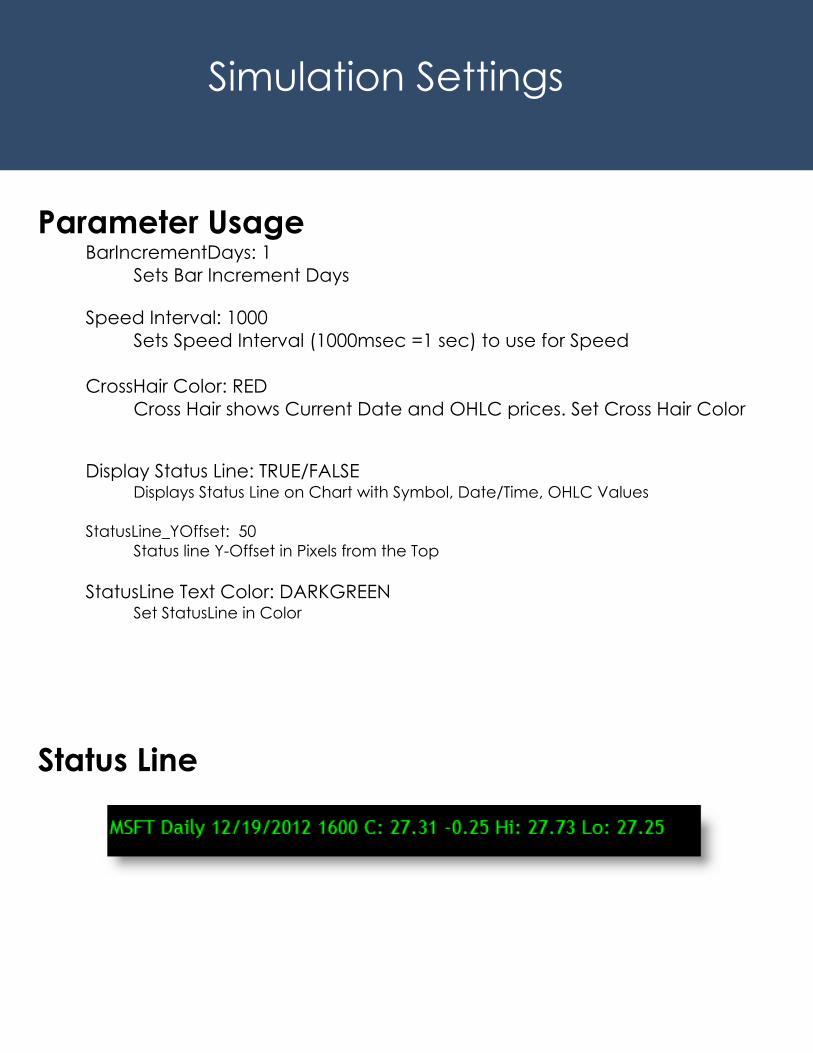
Parameter Usage BarIncrementDays: 1 Sets Bar Increment Days
Speed Interval: 1000 Sets Speed Interval (1000msec =1 sec) to use for Speed
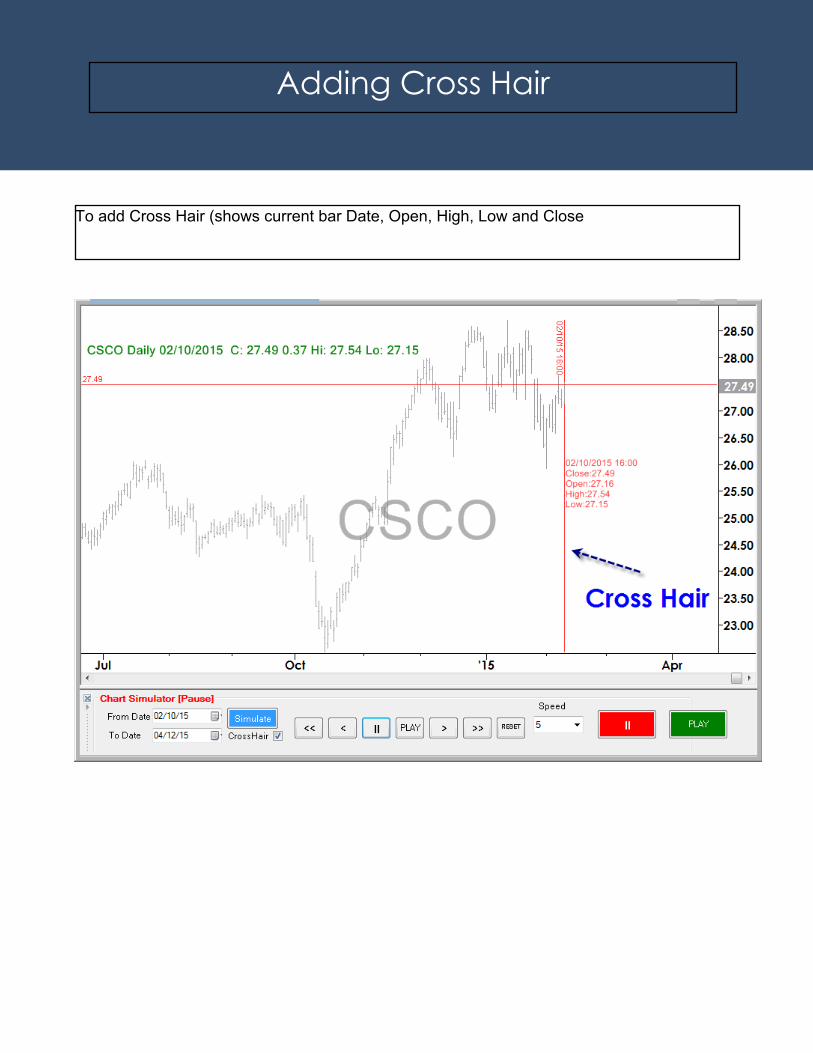
CrossHair Color: RED Cross Hair shows Current Date and OHLC prices. Set Cross Hair Color
Display Status Line: TRUE/FALSE Displays Status Line on Chart with Symbol, Date/Time, OHLC Values
StatusLine_YOffset: 50Status line Y-Offset in Pixels from the Top
StatusLine Text Color: DARKGREEN Set StatusLine in Color
Status Line
Chart Simulation
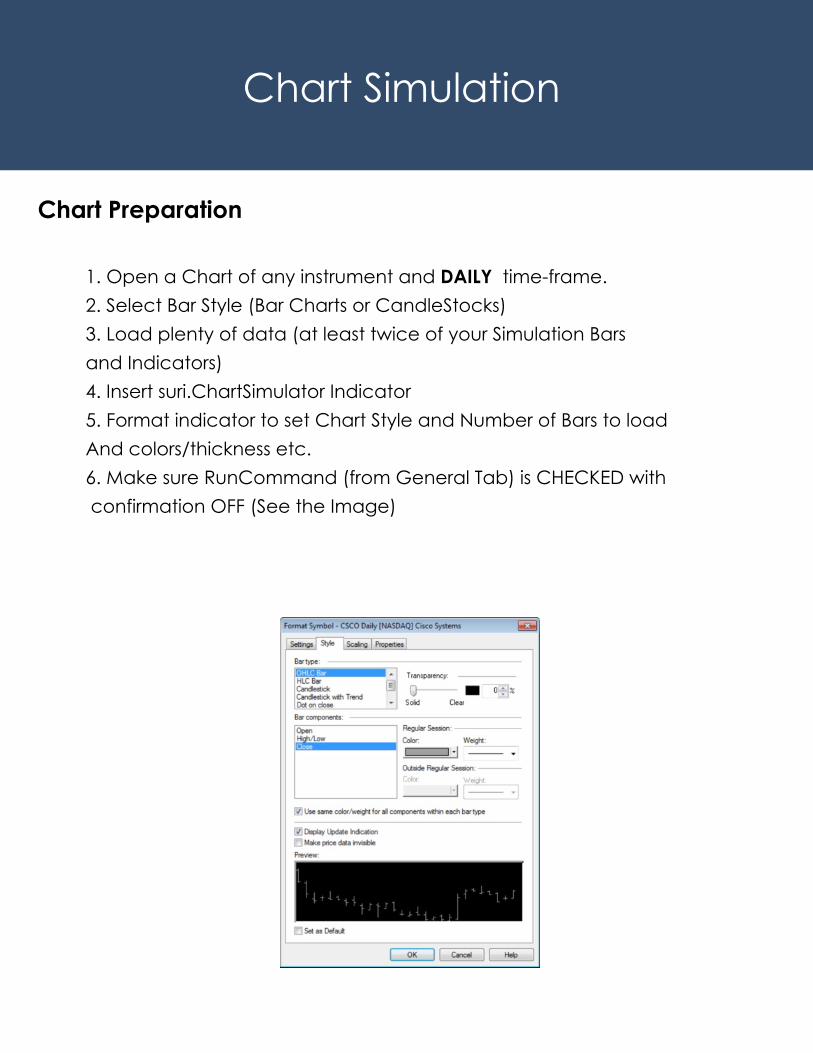
Chart Preparation
1. Open a Chart of any instrument and DAILY time-frame.2. Select Bar Style (Bar Charts or CandleStocks)3. Load plenty of data (at least twice of your Simulation Barsand Indicators)4. Insert suri.ChartSimulator Indicator5. Format indicator to set Chart Style and Number of Bars to loadAnd colors/thickness etc.6. Make sure RunCommand (from General Tab) is CHECKED with confirmation OFF (See the Image)
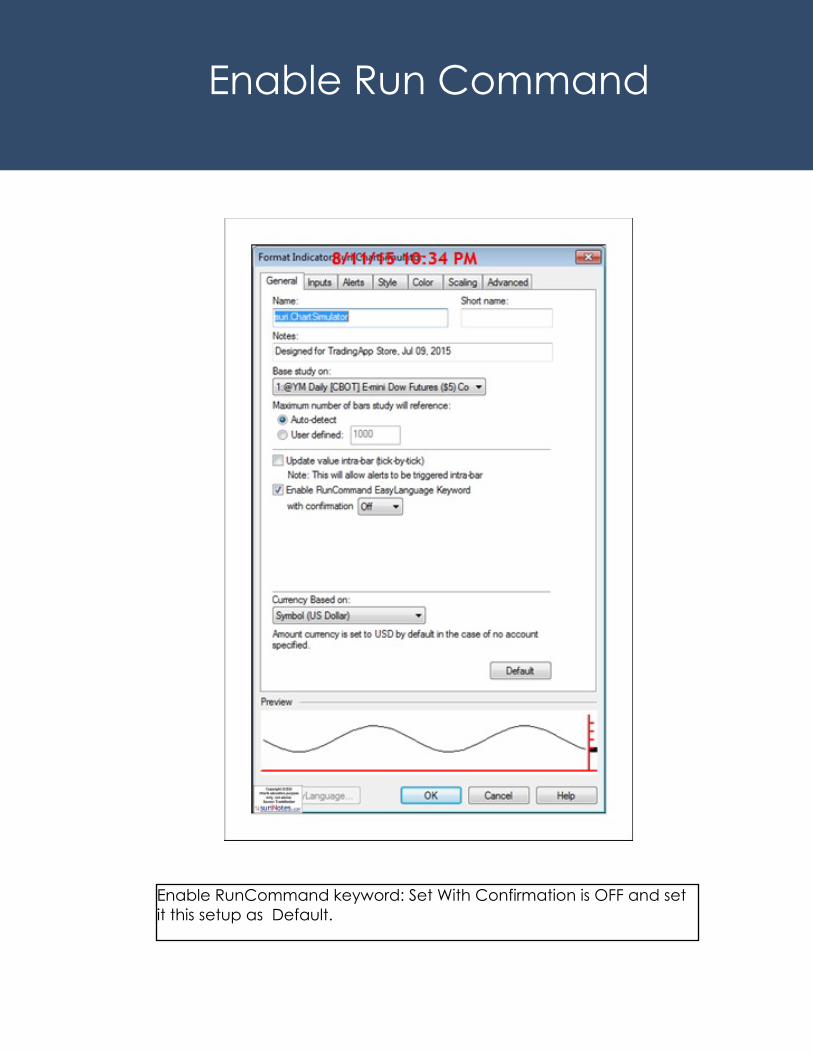
Enable RunCommand keyword: Set With Confirmation is OFF and setit this setup as Default.
Enable Run Command
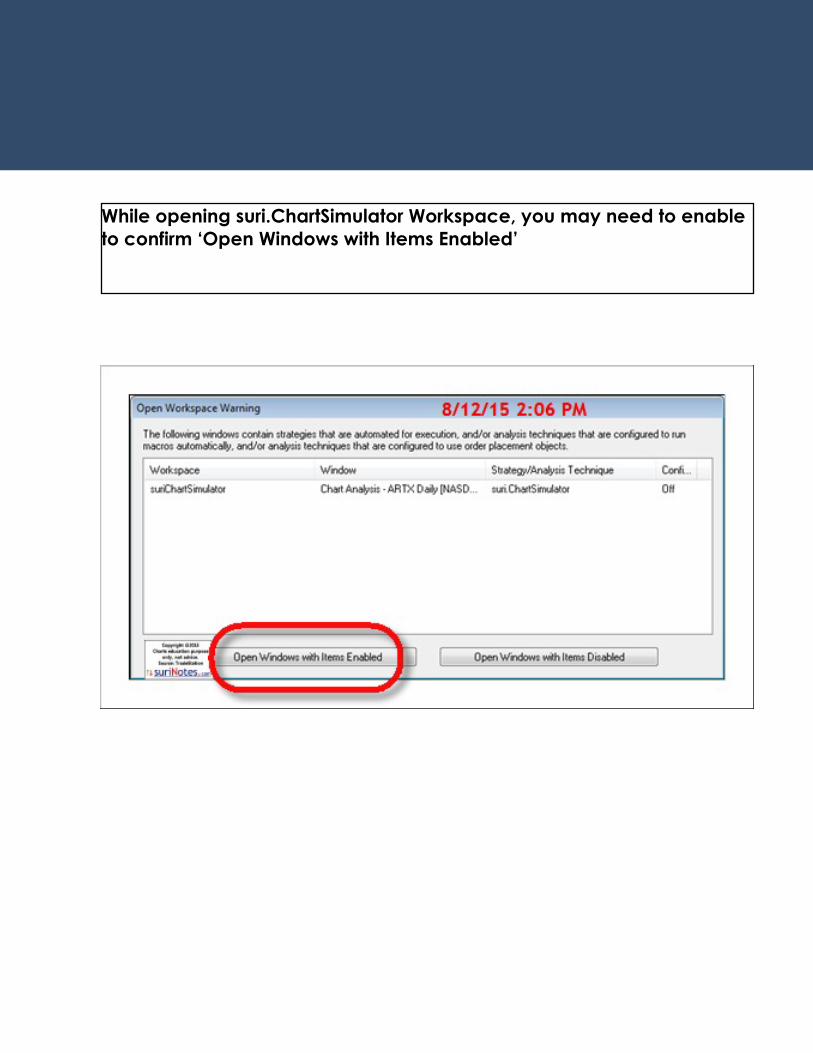
While opening suri.ChartSimulator Workspace, you may need to enableto confirm ‘Open Windows with Items Enabled’
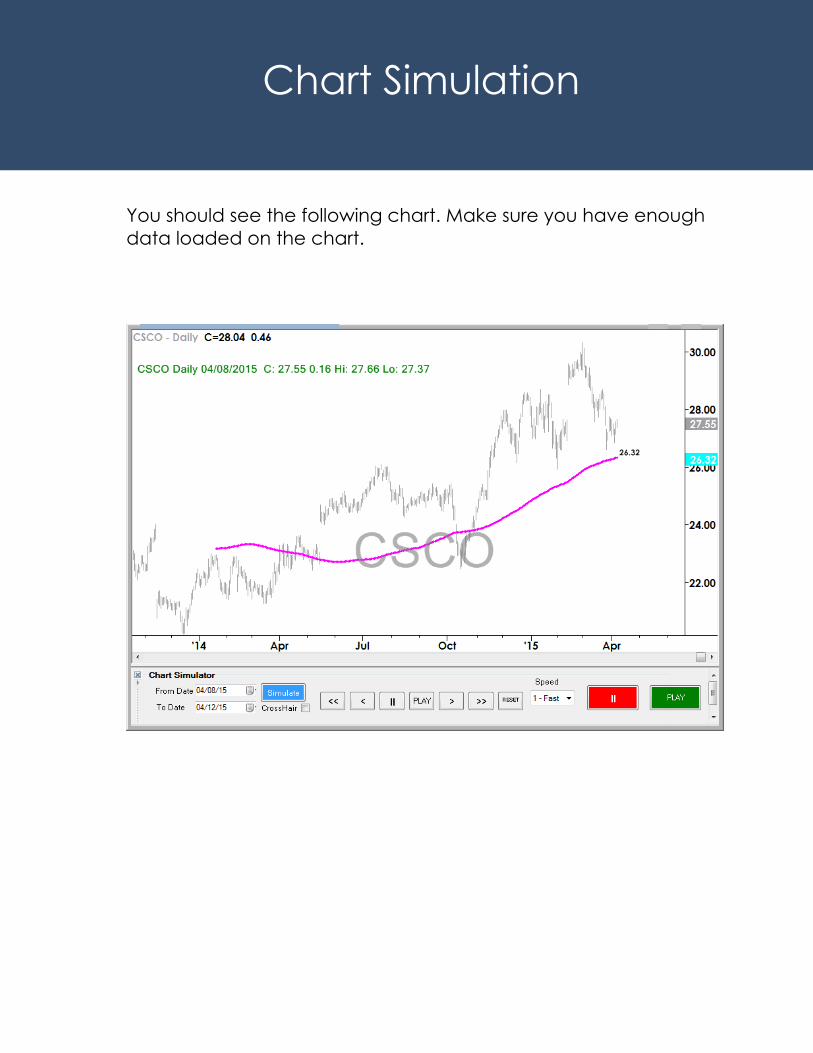
You should see the following chart. Make sure you have enoughdata loaded on the chart.
Chart Simulation
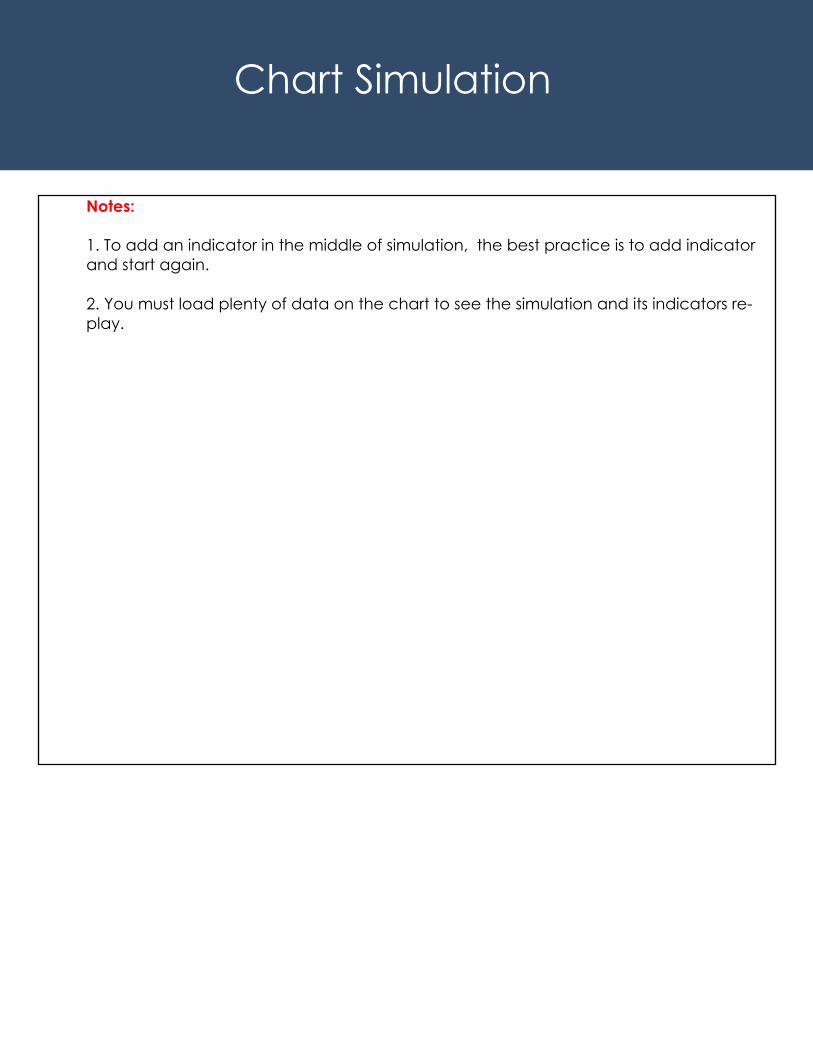
Notes:
1. To add an indicator in the middle of simulation, the best practice is to add indicatorand start again.
2. You must load plenty of data on the chart to see the simulation and its indicators re-play.
Chart Simulation
Chart Simulation Controls
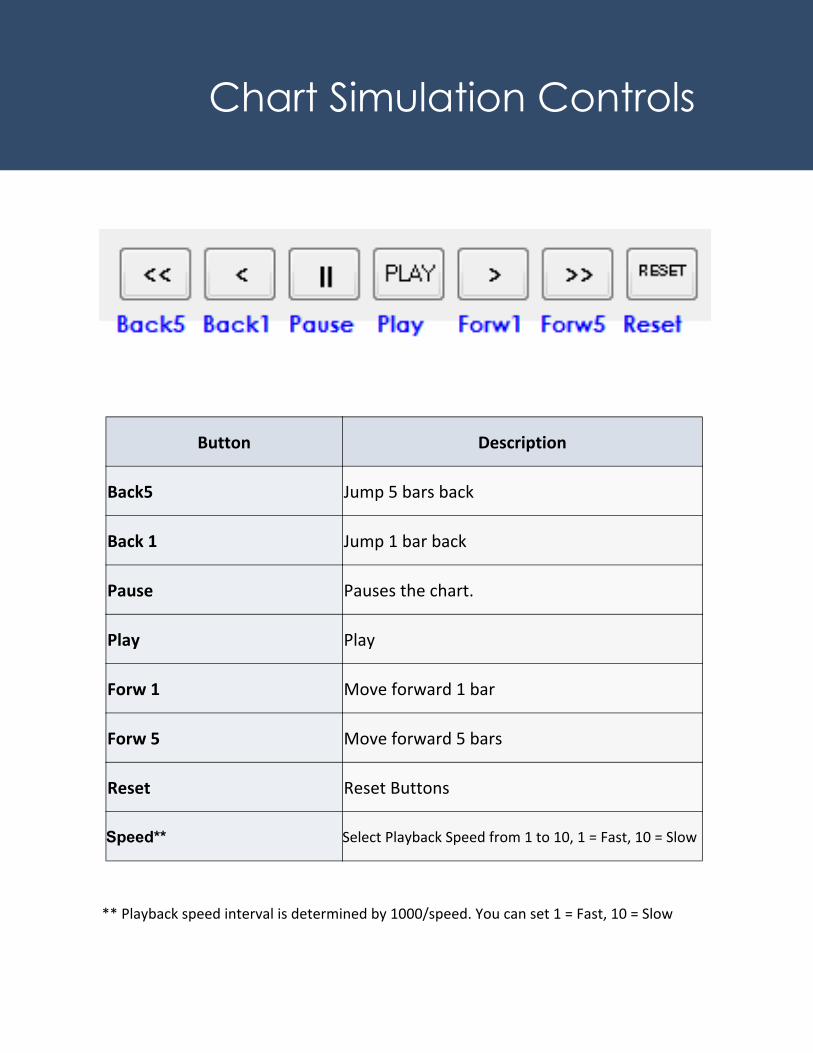
Button Description
Back5 Jump 5 bars back
Back 1 Jump 1 bar back
Pause Pauses the chart.
Play Play
Forw 1 Move forward 1 bar
Forw 5 Move forward 5 bars
Reset Reset Buttons
Speed** Select Playback Speed from 1 to 10, 1 = Fast, 10 = Slow
** Playback speed interval is determined by 1000/speed. You can set 1 = Fast, 10 = Slow
ChartSimulator Controls
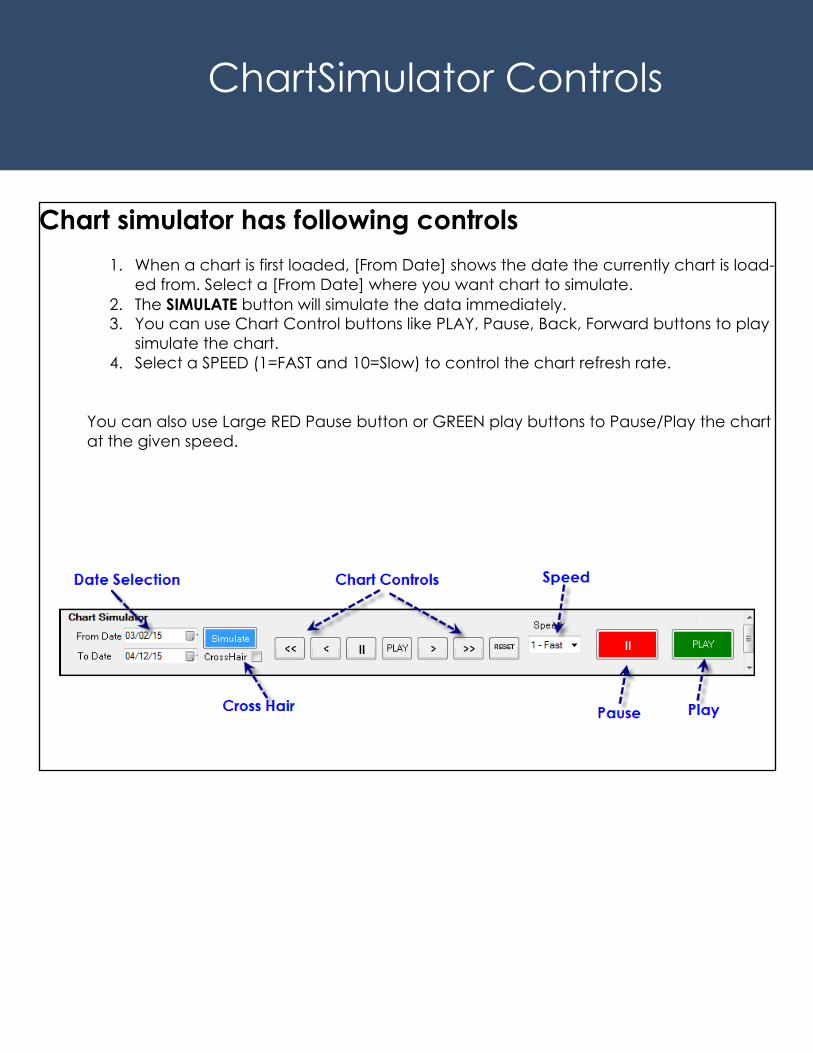
Chart simulator has following controls1. When a chart is first loaded, [From Date] shows the date the currently chart is load-
ed from. Select a [From Date] where you want chart to simulate.2. The SIMULATE button will simulate the data immediately.3. You can use Chart Control buttons like PLAY, Pause, Back, Forward buttons to play
simulate the chart.4. Select a SPEED (1=FAST and 10=Slow) to control the chart refresh rate.
You can also use Large RED Pause button or GREEN play buttons to Pause/Play the chartat the given speed.
INDICATOR Examples
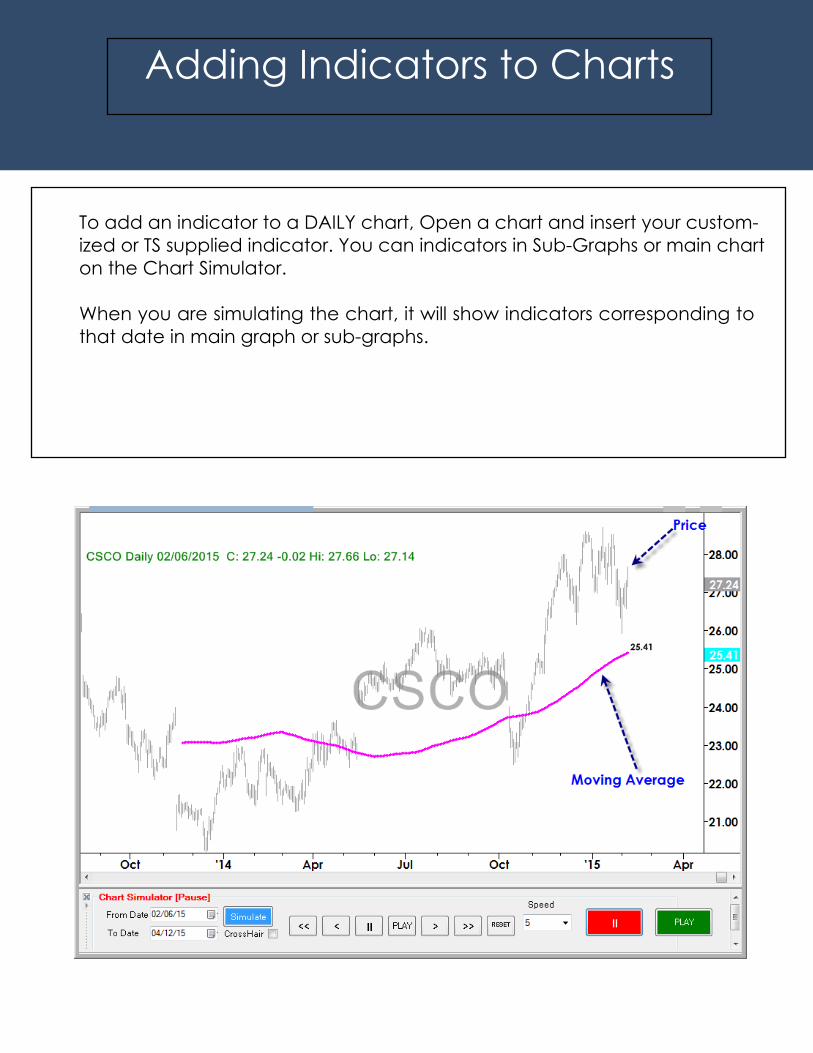
Adding Indicators to Charts
To add an indicator to a DAILY chart, Open a chart and insert your custom-ized or TS supplied indicator. You can indicators in Sub-Graphs or main charton the Chart Simulator.
When you are simulating the chart, it will show indicators corresponding tothat date in main graph or sub-graphs.
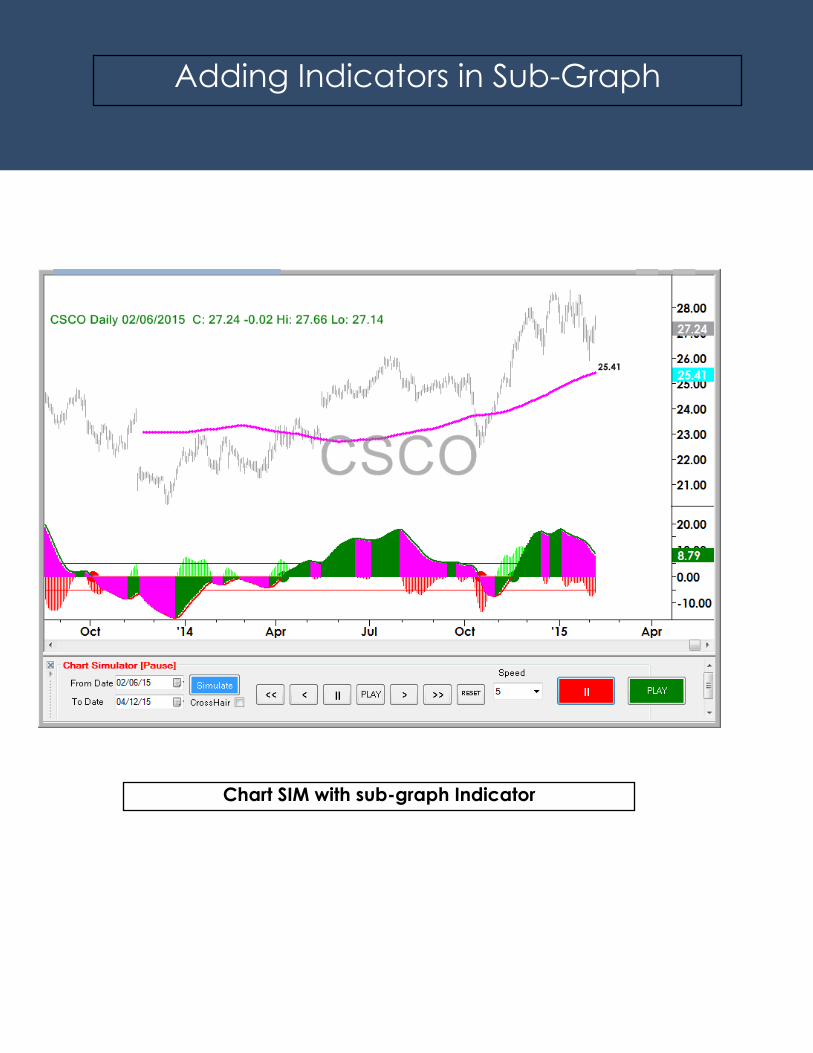
Adding Indicators in Sub-Graph
Chart SIM with sub-graph Indicator
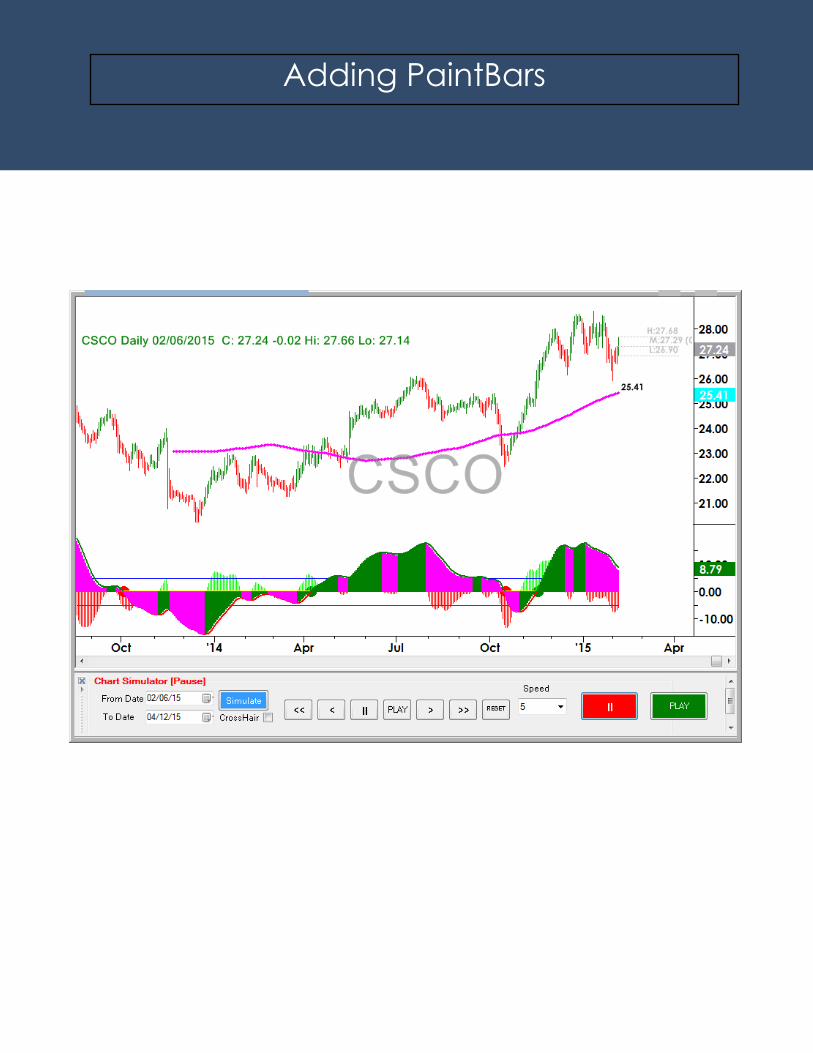
Adding PaintBars
Adding Cross Hair
To add Cross Hair (shows current bar Date, Open, High, Low and Close
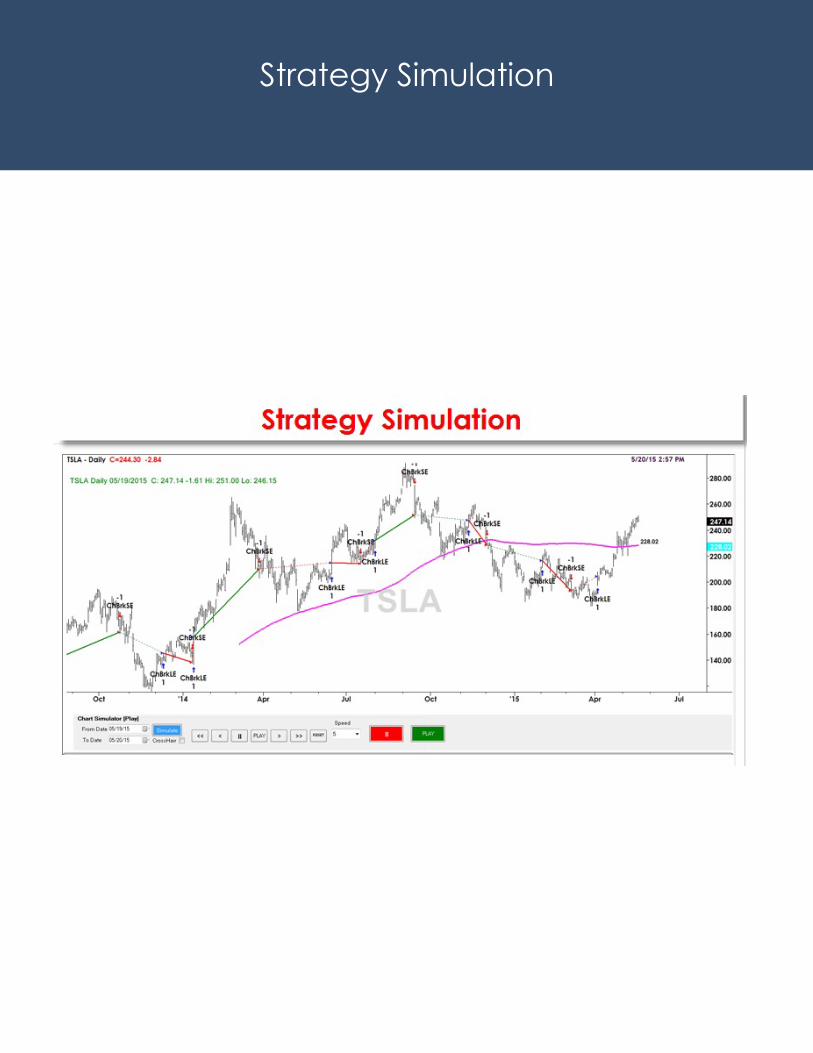
Strategy Simulation
Market ContextMost technical traders use chart analysis with market context concepts to trade.Market context concept is described as how current price is reacting to certainlevels (pivots, support and resistance) and how indicators are performing relative tohistoric price conditions (like oversold, overbought) and where/how patterns aredeveloping in current time-frame or multiple-time frames etc. Each trader developshis own market context to trade. One of the elegant ways to define market contextis through a Fib. Grid structure. Fib. Grid consists of Fib. Bands (showing pricereaction, trends), Pivot levels (to show historic Support/Resistance areas) andMarket Structures (to show potential turning points). All these patterns are wellexplained in my book with clear examples. On any trading chart, Fib. Grid layout isplotted to understand how current price is reacting to the Fib. bands and if theprice is exhausted, and price trading above/below the extreme bands and howthe price is reacting to the support and resistance levels defined by Pivots etc. AMarket structure (MSH/MSL) algorithm is used to confirm if the recent pivot high/lowis a key pivotal Market Structure to assist ABC formation.
Confluence of these levels in the Fib. Grid structure along with emerging patternstructure (and pattern target/stop levels) helps a trader make a clear tradedecision. Pattern trading is very precise as each pattern has specific rules toenter/stop and targets. When combined Pattern analysis with market context givesa great edge to trade. Patterns also fail but their failure levels are well defined andthat information is clearly known prior to the trade. Hence, pattern trading hasmuch more advantage than trading other trading methods.
Here is a Market Context chart to show the Fib. Grid structures, Pivot formations(Floor, Globex, Opening Range, Fib. Zone) and Market Structures. The othersuriNotes software like Harmonic Pattern identification methods (i.e., Gartleys, all X5patterns ) also use Market Context in real-time to identify key trading opportunities.These patterns also automatically plot Entry/Stops and Target levels without anydelays to give potential trade opportunities.
MARKET CONTEXT
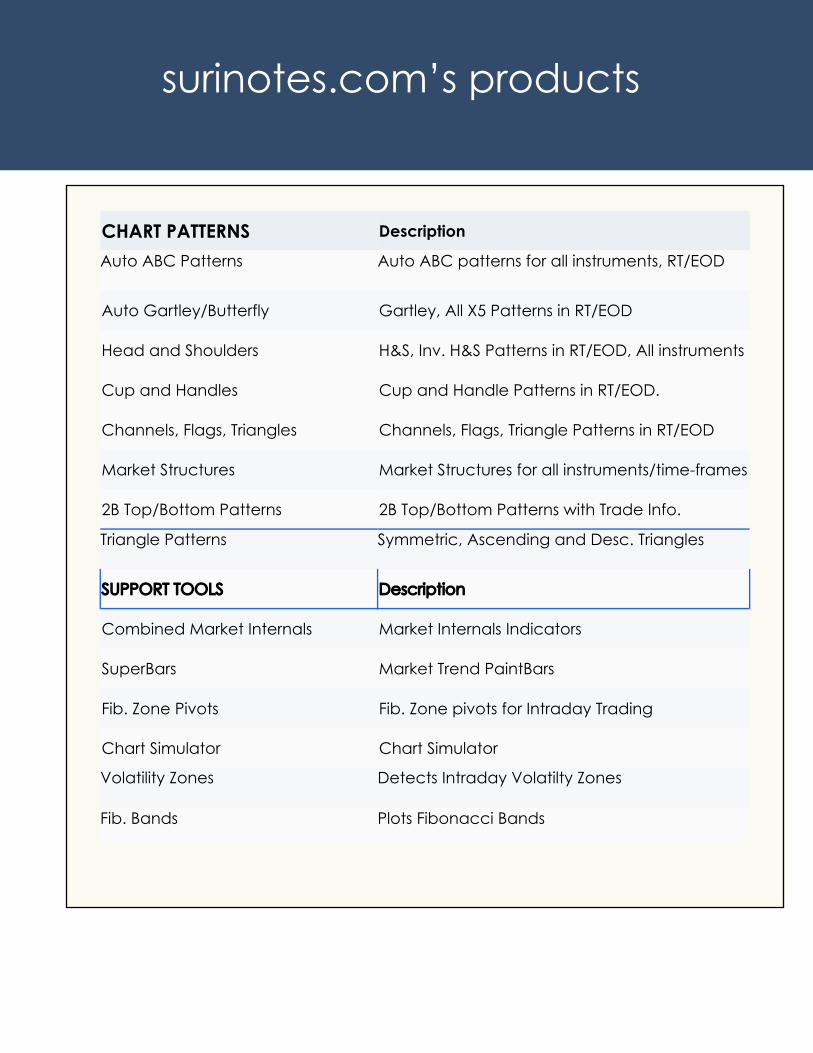
surinotes.com’s products
CHART PATTERNS Description
Auto ABC Patterns Auto ABC patterns for all instruments, RT/EOD
Auto Gartley/Butterfly Gartley, All X5 Patterns in RT/EOD
Head and Shoulders H&S, Inv. H&S Patterns in RT/EOD, All instruments
Cup and Handles Cup and Handle Patterns in RT/EOD.
Channels, Flags, Triangles Channels, Flags, Triangle Patterns in RT/EOD
Market Structures Market Structures for all instruments/time-frames
2B Top/Bottom Patterns 2B Top/Bottom Patterns with Trade Info.
Triangle Patterns Symmetric, Ascending and Desc. Triangles