i
HIGH-THROUGHPUT MECHANICAL CHARACTERIZATION METHODS FOR
COMPOSITE ELECTRODES AND IN-SITU ANALYSIS OF LI-ION BATTERIES
A Thesis
Submitted to the Faculty
of
Purdue University
by
Luize Scalco de Vasconcelos
In Partial Fulfillment of the
Requirements for the Degree
of
Master of Science in Mechanical Engineering
August 2016
Purdue University
West Lafayette, Indiana
ii
ACKNOWLEDGEMENTS
First and foremost, I would like to express my sincere gratitude to my advisor, Prof.
Kejie Zhao, for providing me his full support and trust during this time at Purdue. His
genuine concern with the professional development and well-being of each and every
student in our group, truly make us feel as part of a family. I bear a true appreciation for
his guiding and encouraging us to pursue new challenges and develop the necessary skills
to become well-rounded researchers.
I am also very fortunate to have worked in a group with such talented and cordial
individuals. I would like to especially thank my colleague, Rong Xu, that as the first student
in the group, has dedicated endless hours to training and helping the others. To my
colleagues, who make my day exciting and productive, a sincere thank you!
I am grateful to the professors who participated in my education in the course of
these two years. A special thanks to my committee members, Prof. Liang Pan and Prof.
Edwin García, for the constructive and insightful comments on my thesis work. I would
also like to thank Prof. Edwin García for his advice and availability to enlighten me on the
fundamentals of rechargeable batteries.
I am extremely thankful to my career mentor, Mark Lamontia, for his everlasting
friendship and guidance on every step of my academic endeavors. He has taught me
precious lessons that I will carry for my lifetime.
Finally, I would like to thank all of my friends who have become my support system
away from my native country. Most dearly, I would like to thank Vinícius for his
companionship and my loving family Amilton, Mary and Daniele for the care and for being
my inspiration.
I appreciate the financial support from the CAPES Foundation, Ministry of
Education of Brazil, under grant 88888.075986/2013-00.
iii
TABLE OF CONTENTS
Page
LIST OF TABLES .............................................................................................................. v LIST OF FIGURES ........................................................................................................... vi
ABSTRACT ....................................................................................................................... ix
1. INTRODUCTION ....................................................................................................... 1 1.1 Basics of Li-ion batteries ................................................................................... 1
1.1.1 Working principles ................................................................................... 1 1.1.2 Electrode ................................................................................................... 3 1.1.3 Electrolyte and SEI layer .......................................................................... 4
1.2 Failure of Li-ion batteries................................................................................... 5 1.2.1 Mechanical degradation ............................................................................ 7
1.3 Mechanical characterization of electrodes ....................................................... 11 1.3.1 Wafer curvature method ......................................................................... 11 1.3.2 Tension and compression tests of battery packs at large scale ............... 12
1.3.3 Tensile test of single nanowires and nanotubes at nanoscale ................. 13 1.3.4 Nanoindentation ...................................................................................... 15
1.4 Thesis outline ................................................................................................... 17
2. INSTRUMENTED INDENTATION ........................................................................ 18 2.1 Theory .............................................................................................................. 20 2.2 Area function calibration.................................................................................. 22
2.3 Sources of error ................................................................................................ 23 2.3.1 Creep ....................................................................................................... 23
2.3.2 Thermal drift ........................................................................................... 24 2.3.3 Pile-up ..................................................................................................... 25
2.3.4 Substrate effect ....................................................................................... 26 2.3.5 Surface roughness ................................................................................... 26
3. GRID INDENTATION OF COMPOSITE ELECTRODES ..................................... 28 3.1 Introduction ...................................................................................................... 28
3.2 Overview of NMC cathode .............................................................................. 31
3.3 Material preparation and experimental details ................................................. 32 3.3.1 Electrode processing ............................................................................... 32 3.3.2 Microstructure characteristics ................................................................. 32 3.3.3 Surface preparation ................................................................................. 33 3.3.4 Indentation test setup .............................................................................. 35
3.4 Statistical analysis ............................................................................................ 36 3.5 Results of grid indentation ............................................................................... 39
iv
Page
3.6 Validation through selective indentation ......................................................... 42 3.7 Discussion ........................................................................................................ 47 3.8 Conclusions ...................................................................................................... 48
4. IN-SITU NANOINDENTATION ............................................................................. 49 4.1 The need of in-situ technique ........................................................................... 49 4.2 Materials and methods ..................................................................................... 50 4.3 Preliminary results ........................................................................................... 53
4.3.1 Silicon overview ..................................................................................... 53
4.3.2 Sample preparation ................................................................................. 54 4.3.3 Electrolyte ............................................................................................... 54 4.3.4 Test setup ................................................................................................ 55
4.3.5 Volume expansion due to lithiation ........................................................ 55 4.3.6 Residual stress ......................................................................................... 56 4.3.7 SEI layer formation ................................................................................. 57
4.4 Discussion ......................................................................................................... 58
4.5 Summary .......................................................................................................... 65
5. CONCLUSIONS AND OUTLOOK ......................................................................... 66
v
LIST OF TABLES
Table .............................................................................................................................. Page
Table 3.1. Sample composition ......................................................................................... 43 Table 3.2. Porosity calibration of CB/PVDF and NMC electrode samples...................... 44
Table 3.3. Surface fractions, elastic modulus, and hardness of individual components
determined by grid indentation and selective indentation. ............................... 47
Table 4.1. Comparison between tests performed on dry sample and completely
immersed sample. ............................................................................................. 52
vi
LIST OF FIGURES
Figure ............................................................................................................................. Page
Figure 1.1. Working principle and major components of a Li-ion battery. ........................ 2 Figure 1.2. Illustration of common degradation mechanisms in Li-ion batteries [21]. ...... 6
Figure 1.3. Common mechanical degradation in LIBs [24] [25] [27] [28] [29] [30]. ...... 10 Figure 1.4. Schematic of wafer curvature methods [31]. .................................................. 12 Figure 1.5 Schematic of (a) compression and (b) tension tests of samples immersed
in fluid [37]. ................................................................................................... 13 Figure 1.6. Device by Lu et al. [39] that allows carrying out tensile testing using
instrumented indentation and TEM imaging. Arrows show the direction
of movement; the load is applied on the device downwards and
converted into axial tensile loading at the nanowire. .................................... 14
Figure 1.7. In situ TEM tensile experimental procedure by Kushima et al. [40]. (a)
Illustration of main components. (b) Silicon nanowire is first lithiated
using lithium metal as the counter electrode (c) An AFM controls the
cantilever to contact with a glue. (d) The cantilever is moved to touch
with the tip of the nanowire. (e) Tensile test is carried on by a
displacement controlled piezo movement. .................................................... 15 Figure 1.8. Schematics of indenter penetration and residual impression ......................... 16
Figure 2.1. Keysight XP nano-mechanical actuator and transducer. ................................ 19 Figure 2.2. Most common tip geometries and corresponding applications. ..................... 19
Figure 2.3. (a) Schematic of the load-displacement curve. (b) Contact geometry
parameters [47]. ............................................................................................. 21 Figure 2.4. Area function calibration test on fused silica. ................................................ 23
Figure 2.5. Solid line (no peak hold time) shows elbow in the unloading curve due to
continued creep. Dashed lines (120s and 240s peak hold time) with creep
saturated during the peak hold time [49]. ...................................................... 24 Figure 2.6. Standard thermal drift correction procedure [51]. .......................................... 25 Figure 3.1.(a) Schematic of grid indentation on a heterogeneous material. The red
and blue colors represent different phases, and the triangles represent
individual indentation sites. The indentation size is much smaller than
the characteristic size of the phases and
vii
Figure ............................................................................................................................. Page
the grid spacing is larger than the size of indentation impression. (b)
Grid indentation yields a multimodal probability function that allows
determination of mechanical properties of the constituent phases. ............... 29 Figure 3.2. SEM images of the cathode electrode composed of NMC532 particles,
PVDF binders, and porous carbon black matrix. (a) Top view. (b)
Magnified view on a single NMC532 particle. (c) Cross-section view. ....... 33 Figure 3.3. Surface preparation procedure. Optical images of the NMC surface (a) as-
coated, (b) after coarse polishing and (c) after fine polishing. ...................... 34 Figure 3.4. Close-up view of the polished surface of the NMC electrode. ....................... 35 Figure 3.5. Example of a small indentation grid on NMC; imprints from indentations
performed at 200nm depth (the mechanical properties are obtained with
an indentation depth of 100 nm). .................................................................. 39
Figure 3.6. (a) Optical image of a 33µm × 33µm area for grid indentation. Contour
plot of (b) elastic modulus and (c) hardness in the selected area. ................ 40 Figure 3.7. (a) Cumulative probability of elastic modulus and tri-modal Gaussian
fitting. (b) Plots of probability distribution function using the same set of
parameters in (a). (c) Cumulative probability of hardness and tri-modal
Gaussian fitting. (d) Plots of probability distribution function using the
same set of parameters in (c). ........................................................................ 41 Figure 3.8. Optical image of selective indentation impressions on NMC particles at
400nm maximum penetration ........................................................................ 42
Figure 3.9. Experimental results of selective indentation on NMC particles. (a)
Typical load-displacement curve of nanoindentation and (b) Indentation
histograms of elastic modulus and hardness for 50nm, 100nm and 150nm
maximum indentation depth. (c) Dependence of elastic modulus and
hardness on the maximum indentation depth. The blue rectangles mark
the range in which the measured properties are less sensitive to the effect
of particle microstructure at shallow indentation and the effect of
surrounding medium at deep indentation. ..................................................... 45 Figure 3.10. (a) elastic modulus and (b) hardness of CB/PVDF sample measured at
various indentation depths. The mechanical properties are relatively
insensitive to the effect of surface roughness at shallow indentation and
the substrate effect at deep indentation ........................................................ 46
Figure 4.1. In-situ nanoindentation platform .................................................................... 51 Figure 4.2. Three electrode fluid cell showing the working electrode connected by
copper tape to the sample (green), counter electrode (red) to a long
lithium ribbon, and reference electrode (white) connected to short lithium
ribbon. ............................................................................................................ 52 Figure 4.3. Sample dimensions ......................................................................................... 54 Figure 4.4. Thickness of SEI layer on silicon thin film as a function of equilibrium
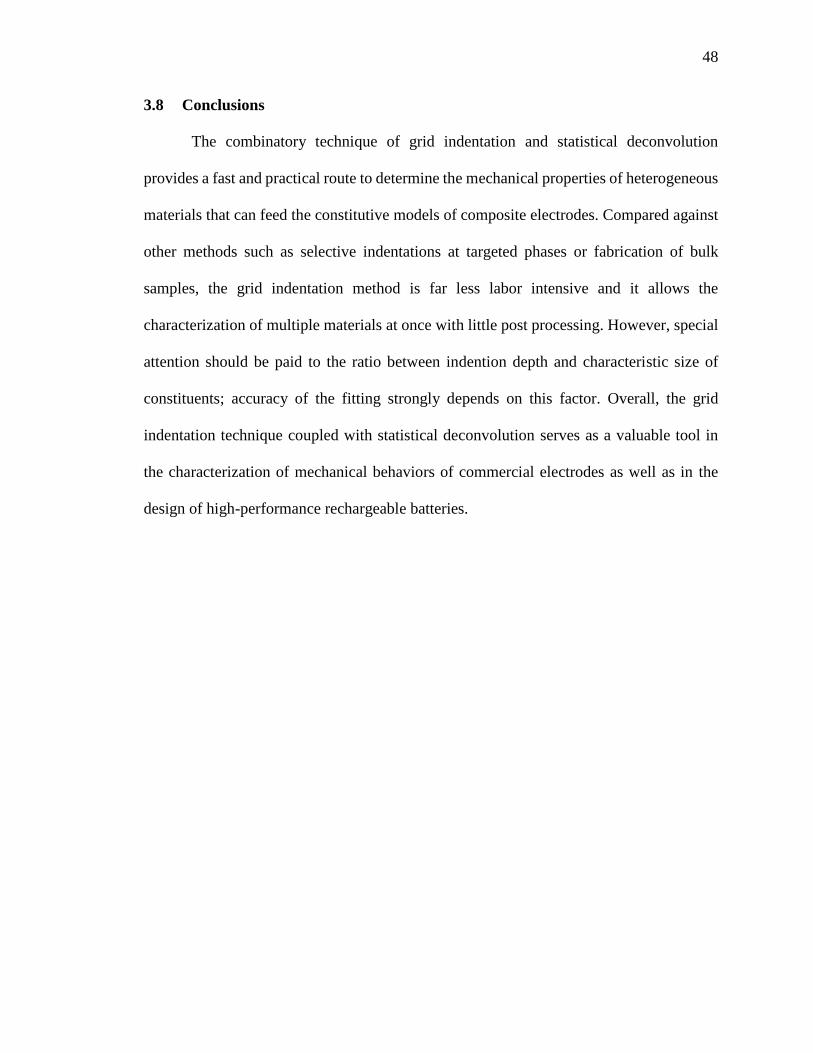
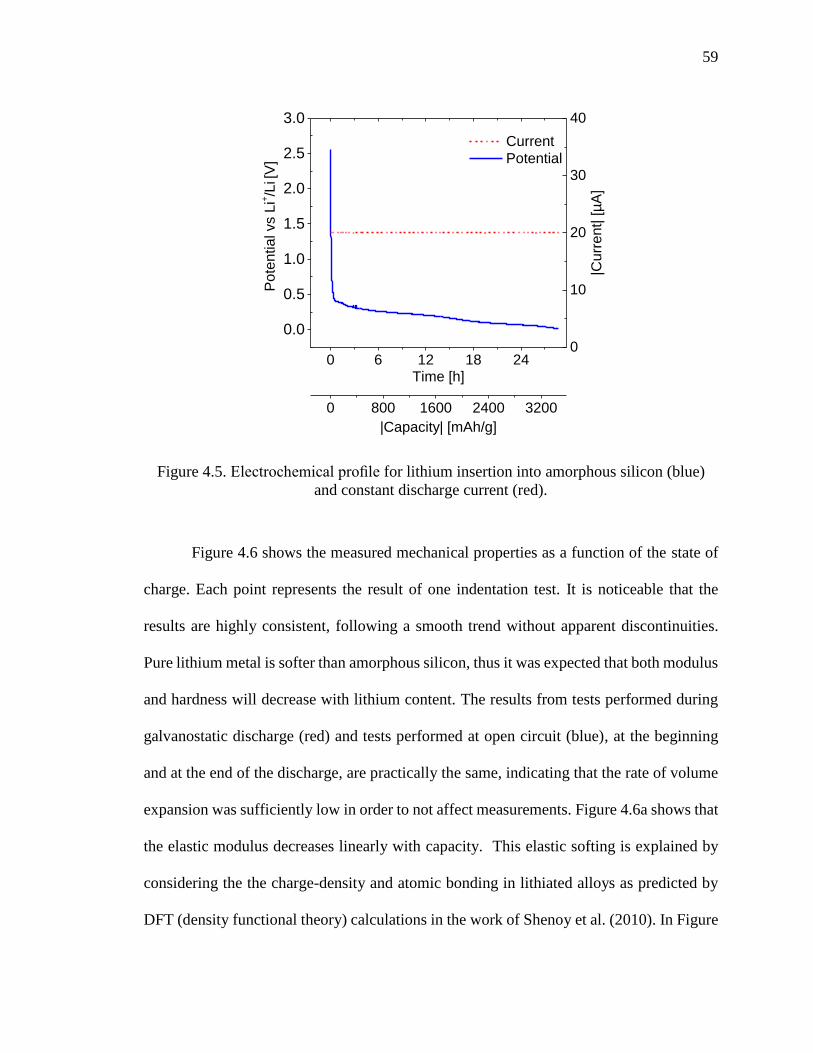
potential for 1.2M LiPF6 in PC during the first two cycles [88]. .................. 58 Figure 4.5. Electrochemical profile for lithium insertion into amorphous silicon (blue)
and constant discharge current (red). ............................................................ 59
viii
Figure ............................................................................................................................. Page
Figure 4.6. Nanoindentation tests performed during discharge (red) and during OC
(blue). (a) elastic modulus and (b) hardness as a function of the capacity. .. 60 Figure 4.7. Elastic modulus assuming constant Poisson ratio with lithiation (red)
and variable Poisson obeying the rule of mixtures (blue). ........................... 61 Figure 4.8. Batches of load-displacement curves obtained in different ranges of state-
of-charge. ....................................................................................................... 63 Figure 4.9. (c) Elastic modulus and (d) hardness as a function of Li fraction compared
to results by Shenoy et al., [75] Hertzberg et al. [83] and Berla et al. [84]. .. 64
ix
ABSTRACT
Scalco de Vasconcelos, Luize. M.S.M.E., Purdue University, August 2016. High-
Throughput Mechanical Characterization Methods for Composite Electrodes and In-Situ
Analysis of Li-ion Batteries. Major Professor: Kejie Zhao.
Electrodes in commercial rechargeable batteries are microscopically heterogeneous
materials. The constituents often have large variation in their mechanical properties,
making the characterization process a challenging task. In addition, the mechanical
properties and mechanical behaviors of electrodes are closely coupled with the
electrochemical processes of lithium insertion and extraction. There is an urgent need to
develop an experimental platform to characterize the chemomechanical response of
electrodes under the in-situ conditions of charge and discharge.
In the first part of this thesis, instrumented grid indentation is employed to
determine the elastic modulus and hardness of the constituent phases of a composite
cathode. The approach relies on an array of indentations and statistical analysis of the
experimental output. The statistically interpreted properties of the active particles and
matrix are further validated through indentation at selected sites. The combinatory
technique of grid indentation and statistical deconvolution is demonstrated to be a fast and
reliable route to quantify the mechanical properties of composite electrodes.
In the second part of work, a nanoindenter, a liquid cell, and an electrochemical
station are integrated into an inert gas filled glovebox. The developed experimental
x
platform makes it possible to perform mechanical tests of thin film electrodes during in-
situ charge and discharge cycles and to monitor the evolution of the mechanical properties
as a function of the state of charge. The technique overcomes practical issues related with
environment requirements and instrument limitations, and enables comprehensive and
consistent data acquisition. Furthermore, the procedure allows experiments to be carried
out in a considerably shorter time than existing methods. In a preliminary study, this
technique is applied to the in-situ characterization of silicon thin film and it is validated
against the literature results.
Overall, the thesis work focuses on the mechanical characterization, both ex-situ
and in-situ, of electrodes in Li-ion batteries. The developed methodology and experimental
platform are significant toward the complete understanding of the chemomechanical
behaviors of high-performance batteries.
1
1. INTRODUCTION
1.1 Basics of Li-ion batteries
This chapter starts by describing the working principles of Li-ion batteries (LIBs),
its main components, and various mechanisms of degradation. Then it presents an overview
of current techniques for mechanical characterization of materials in the field of research
of energy materials. Finally, it outlines the structure of the thesis.
1.1.1 Working principles
The term electrochemical system refers to devices that can convert energy between
two forms, chemical and electrical. An electrochemical cell is composed of three main
components: a positive and a negative electrode separated by an electrolyte, as illustrated
in Figure 1.1. The electrodes are electronically conductive, whereas the electrolyte can
conduct ions, but block the movement of free electrons. The difference in the
electrochemical potential of the two electrodes drives ions across the ionic conductive
electrolyte, while electrons can only move through an external circuit connecting the two
electrodes, either doing work or requiring work in the process. This ion and electron
movement during charge and discharge is illustrated in Figure 1.1 for an Li-ion battery.
2
Figure 1.1. Working principle and major components of a Li-ion battery.
Major properties of electrochemical cells follow the thermodynamic and kinetic
formulations for chemical reactions [1]. The thermodynamic properties of a material can
be related to those of its constituents i through the concept of the chemical potential of an
individual species as follows 𝜇𝑖 [2]:
𝜇𝑖
= (𝜕𝐺
𝜕𝑛𝑖)
𝑇,𝑝,𝑛𝑗
𝑖≠𝑗
, (1.1)
where 𝐺 is the Gibbs free energy, 𝑛𝑖 is number of moles of species 𝑖 , 𝑛𝑗 is the
number of moles of all species except for 𝑖 , 𝑇 is temperature and 𝑝 is pressure. In an
electrochemical system, the electrochemical potential �̅� for a species 𝑖 with a charge 𝑧𝑖 in
a phase 𝛼 is defined as [3]:
�̅�𝑖𝛼 = 𝜇𝑖
𝛼 + 𝑧𝑖𝐹𝜙𝛼 , (1.2)
where F is the Faraday constant. Under equilibrium, the electrochemical potential
between the species 𝑖 in the 𝛼 phase and the same species 𝑖 in the 𝛽 phase is balanced by
3
the voltage shift and the chemical potential of each phase. Thus, the voltage or electrical
potential difference ∆𝜙 is given by [4]:
�̅�𝑖
𝛼 = �̅�𝑖𝛽
→ ∆𝜙𝛼→𝛽 =∆𝜇𝑖
𝛼→𝛽
𝑧𝑖𝐹 (1.3)
Thermodynamics describe reactions at equilibrium, however, when current is
drawn from a cell at an appreciable rate, there are a number of resistances related with
kinetic limitations that cause the voltage to drop. The difference between the equilibrium
voltage and observed voltage is often referred as the overpotential and can be grouped into
three categories: activation, concentration, and ohmic [5]. The activation overpotential,
also called activation polarization, is related with the kinetics of charge transfer at the
interface of the electrode and electrolyte, while the concentration overpotential is caused
by mass transport limitations. Finally, the ohmic overpotential is tied to the cell design
through the resistance of its components and contacts [1]. All the overpotentials represent
dissipative losses that increase in magnitude with an increase in the current density.
1.1.2 Electrode
In commercial batteries both the cathode and anode are composites of high
heterogeneity at the nano- to microscale, consisting of active particles, a matrix composed
of polymer binders and additives, and pores filled with the electrolyte. The active particles
react with Li. Polymeric binders physically hold the active materials together. Conductive
agents such as carbon black are added to enhance the electronic conductivity so that
electrons can be transported to the active material. Moreover, sufficient porosity exists in
the matrix to allow the liquid electrolyte to penetrate the matrix and transport ions to the
4
reacting sites. Electrode materials are coated on current collectors. The current collector
material is selected according to its electrochemical stability window. The electrochemical
stability of copper at low potentials makes it suitable as the anode current collector.
Although aluminum is not electrochemically stable at high potentials, it is stabilized by a
passivation layer formed from electrolyte degradation products and therefore is often used
as the cathode current collector [6].
1.1.3 Electrolyte and SEI layer
The primary function of the electrolyte solution is to allow ion transport between
cathode and anode. In practice, it must show a number of physicochemical properties in
addition to good ionic conductivity, such as thermal stability, chemical stability,
electrochemical windows covering operation voltages, stable formation of SEI layer, and
minimum parasitic reactions [7].
Commercial electrolytes for Li-ion batteries are usually composed of lithium
hexafluorophosphate (LiPF6) salt dissolved in a nonaqueous solution of organic
carbonates. A mixture of linear carbonates and cyclic carbonates is commonly used to take
advantage of their dissimilar properties [7]. For example, ethylene carbonate (EC) assists
in the stable formation of a passivating layer, but it has the drawback of having high melting
point (34◦C). Therefore, it requires the addition of co-solvents such as diethyl carbonate
(DEC) and dimethyl carbonate (DMC) to be in the liquid state at ambient temperature [8].
Propylene carbonate (PC) has a wide liquid temperature range, however, it suffers from
solvent decomposition on the anode surface, which causes electrode disintegration and
delamination from current collector [8].
5
Numerous studies have been carried out to investigate the influence of the solvent
ratios, salt concentration and additives on electrochemical performace [9] [10] [11]. Work
by Petibon et al. [12] found evidence that increasing LiPF6 concentration can minimize
impedance growth when using certain additives, while the same phenomenon is not
observed in the same test conditions without these additives. Therefore, how different
variables affect electrochemical degradation is specific to each electrode/electrolyte
combination and operation conditions used.
Electrolyte solvents are unstable at the operation potentials of Li-ion batteries and
tend to reduce and oxidize on the surface of the negative and positive electrodes,
respectively [13]. The products of these reactions form a protective interface layer between
electrolyte and electrode named Solid-Electrolyte Interface (SEI). This layer limits further
decomposition of the electrolyte by minimizing electronic conductivity, while still
allowing lithium ion transport [14]. Ideally, the SEI would completely block electronic
conductivity, while still allowing lithium ions to reversibly diffuse between the anode and
cathode with no additional capacity fade. In practice, however, the SEI may continue to
build-up resulting in a gradual capacity fade as it thickens. In addition to providing
electronic insulation and high Li ion conductivity, the SEI must strongly adhere to active
material and be sufficiently elastic and flexible to accommodate volumetric expansion of
the active material, as well as be composed of insoluble passivating agents [15].
1.2 Failure of Li-ion batteries
Recent interest in alternative energy sources has led to stricter life and energy
density requirements for energy storage systems. Electric/hybrid electric vehicles, for
6
example, require battery life up to 15 years [13]. Hence, understanding degradation
mechanisms have become increasingly important and attracted numerous experimental and
modeling studies [16] [17] [18].
Aging and failure in LIBs are caused by a number of complex and interrelated
processes which, in many cases, are still not completely understood [13]. How degradation
evolves depend on a variety of factors, including operating conditions such as cut-off
voltages, operating temperature, and cycling rate. For example, high operating voltage and
high temperature lead to premature deterioration of LIB state-of-health by, respectively,
favoring and accelerating phase transitions and formation surface films [19]. Electrode
composition and cut-off voltages can be tuned up for better capacity retention [20].
A summary of the most common degradation mechanisms in Li-ion batteries are
illustrated in Figure 1.2 by Birkl [21].
Figure 1.2. Illustration of common degradation mechanisms in Li-ion batteries [21].
Ultimately, degradation manifests as either voltage decay or capacity loss [13].
Voltage decay is a result of the impedance increase caused by loss of electron conduction
7
path and SEI layer growth, while capacity loss is mostly caused by electrode disintegration,
material deterioration, and loss of free lithium [22].
1.2.1 Mechanical degradation
This worked focused on the degradation aspects related to structural stability of
LIBs electrodes. Mechanical stability is one of the key criteria for the selection of
electrodes. Mechanical behaviors such as stress and strain dictate the occurrence of cracks
and loss of contact, and are intimately related with the morphology and mechanical
properties of electrode active and inactive materials. During charge and discharge, the
amount of Li in the electrodes varies, causing the host electrodes to experience phase
transformation and volumetric change [23]. The deformation can be constrained by various
conditions such as grain boundaries, mismatch between active and inactive materials, and
inhomogeneous distribution of Li ions. Such constrained conditions generate a stress field
that induces fracture and morphological change.
Figure 1.3 summarizes different forms of mechanical degradation observed in LIBs
materials which are detrimental to the electrochemical performance of batteries.
In most cases, electrode deterioration ultimately causes detachment of active
material from electrode, leading to irreversible capacity loss and impedance rise. One
common form of degradation is the occurrence of cracks that form to relieve stresses
induced by the volumetric mismatch between lithiated and delithiated phases. Wang et al.
[24] found evidence that, during lithiation, LiFePO4 grains turns into a two phase structure
of LiFePO4 and FePO4 with a sharp interface. When this interface is subjected to stress
resulted from volumetric change, cracks form and grow as shown in Figure 1.3a. Crack
8
formation related with two phase boundary is also observed in silicon nanoparticles in the
work of Liu el al. [25]. The mechanism of lithiation in crystalline Si particles can be
described as an inward movement of the two-phase boundary between the inner core of
pristine Si and the outer shell of amorphous Li–Si alloy. In this case, the crack is initiated
at the outer shell by buildup of large tensile hoop stress (Figure 1.3e).
Delamination between active particles and binders is another common
manifestation of degradation in LIB. During delithiation, the active particles shrink and,
because of the inherent plasticity of binders, the matrix do not restore fully to its initial
configuration, leaving a gap between active material and matrix [26]. This mechanism was
observed by Chen [27] in LiMn1.95Al0.05O4 (LMAO) electrodes after being subjected to
1015 cycles (Figure 1.3c).
Evidence of particle disintegration has been observed in electrode materials where
active particles are formed by an agglomerate of smaller particles, defined as primary
particles. This type of degradation has been studied by Watanabe et al. [28] for
LiAl0.10Ni0.76Co0.14O2 (NCA) electrodes and shown to be closely related to the depth-of-
discharge (Figure 1.3b). At tests performed with wider discharge windows, the volumetric
expansion is more expressive, thus introducing higher stresses in the material. This leads
to the generation of micro-cracks that are responsible for the separation of primary particles.
Material pulverization is a degradation mechanism observed in electrodes that
experience high volumetric expansion due to insertion and extraction of a large amount of
lithium. The experiment conducted by Liu et al. [29] on aluminum nanowire found
evidence of this effect. The dealloying of lithium from LiAl eventually gives rise to
9
pulverization of the metallic nanowire electrode forming Al nanoparticles separated by
voids (Figure 1.3f).
There are also cases where the volumetric expansion leads to SEI breakage. Sun et
al. [30] found the evidence of this effect in Co3O4 hollow spheres after 90 cycles at 1C,
shown in Figure 1.3d. This degradation of the SEI is detrimental to electrochemical
performance of the battery because when the SEI fractures, new surfaces of the active
material are exposed to electrolyte, inducing the formation of new SEI. This process keeps
decomposing the electrolyte and consuming lithium ions and results in a persistent decrease
of cyclic efficiency.
11
1.3 Mechanical characterization of electrodes
Section 1.2.1 demonstrated how structural changes and degradation affect the
electrochemical performance of LIBs. This chapter presents an overview of different
techniques that can be applied for the evaluation of mechanical stabilities of electrodes,
and provides arguments that support the experimental method developed in this work.
Mechanical characterization techniques consist of standardized measurements of
how materials respond to physical forces. Mechanical properties acquired through these
tests are essential for modeling mechanics of electrodes and predicting cycle life. Thus,
they can help advance the current understanding of how mechanical degradation is induced,
and clarify the relationship between mechanical properties and capacity fade. This
information assists the fine tuning of electrode composition and microstructure, to
minimize degradation and improve capacity retention. The following subsections describe
the most commonly used mechanical characterization techniques in the field of energy
storage materials.
1.3.1 Wafer curvature method
Curvature-based experimental techniques are used to monitor stress evolution and
measure the biaxial modulus of thin films. The stress is induced during thin film deposition
and by other processes such as, in the case of in-situ measurements of lithium ion batteries,
the volume expansion due to lithiation. The stress cannot be directly measured since it is a
field variable, however, it can be estimated through the measurement of deformation [31].
Stress in a thin film on a flexible substrate induces a curvature of the substrate, as illustrated
in Figure 1.4. This change in curvature is used to calculate the stress through the Stoney’s
12
equation [32], which is also a function of the biaxial modulus of the substrate, and the
thickness of both the film and the substrate.
Figure 1.4. Schematic of wafer curvature methods [31].
This method has been successfully applied to measure in-situ stress evolution in
materials in Li-ion cells [33] [34]. The biaxial modulus can be estimated by performing a
sequence of lithiation/relaxation/delithiation steps at several values of state-of-charge
(SOC). The biaxial modulus is given by the stress change estimated from the curvature test
(Δσ) and volumetric strain of the film due to lithiation (Δε), which is proportional to the
amount of lithium inserted [35].
1.3.2 Tension and compression tests of battery packs at large scale
Tension and compression tests probe fundamental material properties such as
elastic modulus, yield strength, and ultimate strength through the analysis of stress-strain
curves [36]. In general, these tests are conducted by fixing the specimen into a test
apparatus and applying a force to the specimen by separating or moving together the testing
13
machine crossheads. Macro mechanical tests have limited application in LIB
characterization due to the small characteristic size and heterogeneous structure of
electrode components. Therefore, in LIB research, this technique is most commonly used
to evaluate mechanical integrity of systems and major components, instead of the intrinsic
properties of constituent materials. For example, Peabody and Arnold [37] have employed
tension and compression tests to evaluate the rate and fluid-dependent mechanical
properties of separators immersed in different fluids, as illustrated in Figure 1.5. This type
of test can also be coupled with electrochemical analysis to study short circuiting behaviors
of battery packs at different SOC [38].
Figure 1.5 Schematic of (a) compression and (b) tension tests of samples immersed in
fluid [37].
1.3.3 Tensile test of single nanowires and nanotubes at nanoscale
In the recent years, the interest in nanowire and nanotube structures for high capacity
electrodes has motivated the development of different techniques to perform mechanical
testing on 1-D nanostructures. In general, these experiments require at least one high
resolution actuator coupled with one high precision microscopy system to monitor
14
deformation. One example is the device developed by Lu et al. [39] shown in Figure 1.6,
which is able to convert the compressive force applied by a nanoindenter into pure tension
loading at the sample stage where a nanowire is fixed. The in-situ characterization in Li-
ion batteries adds more complexity to the experiment. The system designed by Kushima et
al. [40] can conduct lithiation of silicon nanowires followed by tensile test of the lithiated
nanowire. A 3D piezoelectric manipulator is responsible for applying tension load to the
wire, while the deformation is measured from the TEM images. In addition, an AFM
cantilever is employed to exchange modes from electrode charging to mechanical testing
and vice-versa. Figure 1.7 summarizes the test procedure.
Figure 1.6. Device by Lu et al. [39] that allows carrying out tensile testing using
instrumented indentation and TEM imaging. Arrows show the direction of movement; the
load is applied on the device downwards and converted into axial tensile loading at the
nanowire.
Indenter Nanowire
Pull-to-push type
conversion
device
15
Figure 1.7. In situ TEM tensile experimental procedure by Kushima et al. [40]. (a)
Illustration of main components. (b) Silicon nanowire is first lithiated using lithium metal
as the counter electrode (c) An AFM controls the cantilever to contact with a glue. (d)
The cantilever is moved to touch with the tip of the nanowire. (e) Tensile test is carried
on by a displacement controlled piezo movement.
1.3.4 Nanoindentation
Instrumented indentation is a well-established technique that can be applied in the
characterization of a variety of materials and structures including biological specimens,
thin films, metals, polymers and composites. It is capable of testing a range of mechanisms
such as dislocation, fracture, creep, fatigue, scratch resistance, and so on [41] [42] [43].
The most common mechanical properties assessed by nanoindentation tests are elastic
modulus and hardness.
16
The test procedure starts with a hard tip applying pressure to the sample and, as the
load increases, the tip penetrates into the specimen (Figure 1.8). Elastic and plastic
deformation yield an impression conforming to the shape of the tip, until it reaches a user-
defined load or displacement value. When the load is removed, the elastic portion of the
deformation is recovered, leaving a residual indentation on the sample. Force and tip
displacement are continuously controlled and measured with high resolution actuators and
sensors throughout the loading cycle and the contact area is inferred from the resulting
load-displacement curve data, discarding the need for imaging the residual impression.
Finally, the mechanical properties are derived from the load-displacement data. The theory
behind the estimation of the mechanical properties is explained in detail in Section 2.1.
Figure 1.8. Schematics of indenter penetration and residual impression
The instrumented indentation technique has been widely employed in the
characterization of energy storage materials for enabling the investigation a range of
deformation mechanisms and materials, and more specifically, being suitable to materials
of small characteristic size such as of micrometer size particles, thin films and even the SEI
layer, in the case of nanoindentation using atomic-force microscopy (AFM) [44].
Load
Indenter
Sample
Residual
impression
17
1.4 Thesis outline
The goal of this thesis is to develop high-throughput and in-situ experimental
techniques for mechanical characterization of electrode materials that will assist in
advancing the current understanding of the relationship between mechanical stability and
electrochemical performance of LIBs. The thesis structure is organized as follows. Section
2 describes in detail the mechanical characterization device used in this work and the theory
supporting the derivation of mechanical properties. Section 3 introduces a method for the
characterization of composite materials, so-called grid indentation. This method is applied
to a state-of-art cathode material and the results are validated against tests performed on
bulk materials. Finally, Section 4 presents a novel experimental platform for in-situ
mechanical characterization of Li-ion electrodes during lithiation. This technique is applied
for silicon electrodes and is validated against literature data.
18
2. INSTRUMENTED INDENTATION
The most common mechanical properties measured through nanoindentation are
the hardness and elastic modulus. The elastic modulus is an intrinsic material property
fundamentally related to atomic bonding. Hardness, however, is a specific engineering
measurement of a material’s resistance to localized deformation, and it gives an indication
of the strength of the indented material. In general, a simple relationship between hardness
𝐻 and yield strength 𝑌 for metals is given by [45]:
𝐻~3𝑌. (2.1)
The Keysight G200 nanoindenter is employed in this work. The head assembly of
this system is illustrated in Figure 2.1. In order to apply load to the sample, a magnetic field
is first generated by a varying electric current on the coil. This controlled magnetic field
interacts with the magnetic field of a permanent magnet, moving the indenter column up
and down. The displacement is continuously measured by a capacitive gauge. Ultimately,
each indentation generates a load-displacement curve that is used to calculate the
mechanical properties of the specimen.
19
Figure 2.1. Keysight XP nano-mechanical actuator and transducer.
Different tip geometries and sizes can be employed depending on the application.
The most common indenter geometries are illustrated in Figure 2.2, along with a list of
recommended applications by Keysight [46]. The Berkovich tip is ideal for most
applications. It can generate reliable data for most materials and it is suitable for indentation
tests ranging from nano- to microscale.
Figure 2.2. Most common tip geometries and corresponding applications.
Coil/permanent
magnet
Leaf spring
Capacitance
gauge
Indenter
20
2.1 Theory
This section covers the derivation of the elastic modulus and hardness from the
load-displacement curve. An example of a typical load-displacement curve along with the
main parameters used in the following calculations are presented in Figure 2.3a
The hardness is defined as the maximum applied load 𝑃𝑚𝑎𝑥 divided by the
corresponding contact area 𝐴.
𝐻 =𝑃𝑚𝑎𝑥
𝐴(ℎ𝑐). (2.2)
While 𝑃𝑚𝑎𝑥 is directly measured from the load-displacement curve (Figure 2.3a),
the contact area 𝐴 is calibrated empirically as a function of the contact depth ℎ𝑐 . The
calibration of the area function is covered in the Section 2.2.
The estimation of ℎ𝑐 is based on the assumption that contact periphery of the
indented area behaves as a rigid punch on a flat elastic half-space, sinking in during
penetration, as illustrated in Figure 2.3b [47]. Thus, the contact depth is given by the
displacement at maximum load ℎ𝑚𝑎𝑥 and the total amount of sink-in ℎ𝑠 = 𝜖𝑃𝑚𝑎𝑥/𝑆, where
ϵ is a constant that depends on the tip geometry - ϵ=0.75 for the Berkovich tip - and 𝑆 is
the slope of the unloading curve during indenter removal.
ℎ𝑐 = ℎ𝑚𝑎𝑥 − ℎ𝑠 (2.3)
Notice that not all materials behave this way. For ductile materials, instead of
sinking down, the surface around the indenter sometimes is squeezed out upwards around
the indenters. This effect is discussed in detail in Section 2.3.3.
21
Figure 2.3. (a) Schematic of the load-displacement curve. (b) Contact geometry
parameters [47].
In order to calculate the contact stiffness 𝑆, the upper portion of the unloading curve
is first fitted by the power-law relationship proposed by [47],
𝑃𝑓𝑖𝑡 = 𝐵(ℎ − ℎ𝑓)𝑚
, (2.4)
followed by analytical derivation of 𝑃𝑓𝑖𝑡 at the maximum load,
𝑆 =𝑑𝑃𝑓𝑖𝑡
𝑑ℎ|ℎ=ℎ𝑚𝑎𝑥
= 𝑚𝐵(ℎ𝑚𝑎𝑥 − ℎ𝑓)𝑚−1
. (2.5)
Finally, the elastic modulus 𝐸 is given by the contact mechanics expression for the
reduced modulus 𝐸𝑟, which takes into account the deformation of both indenter and sample.
1
𝐸𝑟=
1 − 𝑣2
𝐸+
(1 − 𝑣𝑖2)
𝐸𝑖. (2.6)
While the properties of the indenter (𝑣𝑖 ,𝐸𝑖), and the Poisson ratio 𝑣 of the sample
are known, 𝐸𝑟 is derived from the test data as follows
𝐸𝑟 =𝑆√𝜋
2𝛽√𝐴, (2.7)
ℎ𝑠 =𝜖𝑃𝑚𝑎𝑥
𝑆 𝑆 =
𝑑𝑃
𝑑ℎ ℎ=ℎ𝑚𝑎𝑥
22
where 𝛽 is a known dimensionless constant that depends on the geometry of the
indenter tip.
2.2 Area function calibration
The area function defines the relationship between the cross-sectional area of the
indenter to a distance of its tip. This function is calibrated empirically to account for non-
idealities on shape of the indenter. The mathematical form presented below is used in the
calibration for its ability to fit data over a wide range of indentation depths and a number
of indenter geometries [47].
𝐴(ℎ𝑐) = 𝐶0ℎ𝑐2 + ∑ 𝐶𝑖ℎ𝑐
1
2𝑖
𝑛
𝑖=0
. (2.8)
The coefficients 𝐶 and number of terms 𝑛 are selected to best fit the experimental
data of a standard material of known properties. For this work, the calibration is performed
on fused silica. The area function is fitted for a range of indentation depths as shown in
Figure 2.4, where each point corresponds to one indentation. The data shows an average
elastic modulus and hardness approximately constant over the depth range of 50 nm to
1900 nm, that match standard values for fused silica of 72.5 GPa and 9.95 GPa, respectively
[48]. The data scatter increases significantly for tests performed below 100 nm depth. Even
though data is more scattered at shallower indentations, 16 tests performed at 100nm still
display a reasonable estimate of the both modulus and hardness of 73.5 GP and 9.15 GPa,
respectively.
23
pile-
Figure 2.4. Area function calibration test on fused silica.
2.3 Sources of error
2.3.1 Creep
It is important to analyze the shape of load-displacement curves in order to verify
the deformation mechanisms. During unload, a viscoelastic material may display additional
penetration due to the continued creep, leading to a bowing out effect in the load-
displacement curve as shown in Figure 2.5 by Bushby et. al [49]. This behavior leads to an
overestimation of the elastic modulus, since it translates into an increased value of the
stiffness constant 𝑆. To prevent time-dependent behavior from interfering with calculations,
the material can be allowed time to creep prior to unload, by holding the peak load constant
for a sufficient period of time. The creep rate decreases with the hold time. According to
the International Organization for Standardization (ISO) 14577, the creep rate at the end of
0 400 800 1200 1600 20000
10
20
30
40
50
60
70
80
90
100
Modulus
Hardness
[GP
a]
Indentation depth [nm]
24
the hold period should be less the 1/10th the unloading rate. In order to determine if the
creep displacement is saturated during the peak hold, different hold times can be tested and
compared to confirm the same material response [50].
Figure 2.5. Solid line (no peak hold time) shows elbow in the unloading curve due to
continued creep. Dashed lines (120s and 240s peak hold time) with creep saturated during
the peak hold time [49].
2.3.2 Thermal drift
Another factor that can contribute to the variation of the penetration depth during
constant load is the drift due to thermal expansion. The drift can be minimized by placing
the equipment inside an enclosure that blocks air flow, however, it cannot completely
prevent it. Thus, it is necessary to perform a correction in the test data in order to account
for this effect. The drift correction procedure is explained in Figure 2.6 by Wheeler et al.
[51], which shows the tip displacement as a function of time. During unload, the load is
held constant at 10% of the peak load (solid line) for several seconds. The rate of change
of the indentation depth during the hold time is recorded (red dashed line), and the slope is
calculated and assumed to be constant throughout the entire test (green dashed line). The
25
raw displacement data (red dashed line) is then corrected with the calculated drift (blue
dashed line). The corresponding load-displacement curves before and after the drift
correction are shown in the inset figure.
Figure 2.6. Standard thermal drift correction procedure [51].
2.3.3 Pile-up
As described in Section 2.1 and Section 2.2, in instrumented indentation (depth-
sensing indentation), the contact depth ℎ𝑐 and contact area 𝐴 are estimated from the load
displacement curve via Equation (2.3) and Equation (2.8). In this approach, it is assumed
that the surface around the indenter sinks down during test. However, there are cases where
the periphery of the surface may pile up instead of sinking down. In those cases, if no
correction for pile-up is performed, the contact area is underestimated and, consequently,
the mechanical properties are overestimated.
26
Oliver et al. [47] found a simple quantity that can be used to assess whether or not
a material is likely to pile-up. This parameter is the ratio between the final depth of the
imprint after unloading ℎ𝑓 and the maximum indentation depth ℎ𝑚𝑎𝑥, which can be easily
extracted from the load-displacement curve. Pile-up is large only when ℎ𝑓/ℎ𝑚𝑎𝑥 is close
to 1 and the material is not expected to work harden during the indentation. For ℎ𝑓/ℎ𝑚𝑎𝑥<
0.7, very little pile-up or no pile-up is expected independently of the material work-
hardening behavior.
2.3.4 Substrate effect
Nanoindentation requires the user to specify either the maximum penetration depth,
or the maximum load for a given test. These two parameters are especially important for
the evaluation of structures of small characteristic size. For example, if the sample is a thin
film, it is imperative that the user selects a maximum indentation depth that is sufficiently
shallow to produce substrate independent measurements. In general, the maximum
penetration depth should be less than 10-25% the thin film thickness to avoid substrate
effects [52] [53] [54].
2.3.5 Surface roughness
The derivation of the mechanical properties from indentation test data is based on
the assumption of a flat surface and, therefore, the quality of a sample surface can interfere
with measurements. In a non-uniform contact, the indenter can either come into contact
with a peak or valley. Contact with a peak intensifies localized stress, leading to a larger
depth of penetration at a given load, consequently underestimating the hardness. The
27
contact with a valley leads to a higher contact area, smaller material deformation and as a
result, an overestimation of the mechanical properties [55]. The International Standard ISO
14577-4 recommends that the surface roughness should be less than 5% the maximum
penetration depth. However, studies have reported that repeatable and accurate
measurements can be obtained for samples exhibiting roughness values significantly higher
than 5% of the maximum indentation depth, as long as a sufficient number of indentations
are performed [56].
28
3. GRID INDENTATION OF COMPOSITE ELECTRODES
3.1 Introduction
Electrodes in commercial batteries are materials of high heterogeneity at the nano-
to microscale consisting of metal- or ceramic-like active materials, polymeric binders, and
porous carbon black conductive matrix. The constituents have a large difference in their
mechanical properties – the elastic modulus changes by 2-3 orders of magnitude for
instance. Determining the mechanical properties of individual phases in heterogeneous
structures is a challenge.
A common approach to obtain the properties of individual phases in a heterogeneous
material is performing selective indentation at the desired phase only. This process requires
careful selection of the indentation location and examination to ensure that results are not
affected by the surrounding medium [57]. A faster and more practical alternative is to use
the grid indentation technique followed by statistical deconvolution [58] [59].
Grid indentation relies on a massive array of nanoindentation and statistical
deconvolution of experimental data to extract the mechanical properties of individual
components. An illustration of a material composed of two phases of distinct properties is
shown in Figure 3.1a. Each triangle in the image corresponds to the imprint of one
indentation test. Provided that the indentation depth is much smaller than the characteristic
size of the two phases and the grid spacing is larger than the size of the indentation
29
impression, a large number of indentations on the sample surface probe the mechanical
properties of either phase with the probability that equals the surface fraction. Assuming
that the distribution of the mechanical property of each phase can be described by a
Gaussian distribution [60], grid indentation yields a multimodal probability function that
allows determination of properties of each phase, Figure 3.1b.
(a) (b)
Figure 3.1.(a) Schematic of grid indentation on a heterogeneous material. The red and
blue colors represent different phases, and the triangles represent individual indentation
sites. The indentation size is much smaller than the characteristic size of the phases and
the grid spacing is larger than the size of indentation impression. (b) Grid indentation
yields a multimodal probability function that allows determination of mechanical
properties of the constituent phases.
The grid indentation method was explored by Constantinides et al. [60] for the model
composite of titanium-titanium monoboride which set up guidelines for the application of
this technique. Ulm et al. [61] employed the grid indentation technique to separate the
intrinsic and the structural sources of anisotropy of hydrated particles in concrete, bone and
shale at different length scales. Furthermore, the authors advance the traditional statistical
(a) (b)
Measured property
Pro
babili
ty
Test data
Phase A
Phase B
(a) (b)
Measured property
Pro
babili
ty
Test data
Phase A
Phase B
30
analysis procedure to enable accessing packing density distributions in the addition to the
mechanical properties.
In the context of composite electrodes, the grid indentation method was far less
exploited. The main challenge in employing this technique in the evaluation of electrode
materials lies on the substantial difference in the mechanical properties of its constituents.
The combination of material phases of irregular shape, small characteristic size, and vastly
distinct properties makes it difficult to extract the properties of single constituents without
being affected by the surrounding medium.
Amanieu et al. [62] employs selective indentation followed by statistical
deconvolution to extract the properties of a LiMn2O4 cathode. The technique includes
performing grid indentation over the surface of the composite and then discarding
indentation tests that displayed mixed phase properties by identifying, through a novel
method, the composite behavior in the load-displacement curves. The method showed to
be more efficient to filter the single phase properties of a reference sample made of silica
and epoxy than for the commercial battery electrode due to the higher complexity of its
microstructure. The authors opt for embedding the sample in epoxy for mechanical stability
during polishing and indenting, therefore altering the properties of the porous matrix.
In this work, it is shown that an appropriate selection of the indentation depth, careful
sample preparation for high quality surface finish and application of a robust optimization
algorithm, makes it is possible to obtain reliable single phase properties from grid
indentation tests on composite electrodes. The grid indentation method is applied to a
model system of LiNi0.5Mn0.3Co0.2O2 (NMC 532) cathode for commercial batteries and
results are validated with selective indentation at individual material phases. The analysis
31
provides valuable insights on the advantages and limitations of the grid indentation method
in the evaluation of composite electrodes.
3.2 Overview of NMC cathode
Since its introduction in 1980, oxides compounds based on transition-metal
elements have been used as cathode materials in LIBs and its composition widely studied
for improved performance, safety and cost [63]. LiNixMnyCo1-x-yO2 (NMC) is a class of
cathode material attractive for the electric vehicle applications, that is gradually replacing
LiCoO2 in consumer batteries [64] [65]. NMC is comprised of alternating Li and transition-
metal layers where the composition of Ni, Mn, and Co and morphology can be tuned to
optimize performance in terms of capacity, cyclic rate, electrochemical stability, and
lifetime. Ni provides a higher specific energy while Mn improves thermal stability [66].
Furthermore, compounds containing large amounts of Ni, such as in LiNi1-xMnxO2, are
known to display low Li diffusivity, resulting in a low-rate cathode material. Adding Co
has proved to be effective to address this issue [65]. The NMC 532 has a well-balanced
ratio of Ni, Mn and Co that offers reasonably good thermal stability, high capacity, and
due to its lower content of Co compared to the LiCoO2 cathode, it allows for low and stable
pricing, while still maintaining the higher rate capability [63][66]. The NMC is current a
state-of-art material for LIBs, however, its mechanical properties have been widely
unknown [67] [68].
32
3.3 Material preparation and experimental details
3.3.1 Electrode processing
As-received LiNi0.5Mn0.3Co0.2O2 (NMC532, Toda America) powders,
polyvinylidene fluoride, (PVDF, Solvay, 5130), carbon black (CB, Denka, powder grade),
and N-methylpyrrolidone (NMP, Sigma Aldrich) were used to prepare the NMC cathodes
by slot-die coating. Sample composition consists of 90 wt% NMC532, 5 wt% PVDF, and
5 wt% CB. Detailed fabrication method can be found in reference [69]. The areal loading
of the NMC cathode is 12.5 mg/cm2 and as-prepared samples were not calendered.
3.3.2 Microstructure characteristics
The scanning electron microscopy (SEM) images of the NMC cathode is presented
in Figure 3.2. The electrode microstructure consists of nearly spherical NMC particles and
a porous matrix composed of a mixture of CB nanoparticles and PVDF binder. A magnified
view on a single NMC532 particle closely packed by primary particles is shown in Figure
3.2b. The particle size distribution obtained from approximate measurements on a
representative surface area of the electrode showed a significant variability in particle size,
ranging from approximately 2µm up to 14 µm. The electrode thickness (excluding the Al
current collector) ranges from 45 to 57 µm as shown in Figure 3.2c.
33
Figure 3.2. SEM images of the cathode electrode composed of NMC532 particles, PVDF
binders, and porous carbon black matrix. (a) Top view. (b) Magnified view on a single
NMC532 particle. (c) Cross-section view.
3.3.3 Surface preparation
The highly irregular surface of the sample required polishing in order to obtain a
smooth and flat surface suitable for indention tests. Polishing is challenging for porous
composites made of soft and hard phases; particle removal and material delamination from
aluminum foil are common problems. The following procedure showed the best results for
the NMC cathode. First, the samples are adhered to a glass slide using Crystalbond. The
polishing process starts with coarse polishing using a two-step diamond polishing. In the
34
first step, a 3 µm diamond paste is applied along with a microid diamond extender on
Ultrasilk cloth mounted to a polishing wheel and the sample is polished for approximately
1 to 3 minutes. The sample is then washed and, in the second polishing step, a 1 µm
diamond paste on Red felt cloth is used, applying the same polishing procedure. Most of
the particle surface is exposed during this coarse polishing as shown in Figure 3.3b. In the
final polishing step, 0.05 µm colloidal silica is applied on Imperial cloth and the sample is
polished from 2 to 5 hours on moderate pressure using an automatic head (Buehler
AutoMet 2000). The quality of the surface is evaluated on an optical microscope every 30
minutes. Once the surface is free of scratches and dark spots (Figure 3.3c), the sample is
rinsed and dried for mechanical measurements. As expected, the drying procedure did not
affect mechanical measurements; samples vacuum dried overnight at 90 °C or dried
manually with a wipe exhibited same mechanical properties. A SEM image of the sample
surface after final polishing is shown in Figure 3.4.
Figure 3.3. Surface preparation procedure. Optical images of the NMC surface (a) as-
coated, (b) after coarse polishing and (c) after fine polishing.
As-coated
(a)
Coarse polishing
(b)
Fine polishing
(c)
35
Figure 3.4. Close-up view of the polished surface of the NMC electrode.
3.3.4 Indentation test setup
The Keysight G200 nanoindenter was employed to measure the mechanical
properties of the electrode. Indentation tests were performed using Berkovich tip and at a
constant strain rate of 0.05 s-1. Poisson ratio of 0.3 and 5 s peak hold time were used.
Grid indentation technique is suited for composite electrodes as long as the
indentation depth is sufficiently small to probe the mechanical properties of an individual
material phase. The shallowest indentation depth allowed by our test equipment for high
precision measurements on a smooth surface is approximately 100 nm, as demonstrated in
Section 2.2. Experimental and modeling studies on thin films showed that a maximum
penetration depth of less than 10% the thickness of the thin film is generally sufficient to
avoid substrate effects, as discussed in Section 2.3.4. An analogy can be made of
indentations performed on composites to indentations performed on thin films [60]. Thus,
the characteristic sizes of a given material phase in the composite can be used to evaluate
whether or not measurements at a given indentation depth are likely to be significantly
affected by the surroundings. As verified by the SEM images presented in Section 3.3.2,
36
the particle size of NMC particles vary from 2 µm to 14 µm. Thus, one can expect that the
indentation depth of 100 nm will be sufficiently shallow to measure the mechanical
properties of NMC, without significant interference of the matrix properties. The
nanometer characteristic size of the CB agglomerates mixed in the PVDF binder makes
individual measurements unfeasible. Thus, the CB and PVDF mixture is regarded as a
single phase referred as CB/PVDF phase. Still, it is difficult to predict the accuracy in
which the grid indentation method is able capture the matrix properties due to its irregular
shape and non-uniform size; thus this metric can only be investigated through experimental
validation, as presented later in Section 3.6.
The spacing between the indents is set to 3-5 μm, which is more than 20 times the
maximum indentation depth, as recommended by the manufacturer in order to avoid
interference between indentations [48].
3.4 Statistical analysis
Given that the constituents possess distinct mechanical properties; grid indentation
yields a multimodal probability function that allows determination of each phase using
statistical analysis. An optimization algorithm can be used to fit a function the test data and
extract the properties of each material phase.
In order to select the function that can be used to describe the distribution of
mechanical measurements in a homogeneous material, consider the two sources of
variability in results: errors in experimental measurements and inhomogeneity in the
material properties.
37
In experimental measurements, systematic errors can appear as a result of bad
calibration or inappropriate experiment setup; significant systematic errors can be ruled-
out in our experiment given that all necessary measures of precaution are satisfied
regarding equipment calibration (Section 2.2) and requirements to avoid different sources
of errors (Section 2.3). Random errors are product of aleatory events, such as electronic
noise in signal processing or random changes in environmental conditions. These errors
are expected – it can be clearly seen from the area function calibration that random noises
arise at shallower indentations due to the increased sensitivity to the surface roughness and
limitations in the equipment displacement and load resolution.
Considering the material properties, in this case either CB/PVDF or NMC particles,
the possible sources of variability in its mechanical properties are also expected to be
random. In the NMC particle, it can be due to tests performed in randomly orientated
crystals, while in the matrix it can be due to variations in the concentrations of CB and
PVDF. Since the only substantial sources of variation in the measured properties are
expected to be random, for the sake of simplicity, it is satisfactory to assume that the
mechanical property distribution is approximately Gaussian.
Let x be the measured mechanical property – in this case, it is either elastic modulus
𝐸 or hardness 𝐻. Assuming that the mechanical property of each phase obey a Gaussian
distribution function, the theoretical cumulative distribution function 𝐶 𝑖 (CDF) of the i-th
phase is given by
2
22
0
1
2
i
i
ux
i
i
C x e du
,
(4.1)
where 𝜇𝑖 is the mean value and 𝜎𝑖 the standard deviation.
38
Let 𝑓𝑖 be the normalized surface fraction of the i-th phase with the condition
∑ 𝑓𝑖 = 1𝑛𝑖=1 , n the total number of phases and 𝐶 𝑒𝑥𝑝
the normalized cumulative distribution
of the experimental data. The unknowns {𝑓𝑖, 𝜇𝑖𝐸 , 𝜎𝑖
𝐸 , 𝜇𝑖𝐻, 𝜎𝑖
𝐻} are determined by minimizing
the difference between the experimental CDFs and the weighted modal-phase CDFs while
maintaining the same surface fraction 𝑓𝑖 in the elastic modulus and hardness CDFs,
2 2
1 1
minn n
E E H H
i i exp i i exp
i i
f C C f C C
.
(4.2)
Here 𝐶𝑒𝑥𝑝𝐸 and 𝐶𝑒𝑥𝑝
𝐻 correspond to the experimental cumulative distributions for
elastic modulus and hardness, respectively. The results of statistical deconvolution are
estimates of the mean and standard deviation of elastic modulus and hardness of each phase,
and surface fraction.
The fitting is additionally constrained by a moving boundary set at one standard
deviation distance from the mean value of each modal-phase, according to
𝜇𝑖 + 𝜎𝑖 < 𝜇𝑖+1 − 𝜎𝑖+1 , (4.3)
where 𝜇𝑖 < 𝜇𝑖+1. This constraint is set to prevent excessive overlapping between
Gaussian distributions.
The curve fitting is performed using the open source Matlab based genetic
optimization toolbox GOSET 2.6 available at [70]. The algorithm requires minimum input
from the user and is able to consistently converge to the global minimum as opposed to
local minimums. The optimization algorithm is set to generate 3000 different combinations
of individuals {𝑓𝑖 , 𝜇𝑖𝐸 , 𝜎𝑖
𝐸 , 𝜇𝑖𝐻, 𝜎𝑖
𝐻} and evaluate the fitness according to squared error
function in Equation (4.2). It then repeatedly modifies the population of individual
39
solutions based on the concept of natural selection to elect best individuals and use them
as parents to produce the next generation. A total of 150 iterations was sufficient to achieve
convergence. The fitting is insensitive to the initial guesses and consistently converges to
similar results.
3.5 Results of grid indentation
Impressions from indentation tests performed at 100 nm depth could not be detected
through SEM imaging; therefore, a small grid of 3 × 2 indentations is performed at deeper
penetration (200 nm) to visually demonstrate the grid indentation method on the NMC
cathode. The residual impressions of such test is indicated in Figure 3.5.
Figure 3.5. Example of a small indentation grid on NMC; imprints from indentations
performed at 200nm depth (the mechanical properties are obtained with an indentation
depth of 100 nm).
Figure 3.6 shows the distribution maps of elastic modulus and hardness generated
from 121 tests in a 33µm × 33µm area. An excellent match between the mechanical
properties and the phase distribution in the optical image is clearly seen – higher values are
shown on NMC particles (stiff and hard) and lower values in the CB/PVDF matrix
(compliant and soft). In addition, due to the small size of the particles embedded in the
40
matrix, a significant fraction of the data exhibit mixed properties of the particles and the
matrix. Such mixed regions are referred as interface, the third constituent phase of the
composite electrode in the light of the mechanical properties. The interface would exhibit
a large variation in elastic modulus and hardness within the limits of the properties of NMC
particles and CB/PVDF matrix. Figure 3.6b and Figure 3.6c enables an estimation of the
range of the mechanical properties for each phase. For example, the contours show that the
modulus of the particles are in between 120 and 160 GPa, while the modulus of the matrix
lies within 0.1 and 10 GPa.
(a) (b) (c)
Figure 3.6. (a) Optical image of a 33µm × 33µm area for grid indentation. Contour plot
of (b) elastic modulus and (c) hardness in the selected area.
The results of grid indentation tests are analyzed using the statistical procedure
described earlier in order to extract the mechanical properties of the NMC particles,
CB/PVDF matrix, and the interface. Figure 3.7a and Figure 3.7c shows the results of the
fitting of experimental CDFs of elastic modulus and hardness properties using a tri-modal
Gaussian distributions. The corresponding experimental PDFs using the same set of
parameters as in the CDFs fitting are presented in Figure 3.7b and Figure 3.7d. The
estimated elastic properties of the NMC 532 and CB/PVDF phases are, respectively, 123
Modulus [GPa]
X [m]
Y [
m
]
0 11 22 330
11
22
33
40
80
120
160Hardness [GPa]
Y [
m
]
X [m]0 11 22 33
0
11
22
33
3
6
9
Hardness [GPa]
Y [
m
]
X [m]0 11 22 33
0
11
22
33
10
20
30
40
50
60
41
GPa and 4.4 GPa. The PDFs of the hardness measurements displayed more well-defined
peaks as compared with measurements of the elastic modulus. Consequently, a better CDF
curve fitting is obtained for the hardness property. This is consistent with the work of
Randall et al. [59], which also found that the grid indentation method provides a better
estimation of the hardness than of the modulus. The estimated hardness of the NMC and
CB/PVDF phases are, respectively, 7.78 GPa and 0.13GPa. The grid indentation results
are validated in the next section.
Figure 3.7. (a) Cumulative probability of elastic modulus and tri-modal Gaussian fitting.
(b) Plots of probability distribution function using the same set of parameters in (a). (c)
Cumulative probability of hardness and tri-modal Gaussian fitting. (d) Plots of
probability distribution function using the same set of parameters in (c).
(a) (b)
(c) (d)
0 60 120 1800
0.2
0.4
0.6
0.8
1
Modulus [GPa]
Cu
mu
lative
pro
ba
bili
ty
Test data
Tri-modal Gaussian function
0 60 120 1800
0.04
0.08
0.12
Modulus [GPa]
Pro
ba
bili
ty
Test data
Particle: 123.02 20.00 GPa
Matrix: 4.40 2.00 GPa
Interface: 45.24 27.58 GPa
Tri-modal Gaussian function
0 5 10 150
0.2
0.4
0.6
0.8
1
Hardness [GPa]
Cu
mu
lative
pro
ba
bili
ty
Test data
Tri-modal Gaussian function
0 5 10 150
0.05
0.1
0.15
0.2
Hardness [GPa]
Pro
ba
bili
ty
Test data
Particle: 7.78 1.40 GPa
Matrix: 0.13 0.01 GPa
Interface: 1.44 1.42 GPa
Tri-modal Gaussian function 2
2
0
32
1
1
2
i
i
ux
i
i i
f e du
2
2
0
32
1
1
2
i
i
ux
i
i i
f e du
42
3.6 Validation through selective indentation
In order to validate grid indentation results, the mechanical properties of the NMC
active particles and the PVDF/CB are investigated through two different approaches. The
properties of the NMC phase are measured through indentation tests performed at the NMC
particles only, as shown in Figure 3.8. Only particles of diameter larger than 10 μm are
selected for this test in order to minimize the influence of the matrix properties. Tests are
performed at indentation depths ranging from 50 nm up to 400 nm so as to evaluate the
influence of the substrate - deeper indentations will be more influenced by the substrate
properties than shallower indentations. The indentation sites can be specified precisely as
a result of careful calibration of the stage XY coordinates relative to the optical microscope
and indenter. The accuracy of the indentation location was verified by analyzing the
impressions left from tests performed at deep indentations (400 nm penetration depth) as
shown in Figure 3.8.
Figure 3.8. Optical image of selective indentation impressions on NMC particles at
400nm maximum penetration
The selective indentation approach is not effective in the characterization of the
CB/PVDF phase; the irregular shape of the CB/PVDF phase makes it impossible to
20µm
43
distinguish if there is NMC particles buried only a few nanometers underneath the
CB/PVDF coating. As a result, in order to validate the matrix phase properties obtained by
grid indentation, samples composed of the only CB/PVDF were fabricated and tested.
These samples were prepared maintaining the same CB and PVDF weight ratios as in the
NMC electrode (Table 3.1).
Table 3.1. Sample composition
NMC [wt%] PVDF [wt%] CB [wt%]
NMC cathode 90 5 5
PVDF/CB sample 0 50 50
The mechanical property measurements on the matrix may be affected by its
porosity. Thus, the porosity, ε, was calibrated by measurements of weight, surface area,
and thickness of samples consisting of composite electrode and current collector by the
following equation:
𝜀 =𝑉𝑚 − 𝑉𝑡
𝑉𝑚
=𝐴𝑠ℎ𝑠 − (𝑤𝑠 − 𝐴𝑠ℎ𝐴𝑙𝜌𝐴𝑙) (
𝑓𝑁𝑀𝐶
𝜌𝑁𝑀𝐶+
𝑓𝑃𝑉𝐷𝐹
𝜌𝑃𝑉𝐷𝐹+
𝑓𝐶𝐵
𝜌𝐶𝐵)
𝐴𝑠ℎ𝑠, (4.4)
where the volume of the electrode (excluding the Al current collector) is 𝑉𝑚 = 𝐴𝑠ℎ𝑠, and
the theoretical volume of zero porosity is 𝑉𝑡 . 𝐴𝑠 is the surface area, ℎ𝐴𝑙 and ℎ𝑠 are the
thickness of the Al substrate and the electrode, respectively. 𝑤𝑠 represents the sample
weight and 𝑓 the weight fraction of individual components. The theoretical density (𝜌) of
NMC, CB, PVDF, and Al foil are, respectively, 4.77, 1.90, 1.76 and 2.70 mg/mm3.Table
3.2 lists the parameters used to calibrate the porosities of three samples of NMC electrode
and CB/PVDF. The average porosities are 61% for CB/PVDF and 56% for NMC cathode.
44
Table 3.2. Porosity calibration of CB/PVDF and NMC electrode samples
Sample CB/PVDF NMC electrode
1 2 3 1 2 3
𝐴𝑠 [mm2] 145.81 712.09 174.85 2886.65 1179.34 591.46
ℎ𝑠 [µm] 17.74 17.74 17.74 56.93 55.33 57.26
ℎ𝐴𝑙 [µm] 16.57 16.57 16.57 0.015 0.015 0.015
𝑤𝑠 [mg] 1.47 6.67 7.49 418.64 166.13 83.60
𝜀 [%] 61.39 63.71 57.95 55.32 55.86 57.15
The results of the characterization of the NMC 532 phase are first presented. Figure
3.9a shows the load-displacement curves from tests performed at different penetrations
displaying typical metal behavior. Load-displacement curves from tests performed at
400nm occasionally displayed small pop-in events during loading, suggesting that cracks
start to form beyond such indentation depth. Figure 3.9b shows the distribution of elastic
modulus and hardness at maximum indentation depths of 50, 100, and 150 nm. The test
data obey an approximately Gaussian distribution with relatively small deviation, which
suggests that the indentations are indeed performed within the particles. The measured
properties of the NMC particles are sensitive to the maximum indentation depth due to the
effect of particle microstructure at shallow indentation and the effect of surrounding
CB/PVDF medium at deep indentation. Figure 3.9c shows the dependence of the measured
modulus and hardness on the maximum indentation depth in the range of 50 nm to 420 nm.
The red spots indicate mean values and error bars indicate the corresponding standard
deviations. The region marked in the blue rectangles represents the optimum indentation
depth to measure the intrinsic properties of NMC particles. Results below 75 nm are likely
to be influenced by surface features of the particles and instrument precision limitations.
At the other end, indentations performed over 150 nm are more strongly affected by the
45
surrounding compliant medium, resulting in a gradually decreasing modulus and hardness
at larger indentation depth. The average values of elastic modulus and hardness are 138.73
GPa and 8.89 GPa, respectively, in the optimum window of indentation depth ranging from
75 nm to 150 nm.
Figure 3.9. Experimental results of selective indentation on NMC particles. (a) Typical
load-displacement curve of nanoindentation and (b) Indentation histograms of elastic
modulus and hardness for 50nm, 100nm and 150nm maximum indentation depth. (c)
Dependence of elastic modulus and hardness on the maximum indentation depth. The
blue rectangles mark the range in which the measured properties are less sensitive to the
effect of particle microstructure at shallow indentation and the effect of surrounding
medium at deep indentation.
(a) (b)
50nm 100nm 150nm
Pro
bab
ility
Modulus [GPa]
Pro
bab
ility
(c) Hardness [GPa]
0 100 200 300 400 50060
80
100
120
140
160
180
Mo
du
lus [G
Pa
]
Maximum depth [nm]0 100 200 300 400 500
4
6
8
10
12
Hard
ness [G
Pa]
Maximum depth [nm]
20 100 180 250/00
0.06
0.12
0.1850nm
Norm
aliz
ed f
requency
100 180 250/200
0.06
0.12
0.1850nm
Norm
aliz
ed f
requency
100 180 2500
0.06
0.12
0.18150nm
Norm
aliz
ed f
requency
5 10 15/00
0.06
0.12
0.18
Norm
aliz
ed f
requency
50nm
5 10 150
0.06
0.12
0.18150nm
Norm
aliz
ed f
requency
0 5 10 15/00
0.06
0.12
0.18N
orm
aliz
ed f
requency
50nm
0 150 300 4500
11
22
Displacement [nm]
Load [
mN
]
0 100 200 300 4000
5
10
15
20
Lo
ad
[m
N]
Indentation depth [nm]
hmax
= 400 nm
hmax
= 200 nm
hmax
= 150 nm
hmax
= 100 nm
(a) (b)
50nm 100nm 150nm
Pro
bab
ility
Modulus [GPa] P
rob
abili
ty
(c) Hardness [GPa]
0 100 200 300 400 50060
80
100
120
140
160
180
Modulu
s [G
Pa]
Maximum depth [nm]0 100 200 300 400 500
4
6
8
10
12
Hard
ness [G
Pa]
Maximum depth [nm]
20 100 180 250/00
0.06
0.12
0.1850nm
Norm
aliz
ed f
requency
100 180 250/200
0.06
0.12
0.1850nm
Norm
aliz
ed f
requency
100 180 2500
0.06
0.12
0.18150nm
Norm
aliz
ed f
requency
5 10 15/00
0.06
0.12
0.18
Norm
aliz
ed f
requency
50nm
5 10 150
0.06
0.12
0.18150nm
Norm
aliz
ed f
requency
0 5 10 15/00
0.06
0.12
0.18
Norm
aliz
ed f
requency
50nm
0 150 300 4500
11
22
Displacement [nm]
Load [
mN
]
46
Similar tests are performed on pure CB/PVDF samples to evaluate the mechanical
properties at various indentation depths. A total of 350 tests are carried out at different sites.
The maximum indentation depth should be chosen to avoid the effect of surface roughness
at shallow indentation and the effect of aluminum foil substrate at deep indentation. Figure
3.10 shows the elastic modulus and hardness for indentation tests ranging from 200 nm to
2200 nm depth. The mechanical properties are relatively insensitive to the indentation
depth and the average values of elastic modulus and hardness are 1.78 GPa and 0.043 GPa,
respectively. It is worth noting that the mechanical properties of the CB/PVDF samples
may vary with the porosity value – the tested samples have a porosity of 61%. One may
expect to obtain higher values of elastic modulus and hardness for samples of lower
porosity.
Figure 3.10. (a) elastic modulus and (b) hardness of CB/PVDF sample measured at
various indentation depths. The mechanical properties are relatively insensitive to the
effect of surface roughness at shallow indentation and the substrate effect at deep
indentation
0 500 1000 1500 2000 25000
0.5
1
1.5
2
2.5
3
Mo
du
lus [G
Pa
]
Maximum depth [nm]0 500 1000 1500 2000 2500
0
0.02
0.04
0.06
0.08
0.1
Hard
ness [G
Pa]
Maximum depth [nm]
1.78 ± 0.35 GPa
0.043 ± 0.01 GPa
(a) (b)
47
3.7 Discussion
Table 3.3. summarizes the surface fractions, mean and standard deviation of elastic
modulus and hardness obtained from the statistical analysis and its comparison with results
from selective indentation tests. The mechanical properties of the NMC particles
determined by grid indentation and selective indentation are in good agreement. For the
CB/PVDF matrix, however, grid indentation yields larger values of modulus and hardness
by a factor of 2~3. The more accurate estimation of the properties of the NMC phase as
compared to the estimation of the properties of the CB/PVDF phase was indeed expected;
the larger size and uniform spherical shape of the NMC particles enables more tests to
measure single phase properties, facilitating the statistical deconvolution process. The
difference found in the matrix properties is mostly due the high incidence of tests affected
by NMC particles buried underneath the surface of CB/PVDF coating. Overall, the slight
underestimation of the NMC properties and more substantial overestimation of the matrix
property indicate that the indentation depth employed is not able to completely eliminate
the substrate effect. However, this comparison may not be unreasonable given the
complexity of the microstructure and the large difference in the mechanical properties of
the material phases in the composite.
Table 3.3. Surface fractions, elastic modulus, and hardness of individual components
determined by grid indentation and selective indentation.
Material
Phase
Surface fraction [%] Modulus [GPa] ( 𝜇 ± 𝜎) Hardness [GPa] ( 𝜇
± 𝜎)
Grid Ind. Grid Ind. Sel. Ind. Grid Ind. Sel. Ind.
Particles 38.40 123.02 ± 20 138.73 ± 18.78 7.78 ± 1.40 8.89 ± 1.86
Matrix 15.64 4.40 ± 2 1.78 ± 0.35 0.13 ± 0.01 0.043 ± 0.01
Interface 45.96 45.24 ± 27.58 1.44 ± 1.42
48
3.8 Conclusions
The combinatory technique of grid indentation and statistical deconvolution
provides a fast and practical route to determine the mechanical properties of heterogeneous
materials that can feed the constitutive models of composite electrodes. Compared against
other methods such as selective indentations at targeted phases or fabrication of bulk
samples, the grid indentation method is far less labor intensive and it allows the
characterization of multiple materials at once with little post processing. However, special
attention should be paid to the ratio between indention depth and characteristic size of
constituents; accuracy of the fitting strongly depends on this factor. Overall, the grid
indentation technique coupled with statistical deconvolution serves as a valuable tool in
the characterization of mechanical behaviors of commercial electrodes as well as in the
design of high-performance rechargeable batteries.
49
4. IN-SITU NANOINDENTATION
4.1 The need of in-situ technique
The mechanical properties of active materials in LIBs vary significantly with Li
concentration [71] [72]. In high-capacity electrodes, such as Si anode and S cathode, Li
concentration varies substantially, inducing a dramatic change in the mechanical properties
of the lithiated phases [73] [74] [75]. The evolution of mechanical properties demonstrates
a transition from the brittle material to a highly ductile behavior in the course of lithiation.
The elastic modulus of graphite, for instance, changes by a factor of three during lithiation
[76] and the elastic modulus of LiMn2O4 cathode gradually increase from 87 GPa at 0%
SOC (pristine state) to 104 GPa at 100% SOC (fully lithiated state) [77].
Knowledge of the mechanical properties of active materials as a function of Li
concentration is critical in the development of reliable models of deformation and fracture
mechanics for Li-ion batteries. Also, the direct correlation between mechanical stability
and electrochemical performance provides valuable information for the rational design of
high-capacity electrodes.
Measuring the mechanical properties as a function of the state of charge is
challenging task for multiple reasons. For instance, the lithiated electrodes and electrolyte
in Li-ion cells are extremely sensitive to the environment; contamination can be induced
by traces of oxygen and moisture. In contact with water, LiPF6 salt in the electrolyte
50
decomposes and hydrolyzes to form HF. HF may react with the active material in the
positive electrode causing partial dissolution and forming more water molecules that
continues to decompose LiPF6 salt [78] [79]. Most mechanical testing facilities are,
however, open system with bare environment control. This lack of environmental control
induces a considerable scatter and inconsistencies in the data due to alterations in the
surface properties of the sample as well as in the electrochemical performance of the battery.
Therefore, an experimental platform that allows in-situ mechanical characterization of
electrode materials is urgently needed.
In-situ nanoindentation presents multiple challenges such as dealing with limited
indentation axis travel range, requiring an inert environment, dealing with volumetric
expansion, electrolyte evaporation and SEI layer, and finally, dealing with space
constraints - fluid cell design has to accommodate all crucial test components including
optics, indenter, electrodes, electrolyte, and potentiostat probes.
This section presents the development of an in-situ mechanical characterization
platform that overcomes all the practical issues mentioned earlier. First, the apparatus
design and implementation is presented. Then, the experimental procedure used to
characterize a silicon thin film as a function of the state of charge, including general
considerations regarding in-situ tests, is described. Finally, the test results are presented
and compared with literature data.
4.2 Materials and methods
In order to perform experiments under inert atmosphere, the indenter is placed
inside an Argon filled glovebox with controlled oxygen and water concentrations below
51
0.5 ppm. The Keysight G200 nanoindenter is employed for mechanical characterization
and the VersaSTAT 3 potentiostat for electrochemical analysis. All cables are potted to
connect with outside controller. A special three-electrode electrochemical cell is designed
to enable indentation and electrochemical analysis to take place simultaneously. The
experimental setup is summarized in Figure 4.1.
Figure 4.1. In-situ nanoindentation platform
The fluid cell is a key in the design of the in-situ platform. Figure 4.2 shows a
picture of the fluid cell containing the sample in the middle as the working electrode (green
clip), a lithium ribbon as the counter electrode (red clip) wrapped around the perimeter,
and a smaller lithium ribbon as the reference electrode (white clip). The equipment used in
this work has a maximum indenter travel distance (vertical direction) of only 1500 µm.
The sample height relative to the fluid cell can be adjusted to allow complete immersion
of the sample in the electrolyte, leaving a layer of approximately 800 µm over its surface.
The fluid cell has a fixed height relative to the stage and a flat surface below the tip travel
path, so that the indenter is allowed to travel safely when automatically exchanging to and
52
from microscope mode. Maintaining this capability is crucial in order to evaluate the
surface quality before tests and to select desired test locations with precision. The liquid
cell is connected to a potentiostat that charges or discharges the battery cell. The state of
charge is obtained by monitoring the lithiation capacity. Nanoindentation is continuously
performed on the surface of the working electrode simultaneously with lithiation or
delithiation.
Figure 4.2. Three electrode fluid cell showing the working electrode connected by copper
tape to the sample (green), counter electrode (red) to a long lithium ribbon, and reference
electrode (white) connected to short lithium ribbon.
The presence of the LiPF6-PC electrolyte did not influence measurements, as it can
be verified from tests performed for dry and wet amorphous silicon, Table 4.1.
Table 4.1. Comparison between tests performed on dry sample and completely immersed
sample.
Material # tests hmax [nm] Fluid Modulus [GPa] Hardness [GPa]
Amorphous
Silicon
9 100 Dry 92.19 7.65
9 100 LiPF6-PC 92.33 7.76
53
4.3 Preliminary results
4.3.1 Silicon overview
Silicon electrodes offer a chance for huge improvement in the capacity of current
anode materials. The practical specific capacity up to 3579 mAhg−1 of silicon compared to
372 mAhg−1 of graphite, represents an increase in Li storage per weight of nearly 10 times
[75]. This increase in Li storage comes at a cost of large volumetric changes of 280% upon
full lithiation. This volumetric change induces large stresses in the material, leading to
mechanical degradation and capacity loss. Mechanical degradation and the resultant
capacity fade in silicon limits its employment in high-performance rechargeable batteries.
As a result, numerous studies have been carried out in the past years with the goal of better
understanding the details of the lithiation behavior of Si [40] [74] [80] [81].
The mechanical properties of silicon vary substantially with the SOC. For
amorphous silicon, the elastic modulus range from 90 to 100 GPa and hardness from 5 to
10 GPa, while for fully lithiated silicon (Li~3.6Si), they range from 10 to 40 GPa for the
elastic modulus and from 1.3 GPa to 1.8 GPa for the hardness [35] [82] [83] [84].
Despite intensive investigation, most data available on the hardness and modulus
of lithiated silicon rely on ex-situ tests and provide the information only at a few Li
concentrations with significant scatter. The variation between reported measurements can
be attributed to differences in the experimental procedures employed. For example, one
study performs measurements after the sample has been removed from the coin cell [83],
while another performs perform measurement with the sample immersed in electrolyte,
however, the sample is too thin to avoid substrate effect [82]. The technique proposed in
this work allows for faster and more reliable data acquisition than the currently available
54
methods. The most relevant data in the literature are compared against the in-situ
measurements in this work.
4.3.2 Sample preparation
The Si thin-film electrode is prepared using a DC magnetron sputtering system. A
50 nm Ti thin film was first sputtered for 5 min from a Ti target (50.8 mm diameter) onto
a 175 μm thick glass substrate at 100 W power and at a pressure of 3 mTorr of argon. A
300 nm copper film was then deposited for 15 min from a Cu target (50.8 mm diameter)
on the Ti underlayer at 200 W power and at a pressure of 5 mTorr of argon. The Cu film
serves as the current collector, and the Ti underlayer is used to improve the adhesion
between the Cu film and the glass substrate. A 500 nm Si film was subsequently deposited
for 33 min from a Si target (50.8 mm diameter) at 100 W power and at a pressure of 5
mTorr of argon. Sample main dimensions are indicated in Figure 4.3.
Figure 4.3. Sample dimensions
4.3.3 Electrolyte
1M LiFP6-PC electrolyte is selected for this study. Depending on the electrolyte
and test time, solvent evaporation can considerably lower fluid level and change salt
concentration in the cell. LiFP6-PC has the advantage of being nonvolatile. Also, it offers
55
a low surface tension, which prevents capillarity from pulling fluid up into indenter column.
This eliminates the need for any special tip design, which could potentially interfere with
the load frame stiffness, reducing the maximum usable load.
4.3.4 Test setup
The cell is discharged at a constant current of 0.02 mA until the potential reaches
0.01 mV vs Li+/Li. Indentation tests are continuously performed throughout the discharge
process, resulting in a total of 227 data points. In addition, 16 indentations are performed
at open circuit (OC) before lithiation (pure silicon) and after full lithiation (~Li3.7Si). A
Berkovich tip is employed and indentations are performed at a maximum penetration depth
of 100 nm. Substrate properties are not expected to significantly influence results since the
maximum indentation depth selected corresponds to 20% the thickness of the thin film, as
discussed in Section 2.3.4. Tests are performed at a constant strain rate of 0.05 s-1 with a
peak hold time of 60 s to allow the material to creep before unloading. A constant Poisson
ratio of 0.22 is chosen for all tests.
4.3.5 Volume expansion due to lithiation
The transient nature of test itself is challenging to nanoindentation tests. During
lithiation, the silicon thin film will expand in the vertical direction, resulting in an
inaccurate measurement of the indentation depth that can potentially lead to an
overestimation of the mechanical properties. Nevertheless, drift caused by volumetric
expansion could, in theory, be eliminated or at least minimized by the thermal drift
correction. As explained in the nanoindentation chapter, thermal drift correction is applied
56
to account for thermal expansion and electronic drift. The longer the test, that is, the slower
the loading/unloading time, the more influence the drift has on the results. The drift in the
thickness of the sample is calculated considering a 370 % volume expansion at maximum
capacity of 3579 mAh/g. A one-dimensional expansion is expected for thin films - the
thickness varies with lithiation while the area parallel to the substrate is kept constant.
Hence, the volumetric expansion ratio is equal to the thickness expansion ratio. The linear
relationship between film thickness and consumed capacity is given by ℎ𝑓 = ℎ𝑖(1 + 2.7𝑧) ,
where 𝑧 is the capacity ratio and ℎ𝑓 and ℎ𝑖 are initial and final film thickness, respectively
[85] [86]. Hence, the drift rate sensed by the indenter during cell discharge (Si lithiation)
at constant current is given by:
Drift rate due to lithiation ≅2.7∗𝑧∗ℎ𝑖
𝑡, (5.1)
where 𝑡 is the total discharge time. Hence, the drift rate at a C-rate of 1/29 is
0.012 𝑛𝑚/𝑠. This value lies within the range of the drift rate measured in standard tests on
dry samples (0.1 - 0.005 nm/s). The drift rate is corrected by the procedure presented in
Section 2.3.2. The effectiveness of the correction depends on the drift rate being
approximately constant during the indentation.
4.3.6 Residual stress
The residual stress in the sample after lithiation is another factor to take into
consideration, which may affect indentation results. The film initially is likely stressed as
a result of the sputtering process. As lithium becomes to be inserted into the electrode, the
stress becomes compressive and keeps rising until it begins to flow plastically
57
approximately at a concentration of Li0.4Si [34]. Upon further lithiation, a continuous small
reduction in the stress is observed until it reaches a value of approximately 450 MPa at a
composition of Li3.75Si [34]. Residual stresses alone do not affect mechanical property
measurements from nanoindentation tests; however, it can facilitate pile up [87]. As
mentioned in Section 2.3.3, the Oliver and Phar method used to derive the mechanical
properties is based on the assumption that the material behaves like an elastic half space
penetrated by a rigid punch and, therefore, doesn’t account for pile up. If pile up takes place,
then the actual contact area will be bigger than the contact area estimated in Equation (2.8),
leading to an overestimation of the elastic modulus and hardness. Whether or not pile-up
is expected to take place is discussed later in Section 4.4 by analysis of the resulting load-
displacement curves.
4.3.7 SEI layer formation
SEI layer formation was investigated through AFM measurements by Yoon et al.
[88] for the same cell configuration used in the current study – amorphous silicon/LiPF6-
PC electrolyte/lithium metal. In the first discharge, the SEI layer growth becomes apparent
after 1 V. The average thickness by the end of the discharge (0.1V) ranges between 2 to 3
nm, as shown in Figure 4.4. This value is less than 4% the selected indentation depth of
100 nm and, therefore, the SEI layer should not to interfere significantly with
measurements. If thicker SEI layer was the case, then deeper indentations could be
employed to maintain the ratio between the SEI layer and indentation depth below 5%,
keeping the SEI layer properties interference negligible. The roughness is only increased
58
by 2 nm [88], corresponding to only 5% the maximum indentation depth, satisfying
recommendations by ISO 15477 covered in Section 2.3.5.
Figure 4.4. Thickness of SEI layer on silicon thin film as a function of equilibrium
potential for 1.2M LiPF6 in PC during the first two cycles [88].
4.4 Results and discussion
Mechanical and electrochemical analysis were performed simultaneously on a three
electrode cell configuration, composed of amorphous silicon and lithium metal, in a LiPF6-
PC electrolyte solution. The electrochemical profile for lithium insertion into amorphous
silicon during the first galvanostatic discharge is shown in Figure 4.5. The low C-rate of
approximately 1/29 should allow sufficient time for diffusive equilibrium across the film.
The specific capacity at the cut-off potential of 0.01 mV was 3469 mAh/g.
59
Figure 4.5. Electrochemical profile for lithium insertion into amorphous silicon (blue)
and constant discharge current (red).
Figure 4.6 shows the measured mechanical properties as a function of the state of
charge. Each point represents the result of one indentation test. It is noticeable that the
results are highly consistent, following a smooth trend without apparent discontinuities.
Pure lithium metal is softer than amorphous silicon, thus it was expected that both modulus
and hardness will decrease with lithium content. The results from tests performed during
galvanostatic discharge (red) and tests performed at open circuit (blue), at the beginning
and at the end of the discharge, are practically the same, indicating that the rate of volume
expansion was sufficiently low in order to not affect measurements. Figure 4.6a shows that
the elastic modulus decreases linearly with capacity. This elastic softing is explained by
considering the the charge-density and atomic bonding in lithiated alloys as predicted by
DFT (density functional theory) calculations in the work of Shenoy et al. (2010). In Figure
0 6 12 18 24
0.0
0.5
1.0
1.5
2.0
2.5
3.0
Potential
Po
tential vs L
i+/L
i [V]
Time [h]
0 800 1600 2400 3200
|Capacity| [mAh/g]
0
10
20
30
40
Current
|Curr
ent| [µ
A]
60
4.6b, the hardness drops more steeply from pure silicon up to a Li concentration
approximately equal to the Si concentration (LiSi), followed by a gradual decrease for
further lithium insertion up to ~Li3.7Si. The R-squared value indicates the quality of the fit,
where R2=1 represents a perfect fit. The fitted functions of the hardness and modulus (y=
H(x) and E(x)) are given on the left-lower corner of Figure 4.6a and Figure 4.6b,
respectively. This functions can be implemented in constitutive models in order to generate
realistic predictions of mechanical behaviors in real silicon electrodes
Figure 4.6. Nanoindentation tests performed during discharge (red) and during OC (blue).
(a) elastic modulus and (b) hardness as a function of the capacity.
The elastic modulus was calculated assuming a constant Poisson ratio
corresponding to the value of amorphous silicon (𝑣=0.22). First-principles DFT studies
have found evidence that the Poisson ratio is either independent [76] or fluctuates very
little with Li concentration [75]. Other studies assume that the Poisson ratio obeys the
general rule of mixture: 𝑣(𝑥𝐿𝑖) = 𝑣ℎ𝑜𝑠𝑡 ∗ (1 − 𝑥𝐿𝑖) + 𝑣𝐿𝑖 ∗ 𝑥𝐿𝑖, where 𝑣 and 𝑥 are,
0.0 0.6 1.2 1.8 2.4 3.0 3.6
40
60
80
100
37.46
92.26 C/29
OC
Linear Fit
LixSi
Mo
du
lus [G
Pa
]
y = - 16.05x + 94.41
R2 = 0.9709
0 800 1600 2400 3200Capacity [mAh/g]
0.0 0.6 1.2 1.8 2.4 3.0 3.60
2
4
6
8 C/29
OC
Polynomial Fit
LixSi
Ha
rdn
ess [G
Pa
]
y = 0.10x4 - 1.04x3 + 3.81x2 - 6.37 + 6.83
R2 = 0.9711
0 800 1600 2400 3200
1.40
7.21
Capacity [mAh/g]
(a) (b)
61
respectively, the Poisson ratio and the fraction of atoms [35] [84]. The elastic property
measured by nanoindentation is not significantly affected by the estimated Poisson ratio.
This is verified by comparing results showed previously where the Poisson ratio is
considered to be constant (𝑣=0.22) versus calculations assuming a linear variation of 𝑣
between that of pure silicon (𝑣𝑆𝑖 = 0.22) and that of pure lithium (𝑣𝐿𝑖 = 0.36). The overall
difference in the elastic moduli calculated for both scenarios is not significant, as presented
in Figure 4.7.
Figure 4.7. Elastic modulus assuming constant Poisson ratio with lithiation (red) and
variable Poisson obeying the rule of mixtures (blue).
The load-displacement curves from tests performed at different ranges of the state-
of-charge (SOC) are grouped and presented in individual plots in Figure 4.8. It can be
observed that the load-displacement curves are fairly consistent within each range and do
not show any obvious sign of crack or creep. Notice that the maximum load drops by half
0 1 2 3
40
60
80
100 v = 0.22 to 0.28
v = 0.22
Modulu
s [G
Pa
]
LixSi
v: rule of mixtures v: constant
62
its value during the first 30% of the discharge (roughly from 2 mN to 1 mN), compared by
a drop of less than half its value during the rest of the 70% discharge. This explains the
steep drop in the hardness properties observed in Figure 4.5b during the same capacity
range, followed by a more gradual softening.
As covered in Section 2.3.3, the probability of pile-up can be estimated from the
ratio between final indentation depth and maximum indentation depth ( ℎ𝑓/ℎ𝑚𝑎𝑥) and the
tendency of the material of work harden. A strong indication that the material is not to
exhibit significant pile up is if ℎ𝑓/ℎ𝑚𝑎𝑥< 0.7, whether or not the material work hardens.
Looking at the load-displacement curves below, it is possible to see that the ℎ𝑓/ℎ𝑚𝑎𝑥 ratio
ranges from roughly 0.6 for tests on pure silicon up to roughly 0.7 for tests on fully lithiated
silicon. Thus, one should not expect errors associated with pile-up.
63
Figure 4.8. Batches of load-displacement curves obtained in different ranges of state-of-
charge.
Figure 4.9a and Figure 4.9b show the same test data, however as a function of
lithium fraction for comparison with theoretical and experimental literature data. The
lithium fraction is given by 𝑥/(𝑥 + 1) in LixSi. It can be observed that the modulus
0 20 40 60 80 100 120 1400.0
0.5
1.0
1.5
2.0
Lo
ad
[m
N]
Displacement into the surface [nm]
100-95%SOC
0 20 40 60 80 100 120 1400.0
0.5
1.0
1.5
2.085-80%SOC
Lo
ad
[m
N]
Displacement into the surface [nm]
0 20 40 60 80 100 120 1400.0
0.5
1.0
1.5
2.070-65%SOC
Lo
ad
[m
N]
Displacement into the surface [nm]
0 20 40 60 80 100 120 1400.0
0.5
1.0
1.5
2.0
Displacement into the surface [nm]
Lo
ad
[m
N]
40-35%SOC
0 20 40 60 80 100 120 1400.0
0.5
1.0
1.5
2.0
Displacement into the surface [nm]
Lo
ad
[m
N]
20-15%SOC
0 20 40 60 80 100 120 1400.0
0.5
1.0
1.5
2.0
Displacement into the surface [nm]
Lo
ad
[m
N]
5-0%SOC
64
decreases mildly with lithium fraction, up until the composition of 50% lithium. Further
lithiation leads to a slightly steeper decrease in the modulus properties and the properties
of lithium start to dominate over the properties of silicon. This behavior is similar to the
one observed by Berla et al. [84] shown in a black line. The hardness for pure amorphous
silicon, 7.21GPa, decreases linearly as function of lithium fraction, down to 1.4 GPa at
fully lithiated state (Li0.78Si0.22). Overall, our results are in reasonable agreement with
literature data [75] [83] [84], in addition to being more detailed and showing a more
consistent trend. Our approach also has the advantage of being high-throughput; in a single
batch, with no interruptions, hundreds of data points are acquired and an accurate and
continuous description of the mechanical properties dependence on lithium content can be
achieved with a curve fitting.
Figure 4.9. (c) Elastic modulus and (d) hardness as a function of Li fraction compared to
results by Shenoy et al., [75] Hertzberg et al. [83] and Berla et al. [84].
0.0 0.2 0.4 0.6 0.8 1.0
0
20
40
60
80
100
120
Vasconcelos et al
Berla et al
Hertzberg et al
Shenoy et al (DFT)
Li fraction
Modulu
s [G
Pa]
0.0 0.2 0.4 0.6 0.8 1.0
0
2
4
6
8
10
Vasconcelos et al
Berla et al
Hertzberg et al
Li fraction
Hard
ness [G
Pa]
(a) (b)
65
4.5 Summary
In summary, an in-situ mechanical characterization platform consisting of a
nanoindenter, a fluid cell, and a potentiostat are integrated inside a glovebox. The closed
system prevents contamination from air and moisture and does not require removing the
electrode from the fluid cell to perform indentation tests. In fact, indentation tests can be
performed during slow charging or discharging without compromising the accuracy of the
measurements. The fluid cell design allows full capability of the nanoindenter including
using the microscope to evaluate the sample surface before running tests. Preliminary
results are generated for silicon thin film. Overall the test data is highly consistent and it is
in agreement with literature data. Young’s modulus is found to decrease linearly with the
state-of-charge (LixSi), from 92.3 GPa at 0% SOC (Si) to 37.5 GPa at 100% SOC (Li3.7Si).
Hardness, on the other hand, decreases linearly with lithium fraction (Lix/(1+x)Si), obeying
the general rule of mixtures, from 7.21 GPa at 0% SOC to 1.40 GPa at 100% SOC. This
high-throughput approach allows testing hundreds of different Li concentrations
automatically. In conclusion, this real time electrochemical and mechanical
characterization enables practical and reliable quantitative analysis of electrochemically-
induced changes in the mechanical properties of electrode materials.
66
5. CONCLUSIONS AND OUTLOOK
This thesis presented two mechanical characterization techniques for LIBs that
allow for: (1) the characterization of multiple material phases in composite electrodes, and
(2) measurement of the mechanical property evolution with the state-of-charge. The main
conclusions are summarized below:
(1) Characterization of composite electrodes - the grid indentation technique coupled
with statistical deconvolution was employed to measure the mechanical properties
of individual constituents in a NMC cathode of high heterogeneity at the microscale.
The extracted elastic modulus and hardness of the NMC particles and the
surrounding CB/PVDF matrix are in good agreement with tests by selective
indentation. Therefore, this combinatory technique provides a practical and reliable
route to determine the mechanical properties of composite electrodes provided that
the indentation depth is carefully chosen.
(2) In-situ characterization - an in-situ nanoindentation platform was designed,
implemented and validated for simultaneous mechanical and electrochemical
characterization of electrode materials. The technique overcomes practical issues
related with environment requirements and instrument limitations, and enables
comprehensive and consistent data acquisition. A preliminary study on silicon thin
film was carried out to measure the mechanical properties dependence on lithium
67
concentration. Indentation tests performed during slow discharge are validated
against indentation tests at open circuit and literature data. This high-throughput
approach allows automatic characterization of hundreds of compositions across the
entire range of lithiation without interruptions. Therefore, the in-situ
nanoindentation technique serves as valuable tool in the characterization of
mechanical behaviors of energy materials, as well as in the design of high-
performance rechargeable batteries.
This thesis work focused on the development and validation of experimental tools
that aid comprehensive mechanical characterization of electrode materials. In a future
work, these tools will be employed in the rational design of electrode materials that mitigate
mechanical degradation induced by lithiation. The investigation will allow for tuning active
material composition to optimize performance in terms of capacity, cyclic rate,
electrochemical stability, and lifetime. More specifically, the in-situ nanoindentation setup
will be employed in the evaluation of mechanical properties of NMC electrodes as a
function of the state-of-charge and in the course of electrochemical cycles. Finally, the
relationship between mechanical property retention and capacity retention will be study in
NMC electrodes with different compositions of Ni, Mn, and Co.
68
LIST OF REFERENCES
[1] M. Winter and R. J. Brodd, "What Are Batteries, Fuel Cells, and
Supercapacitors?," Chemical Reviews, vol. 104, p. 4245−4269, 2004.
[2] J. Newman and K. E. Thomas-Alyea, Electrochemical Systems, Wiley-
Interscience, 2004.
[3] A. J. Bard and L. R. Faulkner, Electrochemical Methods: Fundamentals and
Applications, New York: Wiley, 2001.
[4] F. Scholz, "Thermodynamics of electrochemical reactions," in Electroanalytical
Methods, Springer Berlin Heidelberg, 2010, pp. 11-31.
[5] G. D. Short and E. Bishop, "Concentration Overpotentials on Antimony
Electrodes in Differential Electrolytic Potentiometry," Analytical Chemistry, vol.
37, no. 8, p. 962–967, 1965.
[6] G. G. Yadav, "Design and assembly of nanostructured complex metal oxide
materials for the construction of batteries and thermoelectric devices," Doctoral
dissertation, Purdue University, 2013.
[7] M. Ue, Y. Sasaki, Y. Tanaka and M. Morita, "Nonaqueous electrolytes with
advances in solvents," in Electrolytes for Lithium and Lithium-Ion Batteries,
Springer-Verlag New York, 2014, pp. 93-165.
[8] H. Zhao, S. -J. Park, F. Shi, Y. Fu, V. Battaglia, P. N. Ross and G. Liu,
"Propylene carbonate (PC)-based electrolytes with high coulombic efficiency for
lithium-ion batteries," Journal of The Electrochemical Society, vol. 161, no. 1, pp.
A194-A200, 2014.
[9] J. C. Burns, A. Kassam, N. N. Sinha, L. E. Downie, L. Solnickova, B. M. Way
and J. R. Dahn, "Predicting and extending the lifetime of Li-Ion batteries,"
Journal of The Electrochemical Society, vol. 160, no. 9, pp. A1451-A1456, 2013.
69
[10] T. Kawamura, S. Okadaa and J.-I. Yamaki, "Decomposition reaction of LiPF6-
based electrolytes," Journal of Power Sources, vol. 156, p. 547–554, 2006.
[11] S. S. Zhang, T. R. Jow, K. Amine and G. L. Henriksen, "LiPF6-EC-EMC
electrolyte for Li-ion battery," Journal of Power Sources, vol. 107, pp. 18-23,
2002.
[12] R. Petibon, L. Madec, D. W. Abarbanel and J. R. Dahn, "Effect of LiPF6
concentration in Li[Ni0.4Mn0.4Co0.2]O2/graphite pouch," Journal of Power
Sources, vol. 300, pp. 419-429, 2015.
[13] M. R. Palacin and A. de Guibert, "Why do batteries fail?," Science, vol. 351, no.
6273, p. 1253292, 2016.
[14] M. B. Pinson and M. Z. Bazant, "Theory of SEI formation in rechargeable
batteries: capacity fade, accelerated aging and lifetime prediction," Journal of The
Electrochemical Society, vol. 160, no. 2, pp. A243-A250, 2013.
[15] P. Verma, P. Maire and P. Novák, "A review of the features and analyses of the
solid electrolyte interphase in Li-ion batteries," Electrochimica Acta, vol. 55, pp.
6332-6341, 2010.
[16] D. P. Abraham (Ed.), "Diagnostic examination of Generation 2 lithium-ion cells
and assessment ofperformance degradation mechanisms," Argonne National
Laboratory, Oak Ridge, TN, Rep. ANL-05/21, Jul. 2005.
[17] I. Laresgoiti, S. Kabitz, M. Ecker and D. U. Sauer, "Modeling mechanical
degradation in lithium ion batteries during cycling: Solid electrolyte interphase
fracture," Journal of Power Sources, vol. 300, pp. 112-122, 2015.
[18] R. Xu and K. Zhao, "Mechanical interactions regulated kinetics and morphology
of composite electrodes in Li-ion batteries," Extreme Mechanics Letters, 2015.
[19] G. Ning, B. Haran and B. N. Popov, "Capacity fade study of lithium-ion batteries
cycled at high discharge rates," Journal of Power Sources, vol. 117, no. 1-2, pp.
160-169, 2003.
[20] K. Jalkanen, J. Karppinen, L. Skogström, T. Laurila, M. Nisula and K. Vuorilehto,
"Cycle aging of commercial NMC/graphite pouch cells at different temperatures,"
Applied Energy, vol. 154, p. 160–172, 2015.
[21] C. Birkl, "Degradation of lithium-ion batteries," Energy and Power Group,
University of Oxford, 3 February 2014. [Online]. Available:
http://epg.eng.ox.ac.uk/content/degradation-lithium-ion-batteries. [Accessed 6
May 2016].
70
[22] R. Hausbrand, G. Cherkashinin, H. Ehrenberg, M. Gröting, K. Albe, C. Hess and
W. Jaegermann, "Fundamental degradation mechanisms of layered oxide Li-ion
battery cathode materials: Methodology, insights and novel approaches,"
Materials Science and Engineering B, vol. 192, pp. 3-25, 2015.
[23] M. Ebner, F. Marone, M. Stampanoni and V. Wood, "Visualization and
Quantification of Electrochemical and Mechanical Degradation in Li Ion
Batteries," Science, vol. 342, pp. 716-720, 2013.
[24] D. Y. Wang, X. D. Wu, Z. X. Wang and L. Q. Chen, "Cracking causing cyclic
instability of LiFePO4 cathode material," Journal of Power Sources, vol. 140, no.
1, pp. 125-128, 2005.
[25] X. H. Liu, L. Zhong, S. Huang, S. X. Mao, T. Zhu and J. Y. Huang, "Size-
Dependent Fracture of Silicon Nanoparticles During Lithiation," ACS Nano, vol.
6, no. 2, p. 1522–1531, 2012.
[26] P. Barai, V. P. Schulz and P. P. Mukherjee, "Analysis of mechanical degradation
in lithium-ion battery electrodes," in The Electrochemical Society meeting,
Cancun, Mexico, October 5 - October 9, 2014, Paper 447 MA2014-02.
[27] D. Chen, Microscopic investigations of degradation in lithium-ion batteries, Dr.-
Ing. dissertation, Karlsruher Institut für Technologie, Karlsruher, Germany, 2012.
[28] A. Watanabe, M. Kinoshita, T. Hosokawa, K. Morigaki and K. Nakura, "Journal
of Power Sources," Capacity fading of LiAlyNi1-x-yCoxO2 cathode for lithium-ion
batteries during accelerated calendar and cycle life tests (effect of depth of
discharge in chargeedischarge cycling on the suppression of the micro-crack
generation of LiAlyNi1-x-yCoxO2 particle), vol. 260, pp. 50-56, 2014.
[29] X. H. Liu, Y. Liu, A. Kushima, S. Zhang, T. Zhu, J. Li and J. Y. Huang, "In Situ
TEM Experiments of Electrochemical Lithiation and Delithiation of Individual
Nanostructures," Advanced Energy Materials, vol. 2, p. 722–741, 2012.
[30] H. Sun, G. Xin, T. Hu, M. Yu, D. Shao, X. Sun and J. Lian, "High-rate lithiation-
induced reactivation of mesoporous hollow spheres for long-lived lithium-ion
batteries," Nature Communications, vol. 5, p. 4526, 2014.
[31] Toho Technologies., "Metrology Products," [Online]. Available:
http://www.tohotechnology.com/flx-series.php#Theory. [Accessed 7 June 2016].
[32] G. Janssena, M. Abdallab, F. van Keulenc, B. Pujadad and B. van Venrooy,
"Celebrating the 100th anniversary of the Stoney equation for film stress:
Developments from polycrystalline steel strips to single crystal silicon wafers,"
Thin Solid Films, vol. 517, no. 6, p. 1858–1867, 6 Mar 2009.
71
[33] S. P. V. Nadimpalli, R. Tripuraneni and V. A. Sethuraman, "Real-Time Stress
Measurements in Germanium Thin Film Electrodes during Electrochemical
Lithiation/Delithiation Cycling," Journal of The Electrochemical Society, vol.
162 , no. 14, pp. A2840-A2846, 2015.
[34] M. Pharr, Z. Suo and J. J. Vlassak, "Measurements of the Fracture Energy of
Lithiated Silicon Electrodes of Li-Ion Batteries," Nano Letters, vol. 13, p.
5570−5577, 2013.
[35] V. A. Sethuraman, M. J. Chon, M. Shimshak, N. Van Winkle and P. R. Guduru,
"In situ measurement of biaxial modulus of Si anode for Li-ion batteries,"
Electrochemistry Communications, vol. 12, p. 1614–1617, 2010.
[36] Materials Evaluation and Engineering , "Tension and compression testing,",
[Online]. Available: http://www.mee-inc.com/hamm/tension-and-compression-
testing/. [Accessed 8 June 2016].
[37] C. Peabody and C. B. Arnold, "The role of mechanically induced separator creep
in lithium-ion battery capacity fade," Journal of Power Sources, vol. 196, p.
8147–8153, 2011.
[38] J. Xu, B. Liu and D. Hu, "State of Charge Dependent Mechanical Integrity
Behavior of 18650 Lithium-ion Batteries," Scientific Reports, vol. 6, no. 21829 ,
2016.
[39] Y. Lu, Y. Ganesan and J. Lou, "A Multi-step Method for In Situ Mechanical
Characterization of 1-D Nanostructures Micromechanical Device," Experimental
Mechanics, vol. 50, p. 47–54, 2010.
[40] A. Kushima, J. Y. Huang and J. Li, "Quantitative Fracture Strength and Plasticity
Measurements of Lithiated Silicon Nanowires by In Situ TEM Tensile
Experiments," American Chemical Society Nano, vol. 6, no. 11, pp. 9425-9432,
2012.
[41] M. Z. Mughal, R. Moscatelli, H. -Y. Amanieu and M. Sebastiani, "Effect of
lithiation on micro-scale fracture toughness of LixMn2O4 cathode," Scripta
Materialia, vol. 116, pp. 62-66, 2016.
[42] M. Skrzypczak, C. Guerret-Piecourt, S. Bec, J.-L. Loubet and O. Guerret, "Use of
a nanoindentation fatigue test to characterize the ductile–brittle transition,"
Journal of the European Ceramic Society, vol. 29, no. 6, p. 1021–1028, 2009.
[43] H. Lu, B. Wang, J. Ma, G. Huang and H. Viswanathan, "Measurement of Creep
Compliance of Solid Polymers by Nanoindentation," Mechanics of Time-
Dependent Materials, vol. 7, no. 3, pp. 189-207, 2003.
72
[44] V. Kuznetsov, A. -H. Zinn, G. Zampardi, S. Borhani-Haghighi, F. La Mantia, A.
Ludwig, W. Schuhmann and E. Ventose, "Wet nanoindentation of the solid
electrolyte interphase on thin film," Applied Materials & Interfaces, vol. 7, pp.
23554-23563, 2015.
[45] D. Tabor, "A simple theory of static and dynamic hardness," Proceedings of The
Royal Society, vol. 192, no. 1029, pp. 247-274, 1947.
[46] Keysight Technologies, "How to Select the Correct Indenter Tip," 31 July 2014.
[Online]. Available: http://literature.cdn.keysight.com/litweb/pdf/5990-
4907EN.pdf?id=1791577. [Accessed 2016 June 2016].
[47] W. C. Oliver, "Measurement of hardness and elastic modulus by instrumented
indentation: Advances in understanding and refinements to methodology,"
Journal of Materials Research, vol. 19, no. 1, pp. 3-20, 2004.
[48] Keysight Technologies, "Keysight Nano Indenter G200 User's Guide," Santa
Rosa, CA, Rep. G2A-13192-1, Aug. 2014.
[49] A. Bushby, V. L. Ferguson and A. Boyde, "Nanoindentation of bone: Comparison
of specimens tested in liquid and embedded in polymethylmethacrylate," Journal
of Materials Research, vol. 19, no. 1, 2004.
[50] T. Chudoba and F. Richter, "Investigation of creep behaviour under load during
indentation experiments and its influence on hardness and modulus results,"
Surface and Coatings Technology, vol. 148, no. 2–3, p. 191–198, 2001.
[51] J. Wheeler, D. Armstrong, W. Heinz and R. Schwaiger, "High temperature
nanoindentation: The state of the art and future challenges," Current Opinion in
Solid State and Materials Science, vol. 19, pp. 354-366, 2015.
[52] A. C. Fischer-Cripps, Introduction to Contact Mechanics, New York: Springer,
2007.
[53] Standard Test Method for Vickers Hardness of Metallic Materials, West
Conshohocken, PA: American Society for Testing and Materials, 1987.
[54] K. Durst, M. Goken and H. Vehoff, "Finite element study for nanoindentation
measurements on two-phase materials," Journal of Materials Research, vol. 19,
no. 1, pp. 85-93, 2004.
[55] N. Conté and Anton Paar TriTec SA, "The Influence of Surface Roughness on
Instrumented Indentation Testing (IIT)," [Online]. Available: http://www.anton-
paar.com/?eID=documentsDownload&document=57427&L=23. [Accessed 30
June 2016].
73
[56] Keysight Technologies, "Indentation Rules of Thumb - Applications and Limits,"
31 July 2014. [Online]. Available:
http://literature.cdn.keysight.com/litweb/pdf/5990-5700EN.pdf?id=1888523.
[Accessed 4 April 2016].
[57] J. Nohava, P. Haušild, Š. Houdková and R. Enžl, "Comparison of Isolated
Indentation and Grid Indentation Methods for HVOF Sprayed Cermets," Journal
of Thermal Spray Technology, vol. 21, no. 3, pp. 651-658, 2012.
[58] J. Nohava, P. Hausild, N. X. Randall and G. Favaro, "Grid nanoindentation on
multiphase materials for mapping the mechanical properties of complex
microstructures," in IMEKO 2012 TC3, TC5 and TC22 Conferences, Metrology in
Modern Context, Pattaya, Chonburi, Thailand, 2010.
[59] N. X. Randall, M. Vandamme and F. -J. Ulm, "Nanoindentation analysis as a two-
dimensional tool for mapping the mechanical properties of complex surfaces,"
Journal of Materials Research, vol. 24, pp. 679-690, 2011.
[60] G. Constantinides, K. S. Ravi Chandran, F.-J. Ulm and K. J. Van Vliet, "Grid
indentation analysis of composite microstructure and mechanics: Principles and
validation," Materials Science and Engineering: A, vol. 430, no. 1-2, p. 189–202,
2006.
[61] F. -J. Ulm, M. Vandamme, C. Bobko and J. A. Ortega, "Statistical Indentation
Techniques for Hydrated Nanocomposites: Concrete, Bone, and Shale," Journal
of the American Ceramic Society, vol. 90, no. 9, p. 2677–2692, 2007 .
[62] Amanieu, H. -Y, D. Rosato, M. Sebastiani, F. Massimi and D. F. Lupascu,
"Mechanical property measurements of heterogeneous materials by selective
nanoindentation: Application to LiMn2O4 cathode," Materials Science &
Engineering A, vol. 593, p. 92–102, 2014.
[63] C. M. Julien, A. Mauger, K. Zaghib and H. Groult, "Comparative Issues of
Cathode Materials for Li-Ion Batteries," Inorganics, vol. 2, 2014, pp. 132-154.
[64] T. Ohzuku and Y. Makimura, "Layered lithium insertion material of
LiNi1/2Mn1/2O2 : A possible alternative to LiCoO2 for advanced lithium-ion
batteries," Chemistry Letters, vol. 30, no. 8, pp. 744-745, 2001.
[65] M. M. Doeff, "Battery Cathodes," in Batteries for Sustainability, Springer New
York, 2013, pp. 5-49.
74
[66] S. -M. Bak, E. Hu, Y. Zhou, X. Yu, S. D. Senanayake, S. -J Cho, K. -B. Kim, K.
Y. Chung, X. -Q. Yang and K. -W. Nam, "Structural Changes and Thermal
Stability of Charged LiNixMnyCozO2 Cathode Materials Studied by Combined In
Situ Time-Resolved XRD and Mass Spectroscopy," ACS Applied Materials and
Interfaces, vol. 6, no. 24, p. 22594–22601, 2014.
[67] J. Nanda, "Advances in Cathode Materials for High Energy Density Lithium-Ion
Batteries," in 229th The Electrochemical Society Meeting, San Diego, CA, May
29 – June 2, 2016, Paper 438 MA2016-01.
[68] D. Mohanty, K. Dahlberg, D. M. King, L. A. David, A. S. Sefat, D. L. Wood, C.
Daniel, S. Dhar, V. Mahajan, M. Lee and F. Albano, "Modification of Ni-Rich
FCG NMC and NCA Cathodes by Atomic Layer Deposition: Preventing Surface
Phase Transitions for High-Voltage Lithium-Ion Batteries," Scientific Reports,
vol. 6, p. 26532, 2016.
[69] J. Li, C. Daniel, S. An and D. Wood, "Evaluation residual moisture in lithium-ion
battery electrodes and its effect on electrode performance," MRS Advances, vol. 1,
no. 15, pp. 1029-1035, 2016.
[70] S. D. Sudhoff, "Genetic Optimization System Engineering Toolbox 2.6," 1
January 2014. [Online]. Available:
https://engineering.purdue.edu/ECE/Research/Areas/PEDS/go_system_engineerin
g_toolbox. [Accessed 6 December 2015].
[71] Y. Qi, L. G. Hector, C. James and K. J. Kima, "Lithium Concentration Dependent
Elastic Properties of Battery Electrode Materials from First Principles
Calculations," Journal of The Electrochemical Society, vol. 161, no. 11, pp.
F3010-F3018, 2014.
[72] J. G. Swallow, W. H. Woodford, F. P. McGrogan, N. Ferralis, Y. -M. Chiang and
J. Van Vliet, "Effect of Electrochemical Charging on Elastoplastic Properties and
Fracture Toughness of LiXCoO2," Journal of The Electrochemical Society, vol.
161, no. 11, pp. F3084-F3090, 2014.
[73] F. Fan, S. Huang, H. Yang, M. Raju, D. Datta, V. B. Shenoy, A. C. T. van Duin,
S. Zhang and T. Zhu, "Mechanical properties of amorphous LixSi alloys: a
reactive force field study," Modelling Simulation in Materials Science
Engineering, vol. 21, p. 074002, 2013.
[74] S. T. Boles, A. Sedlmayr, O. Kraft and R. Mönig, "In situ cycling and mechanical
testing of silicon nanowire anodes for lithium-ion battery applications," Applied
Physics Letters, vol. 100, p. 243901, 2012.
75
[75] V. B. Shenoy, P. Johari and Y. Qi, "Elastic softening of amorphous and crystalline
Li-Si phases with increasing Li concentration: A first-principle study," Journal of
Power Sources, vol. 195, pp. 6825-6830, 2010.
[76] Y. Qi, H. Guo, L. G. Hector and A. Timmons, "Threefold increase in the Young's
modulus of graphite negative electrode during lithium intercalation," Journal of
Electrochemical Society, vol. 157, no. 5, pp. A558-A566, 2010.
[77] H. -Y. Amanieu, M. Aramfard, D. Rosato, L. Batista, U. Rabe and D. Lupascu,
"Mechanical properties of commerical LixMn2O4 cathode under different states of
charge," Acta Materialia, vol. 89, pp. 153-162, 2015.
[78] M. Wohlfahrt-Mehren, C. Vogler and J. Garche, "Aging mechanisms of lithium
cathode materials," Journal of Power Sources, vol. 127, p. 58–64, 2004.
[79] N. Wu, B. Feng, D. Yang, J. Liu and W. Tian, "Study on Surface Corrosion
Behavior of Non-Charge-Discharge LiMn2O4 in LiPF6-based Electrolyte,"
International Journal of Electricalchemical Science, vol. 7, pp. 8299 - 8308 ,
2012.
[80] J. -H. Cho and S. T. Picraux, "Silicon nanowire degradation and stabilization
during lithium cycling by SEI layer formation," Nano Letters, vol. 14, no. 6, pp.
3088-3095, 2014.
[81] X. Wang, F. Fan, J. Wang, H. Wang, S. Tao, A. Yang, Y. Liu, H. B. Chew, S. X.
Mao, T. Zhu and S. Xia, "High damage tolerance of electrochemically lithiated
silicon," Nature Communications, vol. 6, p. 8417, 2015.
[82] Q. P. McAlliester, K. E. Strawhecker, C. R. Becker and C. A. Lundgren, "In situ
atomic force microscopy nanoindentation of lithiated silicon nanopillars for
lithium ion batteries," Journal of Power Sources, vol. 257, pp. 380-387, 2014.
[83] B. Hertzberg, J. Benson and G. Yushin, "Ex-situ depth-sensing indentation
measurements of electrochemically produces Si-Li alloy films," Electrochemistry
Communications, vol. 13, pp. 818-821, 2011.
[84] L. A. Berla, S. W. Lee, Y. Cui and W. D. Nix, "Mechanical behavior of
electrochemically lithiation silicon," Journal of Power Sources, vol. 273, pp. 41-
51, 2015.
[85] V. A. Sethuraman, M. J. Chon, M. Shimshak, V. Srinivasan and P. R. Guduru, "In
Situ Measurements of Stress Evolution in Silicon Thin Films During
Electrochemical Lithiation and Delithiation," Journal of Power Sources, vol. 195,
no. 15, pp. 5062-5066, 2010.
76
[86] S. P. V. Nadimpalli, V. A. Sethuraman, G. Bucci, V. Srinivasan, A. F. Bower and
P. R. Guduru, "On plastic deformation and fracture in Si films during
electrochemical lithiation/delithiation cycling," Journal of the Electrochemical
Society, vol. 160, no. 10, pp. A1885-A1893, 2013.
[87] G. M. Pharr, T. Y. Tsui, A. Bolshakov and W. C. Oliver, "Effecs of residual stress
on the measurement of hardness and elastic modulus using nanoindention," in
MRS Proceedings, 1994.
[88] I. Yoon, D. P. Abraham, B. L. Lucht, A. F. Bower and P. R. Guduru, "In situ
measurement of solid electrolyte interphase evolution on silicon anodes using
atomic force microscopy," Advanced Energy Material, vol. 6, no. 12, p. 1600099,
2016.