+ All Categories
Home > Documents > I i, ^, ,, I - - A *. I' - The International Tropical Timber Organization … · 2014-05-09 ·...

I i, ^, ,, I - - A *. I' - The International Tropical Timber Organization … · 2014-05-09 ·...

Date post: 30-Apr-2019
Category:
Upload: vohanh
View: 217 times
Download: 0 times
Share this document with a friend
106
^., ,\ , , .. ^ ^ ., o a. ^. . . . I*'?<\ ^:. j^I ,^!; .g ,^ a ^ .O ^ . , . I^ , , .\ I, ;. .. ~ ,,, I ., I**t*. ,, , . .~ . 11 . \ , * . "A tl, 7'11, 41, I - - f I ^, ,, \ I' .^^ < ';. , ,. ,, , ~ i, *. . . I . * . , . ^ * -. ..,. ^, I- . .;. .^ . g
Transcript

^.,

,\ ,

,

..

^ ^ ., o

a.

^.

. ..

I*'?<

\^:.

j^I,^

!;

.g ,^ a ^.O

^ . , .

I^

,

, .\

I, ;.

.. ~

,,,

I .,

I**t*.

,,

,

..~

.11

.

\

,

*

.

"A

tl,7'

11,

41,

I - -

f I

^,

,,

\ I' .^

^<

';.

, ,.

,,

,

~

i,

*.

.

.

I.

*

.

,

.

^

* -. ..,.

^,

I-

.

.;.

.^

.

g

SELECTED STATISTICS OF THE WOODEN FURNITURE INDUSTRY,MALAYSIA (2008)

PD 192103 REV. 3 (M)

A. R. RohanaH. Norini

A. Nur FadhilahM. Noor Hazmira

*.., 11,111^*

,*. ^,^I '-' ,\ ^^;. '" ^'

'^, mySh, '

Forest Research Institute

Malaysia (FRIM).52109 Kepong. Selangor, Malaysia

^ I" !i^, ^^11 ^ ^ @ ^ ^^;

.

* ~'

I=== ~-." ^

International Tropical TimberOrganization (ITrO),Yokohama, Jepun

^

-..,

.

-:=== @Ministry of Natural Resources & Environment (NRE),

Wisma Sumber Asli, N0 25 Persiaran perdana.Precint 4,62574 Putrajaya, Malaysia

2009

.,

,,

@ Forest Research Institute Malaysia and International Tropical Timber Organization 2009

First Print 2009

All rights reserved. No part of this publication may be produced or transmitted or published in any form orby any means whatsoever, without permission from FRIM

Perpustakaan Negara Malaysia Cataloguing-in-Publication Data

Selected statistics of the wooden furniture industry, Malaysia (2008) IA. R. Rohana ... let al. l.

UTFO-PD 192103 rev, 3 (M))IsBN 978-967-5221-jot

I. Furniture--Malaysia--Statistics. I. A. R. Rohana.684,10409595

Copies available from:

(1) Director-General

Forest Research Institute Malaysia (FRIM)

Kepong

52/09 Selangor Darul Ehsan

Malaysia

Tel: 60362797000

Fax: 60362797878

http:// WWW. frim

(ii) Executive Director

International Tropical Timber Organization

International Organizations Centre, 5th Floor

Pacifio-Yokohama, 1-1-I, Minato Mire, Nishi-ku

Yokohama, 220-0012 JapanTel: 81 452231i. 1.0

Fax: 81 45223111i.

E-mail ito@ itto. or. ip

http: 11 ^^JP

ov. in

9^;; FRIM as a research institution, park^ging re^coneh and der^lopm^nt (R&D)findings for dissemination to clients is one of our objectives. Not only that, but R&Dfindings must include precise information and be disseminated effectiveIy throughpublications, conferences, dialogues, and the electronic media, That is the mainreason we decided to publish Selected Statistics of the Wooden Furniture Industry,MRInysin (2008). Above all, it is our sincere belief that, by sharing this vitalinformation, we are helping interested stakeholders learn more about the industry.But most important of all is that this book is a collection of information specificallyfocused on the wooden furniture industry in Malaysia. At this juncture, it is not anexaggeration to say that such a statistics book is the first of its kind ever published,

^I'OR^ORD

ie, looking at the wooden furniture industry at the national level in depth.

Selected Statistics of the Wooden Furniture 1/1dttstry, Malaysia (2008) is one of the seven outputs that theTechno-Economics research team published under project ITTO-FD 192103 rev. 3 (M). Gatheringinformation through a survey of 384 wooden Thins enabled the production of technical reports I and 11, aswell as the publication of this statistics book, a directory of the wooden furniture industry in Malaysia,and three associated manuals, namely, the rubberwood Resource Information System (RRIS), WoodenFurniture Intorination System (WFIS), and Comprehensive Information System (CIS). With regard to thisstatistics book, we foresee that it will help enlighten readers about the wooden furniture industry fromthe perspective of annual sales turnover, employment, export and import, investment, and consumptionof rubberwood and other species, The three computer programmes and their associated manualsmentioned above are related to databases concerning supply of and demand for rubberwood and adetailed database for the wooden furiviture industry. On the other hand, the directory is a handyreference for those stakeholders who want to know more about who is producing what, where themanufacturers are located, and how much they are producing. All in all, project ITTO-FD 192103 rev. 3(M) is indeed a comprehensive collection of information and statistics pertinent to the wooden furrrttureindustry in Malaysia. The statistics book may be reproduced with the collection of regular informationregarding existing and newly mills to be surveyed.

The publication of this statistics book would not have been possible without the full cooperation andsupport of two ministries, namely, the Ministry of Natural Resources and Environment (NRE) and theMintstry of Plantation Industries and Commodities (tvlPIC). We are also indebted to the followingcollaborating agencies: the Forestry Department Peninsular Malaysia (including the Headquarters, theState Forestry Departments, and District Forest Offices), the Satawak Timber Industry DevelopmentCorporation (STIDC), th^ Malaysian Timber Industry Board (MTIB), the Sabah Forest Department (SFD),the Malaysia -Furniture Entrepreneurs Association (A^IFEA), the Malaysia Furniture Industry Council(MFIC), Sabah Timber Industries Association (STIA) and the Sarawak Timber Association (STA). To allwooden furniture manufacturers, your participation and full cooperation are much appreciated.

Thank you all.

Dato' Dr. Abdul Latif Mohmod

Director-General

Forest Researchlnstittite Malaysia (ERIM)111

Selected Statistics of the Wooden Furniture Industry, Malaysia (2008), is one of the outputs of the projectInO-FD '92/03 rev. 3 (M), "A Comprehensive IntorinatiorL System for Sustainability of the WoodenFurniture Industry in Malaysia", which was funded by the International Tropical Timber Association(ITTO). Our deepest gratitude goes to ITTO for providing the funding and hence making the publicationof this statistics book a reality.

This statistics book contains various itformation on the wooden furniture industry in Malaysia includingdistribution of furniture mills by state, annual sales turnover, year of establishment, ownership, marketorientation, target market strategy, type of furniture, employment, total paid-up capital, projectsapproved by industry, investment, export, import and consumption. This book can be used as a referenceby consumers, producers, policy-makers and other interested stakeholders.

We also would like to thank the Director General, Forest Research Institute Malaysia (FRIM), Dato' DrAbdul Latif b. Mohmod, and the former Director General of FRIM, Dafuk Dr Abdul Razak b. Mohd An,for their ardent support towards publishing this statistics book

Our deepest appreciation goes to the members of the project techriical cornrnittee, namely the Mirtistry ofNatural Resources and Environment (NRE), Ministry of Plantation Industries & Commodities (KPPK),Peninsular Malaysia Forestry Department (IFSM), Malaysia Timber Industry Board (MrlB), SabahForestry Department (SFD), Sarawak Timber Industry Development Corporation (STIDC), MalaysiaFurritture Entrepreneurs Association (MFEA), Malaysian Furniture Industry Council (}\!IFIC), SabahTimber Industries Association (STIA) and Sarawak Timber Association (STA), for their great cooperationin this project.

We are grateful to all the staff members of the Research Management & Economics Division (FRIM)especially Research Management & Econoniics Division staffs for their immense cornrnitinerLt inimplementing this project. Lastly, we gratefulIy acknowledge the contributions of all individuals orparties who were directly or indirectly involved in the publication of this statistics book.

^,^;^01^-^I^I^G^-^E^'^S

A. R. Rohana

H. Norini

A. Nor Fadhilah

M. Noor Hazintra

V

CONTENTSKANDUNGAN

2.4Numbers of Workers for Managerial Workers & Professionals: Non- ProfessionalsCategoryBilangan Pekerja Bagi Kacegori Fengurusan SL Profesional; Bukan Profesional

Numbers of Workers for Technicians CategoryBilangan Pekerja BagiKategorijuruteknik

Numbers of Workers for Clerical Staff & Typists CategoryBilangan Pekerja BagiKaregoriKerani 6<1urutaip

Numbers of Workers for General Workers CategoryBilangan Pekerja Bagi Kategori Pekerja Am

Numbers of Workers for Direct Labour Force: Skilled CategoryBilangan Pekerja Bagi KategoriTenaga Keria Langsung: Mahir

Numbers of Workers for Direct Labour Force: Nori- Skilled CategoryBilangan Pekerja Bagi Kategori Tenaga Keria Langsung: Tidak Mahir

Numbers of Workers for Indirect Labour Force CategoryBilangan Pekerja Bagi Kategori Tenaga Pekerja Tmak Langsung

Category of Workers by StateKategori Pekerja Mengikut NegeTi

Category of Workers by NationalityKategori Pekerja Mengikut Kewarganegaraan

Category of Workers by GenderKaregori Pekerja Mengikutlantina

Nationality of Workers by GenderKewarganegaraan Peketja Mengikutjantina

Numbers of Trained WorkersBilangan Pekerja Tetlatih

Total Wages or Salaries for Total Workers per Month for Working Proprietors, ActiveBusiness Partners Category (RM)Iumlah Upah Arau Gait Pekerja Untuk Sebulan BagiKaregoTi Feinilik Syarikar, Rakan Niaga Aktif (RM)

Total Wages or Salaries for Total Workers per Month for Managerial Workers &Professionals: Professionals Category (RM)Iumlah Up ah Arau Gaji Pekerja Untuk Sebulan Bagi KategoriPengurusan SL Profusional: Profesional (RM)

Total Wages or Salaries for Total Workers per Month for Managerial Workers &Professionals: Non- Professionals Category (RM)Iumlah Up ah Atau Gaji Pekerja Untuk Sebulan Bagi Kategori Kategori Fengurusan 61. Profesional: BukanProfesional (RM)

Total Wages or Salaries for Total Workers per Month for Technicians Category (RM)Iumlah Upah Ainu GajiPekerja Untuk Sebulan BagiKategorijurureknik (RM)

Total Wages or Salaries for Total Workers per Month for Clerical Staff & TypistsCategory (RM)Iumlah Upah Atau Gall Pekerja Untuk Sebulan Bagi KategoriKerani&Jututaip (RM)

Total Wages or Salaries for Total Workers per Month for General Workers Category(RM)Iumlah Upah Atau Gaji Pekerja Untuk Sebulan Bagi Kategori Pekerja Am (RM)

2.5

2.6

2.7

2.8

2.9

2.10

2.11

2.12

2.13

2.14

2. I5

2.16

2.17

20

2.18

21

2.19

22

2.20

23

2.2I

24

25

26

27

28

29

30

31

X

32

33

34

35

36

37

2.22Total Wages or Salaries for Total Workers per Month for Direct Labour Force:Skilled Category (RM)Iumlah Up ah Atau Gait PekeTja Untuk Sebulan Bagi KategoriTenaga Pekerja Langsung: Berkemahitan (RM)

Total Wages or Salaries for Total Workers per Month for Direct Labour Force: Non-Skilled Category (RM)Iumlah Upah Atau Gaji Pekerja Untuk Sebulan Bagi KategoriTenaga Peketja Langsung: Tiada Kernahiran(RM)

Total Wages or Salaries for Total Workers per Month for Indirect Labour ForceCategory (RM)Iumlah Upah Atau Gaji Pekeija Unruk Sebulan Bagi KaregoriTenaga Rekerja Tidal: Langsung (RM)

Total Expenditures Spent on Training Programmes by State (RM)Iumlah Peruntukkan Perbelanjaan Program Latihan Mengikut Negeri (RM)

2.23

2.24

2.25

3

3. I

Investments/Pelaburan

Total Paid- Up Capital by State (RM' 000)Iumlah Modal Berbaya, Mengikur Negeri (RM' 000)

Projects Approved by Industry (RM' 000)Projek Dilulus Mengikur Indusrri (RM' 000)

Numbers of Approvals Granted for Establisment of Manufacturing Projects byIndustry (2002- 2006)Bilangan Penubuhan Projek Feinbuatan Mengikut Industti (2002-2006)

3.2

3.3

4

4.1

Exports/Eksport

National Major ExportsEksport Urnma Negara

Exports of Wooden Furniture From Malaysia to Major Destination (2000- 2007)Ekport Perabot Kayu Dari Malaysia ke Destinasi Utama (2000-2007)

Exports of Wooden Furniture by Type of FurnitureEkpott Petabot Kayu Mengikut lents Petabor

Exports of Wooden Furniture of the Kind Used in the Kitchen by CountryEksport Petabot Kayu Yang Digunakan Di Dapur Mengikut Negara

Exports of Wooden Furniture of the Kind Used in the Office by CountryEksporr Perabot Kayu Yang Digunakan Di Pejabat Mengikut Negara

Exports of Wooden Furniture of the Kind Used in the Bedroom by CountryEksport Perabot Kayu Yang Digunakan Di Dalam Billk Tidur Mengikut Negara

Exports of RubberwoodEksport Kayu Getah

4.2

4.3

38

4.4

4.5

39

4.6

40

4.7

41

43

45

46

47

49

XI

51

52

53

54

60

66

73

5

5.1

Imports/Import

Imports of Wooden Furniture of the Kind Used in the Kitchen by CountryImport Penbot Kayu Yang Digunakan di Dapur Mengikut Negara

Imports of Wooden Furniture of the Kind Used in the Office by CountryImport Perabor Kayu Yang Digunakan di Pejabar Mengikur Negata

Imports of Wooden Furniture of the Kind Used in the Bedroom by CountryImport Perabot Kayu Yang Digunakan di Daiam Bilik Mengikut Negara

5.2

5.3

6

6. I

Cons uin ption/Fenggunaan

Annual Consumption of Rubberwood Sawntimber Grade A (in'/year)Fenggunaan Kayu Getah Ored A Serahun (in'/tahun)

Annual Consumption of Rubberwood Sawntimber Grade B (in'/Year)Penggunaan Kayu Getah Gred B Setahun (in'/tahun)

Annual Consumption of Rubber^/o0d Sawntimber Grade C (myyear)Fenggunaan Kayu Getah Gred C Setahun (in'Itahun)

Annual Consumption of Rubberwood Sawntimber Grade D (in'/year)Fenggunaan Kayu Getah Gred D Setahun (in'Itahun)

Numbers of Wooden Furniture Mill Using Rubberwood as Raw MaterialBilangan Kilang Perabot Kayu Yang Menggunakan Kayu Getah Sebagai Bahan Meritah

Volumes of Rubberwood Logs Processed by Wooden Furniture Mill (my month)Feinprosesan Kayu Getah oreh Fengilang Perabot Kayu (in'foulan)

Rubberwood Installed Capacity of Wooden Furniture Mill (in a)Kapasiti Maksima Feinprosesan Getah 01eh Fengilang Perabor Kayu (in')

Consumption of Rubberwood (RMIm')Penggunaan Kayu Getah (RMIm')

Consumption of Other Species of Wooden Furniture Mill (in a)Fenggunaan Spesies Lain 01eh Fengilang Penbot Kayu (in')

6.2

6.3

6.4

6.5

6.6

6.7

6.8

6.9

75

77

References

79

81

85

87

88

89

90

91

92

XII

93

94

95

97,,

ABBREVIATION

FRIM

GPS

ITFO

JPSM

KPPK

MATRADE

MFEA

MFIC

MIDA

MTC

MTIB

SFD

SMIDEC

STA

STIA

STIDC

Forest Research Institute Malaysia

Global Positioning System

International Tropical Timber Organization

Forest Department Peninsular Malaysia

Ministry of Plantations Industries and Commodities

Malaysia External Trade Development Corporation

Malaysia Furniture Entrepreneur Association

Malaysian Furniture Industry Council

Malaysia Industrial Development Authority

Malaysian Timber Council

Malaysian Timber Industry Board

Sabah Forestry Department

Small and Medium Industries Development Corporation

Sarawak Timber Association

Sabah Timber Industry Association

Sarawak Timber Industrial Development Corporation

EXCHANGE RATES

UsD I = RMYear2000 3,8000

3.800020013,800020023.80002003

3.800020042005 3,7871

3,666320063.435720073,33122008

XIIl...

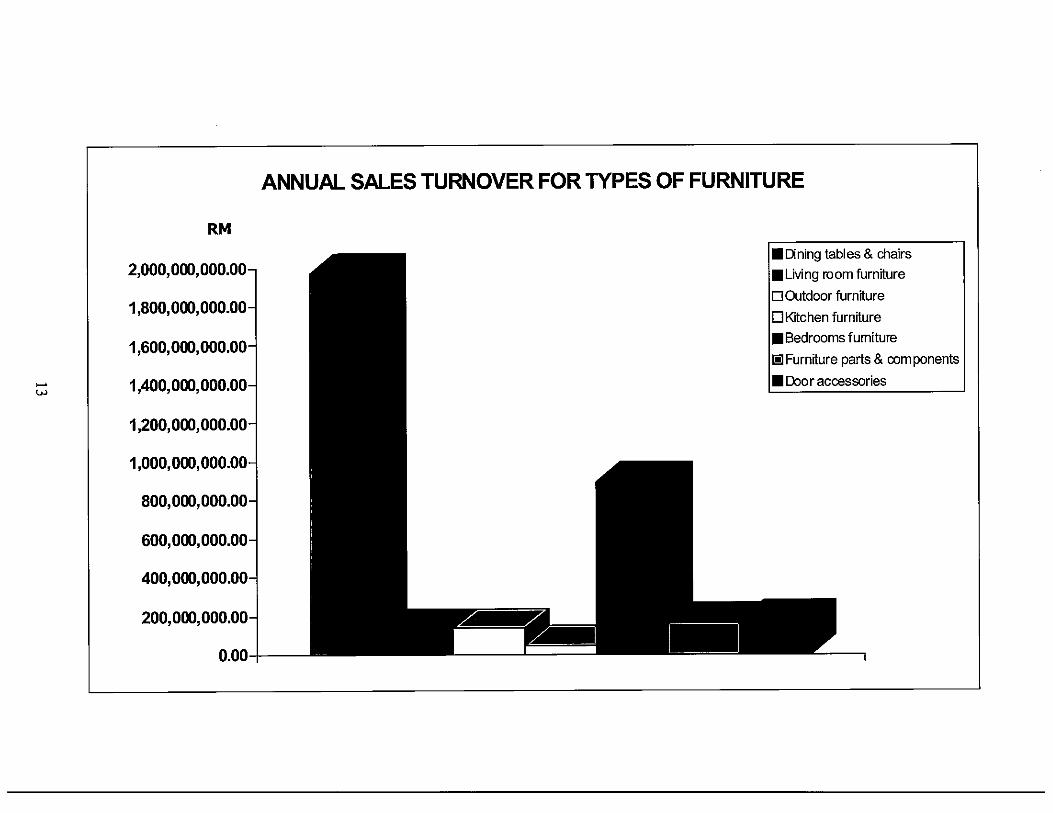
ANNUAL SALES TURNOVERPEROLEHAN IUALAN TAHUNAN

Table I shows the classification of wooden furniture industry by total workforce.ladual I menunjukkan klasifikasi industri petabot kayu mengikut jumla}I tenaga keria.

Table I 11adual I

Micro-Enterprise (Total Workforce < 5)

Small Enterprise ( Total Workforce 5 - 50)

Medium Enterprise ( Total Workforce 51 - 150)

Large Enterprise ( Total Workforce > 150)

Note: Classification is based on SMIDEC

Table 2 shows the classification of wooden furniture industry by annual sales turnoverladua12 menunjukkan klasifikasi industri petabot kayu mengikut perolehan jualan Labunan,

Micro-enterprise (sales turnover < I^. M250,000)

Small enterprise (sales minorerI^1250,000 - RMI0,000,000)

Medium enterprise (sales mmover RMI0,000,001 - an25,000,000)

Large enterprise (sales turnover >RM25,000,000)

Note: Classification is based on SMIDEC

Table 2I ladual Z

3

C

I .I DISTRIBUTION OF WOODEN FURNITURE MILL BY STATETABURAN KILANG PERABOT KAYU MENGIKUT NEGERl

State

Johore

Kedah

Kelantan

Micro-enterprise

Malacca

NegeriSembilan

Pahang

Penang

o

13

0.0%

27.1%

3

4>.

3

14.3%

o

38

6.5

Peruk

0.0%

o

68.8

16

Small enterprise

Selan gor

Terengganu

0.0%

2

12

76.2%

o

8.7%

o

26.1%

27

2

o. 0

Sabah

42

0.0%

56.3%

16

28.6%

6

22

43.8%

Sarawak

o

76.2%

7

26.1 o

47.8%

Total

1-0

0.0%

o

33.3%

2

33.3%

61

Medium enterprise

20.8

5

0.0%

o

28.6%

15

12

63.5%

o

28.8%

12

17

0.0%

522%

32.6%

o

3

4

o. 0%

57. %

21.8%

77 20.2%

39

0.0%

2

6.3%

3.3%

o

4.3%

9

Source: Actual survey, 2007

40.6%

5

8

9.5%

59

0.0

185 48.6%

Total wo, kfo, ce (based on SMIDEC classMcatibn)

3.9%

6.3%

9.1%

26.3%

38.1%

8

o

75.6%

33.3%

30

Annual sales turnover thesed on SMIDEC classification)

o

Large enterprise

66.7%

19

o

5

0.0%

3, .3%

0.0

o

8

53

21.7%

41.3%

0.0%

5

2

42.1%

0.0%

2

,81

7

67.9%

12

66.7%

10.4%

o

28.60

58.3%

10

3

6

47.5%

12.5%

6

4

0.0%

13.0%

85.7%

18

21, !!^,;

4.29

o

2

, 29 33.9%

21.1%

28.6%

5

2

28, ,00

o. 0%

5

o

Total

16.7%

71.4%

4

4

46

5.2%

3

9

0.0%

57.1%

**. -

' , >;,:*;;; $416: , ^*-f'^fin^";#*if P. .>'.'- . -.- - , ,

I ' I$* *.'!^~^,:s%,,.., . t .;**.;,- ~ *. - :.,,<$

o *' .o. 6^!^;'~ ,

8j ,,,,,,,,~ -*-,*

17.4%

7

48

12.1%

5.8%

42.9%$4a***

64

33.3%

3

9.0%

21

12.6%

8.3%

o

10

,6.8%

3.1%

21

0.0%

1.3%

5.5%

29 7.6%

52.6%

2

7

5.5%

16.7%

3

23

1.8%

, , 0-. - I It^^';!<#;**>;., t*I, ';::;I,\t*:*; in ;*i' * ;- t ;-I;*I*,, *.,, 4.3%

*-*^;;,:;$;'.;^;@^611"$' "', r' ,', *', *,~,*,

^;.j\;!.* Slit:?-r 4:1;

42.9%

3

6.0%

59

1.3%

96

0.8%

,5.5%

19

25.2%

'~ ~ 1:5^*,,'t38 .joto%

12

5.0%

7

3.1%

78

1.8%

38,

20.5%

, 00.0%

12 YEAR OF ESTABLISHMENT BY CLASSIFICATION OF MILLTAHUN PENUBUHAN MENGIKUTKLASIFIKASIPENGILANG

Year ofEstablishment

Before I 966

1966 ., 970

1971 ", 975

I976 - I 980

Micro-enterprise

4 '^-4, ***I

1981 - 1985

VB

6 46.2'I;$';^\"",'

1986 ., 990

6

1991 - 1995

"'4*,***.^^^;!14

1996 - 2000

^^,^^ by --**^^^^I ,^ ^^-,' I-,*{",~:"-I ' ". 4"~'~,.*~'I ^11

2001 - 2005

19.69,1.4;^$!;:;6. _^^;%;I 33 58.9%I;it$$j25:;;j^,:I 7 12.5%I*;^>;;;;$*5^-^;:I 5

Small enterprise

11

7

After 2005

""***^^^^*I '

12

16.9%

4

Total

I5.4% 1:<^*$:^!,^%^I 28 35.9% I^&j^;$^:I 16 20.57,11;#'^*&@';I 22 28.2% 1:46:1;;:^^;^%:-I 781,2<1$,^;^%11 32 49.2% ^'^6 $9;@^^I 10

5

30.8%

8

8.8% 13^1:16.49n 31 54.4% Ij^,$^'4^jj 10 17.5% In:it;\*,^!^^1:1 If 19.3% 1'1:1^, tit',,^j^^!, 57

". 4"*^^^^^^! ^ -^-4, ,-. *-,*,-I ,""$**,,,^;'I '

3 ''." I**^^;;I I6 55.2% &^^ 10 34.5% 11^j$$1^ o5

"?;,:',*.,*'

77

Medium enterprise

41.7%

Source: Actual survey, 2007

20.2% ' ,85tit .~ "

," fag

9 75.0%':

,.,-. A. ,^*,,, ,

Total workforce Ibased on SMIDEC classification)~

^-44*^*^^-I ^ ,^-^^ I--^^.^ -- - *~^,~^^,-I ,^

Annual sales turnover thesed on SMIDEC classification)

48.6%':A

6 50.0% I 2 16:7'% I

,^, ^^-^^^ ^I ^^ -^-^^ I^ ^

Large enterprise

,^,;a^***.*,.^*I ,^ ,^.^^^ I~,,^-*.*,,^t^^, I ,

14.3% I .. q*"' ' p;0%! 14

10.5% I ,',*, ',,.,,%., ''7.9% I' 3:1 " '.';7:9^'4:1 38

Total

8.3% : I. 8.3% O

'" I ' ;4. *\ i, ,,. 1% I 56' * ,;-- . ,. . I. -:* ' '

3.7%

3.4%

5.0%

lit, ,,,.,,,**,, ,'~ I-';t*{\. : '~"'"\*

10.0%

"44-*^,^I "

14.7%

,5.5%

17.1%

^:^$#,^;!am

20.5%

15.0%

7.6%

3.1%

t 00.0%

1.3 OWNERSHIPS BY CLASSIFICATION OF MILLPEMIUKAN MR. IGIKUTKLASIFIKASIPENGILANG

Ownership

Burniputra

Nori-Burniputra

Foreigner

Burniputra &nori-Burniputra

Micro-enterprise

7

Burniputra &foreigner

70

13.7%

O\

Non-Burniputra& foreigner

25.4%

o

Burniputra,non-Bumiputra &forei ner

o

0.0%

156

Total

o

o

0.0%

56

o

Small enterprise

o

0.0%

38

0.0

74.5% 0 -9. '% 4

133

0.0%

o

o

48.2% 8 - 30.8 43

77

o

0.0%

2

o

o

20.2%

Source: Actual sumoy, 2007

8.7%

3

0.0

30.0% -00% 3

o

Total workforce (based on SMIDEC classitcation)

o

Medium enterprise

Annual sales turnover (based on SMIDEC classification)

0.0V0 -^0 2

2 22.2% 7 8 4

3 30.0% 3 ^. 0 O

6

7.8% 2 9 2

,8.47.5% .. 9% 64

-^-^^- Bag ^- ---^^ i@ars ^8 ^^-^^^ .." ^ ^ ^^-^^ ER^^! ^

,..., .^!! ^ ^---^ a^ ..100.0% 0 00% O

Large enterprise

^-^^- ." ^ ^^-^^- Rag^

3.9% 5.9% 51

---^^ Ea - ----^^ ars ---^-^^ ^I ^^ -^-^^ I^81 ^^-

Total

0.0% I 50.0

13.4%

72.4%

6.0%

2

2.6%

9

0.5%

2.4%

2.6%

, 00.0%

IA STATUS OF THE COMPANIES BY CLASSIFICATION OF MILLSTATUS SYNUKATMENGIKUTKLASIFIKASIPENGILANG

Status of the

company

Individual

Partnership

Private limited

company

Public Imited

company

Micro-enterprise

64

Total

46.7%

8

\,

22.2%

5

16

o

2.6%

I

77

0.0%

42

75.0

20.2% t85

Source: Actual survey, 2007

Small enterprise

72

22.0%

@

Total workforce (based on SMIDEC classification)

52.6V0 ,6 I

25

Annual sales turnover (based on SMIDEC classification)

0.0%

69.47. 8 22.2% 3

84

48.6

^--^^ .!a ^^ ^--^^- ^ ^O 0.0% 5.9 2

-^- ^^-^^ ^ ^^ -^-^^^ .^a ^

Medium enterprise

0.7% 0 00 O

8.3% .8 O

11.8% 5 9 15

Large enterprise

0.0% 7 137

0.0% 0 0.0% 36

23.07. 26 3.6% 191

83.2% I .% 17

Total

, 5.5% 3.8

36.0%

10 O

9.4%

50.1%

38,

4.5%

I00.0%

1.5 TYPE OF MAIN PRODUCT BY CLASSIFICATION OF MILLIENIS PRODUKUTAMAMENGIKUTKLASIFIKASIPENGILANG

Type of main product

Dining tables & chairs

Living room furniture

Occasional furniture

Outdoor furniture

Upholstered Furniturewith Wooden Frame

Wooden office furniture

Micro-Enterprise

^ ^-^^,.^^!, ^ ^.^^^^ ^ ^^.^^^^. ^^.,^",^, ^

Wooden kitchenfurniture

, ,,-,^..^ ^ ^^-^^^^ , ,,-,^I^ ^ ^^-^^^I ^

Wooden bedroomfurniture

, ,.,^^ ,^ ^,.^^^ ^ ^^.^^^ ,

00

Wooden baby furniture

, .-,^ !,^ ^ ,^-^,^ ."^ ^ ^^-^^^ .^,^^^ ^ 00-,^ algaB ,^

Custom made furniture

- ---^a. " ^ ^^-^^."^ ^ ^^-^^@@ ^ ^^-^^^I^^ ^

Other products

, .-,^^ as^^ ^ ^^-^^^ "^^ ^ ^,-^^- a^^ ^ ,^.^^ ^a, ,I ,,

Furniture forboats &achts

^ ^^-^^^ a^"^ ^ ^^--^ a^ii ^ ^-^^- ars^ ^

Small Enterprise

Parts & components(including Ready-To-Assemble (RTA)furniture

^- ^^-^^^ a^^ ^- ^^-^^ ""!^ ^ ---^^ Egg ^, .-,^^ ^^^ , ,-,^- a^^ , co-.^^ Big^ , co-,^ &.^I^^! ^

Door & door frames

(including door forcupboards, cabinets,etc

^ ^^-^^^ s^g^^ ^ ^,-,^ .^a - ,^-^^^ Big^ ,^ ^, -^^ ^^^^ ^ ^, -,^ a^ ^ ^^-^^^ ^;^^ ^ ^, -^^ 13^^ ^. ,--^^^!"^ - ---^lagB - ---^""!^ - un--^@\ ,

Total

Medium Enterprise

o ..., jig - - ^- -^^ Bai - - ^ - - ^^ a ^ - ^ -^^ I*^&I19

Source: Actual survey, 2007

^---^^a ^ ^^-^^^alla ^ ^-^^a ^ ^-^^^an an. ^^ I^!^^, ,,, ,,-,,. , , ,,-,,, I, ,, ,, ,,.,, I, ,, am

Large Enterprise

Total workforce to ased on SMIDEC classification)

Annual sales turnover thesed on SMIDEC classification)

5.9% ,^.^^ I7

Total

,r, ;.,*"**"

.t, ~

9.2%

7.7% r 5. ~ 7. 't;'Z^ 65

2.4%

4.5%

o. 0% in^!; 7

4.2%

1.8%

3.79',

17.3%

17.1%

0.59'.

1.89,.

6.07.

0.3%

24 6.3%

95 24.9%

, 00.0%

1.6 MARKET ORIENTATION BY CLASSIFICATION OF MILLPENENTUAN PASARAN MENGIKUTKLASIFIKASIPENGILANG

Market Orientation

Local oriented market

Export oriented market

Mix oriented market

I00% local market

I00% export market

Micro-enterprise

^

o

Total

---^ ^!^aa ^ ^^-^^- ,:;BE ^ ^^-^^- lag ^ - - -^^- nag -^o ---^ 13^ ^ ---^^ Baa -^ ^--^^ !^ -^ ^^-^^ a^ ^- ---^I*#@ ^ ^^-^^-^^; - ^^-^^-^ - ---^-%a ^,^ ^^-,*^:its ,^^ ^, -^^- ^I ^, ^\- ^I ^ ,-^^- I^ ^

Ih,

' ',***,;a ' ""' " " """ " " ""' I^ '" ^,-^*^*;a -^- ------ I\^ ^ ,^-^^^ I^ ' ""' "" "'

Source: Actual survey, 2007

Small enterprise

I, ^ Annual sales turnover (based on sMjDEc classification)Total workforce (based on SMIDEC classification)

Medium enterprise Large enterprise Total

4.5%

9.7%

0.8%

68.0%

17.1%

100.0%

1.7 TARGET MARKET STRATEGIES BY CLASSIFICATION OF MILLSTMTEGiSASARAN PASA^N MENGiKUTIQ. ,AsiFiKAsiPENGiLANG

Target marketstrate

Products ecialization

Market specialization

Full market coverage

Product & market

specialization

Total

I-.

o

Micro-Enterprise

, - -^^^ 13^11E ^ - --^^ ."a , ^ ^^-^^ I^" ^ ^---^- i^:a ^^ ^^-^^^ a!^"" --^ ^^-^^ ^ -^ ^-^^- "" ^ ^-^^- BS^a -^

o

Source: Actual survey, 2007

^ ^^-^^^ ^^I^ ^ ^^-, ^ ^ ,^ ,^-^^ ..^I ^ ^\- lag^^$ , ^0.0%

^- ^"-^^ a^ -^- ^--^^ ^ ^ -^.^^- ^^^, ^ -^-^^ g^,^!a ^^-Total workforce (based on SMIDEC classification)

@

Small Enterprise

Annual sales turnover (based on SMIDEC classification)

o. 0 ^ ,^-^^^ ^I ,^ ^^-^^ ^ ,^ ^^-^^- ing ^

Medium Enterprise Large Enterprise Total

14.4%

43.3%

I0.2%

32.0%

, 00.0%

1.8 NUMBERS OF DESIGNERS BY CLASSIFICATION OF MILLBILANGAN PEREKA MENGIKUTKLASIFIKASIPENGILANG

Number of

designers in mill

No designer

I - 2 designers

3 - 4 designers

5 - 6 designers

64

Micro-enterprise

7 - 8 designers

-,

I-.

^^-^^- a^aa - ^^ ^--^^- .^a ^13

> 10 designers

- ^-^^ ^^all^I ^ ^^-^^^ a" ^o

Total

---^- iai^"^I ^ ^^-^^- .Ea - ---^- ^ ^-^^^ ^o ---^ \gag - ---^ nag ^ - ----^^ "^81 -o 0.0% 0 0.0

o

Small enterprise

77

---^^gag - ---^"a -

Source: Actual survey, 2007

^^-^^- I@^aji^I - ^- -^-^^" I^!"^, ^

Total workforce (based on SMIDEC classMcatibn)

Annual sales turnover (based on SMIDEC classification)

o

Medium enterprise

0.0% 0 0.0% O

13.5% 20

27.1%

7. o, 36

7 8.2% 16

Large enterprise

0.0%

I00.0%

12.8% I9

o

18.8% 14

,6.8% 29

0.0'o

o

54.5%

0.0%

6.8'

0.0%

4

Total

6. -

I00.0%

.6% 59

281

o

36.4%

o

0.07,

85

73.8%

o. 0%

, 5.5% 38

11

22.3%

00.0'

o

2

2.9%

0.00o

0.5%

10.0% 38, ,00.0%

0.3%

0.3%

1.9 TYPES OF FURNITURE PRODUCEDIENIS PERi\. BOT YANG DIHASILKAN

Type of furniture

Dining tables & chairs

Living room furniture

Outdoor furniture

Kitchen furniture

I-.

Bedrooms furniture

I\>

Furniture parts & components

Door accessories

Grand total

Source: Actual survey, 2007

Annual sales turnover (RMIyear)

1,972,652,455.00

134,242,931.00

I36,884,069.00

49,141,535.90

896,060,046.00

163,133,333.00

179,381,379.00

3,531,495,748.90

2,000,000,000.00

I-,

09

,, 800,000,000.00

RM

ANNUAL SALES TURNOVER FOR TYPES OF FURNITURE

1,600,000,000.00

1,400,000,000.00

,, 200,000,000.00

1,000,000,000.00

800,000,000.00

600,000,000.00

400,000,000.00

200,000,000.00

0.00

. Dining tables & chairs

. Living room furniture

.Outdoor furniture

.Kitchen furniture

. Bedrooms f urniture

^ Furniture parts & coin ponents. Door accessories

EMPLOY"E"TPEKERjAAN

2.1 NUMBERS OF WORKERS FOR WORKING PROPRIETORS, ACTIVE BUSINESS PARTNERS CATEGORYBILANGAN PEKERjA BAGI KILTEGORI PEMILIK SYARIKAT, RAKPLN NIAGA AKTIF

State

Johore

Kedah

Keiantan

Malacca

MaleBurniputra

Negeri Sembilan

4

Pahang

10

Malaysian

Female

Penang

10

2

Perak

5

o

Nori-Burniputra

Selangor

Male

3

2

Terengganu

63

2

3

Sabah

48

Female

o

o

Sarawak

23

9

9

2

21

Total

4

o

Foreigner

Male

o

9

2

Source: Actual survey, 2007

10

23

2

2

o

7

18

o

Female

o

123

o

6

73

o

o

24

9

5

Total

o

12

o

10

16

o

5

88

5

3

63

o

63

o

4.2

3

36

3

o

8

43

7

o

2

3

49

o

34

3

8

o

147

36

o

41

o

24

6

It

94

592

17

2.2 NUMBERS OF WORKERS FOR UNPAID FAMILY WORKERS CATEGORYBILANGAN PEKERJA BAGI KATEGORI AHLI KELUARGA YANG TIDAK DIBAYAR

State

Johore

Kedah

Keiantan

Malacca

MaleBurniputra

Negeri Sembilan

o

Pahang

o

Malaysian

Female

Penang

o

o

Perak

o

o

Selangor

Nori. BurniputraMale

o

o

Terengganu

2

o

o

Sabah

3

o

Female

o

Sarawak

o

2

o

Total

o

o

o

o

Foreigner

Male

o

o

o

o

Source: Actual survey, 2007

o

o

o

o

o

o

o

Female

o

o

o

4

o

o

o

o

o

o

Total

o

o

o

o

o

4

o

o

o

o

3

o

o

o

,I

o

o

o

o

o

o

o

o

6

o

o

o

o

o

5

o

o

o

o

o

2

18

18

2.3 NUMBERS OF WORKERS FOR MANAGERIAL WORKERS & PROFESSIONALS: PROFESSIONALS CATEGORY

BILANGAN PEKERlA BAGIKATEGORIPENGURUSAN DAN PROFESIONAL: PROFESIONAL

State

Johore

Kedah

Kelantan

Malacca

MaleBurniputra

Negeri Sembilan

67

Pahang

11

Malaysian

Female

Penang

4

11

Perak

18

Seiangor

Nori-BumiputraMale

2

2

114

Terengganu

5

20

Sabah

20

Female

o

Sarawak

26

2

75

o

75

Total

6

10

Foreigner

Male

11

9

4

o

22

Source: Actual survey, 2007

20

20

45

2

39

Female

10

2

o

o

49

178

4

2

19

61

o

28

Total

2

o

o

13

49

290

2

7

3

43

o

34

44

o

o

9

433

8

o

2

180

o

8

14

o

226

o

29

o

68

o

101

57

o

112

o

13

4

33

55

947

19

2.4 NUMBERS OF WORKERS FOR MANAGERIAL WORKERS & PROFESSIONALS: NON- PROFESSIONALSCATEGORY

BILANGAN PEKERjA BAGIKATEGORIPENGURUSAN DAN PROFESIONAL* BUKAN PROFESIONAL

State

Johore

Kedah

Kelantan

Malacca

MaleBurniputra

Negeri Sembilan

38

Pahang

Malaysian

Female

Penang

2

10

Perak

12

Non-Bumiputra

Seiangor

Male

2

2

84

Terengganu

2

3

10

Sabah

Female

8

o

Sarawak

44

2

o

12

13

Total

3

o

Foreigner

Male

10

5

o

Source: Actual survey, 2007

16

2

o

o

Female

2

4

2

o

7

10

o

96

102

o

o

o

Total

3

3

2

3

o

3

22

11

177

6

48

o

o

15

9

o

o

257

2

5

o

4

33

27

o

2

o

,

11

1.9

o

o

39

o

2

13

o

51

15

o

197

o

14

o

12

20

545

20

2.5 NUMBERS OF WORKERS FOR TECHNICIANS CATEGORYBILANGAN PEKERjA BAGIKATEGORIJURUTEKNIK

State

Johore

Kedah

Kelantan

Malacca

MaleBurniputra

Negeri Sembilan

182

Pahang

13

Malaysian

Female

Penang

7

8

Perak

41

o

Selangor

Nori-BurniputraMale

15

o

Terengganu

45

45

o

Sabah

11

Female

5

Sarawak

18

2

35

Total

45

o

o

Foreigner

Male

31

51

o

Source: Actual survey, 2007

o

3

19

13

o

2

o

32

Female

5

5

2

o

18

467

o

4

o

3

65

o

o

Total

26

2

o

2

15

240

6

2

o

3

15

o

24

o

o

249

8

o

o

49

79

o

o

78

o

17

2

75

o

3

10

o

93

39

o

164

o

55

o

17

52

84,

21

2.6 NUMBERS OF WORKERS FOR CLERICAL STAFF & TYPISTS CATEGORYBLANCAN PEKERlA BAGI KATEGORI KERANI DAN IURUTAIP

State

Johore

Kedah

Kelantan

Malacca

MaleBurniputra

Negeri Sembilan

96

Fahang

Malaysian

Female

6

Penang

139

2

Perak

10

22

Nori-Bumiputra

Selangor

Male

o

13

Terengganu

57

5

52

Sabah

11

Female

o

24

Sarawak

222

o

3

45

20

11

Total

53

Foreigner

Male

2

10

7

12

15

o

Source: Actual survey, 2007

8

66

o

64

o

Female

2

34

2

35

o

5

60

,45

50

o

10

o

Total

6

17

o

o

o

84

60

478

515

129

o

o

o

92

o

7

6

o

14

27

127

14

148

o

o

46

o

65

o

732

192

o

o

o

10

o

107

60

o

214

51

,6

64

73

1,558

22

2.7 NUMBERS OF WORKERS FOR GENERAL WORKERS CATEGORYBILANGAN PEKERjA BAGI KATEGORI PEKERjA AM

State

Johore

Kedah

Kelantan

Malacca

MaleBurniputra

Negeri Sembilan

95

Pahang

51

Malaysian

Female

Penang

3

30

Perak

83

53

Selangor

Nori-BumiputraMale

3

3

Terengganu

22

44

85

Sabah

23

35

Female

,I

Sarawak

70

o

10

3

18

Total

25

50

14

Foreigner

Male

248

3

29

o

Source: Actual survey, 2007

84

15

7

11

11

81

Female

35

o

23

o

90

o

25

699

20

462

4

17

o

Total

14

5

200

29

113

o

303

259

9

o

22

160

258

5

o

o

125

394

6

o

2

541

659

o

4

38

46

o

214

o

82

3

214

2

o

I, 53,

427

o

619

o

509

28

30

60

3, ,69

23

2.8 NUMBERS OF WORKERS FOR DIRECT LABOUR FORCE: SKILLED CATEGORYBILANGAN PEKERjA BAGI KATEGORI TENAGA KERIA LANGSUNO MAHIR

State

Johore

Kedah

Kelantan

Malacca

MaleBurniputra

Negeri Sembilan

885

Pahang

227

Malaysian

Female

Penang

144

207

Perak

63

471

Selangor

Nori-BumiputraMale

24

14

272

Terengganu

50

73

133

Sabah

Female

16

35

Sarawak

120

15

227

59

44

Total

82

16

Foreigner

5

Male

137

65

2,169

57

o

Source: Actual survey, 2007

55

91

18

62

429

296

Female

79

38

2

204

2, ,35

o

20

1,998

114

o

101

Total

3

463

16

o

45

784

3,761

516

4

106

o

127

976

15

o

o

186

I, ,28

170

1,738

o

2,196

o

18

640

o

491

134

701

16

61

103

o

7,576

613

12

2,236

25

155

,89

124

628

, 2,303

24

2.9 NUMBERS OF WORKERS FOR DIRECT LABOUR FORCE: NON- SKILLED CATEGORYBILANGAN PEKERjA BAG1 1<ATEGORI TENAGA KERIA LANGSUNG, TIDAK MAHIR

State

Johore

Kedah

Kelantan

Malacca

MaleBumiputra

Negeri Sembilan

452

Pahang

69

Malaysian

Female

Penang

27

313

Perak

61

45

Selangor

Nori-BurniputraMale

27

39

Terengganu

106

326

48

Sabah

13

Female

2

33

Sarawak

118

2

56

84

20

Total

46

8

o

Foreigner

Male

1/3

36

3,649

o

75

Source: Actual survey, 2007

218

15

18

27

367

1/6

Female

118

3

31

190

1,575

34

50

81

435

204

56

o

Total

o

74

369

75

o

41

I, 20,

4,626

195

8

7

98

502

52

o

o

o

243

102

576

o

22

1,579

358

o

o

583

25

o

442

109

82

698

129

o

5

6,903

667

47

1,888

6

244

192

839

377

I0,889

25

2.10 NUMBERS OF WORKERS FOR INDIRECT LABOUR FORCE CATEGORY

BILANGAN PEKERJA BAGI KATEGORI TENAGA PEKERjA TIDAK LANGSUNG

State

Johore

Kedah

Keiantan

Malacca

MaleBurniputra

224

Negeri Sembilan

Pahang

Malaysian

Female

8

Penang

14

76

Perak

10

20

Nori-BurniputraMale

Seiangor

o

o

53

Terengganu

6

3

16

Sabah

Female

o

o

Sarawak

3

8

8

7

8

22

13

Total

o

Foreigner

Male

153

o

o

4

304

Source: Actual survey, 2007

6

12

14

11

12

Female

o

17

o

37

23

39

o

474

o

41

87

o

Total

o

o

o

o

20

o

158

168

12

704

42

o

3

o

69

o

o

174

165

17

o

111

122

o

o

o

o

o

99

188

10

4

o

o

o

229

866

4

231

o

190

47

39

20

1,809

26

2.1 I CATEGORY OF WORKERS BY STATEKATEGORIPEKERjAMENGIKUTNEGERl

Category

Workingproprietors,active

business

armers

Johore Kedah

Unpaidfamilyworkers

Managementworkers &

professional :rofessionals

88

Kelantan

Managementworkers &

professional :nori-

rotsssiona!s

63

47

Malacca

290

b*,\I

3

36

Technicians

Clericalstaffs &

typists

NegeriSembilan

44

177

43

Generalworkers

240

15

8

Pahang

o

Direct labourforce : skilled

3

515

24

180

5

Penang

Direct labour

force : non.

skilled

259

34

o

92

3,761

8

27

Indirectlabour force

Perak

258

14

8

27

Total

4,626

Selangor

79

976

147

11

Source: Actual survey, 2007

29

6

148

704

502

I0,664

Terengganu

78

170

39

68

5

41

659

69

101

65

102

2,046

2,196

75

13

o

Sabah

46

17

24

192

358

15

112

10

380

640

Sarawak

82

122

11

39

10

197

583

3,812

701

Total

13

107

214

o

94

164

o

698

1,440

427

103

592

33

14

214

2

188

613

2,039

5

55

619

12

55

18

667

2,236

o

51

947

17

432

20

229

1,888

509

2,350

64

545

52

455

231

30

841

73

5,702

244

124

1,558

60

190

839

3,169

628

1,256

12,303

39

377

1,169

I0,889

20

1,381

1,809

32,671

2.12 CATEGORY OF WORKERS BY NATIONALITYKATEGORIPEKERjA MENGIKUT KEWARGANEGARAAN

Category

Working proprietors, activebusiness partners

Unpaid family workers

Management workers &professional : professionalsManagement workers &professional : non-professionals

Technicians

Clerical staffs & typists

General workers

Burniputra

Direct labour force : skilled

Malaysian

89

Direct labour force : nori-skilled

Indirect labour force

227

Nori. Burniputra

Total

118

461

482

Source: Actual survey, 2007

623

17

1,002

659

Foreigner

2,919

376

2,776

42

266

859

632

o

61

608

8,869

Total

1,619

51

592

1,018

93

18

264

76

t, 559

947

6,147

7,765

545

7,095

841

1,558

913

3,169

I7,655

12,303

10,889

1,809

32,67,

28

2.13 CATEGORY OF WORKERS BY GENDERKATEGORIPEKERlA MENGIKUTjANT!NA

CategoryWorking proprietors, activebusiness partners

Unpaid family workers

Management workers &professional : professionalsManagement workers &professional : non-professionals

Technicians

Clerical staffs & typists

,

General workers

Direct labour force : skilled

Male

Direct labour force : non-skilled

521

Indirect labour force

12

668

Total

404

Female

Source: Actual survey, 2007

809

332

71

2,624

6

I0,839

279

9,054

141

1,505

Total

32

1,226

592

26,768

545

48

1,464

947

1,835

545

841

304

1,558

5,903

3,169

12,303

I0,889

1,809

32,671

29

2.14 NATIONALITY OF WORKERS BY GENDERKEWARGANEGARAAN PEKERjA MENGIKUTjANTINA

Nationality

Malaysian

Bumiputra

Non-Burniputra

Foreigner

Total

Source: Actual survey, 2007

Male

5,843

3,752

17,173

Female

26,768

3,026

2,395

482

Total

5,903

8,869

6,147

17,655

32,671

30

2.15 NUMBERS OF TRAINED WORKERSBILA}. IGAN PEKERIATERLATIH

State

Johore

Kedah

Kelantan

On-the-jobtraining

Malacca

Negeri Sembilan

99^

2,338

Pahang

Vocational

training

497

Penang

45

Perak

10

959

Selangor

In-house trainingprogrammes

o

770

Terengganu

o

264

Sabah

1,126

o

Satawak

6

o

549

310

Industrial traininginstitute

Total

2,315

o

o

o

740

64

Source: Actual survey, 2007

115

o

160

175

Wood Industry SkillsDevelopment Centre

WISDEC

7

o

263

82

8,230

o

30

20

o

187

1,150

o

11

o

38

o

29

Others

2

137

14

2

5

15

504

3,971

3

273

Total

6

o

t20

3,615

o

130

1,080

2

3

8

764

5

47

2

1,831

o

2

956

18

o

349

26

28

38

74

771

o

4,007

2

175

549

439

272

I3,580

2.16 TOTAL WAGES OR SALARIES FOR TOTAL WORKERS PER MONTH FOR WORKING PROPRIETORS,ACTIVE BUSINESS PARTNERS CATEGORY (RM) 'IUMLAH UpAH ATAU GUI PEKERJA UNTUK SEBULAN BAGi KATEGORi PEMiLiK SYARiKAT, ERKAN NiAGA AKTIF(RM) '

State

Johore

Kedah

Kelantan

Malacca

Negeri Sembilan

Pahang

Penang

Male (RM)

Perak

468,881.40

Selangor

176,680.00

Terengganu

I09,533.00

Sabah

169,576.75

Sarawak

Female (RM)

16,100.00

124,400.00

Total

54,800.00

114,800.00

I 1,500.00

Source: Actual survey, 2007

422,617.00

3,500.00

1,009,500.00

27,712.75

57,400.00

Total'(RM)

0.00

25,350.00

523,681.40

58,000.00

194,279.00

188.1 80.00

I 1,000.00

2,921,767. , 5

I I3,033.00

39,583.33

I36,000.00

I97,289.50

16,100.00

3,500.00

149,750.00

13,000.00

125,800.00

26,000.00

462,200.33

35, ,946.08

1,145,500.00

60,900.00

71,000.00

220,279.00

3,273,7.3.23

32

2.17 TOTAL WAGES OR SALARIES FOR TOTAL WORKERS PER MONTH FOR MANAGERIALWORKERS & PROFESSIONAL: PROFESSIONAL CATEGORY (RM)IUMLAH UpAH ATAU CAIi PEKERjA UNTUK SEBULAN BAGi KATEooRi FENGURUSAN &.PROFESIONAL : PROFESIONAL (RM)

State

Johore

Kedah

Kelantan

Malacca

Negeri Sembilan

Pahang

Penang

Male (RM)

Perak

817,546.50

Selangor

94,075.00

Terengganu

15,000.00

Sabah

628,285.37

Sarawak

Female (RM)

66,800.00

227,229.00

120,000.00

Total

204,000.00

26,700.00

Source: Actual survey, 2007

164,467.00

3,000.00

259,941.50

198,064.35

48,522.00

Total (RM)

350.00

I, 044,775.50

85,000.00

4,790.00

93,350.00

93,300.00

120,775.00

2,593,987.37

36,033.33

18,000.00

I I 0,975.50

826,349.72

67,150.00

2,400.00

124,790.00

I7,500.00

297,300.00

I8,700.00

I97,500.33

739,042. , 8

370,917.00

50,922,00

102,500.00

112,050.00

3,333,029.55

33

2.18 TOTAL WAGES OR SALARIES FOR TOTAL WORKERS PER MONTH FOR MANAGERIAL WORKERS &PROFESSIONAL: NON- PROFESSIONAL CATEGORY (RM)IUMLAH UpAH ATAU ONI PEKERjA UNTUK SEBULAN BAGI KATEGORi FENGURUSAN 6, . PROFESIONAL , BUKANPROFESIONAL (RM)

State

Johore

Kedah

Kelantan

Malacca

Negeri Sembilan

Pahang

Penang

Male (RM)

Perak

322,250. , 5

Selangor

25,270.00

Terengganu

2,400.00

Sabah

49,647.46

Sarawak

Female (RM)

34,404.36

I I 3,720.00

Total

40,080,00

30,000.00

I0,500.00

Source: Actual survey, 2007

56,306.00

2,100.00

374,926.96

2,828.42

35,038.00

Total (RM)

9,155.77

435,970. , 5

33,000.00

43,500.00

72,900.00

35,770.00

6,000.00

, ,076,222.93

I 1,640.00

4,500.00

124,882.00

52,475.88

43,560.13

3.130.00

20,000.00

53,580.00

36,000.00

6,500.00

323,956. , 9

67,946.00

499,808.96

38,168.00

53,000.00

79,400.00

1,400, ,79.12

34

2.19 TOTAL WAGES OR SALARIES FOR TOTAL WORKERS PER MONTH FOR TECHNICIANS CATEGORY(RM)IUMLAH UpAH ATAU OAjl PERERlA UNTUK SEBULAN BAGI KATEGORljURUTEKNIK (RM)

State

Johore

Kedah

Kelantan

Malacca

Negeri Sembilan

Pahang

Penang

Male (RM)

Perak

387,914.39

Selangor

41,500.00

Terengganu

9,200.00

Sabah

130,934.28

Sarawak

207,053.08

Female (RM)

136,147.00

Total

20,320.00

17,532.56

Source: Actual survey, 2007

0.00

68,124.00

323,478.99

0.00

0.00

58,804.71

11,849.18

Total (RM)

408,234.39

24,000.00

5,000.00

41,500.00

67,900,00

1,472,589.01

0.00

9,200.00

3,000.00

130,934.28

8,900.00

218,902.26

3,465.00

441,147.00

0.00

17,532.56

2,650.00

71,24.00

55.1 84.18

332,378,99

62,269.71

24,000.00

70,550.00

1,527,773.19

35

2.20 TOTAL WAGES OR SALARIES FOR TOTAL WORKERS PER MONTH FOR CLERICAL STAFF &TYPISTS CATEGORY (RM)IUMLAH UpAH ATAU CAII PEKERJA UNTUK SEBULAN BAGI K, \. TBGORI KBRANl &. IURUTAIP (RM)

State

Johore

Kedah

Keiantan

Malacca

Negeri Sembilan

Pahang

Penang

Male (RMI

Perak

200,163.25

Selangor

30,320.00

Terengganu

1,800.00

Sabah

37,940.51

Sarawak

Female (RM)

53,950.98

455,983.01

Total

87,028.00

,"

84,288.00

Source: ACmal survey, 2007

2,750.00

17,295.00

15,566.88

136,894.29

56,703.90

89,856.80

10,415.00

Total (RM)

I01,660.00

656,146.26

I 14,608.00

0.00

9,440.00

9,050.00

119,539.13

506,078.52

19,095.00

, ,412,794.70

174,834.80

143,807.78

38,203.00

I88,688.00

40,900.00

55.1 00.00

I I, 800.00

2,56, ,563.93

I35, , 06.01

1,469,498.60

48,618.00

40,900.00

64,540.00

3,067,642.45

36

2.21 TOTAL WAGES OR SALARIES FOR TOTAL WORKERS PER MONTH FOR GENERAL WORKERSCATEGORY (RM)IUMLAH UpAH ATAU CAIl pEKERjA UNTUK SEBULAN BAGI KATEGORi pEKERjA AM (RM)

State

Johore

Kedah

Keiantan

Malacca

Negeri Sembilan

Pahang

Penang

Male (RM)

Perak

209,808.30

Selangor

78,900.00

Terengganu

1,450.00

Sabah

449,712.04

Sarawak

Female (RM)

45,407.00

Total

63,541.00

54,471.00

139,240.00

I04,000.00

Source: Actual survey, 2007

247,609.16

1,450.00

298,000.92

46,908.37

314,067.03

16,760.00

Total (RM)

273,349.30

I0,778.00

3,900.00

I82,900,00

27,928.00

I5,500.00

I, 870,493.45

I23,677.84

2,900,00

496,620.41

21,444.71

62.1 67.00

11,109.00

65,249.00

7,460.00

I54,740.00

8,646.00

371,287.00

431,274.92

319,445.63

325.1 76.03

I 1,360.00

36,574.00

2,301,768.37

37

2.22 TOTAL WAGES OR SALARIES FOR TOTAL WORKERS PER MONTH FOR DIRECTLABOUR FORCE: SKILLED CATEGORY (RM)IUMLAH Up AH ATAU ONi PEKERjA UNTUK SEBULAN BAGi KATEGORi TENAGA PEKERJALANGSUNG, BERKEMAHIRAN (RM)

State

Johore

Kedah

Kelantan

Malacca

Negeri Sembilan

Pahang

Penang

Male (RM)

2,674,365.33

Perak

Selangor

669,742.42

Terengganu

127.130.00

Sabah

1,204,091. , 5

Sarawak

Female (RM)

471,647.01

331,685.30

Total

471,728.00

130,976.46

Source: Actual survey, 2007

67,320.31

481,046.05

5,900.00

1,351,723.75

67,617.50

Total (RM)

I06,796.00

87,330.57

3,006,050.63

39,878.00

55,510.00

800,718.88

390,108.00

6,250.00

133,030.00

8,077,208.02

81,780.00

1,271,708.65

170,687.00

558,977.58

800.00

511,606.00

7.150.00

73,570.31

77,850.00

562,826.05

I, 001,904.83

1,527,81 0.75

I07,596.00

62,660.00

467,958.00

9,079, , f 2.85

38

2.23 TOTAL WAGES OR SALARIES FOR TOTAL WORKERS PER MONTH FOR DIRECT

LABOUR FORCE: NON- SKILLED CATEGORY (RM)IUMLAH UpAH ATAU CAII PEKERjA UNTUK SEBULAN BAGI KATEGORI TENAGA PEKERjALANGSUNG TIADA KEMAHIRAN (RM)

State

Johore

Kedah

Kelantan

Malacca

Negeri Sembilan

Pahang

Penang

Male (RM)

2,937,224.14

Perak

Se!angor

375,963.00

Terengganu

37.51 0.00

Sabah

204,721.02

Sarawak

Female (RM)

226,286.46

213,298.25

Total

376,824.00

43,913.00

Source: Actual survey, 2007

4,208.05

444,554.00

26,650.00

1,321,475.18

59.1 38.09

139,738.31

Total (RM)

84,359.29

3, , 50,522.39

I00,481.00

145,046.00

419,876.00

223,694.00

6,437,244. , 6

0.00

64,160.00

69,478.00

263,859.11

284,136.00

310,645.75

I8,912.00

208,358.00

477,305.00

36,722.00

4,208.05

,,, 45,445.63

514,032.00

1,605,611. ,8

I58,650.31

353,404.00

260,416.00

7,582,689.79

39

2.24 TOTAL WAGES OR SALARIES FOR TOTAL WORKERS PER MONTH FOR INDIRECT LABOUR FORCE

CATEGORY (RM)IUMLAH UpAH ATAU CAIi PEKERjA UNTUK SEBULAN BAGi KATEGORi TENAGA PEKERjA TiDAK LANGSUNG(RM)

State

Johore

Kedah

Kelantan

Malacca

Negeri Sembilan

Pahang

Penang

Male (RM)

Perak

531,907.25

Selangor

38,850.00

Terengganu

8,278.00

Sabah

71,152.22

Sarawak

Female (RM)

I04,556.00

143,849.85

Total

0.00

31,000.00

Source: Actual survey, 2007

I28,357.00

0.00

237,028.00

0.00

31,283.05

If 8,879.41

Total (RM)

675,757.10

0.00

53,000.00

3,456.00

69,850.00

8,598.00

I, 300,605.88

0.00

16,750.00

8,278.00

I02,435.27

63,029.00

17,683.59

108,012.00

0.00

3,400.00

145.107.00

0.00

0.00

31 0,451.49

300,057.00

I36,563.00

56,400.00

8,598.00

I, 6, ,, 057.37

40

225 TOTAL EXPENDITURES SPENT ON TRAINING PROGRAMMES BY STATE (RM)IUMLAH PERU}QTUKKAN PERBELANjAAN FROGl<^\M LATIHAN MENGIKUTNEGERl(RM)

State

Johore

Kedah

Kelantan

Malacca

Negeri Sembilan

Pahang

Penang

Perak

Seiangor

Terengganu

Sabah

Sarawak

Total

Total expenditure (RM)

Source: Actual survey, 2007

1,381,904.00

29,500.00

160,089.20

0.00

25,000.00

I00,600.00

50,000.00

180,800.92

205,81 0.00

43,880.00

52,500.00

20,300.00

2,250,384. ,2

41

4>.

I\>

Wo

rkin

gp

rop

rie

tors

, a

ctiv

eb

usi

ne

ss p

art

ne

rs

e

,\,

e o e

Un

pa

id f

am

ilyw

ork

ers

^^.

e o e

.

^ ^

Pro

fesio

nal

a e Q e

^

a

No

n-p

rofe

sio

na

l

co

e Q e

.

; 1

.3

^ o e Q e

,

.

CD

Te

ch

nic

ian

s

^ h,

e Q e

^ ^ ^

Cle

rical sta

ff &

typis

ts,.

^ ^ Q o Q

Ge

ne

ral w

ork

ers

co

1.3

. = ,, CD

tie, *

.\

. ,*.<

': a

^

Skille

d

. ,I

CD = a,

CD

j* 1:2

No

n-s

kille

d

C>

^

> ^

Indirect la

bour

forc

e

in a o 70 < o ,I ^ o ;u 7< in 70 co

a^;

co < C',

in Z ^ in 7U

-^;

INVEST"E"TSPELABURAN

3.1 TOTAL PAID- Up CAPITAL BY STATE (RM' o00)JUMLAH MODAL BERBAYAR MENGIKUT NEGERl (RM' 000)

State

Johore

Kedah

Kelantan

Malacca

Negeri Sembilan

Pahang

Penang

Perak

Selangor

Terengganu

Sabah

Sarawak

Total

Total paid-up capitalRM' 000

Source: Actual survey, 2007

215,029

44,332

4,052

135,311

35,720

29,617

1,408

40,865

44,356

23,191

20, , 00

28,265

622,246

45

3.2 PROJECTS APPROVED BY INDUSTRY (RM' 000)PROjEK DILULUS ME1*101KUT INDUSTRl (RM' 000)

Industry

Petroleum productsElectronics &electrical roducts

Chemical & chemicalroducts

Basic metal products

Paper, printing &ublishin

Number of projects

Non-metallic mineralroducts

2007

4>.a\

Food manufacturing

6

Machinery equipment

90

Transport equipment

2006

48

Plastic products

24

10

Rubber products

Scientific & measuringe ui merit

170

18

Domestic investment

(RM' 000)

Fabricated metalroducts

149

11

2007

44

Wood & woodroducts

30

7,021,779

58

26

Furniture & fixtures

29

831,929

Textiles & textilesroducts

29

47

1,861,976

76

Beverages & tobacco

16

2006

2,628,568

102

Leather & leatherroducts

10,832,591

12

66

767,877

Miscellaneous

1,422,217

63

85

Total

223,751

Foreign investment(RM' 000)

6,112,415

20

37

640,260

2007

Source: Malaysialndustry Development Authority OlynnA), 2008

20

30

436,052

371,591

3,161,000

123

16

437.1,5

594,590

7,898,289

229,497

6

41

204,354

170,623

991,802

o

2006

62

725,022

157,511

11

107,852

610,256

30

604,974

1,231,689

1,776,826

549

8,601,473

196,746

6

Total proposed capitalinvestment (RM' 000)

378,261

3,031,525

924,939

155,094

456,833

2007

2,288,127

271,401

120,631

14

10,182,779

1,077

I 16,465

374,213

76,266

93,410

8,730,218

709,362

288,981

37,861

962,206

309,215

2,853,779

696,683

895,364

356,205

2006

2,736,421

355,837

171,348

16,100,423

656,947

I 1,437,565

o

100,113

2,544,703

669,096

216,623

I0,023,690

50,677

1,148,690

757,208

61,688

9,143,940

257,742

53,310

911,661

2,724,178

664,617

151.71 I

22,063

25,765, , 22

745,804

o

25,317

726,096

616,339

688,000

200,000

538,712

1,166,560

286,417

526,828

I, 620,386

55,039

257,624

1,267,203

131,516

,7,043,719

152.1 70

o

1,448,312

247,423

I. 135,469

1,012

208,404

1,000

714,574

142,694

20,227,886

85,693

731,082

101,582

1,325,701

38,061

983,099

410,877

302,864

32,944,343

o

821,266

62,700

1,000

237,404

45,943,006

3.3 NUMBERS OF APPROVALS GRANTED FOR ESTABLISMENT OF MANUFACTURING PROJECTS BYINDUSTRY (2002- 2006)BILANGAN PENUBUHAN PROlEK PEMBUATAN MENGIKUTINDUSTR1(2002,2006)

Industry

Food manufacturing

Beverages & Tobacco

Textiles & textiles products

Leather & leather products

Wood & wood products

Furniture & fixtures

Paper, printing & publishing

Chemical & chemicals products

2002

Petroleum products (incl.etrochemicals

70

Rubber products

Plastic products

2003

30

Non-metallic mineral products

97

Basic metal products

2

41

Fabricated metal products

4

2004

37

34

Machinery manufacturing

17

74

Electronics & electrical products

2

51

37

Transport equipment

9

2005

49

Scientific & measuringe ui merit

36

13

23

75

25

5

Miscellaneous

44

2006

44

58

9

Natural gas

56

35

11

31

Total

76

2002 - 2006

36

25

21

Source: Malaysialndustry Development Authority (MIDA), 2008

6

68

36

58

82

30

55

16

84

23

392

178

23

31

29

41

1/8

64

29

49

87

62

165

15

79

42

10

26

185

11

32

27

11

149

199

140

86

81

do

259

792

80

30

24

37

125

195

47

14

85

376

108

1/5

29

965

65

85

16

30

227

139

28

123

393

62

102

,,, 0,

155

15

170

165

25

66

554

1,027

20

430

14

955

371

,, 077

47

85

92

2

4,962

ExporrSEKSPORT

4.1 NATIONAL MAJOR EXPORTSEKSPORT UTAMA NEGARA

PRODUCTS

Manufactured goods

Electrical & electronic products

Chemicals & chemical products

Machinery, appliances & parts

Wood products

Manufactures of metal

Optical & scientific equipments

Textiles & clothings

Iron & steel products

Value(RM)

Rubber products

451,747.20

Transport equipment

2006

281,006.40

Manufactures of plastics

29,091.20

Share * ,,,

Processed food

19,842.50

Jewellery

76.7

16,685.20

Non-metallic mineral products

47.7

14,149.50

Petroleum products

4.9

13,558.00

Paper & pulp products

3.4

10,601.90

Value(RM)

Beverages & Tobacco

Agricultural goods

2.8

4.3, , 32.70

Other manufactures

9,358.60

2005

2.4

Mining goods

264,698.90

9,332.70

2.3

Others

8,691,00

26,301.30

Share * ,,,

I. 8

Total

7,852.80

18/20.6

1.6

Source: Malaysialndustry Development Authority (MIDA), 2008

* = % share to total exports

7,254.90

77.4

14,638.90

1.6

3,873.40

49.6

I0,847.90

1.5

3,505.20

I2,317.70

4.9

1.3

2,487.80

I0,289. I O

3.4

1.2

2,168.20

2.7

7,002.80

0.7

1,922.20

2.0

6,985.50

0.6

10,365.70

2.3

6,997.90

46,41 0.90

0.4

1.9

6,696.30

0.4

79,284.40

1.3

6529.90

0.3

II, 506.50

1.3

3,613.60

588,949.00

1.8

1.3

2,934.30

7.9

1.3

2,214.40

I3.5

1.2

2,073.40

2.0

0.7

,00.1

1,701. , O

0.5

9,169.10

4, ,, 78. , O

0.4

70,212. ,0

0.4

0.3

9,265. , O

533,788.00

1.7

51

7.7

13.2

1.7

100

4.2 EXPORTS OF WOODEN FURNITURE FROM MALAYSIA To MAJOR DESTINATION (2000- 2007)EKSPORT PERP. BOT KAYU DARI MAUA. YSIA KE DESTINASIUTAMA (2000"2007)

Country

U. S. A.

Japan

E. U

Australia

1,212,898,864.00 1,507,639,571.00 1,576,834,755.00 1,844,231,670.00 2,112,903,251.00 2,232,377,838.00

2001

Singapore

653,725,451.00

I'DI\>

Others

671,806,991.00

Total

234,872,798.00

2002

243,323,356.00

555,618,896.00

Source: Malaysia Timber Council, 2001-2007

762,021,512.00

661,382,263.00

3,778,648,972.00 3,450,7.7,044.00 4,670,189, ,42.00 5,438,433,882.00 5,831,627,294.00 6,409,248,836.00

274,266,268.00

2003

224,976,611.00

497,319,485.00

226,833,435.00 1.103,199,684.00 1,318,501,216.00 1,454,909,352.00 1,644,944,798.00

816,315,925.00 1,003,846,920.00 1,091,753,026.00 1,264,756,906.00

FOB value (RM)

357,486,694.00

2004

319,032,599.00

578,247,520.00

505,482,712.00

2005

188,123,844.00

540,946,146.00

466,403,350.00

2006

164,712,169.00

574,915,628.00

521,937,640.00

2007

1,981,711,182.00

170,316,026.00

619,849,008.00

1,120,389,119.00

546,412,461.00

208,891,998.00

2,187,632.213.00

6,664,885,98, .00

4.3 EXPORTS OF WOODEN FURNITURE BY TYPE OF FURNITUREEKSPORT PERABOT KAYU MENGIKUT IENIS PERABOT

Types of furniture

Upholstered furniture with woodenframe

Other furniture with wooden frame

Wooden office furniture

Wooden kitchen furniture

<11IP

Wooden bedroom furniture

Wooden baby walker

Other wooden furniture

2000

431,203,684.00

Total

514,482,509.00

Source: Malaysia Timber Council, 2000-2006

235,831,8500

561,023,284.00

2001

386,962,529.00

304,442,441.00

420,983,601.00

FOB value (RM)

193,885,053.00

2,371,869,530.00

138,739.00

472,168,788.00

2003

463,970,103.00

4,418,991,372.00

320,329,856.00

679,661,515.00

231,889,681.00

1,984,173,818.00

145,327.00

490.0,1,058.00

2004

527,575,183.00

3,778,648,972.00

534,561,139.00

787,006,673.00

304,157,666.00

2,269,311,823.00

783,823.00

654,245,283.00

2005

4,670,189, ,42.00

620,562,2300

651,066,165.00

877,079,148.00

60,921,021.00

2,440,885,244.00

280,043,146.00

5,425,857,235.00

625,603,296.00

800,911,501.00

2,619,982,114.00

334,255.00

5,824,515,583.00

4.4 EXPORTS OF WOODEN FURNITURE OF THE KIND USED IN THE KITCHEN BY COUNTRYEKSPORT PEERBOT LA. YU YANG DIGUNAKAN DI DAFUR MENGIKUT NEGAl\. A

Country

Algeria

Angola

Antigua & Bamuda

Argentina

Aruba

Australia

Value (RM)

Austria

Azerbaijan

588,612.00

2005

1,297,532.00

Bahrain

Bangladesh

251,602,00

tJ,4>

Barbados

361,828.00

Unit

Belgium

7,734,671.00

Belize

3,545.00

0.00

Benin

I84,903.00

5,798.00

Bermuda

Value (RM)

829.00

950,431.00

Bolivia

2,520.00

I, 512,039.00

0.00

21 1,253.00

Botswana

2006

2,061,968.00

265,507.00

Brazil

203,349.00

0.00

1,623,877.00

Bulgaria

956.00

515,969.00

Burundi

144,730.00

0.00

Unit

Canada

3,671.00

0.00

31,848,211.00

I 1,995,00

7,844.00

Cape Verde

1,129.00

35,825.00

0.00

Central African

Re u blic

5,953.00

367.00

13,587.00

223,755.00

Value (RM)

Chile

1,546,637.00

0.00

0.00

4,070.00

0.00

5,803,995.00

China

362.00

0.00

9,860.00

2007

13,548.00

262,127.00

3,921,775.00

45.00

296,477.00

0.00

27,526,816.00

1,856,377.00

0.00

45.00

54,524.00

0.00

986,318.00

0.00

0.00

45,285.00

Unit

630.00

9,223.00

30,219,615.00

0.00

92,442,00

27,927.00

I9,286.00

0.00

60.00

8,440,954.00

14,229.00

0.00

68.00

3,432.00

0.00

430,733.00

186,904.00

0.00

21,006.00

141,378.00

178,203.00

0.00

Value (RM)

151.00

0.00

I I, 025.00

0.00

2008 (Jan-Feb)

780,211.00

10,214,799.00

I03.00

453,456.00

74,845.00

0.00

303,775.00

436.00

0.00

2,187,491.00

0.00

46,087.00

32,499,632.00

28,246.00

14,654.00

8.00

1,836,498.00

0.00

2,782.00

14,009.00

1,150.00

0.00

0.00

75,615.00

804,809.00

43,264.00

497.00

34,120.00

Unit

49,910.00

t 8.49 I, 277.00

11,912,236.00

7,000,00

3,875.00

0.00

0.00

9,897.00

87.00

0.00

95,328.00

154.00

244,753.00

240,386.00

101.00

0.00

26,757.00

78,934.00

76.00

8,106.00

0.00

836,190.00

177.00

68.00

436,414.00

0.00

174,013.00

I 18.00

0.00

5,462.00

0.00

47,570.00

26,783,317.00

341,874.00

0.00

I, 216.00

0.00

853,230.00

2,966.00

0.00

0.00

106,192.00

360.00

4,171.00

0.00

I8,024,655.00

59,518.00

0.00

5,419.00

0.00

10.00

1,092.00

0.00

748,276.00

164,214.00

12,517.00

0.00

0.00

198,033.00

0.00

275.00

I04,232.00

0.00

41 I. 00

273,441.00

82,465.00

0.00

18,804,760.00

0.00

13,846,00

2,030.00

0.00

0.00

451.00

2,304.00

0.00

9,126,525.00

125,212.00

0.00

698,411.00

0.00

0.00

39.51 1.00

0.00

8,762.00

Country

Colombia

Congo

Costa Rica

Cote D'ivoire

Croatia

Value (RM)

Cuba

Cyprus

Czech Republic

2005

26,334.00

Denmark

483,766.00

Djibouti

0.00

Dominica

2,099,171.00

Unit

DominicanRe ublic

0.00

U'IUn

168,093.00

Ecuador

2,031,083.00

30.00

Egypt

6,045,778.00

4,931.00

0.00

Value (RM)

EI Salvador

5,303,497.00

Equatorial Guinea

11,853.00

66,194,00

0.00

195,631.00

2006

Estonia

I7,011.00

40,261.00

655.00

Ethiopia

17,878.00

390,375.00

198,912, "

Fiji

86,071.00

23,919.00

1,472,944.00

Unit

Finland

76,194.00

46,954.00

205,054,00

France

4,749,839,00

325.00

2,010,853.00

573.00

French Guiana

4,443,974.00

0.00

40.00

French Polynesia

5,839.00

55.00

Value (RM)

1,077.00

3,838,955.00

744,401.00

Gabon

0.00

1,252.00

I33,61 1.00

53.00

Gambia

9,524.00

I08,507.00

2007

1,078.00

265,057.00

Geogia

13,186,719.00

0.00

14,888.00

479,989.00

16,284.00

Germany

0.00

454,315.00

2,798, I 16.00

0.00

48,799.00

0.00

Ghana

1,404,278.00

Unit

64,025.00

3,511.00

43,246.00

0.00

347,595.00

0.00

270,654.00

1,269.00

3,976,510.00

0.00

1,685,914.00

327.00

0.00

96,996.00

I06,302.00

683.00

5,083,809.00

0.00

6,319.00

0.00

1,248,779.00

18,802,00

0.00

Value (RM)

2,628.00

4,412,171.00

18,995. o0

2008 (Jan-Feb)

194,883.00

0.00

7,235,725.00

10,318.00

59,696.00

0.00

352,985.00

240.00

I98,543.00

1,791.00

400,748.00

410,504.00

1,633.00

14,005,5000

0.00

36,891.00

14,612,00

72,067.00

9,587.00

0.00

940,828.00

2,558,864.00

216,710.00

142.00

68,337.00

255,927.00

I0,335.00

Unit

50.00

52,705.00

0.00

1,578.00

688,212.00

812,240.00

70,931.00

270,447.00

0.00

4,484,767.00

935.00

136.00

0.00

647.00

1,306.00

1,222,384,00

2,204.00

I30.00

I 19,645.00

I06.00

1,263.00

27,440.00

2,189,667.00

0.00

1,278,285.00

16,255.00

5,325.00

20,929.00

0.00

I36,28 t .00

2,818,631.00

I7,853,745.00

4,750.00

0.00

574.00

7,244.00

494,959.00

68,561.00

1,854. o0

0.00

7,275,893.00

20,851.00

16,009.00

0.00

26,939.00

6,255.00

0.00

2,456,861.00

22,723.00

859,284.00

0.00

290.00

14,080.00

98.00

37,580.00

164,290.00

1,346.00

6,862.00

140,044.00

213,300.00

344,821.00

3,255,937.00

50.00

1,670.00

0.00

32,964.00

492.00

48,799.00

54.00

58,882.00

6,572.00

33,176.00

I, 080,772.00

6,230.00

16,563,900.00

50,439.00

452.00

1,249.00

10.00

I I, 945.00

967.00

22,410.00

8,536,415.00

0.00

461.00

0.00

2,030,246,00

25.00

41,271.00

182.00

I00,658.00

296.00

94,976.00

309,704.00

0.00

I I 0.00

49,129.00

5,179.00

0.00

I8,135.00

55,643.00

701,166.00

19,928,053.00

1,190.00

2,305.00

505,177.00

49.00

252.00

5,594.00

208,398.00

3,419.00

Country

G reece

Grenada

Guadeloupe

Guam

Guatemala

Guinea

Value (RM)

Guyana

3,139,520.00

Haiti

2005

Honduras

77,629.00

Hong Kong

I57,718.00

Hungary

1,316,054.00

Unit

Iceland

U.O\

0.00

30,175.00

India

I5,772.00

Iran

25,043.00

I 15.00

Ireland

Value (RM)

632.00

Italy

4,552,402.00

0.00

Jamaica

634,590.00

1,946.00

0.00

2006

3,023,202.00

0.00

146,673.00

Japan

47.00

Jordan

94,617.00

425.00

2,625,053.00

Kazakhstan

Unit

0.00

318,156.00

517,105.00

Kenya

0.00

13,363,507.00

0.00

40,602.00

Korea

3,716.00

0.00

64,368.00

1,448,039.00

20,881.00

1,225.00

Kuwait

Lalvia

501,630.00

Value (RM)

17,958,627,00

411.00

0.00

13,348.00

0.00

Lebanon

16,909.00

4,043,626.00

3,718,148.00

0.00

661,892.00

0.00

3.2t6.00

2007

819.00

Liberia

2,177,307.00

80,459.00

34,426.00

127.3t3.00

Libyan ArabJamahiri a

400.00

I03,777.00

5,705.00

184,407.00

5,545,873.00

4,640,723.00

0.00

2,127.00

122,193.00

Unit

0.00

1,821,334.00

882,376.00

304,623.00

0.00

8,734,838.00

0.00

33,260.00

88.00

42,199.00

4,035.00

158,624.00

39,545.00

1,049,154.00

17,924.00

1,407,360.00

68,383.00

I00.00

686.00

772,100.00

91,307.00

1,326.00

I I, 950,529.00

510.00

Value (RM)

36,931.00

2008 (Jan-Feb)

41,600.00

42,942.00

742,981.00

0.00

2,954,070.00

150,656.00

3,609,712.00

230,076.00

3,622.00

0.00

2,347.00

7,561,00

2,829,751.00

62,672.00

216,271.00

1,490.00

161,804.00

11 0.00

8,097.00

134,437.00

90,025.00

254.00

5,993,500.00

88,300,00

4,428, , 09.00

6,842.00

3,013,00

127.00

104,301.00

31,683.00

Unit

654,795.00

,879,145.00

1,832.00

462.00

186,760.00

29,475.00

7,145,126.00

1,541,270.00

21,317.00

32,687.00

1,290.00

2,451,243.00

I5,704.00

5,923.00

557.00

1,317,016.00

30,967.00

893.00

601,536.00

415.00

I 1,620,715.00

745.00

86,992.00

942.00

29,828.00

80,067.00

32,282.00

I86.00

204,036.00

1,724,801.00

I0,865.00

3,874.00

511.00

6.41 1.00

480,054.00

54,261.00

22,408.00

4,962,420.00

316,040.00

80.00

20,513.00

I64,502.00

13,906.00

48.00

5,268,196.00

6,638,675.00

1,237.00

I93.00

231,780.00

708.00

0.00

955,536.00

901.00

308,015.00

2,118,383.00

3,983.00

22,535.00

7,701,456,00

225.00

9,613.00

1,748,221.00

2,200,771.00

1,907.00

1,291,215.00

4,4300

36,943.00

16,592.00

43,397.00

0.00

8,005,087.00

321,210.00

2,913.00

1,266, , 28.00

3,397.00

66.41 0.00

24,100.00

407,000.00

15,262.00

17,783.00

1,108,688.00

1,985.00

2,571,011.00

410,106.00

I, 278,547.00

41.00

I0,438.00

2,909.00

2,766,565.00

1,956.00

1,600,065.00

4,985.00

22,063.00

312,342.00

6,279.00

367,569.00

30,428,00

19,974.00

1,506.00

2,494.00

Country

Lithuania

Macau

Madagascar

Maldives

Malta

Value (RM)

Martinique

Mauritius

912,493.00

2005

Mayotte

Mexico

90,402.00

433,825.00

Micronesia

463,131.00

Mongolia

Unit

256,917.00

Morocco

U,\I

8,712.00

Mozambique

76,603.00

852,192.00

Namibia

400.00

Value (RM)

Netherlands

389.00

7,437,590.00

3,378,00

NetherlandsArithles

431,353.00

0.00

1,528.00

2006

New Caledonia

51,813.00

765.00

New Zealand

1,417,452.00

0.00

4,174.00

46,861.00

0.00

Nicaragua

522,771.00

450,396.00

Unit

Nigeria

43,488.00

142,381.00

808,708.00

0.00

Norway

7,549,559.00

4,955.00

69,365.00

Oman

418,765.00

0.00

161,030.00

Other

Countries, Nes.

175.00

0.00

Value (RM)

8,093.00

I0,032.00

I04.00

9,481,853.00

2,843.00

89,085.00

Pakistan

5,890,377.00

1,724,268.00

1,346.00

2007

Panama

2,429.00

922.00

214,284.00

45,185.00

I2,899,00

Papua New Guinea

314.00

1,788,464.00

0.00

237,214.00

55,993.00

3,987.00

Peru

3,638,526.00

0.00

536,677.00

453.00

I 18,665.00

Unit

406,225.00

154,845.00

62,652.00

5.00

762,542.00

308.00

31,406.00

14,503.00

5,632,607.00

149,531.00

164,745.00

,238,592.00

0.00

644.00

233,670.00

25,009.00

4.00

13,491.00

791,245.00

Value (RM)

0.00

774.00

390.00

6,338,347.00

28,444.00

2008 (Jan-Feb)

152,004.00

3,676.00

2,774, , 75.00

305,097.00

0.00

479.00

1,614,949.00

1,126.00

1,367,00

510,784.00

1,520.00

328,927.00

1,330.00

28,818.00

883.00

3,204,881.00

0.00

6,992.00

731,911.00

4,323,196.00

1,334.00

0.00

155.00

0.00

242,028.00

592,026.00

4,056.00

0.00

Unit

1,821.00

34,378.00

520,795,00

0.00

545,108.00

126,495.00

15,751.00

16,966.00

3,246,834.00

674.00

90,315.00

227,531.00

3,900.00

4,818.00

1,782,174.00

0.00

I52,255.00

2,267.00

0.00

22,801.00

292,728.00

0.00

49,321.00

6,005.00

32,715.00

99,399.00

0.00

0.00

5,696,693.00

1,797,608.00

124,872.00

594.00

3,079.00

792.00

826,208.00

1,033.00

642,596,00

1,680.00

27,695.00

7,254.00

990.00

5,833.00

1,703,183.00

3,808,254.00

543.00

0.00

I I 0.00

1,475.00

0.00

0.00

38,906.00

207,570.00

69,882.00

235.00

1,591,485.00

10,001.00

2,235,754.00

364.00

3,349,007.00

6,701.00

10.00

2,277.00

12,841.00

266,730.00

0.00

465,620.00

51,375.00

0.00

0.00

138,807.00

276,504.00

437.00

2,153,528.00

1,282,618.00

7,224,00

810.00

23,594.00

20,666.00

534,919.00

1,007.00

3,108,382.00

1,814.00

0.00

0.00

939.00

307,978.00

I I, 243.00

1,335.00

2,232,211.00

8,823.00

2,329.00

5,727.00

39,811.00

615,637.00

0.00

2,588.00

303,363.00

I, 239,234.00

19,688.00

2,874.00

5.00

1,278.00

I0,637.00

Country

Guadeloupe

Guam

Guatemala

Guinea

Honduras

Hong Kong

Value (RM)

Hungary

2005

Iceland

India

6,238.00

0.00

407,250.00

Indonesia

257,297.00

Iran

Unit

222,971.00

Iraq

O\I\,

784,785.00

Ireland

0.00

Italy

4,238.00

2.00

Value (RM)

Jamaica

220,831.00

33,232,659.00

0.00

2,347.00

Japan

1,703.00

2006

Jordan

4,400.00

25,683.00

293,637.00

Kazakhstan

0.00

363,749.00

0.00

Kenya

185,475.00

584,616,00

0.00

Korea

650,869.00

Unit

207.01 1.00

733.00

146,465.00

459,027.00

Kuwait

557,808.00

Lalvia

14,166,206.00

26,158.00

0.00

167,675.00

Lebanon

f, 907.00

0.00

51.00

7,874,601.00

3,993.00

Value (RM)

176,881.00

Lesotho

2,645.00

48,071,298.00

4,653.00

Liberia

6,168.00

24,229.00

2,384,712.00

1,259.00

2007

Libyan ArabJamahiri a

3,380.00

1,103,500.00

2,634.00

534,659.00

0.00

Lithuania

263,377,00

6,911,756.00

0.00

98,103.00

1,066.00

90.00

266,061.00

0.00

428,611.00

86,343.00

625,878.00

1,060.00

Unit

295,366.00

610,525.00

1,270,055.00

493,823.00

665,761.00

170.00

0.00

21,215.00

16,407,805.00

70,695.00

0.00

I0,270.00

4,179.00

0.00

264,886.00

86,341.00

4,070,128.00

3,490.00

0.00

Value (RM)

0.00

48,133.00

2,442,542.00

610,459.00

3,886.00

89,234,070.00

2008 (Jan-Oct)

3,564.00

4,410.00

22,688.00

3,884,054.00

5,380.00

35,128.00

I I, 925.00

21,093.00

2,982.00

0.00

16,712.00

1,692,969.00

1,345.00

16,769.00

I I, 777,759.00

91,840.00

691,878.00

193,371.00

977.00

1,080,467,00

I 13,682.00

2,145.00

283.00

0.00

44,874.00

2,480.00

626,322.00

I30,402.00

16,764.00

Unit

549,482.00

689,781.00

899,266.00

458.1 39.00

709,023.00

230.00

29,931.00

254.00

214.00

23,938,256.00

14,739.00

93.00

I I0.00

284,730.00

3,7800

2.319,096.00

209,299.00

7,173,00

0.00

0.00

107,140.00

5,515,649.00

2,657.00

80,525,143.00

10,011,00

0.00

6,410.00

1,108.00

88,318.00

3,333,736.00

6,615.00

5,096.00

4,295.00

8,062.00

297,373.00

190,410.00

0.00

10,092,471.00

421,989.00

0.00

49,156.00

0.00

2,269.00

0.00

89,485.00

981,830.00

0.00

2,040.00

38,586.00

403,613.00

1,097,583.00

691,553.00

120.00

0.00

24,215.00

18,882,095.00

0.00

2,076.00

0.00

502, , 84.00

1,140.00

4,322,206.00

127,953.00

0.00

0.00

5,822,724.00

1,284.00

155,721.00

6,936.00

5,370,772.00

I38,683.00

4,789.00

5,000.00

0.00

380,010.00

236,923.00

9,878,548.00

0.00

5,735.00

0.00

78,836.00

47,532.00

86,155.00

1,508,567.00

349.2,0.00

567.00

1,362.00

62,518.00

370,595.00

669.00

4,750, , 65.00

77,900.00

250,793.00

250.00

15,819.00

737.00

3,215.00

29,785.00

2,874.00

Country

Luxembourg

Madagascar

Malawi

Maldives

Mali

Malta

Value (RM)

Mauritania

Mauritius

2005

532,543.00

Mexico

0.00

I04,869.00

Mongolia

I, 036,281.00

Morocco

Unit

Mozambique

O\IP

Namibia

0.00

4,073.00

0.00

Netherlands

43,774.00

0.00

NetherlandsAntil!es

952,688.00

Value (RM)

791.00

7,467.00

307,816.00

New Caledonia

445,725.00

2006

New Zealand

863,574,00

964,058.00

0.00

0.00

Nicaragua

163,473.00

232,515.00

0.00

1,429,759.00

276.00

Niger

5,707.00

92,418.00

Unit

Nigeria

496.60I. 00

2,404.00

12,984.00

Norway

486,095.00

228.00

Oman

7,316.00

0.00

7,370,00

82,745.00

Other

Countries, Nes

I, 612,297.00

1,266.00

0.00

Value (RM)

843,203.00

15,971.00

854.00

146,728,00

Pakistan

0.00

924.00

278,471.00

71,719.00

Palestine

2007

2,147.00

I, 028,319.00

1,691,798.00

45.00

4,319.00

Panama

0.00

338,714.00

50,129.00

676,799.00

Papua New Guinea

0.00

I, 039,881.00

718.00

0.00

9,505.00

460,502.00

Unit

9,297.00

958,233.00

0.00

1,374.00

938,586.00

0.00

1,111,208.00

82,423.00

0.00

282.00

83.00

72,007.00

0.00

9,285.00

I3,367.00

884,669.00

1,973,057.00

0.00

2,758.00

Value (RM)

5,211,903.00

3,146.00

353.00

0.00

2008 (Jan-Oct)

9,138.00

2,142.00

173,364.00

0.00

74,271.00

1,492,218.00

6,225.00

0.00

0.00

5,766,00

357,046,00

1,118,916.00

2,023,787.00

164,740.00

8,291.00

0.00

0.00

0.00

I 12.00

1,572,305.00

269,243.00

623.00

5,362.00

1,365,206.00

I 19,790.00

12,605.00

493,729,00

0.00

0.00

76,108.00

Unit

667,366.00

0.00

2,596,00

524,563.00

1,480.00

2,535,585.00

0.00

9,536.00

32,425.00

2,659.00

0.00

I0,045,00

79,911.00

1,673.00

0.00

I3,892.00

123,163.00

0.00

519,618.00

1,777,533.00

82,208.00

2,321.00

2,184,199.00

8,019.00

0.00

570,054.00

7,417.00

307,076.00

1,629.00

731.00

1,808,636.00

5,466.00

0.00

5,609.00

529,438,00

2,539,932.00

421,253.00

30,332.00

0.00

1,280.00

1,240,100.00

0.00

2,577,515,00

615.00

4,444.00

745.00

13,641.00

608,724.00

I8,939.00

489.00

1,957,330.00

23,808.00

501,795.00

5,144.00

2,123.00

0.00

13,315.00

54,098.00

3,328.00

96,177.00

2,437,420.00

3,844.00

0.00

19,654.00

86,768.00

6,865.00

16,320.00

4,095,794.00

73,827.00

525,648.00

1,499.00

176.00

I5,004,00

20,330.00

4,385.00

646,612.00

94,966.00

2,914,544.00

77.00

599.00

31,543.00

637.00

5,647.00

1,935,150.00

58,195.00

560.00

7,929.00

I0,781.00

3,928.00

33.00

1,262,852.00

803.00

23,401.00

355,705,00

14,457.00

0.00

2.00

604,572.00

15.00

12,695.00

3,818.00

0.00

5,040.00

Country

Peru

Pitcairn

Poland

Portugal

Puerto Rico

Oatar

Value (RM)

Reunion Islands

Romania

2005

Russian Federation

0.00

Saint Lucia

122,749.00

0.00

SaudiArabia

198,574.00

Unit

Senegal

O\4>.

5,918,483.00

Seychelles

0.00

Sierra Leone

0.00

60,130.00

Singapore

0.00

Value (RM)

952.00

Slovakia

2.1 00.00

0.00

Slovenia

14,074.00

I2,721,940.00

2006

0.00

44,660.00

Solomon Islands

0.00

I, 052,668.00

0.00

South Africa

858.00

4,349.00

0.00

I04,493,00

Spain

35,009.00

Unit

127,800.00

0.00

I 1,533,671.00

Sri Lanka

35,272.00

0.00

200.00

I03,472.00

Sudan

156,757.00

0.00

57,178.00

0.00

Sunname

0.00

7,492.00

Value (RM)

12.00

Sweden

342,334.00

18,441.00

705.00

161.00

0.00

1,824,405.00

0.00

Switzerland

2007

13,257,168.00

25,870.00

I06,857.00

786.00

360.00

Syrian Arab

156,206.00

0.00

Taiwan

314,424.00

1,270.00

0.00

916,074.00

99,312.00

0.00

585.00

562,892.00

3,919,217.00

46,507.00

Unit

120,903.00

1,424.00

0.00

11,077,193.00

0.00

44,327.00

10,125.00

50.00

49,432.00

132,708.00

305.00

547,971.00

236,229.00

0.00

0.00

644.00

1,920.00

0.00

Value (RM)

8,433.00

928.00

0.00

2008 (Jan-Oct)

6,925.00

129,566.00

68,400.00

23,540.00

0.00

0.00

3,347,367.00

192,666.00

0.00

42.00

225,431.00

1,684.00

16,880,475.00

27,642.00

260.00

88,126.00

0.00

22,603.00

339,765.00

325.00

174,447,00

1,402,041.00

894,285.00

2,365.00

I, 618.00

0.00

808,372.00

0.00

2,699,584.00

63,897.00

Unit

312,825.00

1,200.00

0.00

0.00

0.00

9,687,548.00

150.00

26,364.00

1,391.00

158,923.00

1,392.00

0.00

144,625.00

335.00

0.00

838,061.00

387,701.00

1,396.00

2,454.00

0.00

5,260.00

28,587.00

29,928.00

29,423.00

698.00

0.00

144,797.00

7,684.00

23,944.00

159.00

4,195,762.00

0.00

1,728.00

181,579.00

I 1,719,954.00

0.00

65,957.00

0.00

6,488.00

741,190.00

0.00

1,331,427.00

0.00

2,949.00

7,124.00

0.00

I, 448,398.00

126,535.00

0.00

240.00

2,995,450.00

18.00

223,483.00

0.00

396.00

130,005.00

I, 151.00

0.00

0.00

11 7,549.00

173,272.00

0.00

7,613.00

0.00

0.00

7,390.00

24,642.00

40,667.00

0.00

20.1 80.00

661.00

6,681,558.00

0.00

6,230.00

180,886.00

4,887.00

In 02,144.00

0.00

I, 223,282.00

1,066.00

0.00

0.00

0.00

480.00

980,416.00

0.00

82,412.00

62.00

1,793.00

0.00

10,817.00

14,227.00

15,729.00

22,372.00

5,250.00

0.00

9,193.00

367,285.00

130.00

10.00

0.00

1,464.00

4.00

Country

Talkistan

Tanzania

Thailand

Togo

TongaTnnidad andToba o

Value (RM)

Turkey

532,146.00

2005

Uganda

3,018,600.00

Ukraine

United Arab

Emirates

143,350.00

Unit

0.00

United Kingdom

o. ^1.11

4,379.00

187,666.00

United States ofAmerica

0.00

I8,031,00

Value (RM)

Uruguay

712,853.00

1,203.00

0.00

0.00

Uzbekistan

70,089.00

2006

42,870,839.00

Vanuatu

2,596,818,00

0.00

I, 162.00

Venezuela

0.00

15,276,101.00

Western Samoa

580,094.00

14,365,974.00

6,532.00

Unit

0.00

0.00

Yemen

Yugoslavia

192,336.00

263.00

413,618.00

0.00

19,771.00

Zaire

0.00

68.1 95.00

Zambia

0.00

I I 6,776.00

2,021,795.00

Value (RM)

Total

4,453.00

0.00

0.00

86,506.00

57,635.00

204,596,00

0.00

2007

Source: Malaysia External Trade Development Corporation (Maimde), 2008

69,224,263.00

I, 735,055.00

0.00

1,685.00

2,120,300.00

0.00

19,001,605.00

0.00

1,072.00

0.00

475,509.00

706.00

47,727,988.00

44,250.00

Unit

0.00

319,577.00

0.00

0.00

1,443.00

224,878,073.00

902,632.00

340.00

865,394.00

I9,842.00

0.00

0.00

0.00

36,072.00

17,283.00

10,291.00

0.00

I61,554.00

2,067,214.00

0.00

Value (RM)

21.00

2008 (Jan-Oct)

4,622.00

356,280.00

831,961.00

359,536.00

1,882.00

0.00

0.00

79,461,332.00

98,747.00

3,316,777.00

I, 718,378.00 350,000,554.00

0.00

5,072.00

2,062,351.00

11,490,965.00

0.00

0.00

0.00

710,434.00

I 13.00

19,324.00

70,730,914.00

0.00

Unit

4.00

206,956.00

471,753.00

0.00

0.00

7,579.00

3,100.00

784,108.00

645.00

977,105.00 108,588,893.00

42,227.00

91,443.00

1,543,271.00

0.00

19,469.00

2,898,049.00

314,951.00

0.00

19,852,00

5,598,00

0.00

0.00

927,755.00

2,051,792.00

3,040.00

0.00

95,4200

II 0.00

3,659,893.00 479,227,859.00

24,246.00

4,599,00

1,535.00

3.1 24,579.00

12,531,083.00

0.00

12,171.00

I38,394.00

60,179,899.00

24,457.00

0.00

234,531.00

19,044.00

9.00

925,771.00

I, 257,664.00

265,658.00

547.00

135.00

32,481.00

11 0,352.00

6,893.00

0.00

2,049,444.00

512,802.00

358.00

1,298.00

5,655,794.00 494,681,622.00

6,380.00

4,803.00

2,887,695.00

0.00

0.00

593,076.00

49.00

21,662.00

0.00

602,912.00

20,147.00

0.00

3,357.00

0.00

4,870,553.00

5,194.00

Country

French Guiana

French Polynesia

Gabon

French Guiana

French Polynesia

Gabon

Value (RM)

Gambia

2005

Geogia

Germany

28,537,00

0.00

228,636.00

Ghana

Greece

Unit

O\o0

Grenada

28,537.00

0.00

228,636.00

Guadeloupe

0.00

I 13.00

Guam

28,581.00

1,335,00

Value (RM)

Guatemala

42,378.00

1,837,515.00

Guinea

2006

20,265,00

0.00

113.00

Guyana

20,900.00

97,061.00

1,335.00

1,182,958.00

Haiti

18,365.00

Honduras

40.00

86,973.00

20,265.00

Unit

I02.00

154,589.00

Hong Kong

5,307.00

97,061.00

Hungary

27,865.00

40.00

I8,365,00

Iceland

270.00

40.00

4,463.00

28,133.00

Value (RM)

I18,046.00

India

335,833.00

60.00

0.00

5,476,098.00

200.00

Iran

40.00

2007

340.00

Iraq

270.00

327,769.00

22,987.00

0.00

2,063,451.00

Ireland

000

53.00

5,446,2I 0.00

60.00

0.00

51,749.00

I02.00

81,533.00

0.00

0.00

182.00

182,343.00

Unit

373.00

291,187.00

27,684.00

327,769.00

0.00

48,580.00

2,464,508.00

0.00

27,761.00

51,749.00

390,830.00

I0,539,00

32.00

560,985.00

0.00

0.00

753.00

11 6,719.00

24,426.00

127,145.00

350,753.00

0.00

I85.00

6,211,990.00

Value (RM)

184.00

I08,397.00

I I, 033,286.00

5,700.00

1,354.00

2008 (Jan-Oct)

480.00

171,690.00

0.00

753.00

136.00

3,359,862.00

I I 0,978.00

7,868.00

72.00

3,175,605.00

1,150.00

0.00

185.00

16,206.00

I58,741.00

38,527.00

0.00

204.00

335.00

361,559.00

328,096.00

32,238.00

626.00

28,225.00

32,607.00

334.00

182,851.00

5.00

5,135,042.00

14,725.00

Unit

I58,741.00

260,966.00

0.00

0.00

386.00

23,565.00

473.00

I70,084.00

200,615.00

t 3,843.00

32,238.00

127,379.00

0.00

11,829,624.00

550.00

1,388.00

79,682.00

150.00

317,459.00

10,669,414.00

1,669.00

0.00

20.00

509.00

40,412.00

190,655.00

5,342,999.00

0.00

321,025.00

48.00

0.00

550.00

3,118,686.00

1,055.00

788.00

356,085,00

343.00

20.00

46,553.00

144,676.00

78,603.00

502.00

0.00

366.00

5,816,792.00

209,645.00

31 0.00

55,832.00

166,361.00

276,114.00

0.00

630.00

41,554.00

378.1 08.00

928.00

15,305,968.00

14,940.00

372,465.00

1,310.00

0.00

24,338.00

283.00

6,100

73,407.00

1,285.00

61,910.00

475,204.00

1,108.00

3, I 03,295.00

804.00

1,355.00

386,283.00

531,701.00

0.00

499.00

237,376.00

203.00

7,525,978.00

240.00

3,237.00

127,508.00

12,951.00

37,648.00

9,652,420.00

1,612.00

1,112.00

24,649.00

2,600

42,281.00

13.00

Country

Italy

Jamaica

Japan

Jordan

Kazakhstan

Kenya

Value (RM)

Korea

3,607,855.00

2005

Kuwait

Latvia

22,009,086.00

58,085.00

Lebanon

2,972,480,00

Liberia

Unit

O\^

Libyan ArabJamahiri a

376,413.00

17,485.00

184,639.00

Lithuania

5,627,253.00

237.00

98,193.00

Macau

7,224,221.00

Value (RM)

Madagascar

5,014.00

3,217,895.00

148,996.00

M alawi

2006

4,715.00

700,659.00

316,734.00

Maldives

35,428,670.00

548.00

18,928.00

18,957.00

Malta

2,407,842.00

169,542.00

23,451.00

Martinique

Unit

1,115,326.00

Mauritius

24,772.00

97,199.00

745.00

371,754.00

Mayotte

1,404.00

5,569,657.00

241,905.00

883.00

Mexico

10,427,691.00

25,586.00

Value (RM)

0.00

41.00

Mongolia

I0,266.00

2,334,382.00

240.00

1,952,520.00

649,762.00

Montenegro

5,943.00

2007

0.00

981,226.00

131,430.00

123.00

Morocco

798,657.00

28,014,761.00

283,224.00

560.00

Mozambique

45,378.00

0.00

2,216,097.00

179,607.00

167.00

650,773.00

44,432.00

0.00

1,377,513.00

Unit

11,071.00

665,762.00

2,159,210.00

2,0000

0.00

51,382.00

513,171.00

4,060.00

5,121,047.00

1,940.00

86,526.00

79.00

177,072.00

215,678.00

6,745,687.00

0.00

93.00

I, 894,685.00

0.00

3,467.00

1.710,934.00

I, 595,865.00

Value (RM)

22,919.00

874.00

0.00

2008 (Jan-Oct)

I, 805,266.00

1,915.00

339,836,00

0.00

3,546.00

153,114.00

2.015.00

3,938,554.00

1,620.00

125,469.00

225,235.00

1,021,229.00

0.00

24,757.00

25,910,417.00

65.00

464,307,00

574.00

235,536.00

60,982.00

I0,183.00

0.00

604,018.00

16,3100

1,347,052.00

5,018,674.00

6,879.00

0.00

9,186,00

1,364,714.00

Unit

490.00

13,344.00

7,391.00

288.00

292,374.00

1,472,534.00

12,110.00

1,126,00

4,802,294.00

229.00

3,255,585.00

2,699,00

54,070.00

0.00

4,867.00

2,879,179.00

280,101.00

9,434,388.00

757.00

0.00

13,953.00

75,501.00

1,771,024.00

1,645.00

I95,870.00

6.00

4,01 I. 00

1,102,325.00

125,213.00

7,881.00

1,518,694.00

1,208.00

1.00

0.00

3,791.00

461,943.00

30,493.00

I7,005.00

1,076,380.00

0.00

24,960.00

4,938,906.00

190.00

7,575.00

43,658.00

1,124,192.00

444.00

342.00

8,535.00

595.00

1,815,00

5,826,801.00

0.00

20,410.00

904,218.00

0.00

1,944.00

0.00

112,415.00

42,434.00

2,164,031.00

260,067.00

5,364,00

8.00

665,950.00

3,576.00

151,527.00

0.00

1,522,912.00

180,126.00

2,359.00

0.00

0.00

148,652.00

1,857.00

1,960,413.00

20.00

8,105.00

2,015.00

36,045.00

300.00

6,886,211.00

0.00

6,587.00

234,486.00

226.00

9,011.00

0.00

243.00

41,739.00

726.00

Country

Namibia

Netherlands

NetherlandsAntilles

New Caledonia

New Zealand

Value (RM)

Nicaragua

Niger

2005

274,219,00

Nigeria

1,672,219,00

Noriolk Island

135,753.00

Norway

Oman

Unit

~~jQ

30,301.00

2,578,434.00

Other

Countries, Nes

482.00

5,505.00

Pakistan

Value (RM)

Palestine

0.00

133.00

Panama

0.00

2006

11,574.00

21.00

Papua New Guinea

2,456,4000

0.00

382,014.00

Peru

1,617,039.00

0.00

562,327.00

Poland

0.00

2,622,350.00

Unit

Portugal

74,440.00

0.00

2,784,695,00

Puerto Rico

0.00

85,023.00

Qatar

8,694.00

15,765.00

0.00

900.00

258,700.00

Reunion Islands

4,803.00

83,081.00

Value (RM)

0.00

364.00

Romania

99,163.00

1,556.00

Russian Federation

I I, 390.00

19,077.00

38.00

2007

2,176,374.00

0.00

555,442.00

Saint Kitts & Nevis

91.00

I 1,242.00

2,849,534.00

0.00

0.00

446,748.00

617,435.00

40.00

17,620,770.00

0.00

2,075,143.00

598.00

82,516.00

9.00

8,236,425.00

Unit

2,715,632.00

451.00

163.1 52.00

0.00

862,317.00

2,6200

18,762,00

0.00

36,673.00

0.00

8,628.00

8.00

175,441.00

582,611.00

20.00

8,372.00

2,013,434.00

1,236.00

I , I 33.00

49,389.00

58,454.00

Value (RM)

69,729.00

1,921.00

0.00

I6,833.00

2008 (Jan-Oct)

144.00

1,429,438.00

38,903.00

291,070.00

276.00

3,223.00

471,794,00

0.00

4,376,333.00

0.00

0.00

2,321,824.00

501,660.00

59.00

1,262.00

I 1,718,745.00

2,278.00

70.00

1,992,435.00

7,372.00

585,996.00

6,050,728.00

427.00

0.00

I03,473.00

164.00

2,476, , 38.00

252,362.00

Unit

3,588,418.00

I I, 511.00

0.00

0.00

1,189,231.00

0.00

1,325.00

790.00

4,083.00

2,178,528.00

84,689,00

339,886.00

0.00

45,884.00

I84,923.00

8,023.00

0.00

53,950.00

f, 688.00

17,072.00

1,579.00

83,458.00

7,586,00

I04,386.00

4,295,378.00

I0,004.00

269,409.00

164.00

2,072,383.00

647.00

1,650,600.00

15,856.00

8,728,020.00

4,318,356.00

5,941.00

0.00

7,794.00

0.00

2,194.00

5,784,260.00

13,230.00

1,190,780.00

I, 529,396.00

186.00

14.00

421.00

292,438.00

250.00

7,044.00

22,026.00

4,867,687.00

950.00

4,569.00

1,968,776.00

3,081.00

88,035.00

14.1 68.00

0.00

7,960.00

71,594.00

437,965.00

1,127.00

18,459.00

5,505,254.00

517.00

2,670,105.00

0.00

45.00

19,917.00

11,814,354.00

12,212.00

0.00

5,688,001.00

25.00

2,170.00

3,012,913.00

11,404.00

0.00

78,648.00

5,077,598.00

4,948.00

57,788.00

143,712.00

I8,666.00

8,973.00

165.00

I9,576.00

160.00

Country

Saint Lucia

SaintVincent/Grenadines

SaudiArabia

Senegal

Seychelles

Value (RM)

Sierra Leone

Singapore

2005

Slovakia

Slovenia

99,910.00

19,780,495.00

0.00

Solomon Islands

484,699.00

South Africa

Unit

~-. I^

I00,848.00

Spain

Sri Lanka

0.00

216.00

Sudan

78,369.00

Value (RM)

0.00

Sunname

6,156.00

0.00

886.00

Sweden

2006

7,912.00

424.00

Switzerland

12,219,851.00

21,877,00

22,504,329.00

0.00

6,529,00

Syrian Arab

2,696,824.00

0.00

Taiwa n

Unit

0.00

652,051.00

Tanzania

342,330.00

30.00

1,308,064,00

0.00

Thailand

10.00

0.00

68,350.00

Togo

44,493.00

24.00

267,812.00

39.00

91,980.00

Value (RM)

872,859,00

Tonga

I0,202.00

0.00

Tnnidad andToba o

102,543,00

1,287.00

2007

0.00

0.00

405,080.00

654.00

Tunisia

3,580,897,00

6,561,00

11,688,2100

31,990.00

0.00

I6.41 1,933.00

0.00

276.00

3,716,753.00

1,734.00

976,315.00

0.00

3,737.00

0.00

33,496.00

Unit

542,883.00

115,314.00

0.00

404,360.00

360.00

12,138.00

0.00

0.00

800.00

1,137,943.00

I3,786,00

0.00

I 16.00

41,378.00

42,189.00

1,136,164.00

224,634.00

400,707.00

0.00

0.00

I7,886.00

I04,322.00

0.00

Value (RM)

910.00

2008 (Jan-Oct)

39,462.00

t, 295.00

I51.00

47,498.00

0.00

3,645,477.00

I 1,472,403.00

1,989.00

0.00

0.00

136.00

31,324.00

15.00

6,361,053.00

0.00

23,790.00

268.00

91 0,567.00

34,383.00

22,302,657.00

0.00

0.00

1,244.00

3,784.00

3,507.00

908,777.00

1,574,292.00

I96,0200

Unit

0.00

0.00

0.00

282.00

351,579.00

800.00

240,099.00

17,821.00

0.00

11 9,302.00

1,463,127.00

2,231,560.00

8,901.00

I09,334.00

0.00

83.00

27,368.00

661.00

11 7.00

85,086.00

3,238.00

88,888.00

0.00

0.00

3,862,800.00

0.00

0.00

309,552.00

7,168.00

126.00

0.00

0.00

I, 021.00

798,829,00

89.00

9,377,723.00

5,364.00

4,953.00

30.00

9,464.00

7,992,870.00

30.00

2,047.00

47,434.00

0.00

0.00

0.00

32,382.00

377.00

49,360,00

4,496,979.00

34,323.00

1,969,538.00

0.00

988.00

179.7i 9.00

2,306.00

1,368,773.00

54,854.00

14.00

91,630.00

36,000.00

26,537.00

229,669.00

169.00

I72,265.00

2,001,618.00

27.00

78.00

6,930,00

6,775.00

1,070.00

906,852.00

6,235.00

246.00

1,456.00

0.00

I09.00

0.00

2,393,964.00

6,218.00

0.00

1,980.00

375,668.00

0.00

0.00

I0,440,00

0.00

I , I 19.00

Country

Turkey

Uganda

Ukraine

United ArabEmirates

United Kingdom

Value (RM)

United States ofAmerica

United StatesVir in Islands

2005

80,281.00

148,847.00

Uruguay

Uzbekistan

73,592.00

31,303,462.00

Vatican City State

Unit

\It*,

61,503,525.00

Venezuela

427,519,053.00

476.00

Vietnam

767.00

Western Samoa

Value (RM)

189.00

Yemen

17,955.00

74,544.00

Yugoslavia

179,554.00 108,158,953.00

2006

97,848.00

1,755,008.00 494,964,603.00

Zambia

213,286.00

0.00

Total

I 17,095.00

0.00

34,290,039.00

Source: Malaysia External Trade Development Corporation (Maimde), 2008

0.00

Unit

42.00

0.00

306.00

0.00

0.00

240,288.00

543.00

0.00

0.00

Value (RM)

I05,352.00

232.00

92,436.00

, 62,105.00

0.00

771,322,774.00

1,358,795.00 118,089,816.00

0.00

75,798.00

2007

2,244,531.00 428,305,477.00

41,416.00

0.00

11 7,791.00

0.00

0.00

2,971,722.00

0.00

38,892,152.00

171.00

28,049.00

0.00

441.00

282.00

Unit

2,91 0,441.00 952,418,054.00

7,318.00

0.00

0.00

0.00

149,223.00

42.00

0.00

370.00

I0,390.00

42,905.00

0.00

51 I, 021.00

Value (RM)

I I0.00

0.00

2008 (Jan-OGO

482,951.00

0.00

0.00

2,444,554.00

0.00

13,039.00

0.00

11,030.00

0.00

715.00

178,560.00

2,614,405.00

61,416.00

5,543,612.00 934,679,138.00

0.00

171.00

47,214,227,00

3,145.00

120,511,858.00

0.00

Unit

546,022.00

0.00

493,669,657.00

0.00

0.00

48.00

5,983.00

70.00

3,800

221.00

9,562.00

7,483.00

99,145.00

186,241.00

314.00

183,865.00

484,246.00

1,684.00

0.00

2,704,684.00

0.00

42.00

141,128.00

7, , 51,628.00

0.00

50.00

700.00

1,707.00

7,530.00

0.00

224,004.00

0.00

I, 032,353, , 84.00

0.00

34,022.00

728.00

000

0.00

35.00

827.00

5,900,457.70

0.00

52.00

4.7 EXPORTS OF RUBBERWOODEKSPORT KAYU GETAH

Year

1979

1980

1981

1982

Sawntimber

Volume (in')

1983

1984

903.00

1985

17,515.00

1986

26,525.00

Sawlogs

1987

31,954.00

1988

53,522.00

28,757.00

1989

95,764.00

0.00

Total Volume

(in, )

I21,232.00

1990

1,130.00

I24.1 09.00

1991

165,902.00

I1.00

1992

114,323.00

1993

0.00

903.00

221,361.00

46,272.00

1994

0.00

103,478.00

27,655.00

1995

0.00

Sawntimber

31,965.00

1996

71,261.00

0.00

53,522.00

Value (RM)

1997

38,852.00

0.00

140,400.00

95,764.00

27,620.00

1998

0.00

121,232.00

6,971,824.00

4,470.00

45,297.00

1999

0.00

10,113,716.00

124,109.00

2000

33,095.00

0.00

16,744,725.00

165,902.00

2001

48,081.00

0.00

Sawlogs

29,120,000.00

114,323.00

2002

I6,349.00

0.00

2,505,260.00

37,950,000.00

221,361.00

2003

44,492.00

0.00

58,240,000.00

I03,478.00

0.00

I03,390.00

2004

0.00

Total Value

(RM)

97,250,000.00

71,261.00

2005

0.00

Soarce: Forestry Department Pani"sum, Malaysi^, (1980-2006)

82,380,000.00

2,500.00

8.00

105,944.00

369.00

38,852.00

0.00

98,700,000.00

I I 1,993.00

27,620.00

140,400.00

0.00

48,793,599.00

2,509,730.00

0.00

45,297.00

67,329.00

0.00

42,748,757.00

7,075,214.00

0.00

33,095.00

88,923.00

0.00

10,116,216.00

23, , 88,269.00

0.00

48,081.00

0.00

I6,744,725.00

I8,741,499.00

0.00

16,349.00

0.00

29,120,000.00

35,912,256.00

0.00

0.00

44,192.00

0.00

37,950,000.00

25, , 73,620.00

0.00

0.00

58,240,000.00

38.1 16,673.00

0.00

0.00

97,250,000.00

8.00

I5,094,397.00

0.00

I05,944.00

369.00

0.00

82,380,000.00

35,294,632.00

0.00

I I 1,993.00

98,700,000.00

0.00

67,329.00

48,793,599.00

15,591.00

0.00

88,923.00

42,748,757.00

289,680.00

83,158,446.00

0.00

23.1 88,269.00

91,569,989.00

0.00

I8,741,499.00

0.00

60,251,258.00

0.00

35,912,256.00

91,487,446.00

0.00

25.1 73,620.00

0.00

38.11 6,673.00

0.00

15,094,397.00

0.00

0.00

35,294,632.00

0.00

0.00

15,591.00

0.00

289,680,00

73

83,158,446.00

0.00

91,569,989.00

0.00

60,251,258.00

91,487,446.00

0.00

IMPORTSIM PORT

5.1

Country

IMPORTS OF WOODEN FURNITURE OF THE KIND USED IN THE KITCHEN BY COUNTRYIMPORT PERABOT KAYU YANG DIGUNAKAi. I DI DAFUR MENGIKUT NEGARA

Australia

Belgium

Bosnia-Herzegovina

Canada

China

Value(RM)

Croatia

2005

21,392.00

Denmark

\,\,

Ecuador

Egypt

0.00

Unit

Estonia

0.00

6,953,403.00

98.00

Finland

0.00

France

0.00

Value(RM)

127,747.00

Gabon

0.00

0.00

2006

22,576.00

90,741.00

Germany

0.00

32,852.00

196,311.00

Hong Kong

0.00

Hungary

Unit

0.00

323.00

India

0.00

5,769,624.00

0.00

Italy

0.00

0.00

0.00

1.00

49,331.00

Japan

17.00

13.00

Value (RM)

0.00

5,130.00

I, 406,289.00

3,428,946.00

Korea

0.00

0.00

103,843.00

2007

I27,420.00

Latvia

I02,664.00

0.00

0.00

22,769.00

50,574.00

I9,989.00

0.00

0.00

I I 0.00

42,324.00

596.00

16,028.00

I3,602.00

2,188,642.00

Unit

135,124.00

2,150.00

9.1 05,664.00

0.00

1,025.00

239.00

34,940.00

0.00

0.00

132.00

31,683.00

400.00

46.00

0.00

Value (RM)

4,543,623.00

404,341.00

936.00

2008 ( Jan-Oct)

I 1,674.00

0.00

0.00

1.00

1,730.00

0.00

259,333.00

250,457.00

0.00

0.00

643.00

11,146.00

0.00

0.00

0.00

444,161.00

387.00

22,129.00

0.00

0.00

0.00

24,654.00

1,503,893.00

0.00

3,920.00

35,209.00

Unit

36.01 5.00

11,963,241.00

0.00

0.00

1,370.00

28,521.00

82,437.00

0.00

0.00

36,774.00

96.00

3,939,027.00

0.00

246,262,00

645.00

0.00

0.00

0.00

83.00

14,005.00

769,711.00

0.00

88,743.00

0.00

1.00

325,751.00

82,584.00

215.00

I01.00

8.00

359.1 06.00

27,522.00

12,103.00

1,820,691.00

0.00

0.00

0.00

3,920,00

316.00

6,668.00

56,595.00

57,336.00

0.00

0.00

183.00

774.00

2,298,196.00

357,669.00

0.00

30.00

0.00

0.00

7,151.00

515.00

590,527.00

80.00

0.00

29.00

50,541.00

27,000.00

0.00

0.00

1,914,981.00

0.00

1,288.00

I69,672.00

4,221.00

25, I 54.00

I87,057.00

0.00

605.00

3,032.00

60.00

2,004.00

2,480.00

Country

Lithuania

Netherlands

Pakistan

Poland

Romania

Value(RM)

Slovakia

Spain

996,731.00

2005

Sweden

11 9,105.00

Switzerland

\,00

Taiwan

Unit

19,242.00

0.00

United Kingdom

0.00

2,417.00

United State ofAmerica

847,224.00

0.00

Value(RMI

I39,576.00

Total

0.00

522, , 20.00

Source: Malaysia External Trade Development Corporation (Matrade), 2008

2006

0.00

I 17,288.00

28,595.00

17,503.00

0.00

0.00

17,195.00

I3,373.00

1,164,019.00

8,655.00

341,557.00

Unit

6,247.00

27,968.00

16,982,481.00

18,754.00

135.00

0.00

I07.00

3,099.00

342.00

Value (RM)

205,588.00

14.00

223.00

564,874.00

2,252.00

2007

I73.1 52.00

22.00

I05,491.00

192.00

0.00

0.00

6,994.00

I, 672,365.00

32.00

9,842.00

339,230.00

Unit

0.00

7,086.00

I 13, I 04.00

17,003,149.00

0.00

1,952.00

40,970.00

0.00

0.00

381,656.00

Value (RM)

20.00

3,440.00

0.00

2008 Jan-Oct

1,729.00

I 17,570.00

751,259.00

12,649.00

173,100.00

484,360.00

62.00

0.00

145,872.00

766.00

3,488,755.00

53,365.00

14,881.00

2,050, , 00.00

Unit

2,798.00

24,143,647.00

12,655.00

0.00

14,430.00

1.00

0.00

1,300.00

8,529.00

97,876.00

9,880.00

73.00

I0,235.00

5,000.00

394,408.00

0.00

0.00

0.00

I, 050,297.00

35 I. 00

0.00

4,375.00

1,150,192.00

21,345,638.00

2.00

0.00

I5,879.00

0.00

36,983.00

419,339.00

5.2 IMPORTS OF WOODEN FURNITURE OF THE KIND USED IN THE OFFICE BY COUNTRYIMPORT PERABOT KAYU YANG DIGUNAKAN DI PEjABAT MENGIKUT NEGARA

Australia

C o u ntry

Bangladesh

Belgium

Canada

China

Value (RM)

Croatia

Denmark

I73,657.00

2005

Egypt

-. *I\O

Finland

0.00

France

Unit

30,608.00

0.00

3,783,566.00

Germany

I65.00

Hong Kong

Value (RM)

0.00

India

639,789.00

0.00

0.00

Italy

58,625.00

I57,090.00

2006

55.1 8.00

Japan

3.00

Korea

376,877.00

0.00

44,816.00

I I, 004.00

0.00

Kuwait

0.00

143,660.00

Unit

131,934.00

Lebanon

7,350,464.00

295,787.00

18.00

Lithuania

79.00

I, 248,017.00

6,027.00

3,045,793.00

Netherlands

0.00

2,282.00

Value (RM)

0.00

5,024.00

New Zealand

7,813,00

8,080.00

335,489.00

1,703.00

2007

I00,61 I. 00

Pakistan

2,599.00

8,832.00

80,51 0.00

0.00

9,038.00

40,617.00

7,405.00

655.00

847,883.00

19,526.00

870,876.00

Unit

0.00

274,900.00

1,200

2,928.00

0.00

6,732,314.00

372,562.00

0.00

1,450.00

0.00

5.00

29,189.00

1,366.00

2,407,299.00

0.00

66,392.00

72.00

Value (RM)

8,205.00

248,359.00

2008 ( Jan-OGO

0.00

0.00

6,275.00

1,366.00

908,784.00

693,482.00

0.00

355.00

195,678.00

0.00

4,740.00

0.00

0.00

27,383.00

0.00

1,352,144.00

154,383.00

61.00

244.00

0.00

0.00

0.00

1,666,00

42,106.00

Unit

13,409.00

199,810.00

0.00

0.00

60.00

7,629,883.00

I2,302.00

308,889.00

724,6700

0.00

0.00

329.00

964,277.00

5.155.00

0.00

0.00

9,153.00

54,716.00

316,306.00

18,184.00

0.00

1,546.00

23,336.00

0.00

0.00

10,869.00

758.00

82,010.00

590,429.00

13,501.00

2,256.00

122,273.00

15.00

22,053.00

24,124.00

0.00

6,783.00

16.00

1,450,774.00

0.00

1,313.00

474.00

24,802.00

0.00

553,048.00

13.00

332,772.00

32.00

0.00

320.00

21.00

58,339.00

666,003.00

0.00

0.00

58,371.00

0.00

52.00

92,528.00

0.00

2,600.00

480.00

28,097.00

6,968.00

0.00

83.00

6,133,00

1,313.00

0.00

1,846.00

26,605.00

79,073.00

0.00

0.00

30.00

0.00

2.00

0.00

0.00

0.00

612.00

0.00

0.00

0.00

Poland

Country

Slovakia

Spain

Sweden

Switzerland

Value (RM)

Taiwan

Turkey

317,365.00

2005

United Arab Emirates

445,896.00

United Kingdom

00o

United State ofAmerica

8,400.00

I, 937,200.00

Unit

Total

4,288.00

18,158.00

3,733.00

Source: Malaysia External Trade Development Corporation (Maimde), 2008

29,501.00

Value (RM)

28.00

I7,529.00

2,235,444,00

0.00

2006

51,770.00

799,491.00

0.00

35.00

I59,931.00

182.00

11,967,798.00

64,714.00

Unit

357,955.00

0.00

17,033.00

14,581.00

0.00

4,980.00

131,876.00

13.00

Value (RM)

393.00

130,090.00

I0,869.00

31.00

1,928.00

2,037,221.00

2007

23,696.00

229,593.00

0.00

6.00

330,076.00

261.00

16,654,465.00

Unit

433,877.00

32.00

17,517.00

0.00

82,920.00

0.00

5,506.00

3,032.00

218,974.00

Value (RM)

1,476.00

2008 ( Jan. Oct)

I79, , 57.00

0.00

2,209.00

172,683.00

69,099.00

0.00

183,220.00

47,105.00

4.00

5,513.00

833,770.00

I7,077, , 87.00

143,688.00

Unit

0.00

0.00

1,121.00

166,994.00

996.00

32,483.00

49.00

1,913,00

634.00

331,488.00

0.00

0.00

117.00

65,234.00

0.00

721.00

459,058.00

13,678,768.00

77.00

0.00

0.00

757.00

394.00

I71,570.00

5.3 IMPORTS OF WOODEN FURNITURE OF THE KIND USED IN THE BEDROOM BY COUNTRYIMPORT PERABOT KAYU YANG DIGUNAKAN DI DALAM BILIK MENGIKUT NEON^

Australia

Country

Bangladesh

Belgium

Bulgaria

Canada

Value (RM)

China

Czech

2005

00I^.

Denmark

0.00

Egypt

0.00

Unit

Estonia

154,036,00

0.00

Finland

89,736.00

12,821,008.00

0.00

France

Value (RM)

0.00

Germany

859,949.00

4,058,291.00

0.00

3,639.00

Hong Kong

2006

51,884.00

Hungary

92,417.00

109,477.00

27.00

India

45,339.00

0.00

6,846.00

Italy

556,996.00

Unit

587, t 64.00

0.00

3,401,087.00

32,813.00

Japan

I8,980.00

I0,490,927.00

49.00

Korea

843,786.00

18.00

I, 056,843.00

Lalvia

1,698,946.00

Value (RM)

0.00

I27.00

0.00

Lithuania

3,249,064.00

1,702.00

7,578.00

2007

I9,748.00

39,474.00

241,561,00

0.00

2,339,484.00

183.910.00

13.00

5,510.00

5,634.00

0.00

4,966.00

2,777,272.00

12,996.00

16,133.00

Unit

287,745.00

0.00

2,341,323.00

26,313.00

0.00

I8,240.00

13,216.00

0.00

10.00

1,347,764.00

574,919.00

9,732,620.00

4,013,713.00

35,977.00

42.00

Value (RM)

0.00

0.00

2,572,571.00

803,897.00

2008 ( Jan-Oct)

0.00

0.00

9,060.00

6,906.00

I, 470,299.00

246.00

9,490.00

I4.1 04.00

37,258.00

10.00

23,148.00

203,047.00

0.00

2.1 69,257.00

0.00

7,029.00

I05,504.00

27,433.00

0.00

88,370.00

0.00

1,368.00

I, 308,137.00

336,688.00

Unit

I I, 91 0.00

0.00

1,902,507.00

11,217,135.00

0.00

0.00

1,572.00

794,976,00

47.00

187,820.00

0.00

0.00

3,080,557.00

I, 794,624.00

0.00

7,495.00

876,100.00

0.00

25,430.00

0.00

598.00

2,979,00

8,927.00

39,114,00

0.00

13,652.00

123,261.00

30,456.00

0.00

0.00

9,378, , 40.00

I08,066.00

16,671,00

930.00

0.00

16,775.00

2,590.00

12,261.00

I I, 665.00

0.00

0.00

0.00

352,349.00

50.00

250.00

373,165.00

39,050.00

1,110,461.00

0.00

3,479,743,00

30.00

50.00

7,122.00

0.00

78,294.00

0.00

3,464,482.00

0.00

4,423.00

40.00

39,206.00

784.00

2,653.00

0.00

6,253.00

20.00

8,480.00

4,452,757.00

I97.00

,8,353.00

0.00

1.00

85.00

20,856.00

Netherlands

Country

Pakistan

Polarid

Romania

Russian Federation

Value (RM)

SaudiArabia

Slovakia

224,206.00

2005

Slovenia

12,548.00

10.136,291.00

South Africa

o0I\,

Spain

Unit

864,491.00

Sweden

1,426.00

57,418.00

Switzerland

24.00

3,573,497.00

77,369.00

Taiwan

Value (RM)

0.00

Turkey

4,413.00

121,834.00

2006

72,598.00

Ukraine

18,696.00

504.00

12,708,132.00

United Arab Emirates

14,089.00

7,980,016.00

24,479,00

United Kingdom

0.00

0.00

I, 226,669.00

Unit

United State ofAmerica

1,096.00

61,935.00

330,029.00

374.00

Total

39,168.00

252.00

6,559,853.00

81,886.00

Value (RM)

0.00

11,551.00

Source: Malaysia External Trade Development Corporation (Matrade), 2008

42,091.00

4.00

0.00

435,725.00

4,274.00

I, 563,113.00

2007

183,872.00

5,276.00

69.00

237,635.00

25,981.00

13,434,834.00

176.00

375,930.00

0.00

1,406,014.00

0.00

6,322,977.00

37,621.00

0.00

1,749,801.00

56,332,713.00

26.00

Unit

1,647.00

1,274.00

130,782.00

6.00

14,634.00

0.00

0.00

193,484.00

35.00

Value (RM)

0.00

I64.00

2,571,470,00

939.00

2008 ( Jan-OGO

4,039.00

38,170.00

0.00

220,850.00

9,947.00

442,555.00

305,915.00

0.00

16,148.00

229,409.00

836.00

10,198.00

0.00

271,389.00

74,342.00

409,483.00

56.00

I, 817,209.00

17,708.00

0.00

0.00

3,583,535.00

64.1 93.00

Unit

57,699,500.00 2,047,567.00

0.00

850.00

33,563.00

22.00

1,723.00

35,811.00

0.00

9,997.00

6.00

1,418.00

0.00

69.00

43,463.00

137.00

46,737.00

1,618.00

418,978.00

9,207.00

0.00

9.00

94,919.00

0.00

31.00

169,445.00

114,069.00

174.00

0.00

0.00

I I 1,986.00

I00,873.00

1.00

54,641,335.00

0.00

2.176.00

172.00

7.51 1.00

29,328.00

0.00

7.00

174.00

0.00

6,668.00

1,085.00

356,456.00

70.00

735, ,05.00 26,296,757.00

251.00

13.00

47,085.00

0.00

840.00

I 15,553.00

20.00

1,350.00

0.00

29.00

312.00

I82,745.00

RM

30,000,000.00

25,000,000,00

20,000,000.00

15,000,000.00

10,000,000.00

5,000,000.00

0.00

Value of import of wooden furniture of the kind used in kitchen

..Value of import of wooden furniture of the kind used in office

RM

18,000,000.00

16,000,000.00

14,000,000.00

12,000,000.00

10,000,000.00

8,000,000.00

6,000,000.00

4,000,000.00

2,000,000.000.00

2005 2006 2007 2008 ( Jan-Oct)Year

RM

70,000,000.00

60,000,000.00

50,000,000.00

40,000,000.00

30,000,000.00

20,000,000.00

10,000,000.00

0.00

Value of import of wooden furniture of the kind used in bedroom

^

2005 2006 2007 2008 ( Jan-Oct)Year

^=

2005 2006

83

2007

.2008 ( Jan-Oct)

Year

CONSUMrrio"PENGGUNAAN

6.1 ANNUAL CONSUMPTION OF RUBBERWOOD SAWNTIMBER GRADE A (in 31year)FENGGUNAAN KAYU GETAH GRED A SETAHUN (my tabun)

State

Johore

Kedah

Keiantan

Malacca

Negeri Sembilan

Pahang

I" x I"

7,691.44

Penang

31,599.69

Perak

Selangor

90.60

18,550.05

2" x 2"

Terengganu

7,604.74

Size

Sabah

I08.75

2,734.70

82,936.78

Sarawak

90.60

3" x 3"

Total

20,096.05

453.00

3,824.23

4,073.74

Source: Actual survey, 2007

2,200.00

137,016.50

0.00

630.17

12,868.74

90.60

4" x 4"

10,338.25

2,056.89

453.00

765.75

I, 460.24

400.00

Total

26,555.50

0.00

296.1 55.04

0.00

307.00

21,177.30

90.60

14,862.47

9,888.25

36,934.39

0.00

765.75

489.00

0.00

20,688.50

362.40

58,872.60

0.00

74,953.22

0.00

12,324.97

0.00

I08.75

765.75

574.75

83,873.95

20,788.50

0.00

5, ,028.30

10,693.74

906.00

6,297.73

205,049.00

765.75

507,49.92

0.00

45,258.48

3,063.00

467,395.04

0.00

87

6.2 ANNUAL CONSUMPTION OF RUBBERWOOD SAWNTIMBER GRADE B (in 31year)FENGGUNAAN 1<1. YU GETAH ORED B SETAHUN (my Labun)

State

Johore

Kedah

Keiantan

Malacca

Negeri Sembilan

Pahang

I" x I"

Penang

7,858.37

Perak

5,470.17

Selangor

0.00

Terengganu

2" x 2"

2,245.81

7,716.79

Size

Sabah

4,580.48

0.00

19,369.67

Sarawak

Total

3" x 3"

0.00

2,245.81

2,279.65

7.20

1,003.79

Source: Actual somey, 2007

3,612.48

2,919.00

0.00

322.67

4" x 4"

0.00

2,245.81

1,200.53

0.00

447.00

1,812.48

0.00

423.84

Total

0.00

0.00

307.67

38,874.01

0.00

I9,055.34

0.00

1,795.81

0.00

I5,475.61

0.00

402.60

0.00

0.00

0.00

0.00

0.00

0.00

8,533.24

15,736.59

0.00

0.00

402.60

20,000.01

0.00

o

0.00

0.00

454.20

88,48.21

0.00

2,232.83

0.00

2,919.00

0.00

5,211.42

o

0.00

0.00

68,670.23

88

6.3 ANNUAL CONSUMPTION OF RUBBERWOOD SAWNTIMBER GRADE C (in 31year)FENGGUNAAN KAYU GETAH ORED C SETAHUN (in'/tabun)

State

Johore

Kedah

Keiantan

Malacca

Negeri Sembilan

Pahang

I" x ,"

Penang

332.29

I2,559.89

Perak

Selangor

0.00

Terengganu

2" x 2',

1,019.50

332.29

Size

Sabah

12,253.64

0.00

Sarawak

244.00

3" x 3"

Total

0.00

0.00

658.00

332.29

I I, 739.39

Source: Actual survey, 2007

37.00

0.00

0.00

232.00

4" x 4"

0.00

0.00

658.00

332.29

0.00

9,787.39

0.00

37.00

Total

0.00

0.00

217.00

14,192.68

0.00

0.00

I, 329.16

208.00

46,340.31

0.00

0.00

37.00

0.00

0.00

0.00

0.00

0.00

0.00

, 3.5,2.93

2,543.5

0.00

0.00

0.00

31.00

0.00

693.00

0.00

0.00

, 2,983.68

0.00

0.00

142.00

0.00

0.00

0.00

I0,358.68

0.00

0.00

0.00

51,047.97

89

6.4 ANNUAL CONSUMPTION OF RUBBERWOOD SAWNTIMBER GRADE D (ms/year)FENGGUNAAN KAYU GETAH ORED D SETAHUN (myrahun)

State

Johore

Kedah

Kelantan

Malacca

Negeri Sembilan

Pahang

I" x I"

Penang

8,156.00

Perak

2,400.00

Selangor

0.00

Terengganu

2" x 2"

0.00

0.00

Sabah

Size

0.00

0.00

Sarawak

0.00

12.00

Total

0.00

3" x 3"

0.00

0.00

3,750,00

0.00

0.00

Source: Actual survey, 2007

0.00

0.00

0.00

0.00

4" x 4"

0.00

0.00

0.00

6.00

0.00

0.00

0.00

0.00

Total

0.00

0.00

0.00

14,318.00

0.00

0.00

0.00

8.156.00

0.00

6.00

2,400.00

0.00

0.00

0.00

0.00

0.00

6.00

0.00

0.00

0.00

0.00

0.00

0.00

0.00

0.00

12.00

0.00

6.00

0.00

0.00

3,762.00

0.00

0.00

0.00

0.00

0.00

0.00

14,330.00

90

6.5 NUMBERS OF WOODEN FURNITURE MILL USING RUBBERwooD As RAW MATERIALBILANGAN KILANG PER, \BOT KAYU YANG MENGGUNAKAN KAYU GETAH SEBAGAI BAHAN MENTAH

State

Johore

Kedah

Kelantan

Malacca

Negeri Sembilan

Pahang

Penang

Perak

Selangor

Terengganu

No. of manufacturer

Sabah

Sarawak

18

Total

15

Source: ACmal survey, 2007

17

11

2

17

8

3

o

94

91

6.6 VOLUMES OF RUBBERWOOD LOGS PROCESSED BY WOODEN FURNITURE MILL (in 31month)PEMPROSESAN KAYU GETAH OLEH FENGILANG PEERBOT KAYU (in'foulan)

State

Johore

Kedah

Kelantan

Malacca

Negeri Sembilan

Pahang

Penang

Perak

Selangor

Processing capacity

Terengganu

Sabah

7,950.90

Total

30,154.41

Source: Actual survey, 2007

362.50

12,291.06

667.00

7,742.62

1,070.00

2,777.63

I7,617.02

4,241.74

617.00

85,491.88

92

6.7 RUBBERWOOD INSTALLED CAPACITY OF WOODEN FURNITURE MILL (in3)KAPASITI MAKSIMA PEMPROSESAN KAYU GETAH OLEH PENCILANG PERABOT KAYU (in')

State

Johore

Kedah

Keiantan

Malacca

Negeri Sembilan

Pahang

Penang

Perak

Selangor

Terengganu

Sabah

Installed capacity

Total

8,925.00

Source: Actual survey, 2007

40, I 09.87

453.12

15,572.22

800.00

12,755.81

1,406.00

6,250.19

23,445,71

5.20.98

634.00

It 5,472.90

93

6.8 CONSUMPTION OF RUBBERWOOD (RMIm3)FENGGUNAAN KAYU GETAH (RMIm')

Year

1982

1983

1984

1985

1986

1987

1988

1989

Logs

190,496

1990

II 3,014

1991

165,974

1992

209,964

1993

227,251

Sawntimber

1994

162,984

1995

189,390

189,926

1996

I I 1,400

210,746

1997

162,372

1998

198,427

o

1999

Total

225,588

o

2000

379,886

162,582

o

2001

224,414

17 I, 685

o

2002

328,346

210,746

I95, , 14

o

2003

408,391

366,682

Source: Forestry Department Peninsular Malaysia, (1983-2006)

2004

452,839

576,306

o

2005

325,566

409,317

o

361,611

643,214

o

421,492

558,068

o

195,114

572,580

o

276,631

549,606

o

430,105

546,557

o

291,345

582,946

o

529,053

511,010

o

390,228

421,201

o

643,313

489,378

I, 006,411

446,857

700,662

499,533

1.1 72,267

549,272

979,269

476.1 I9

1,061,958

996,463

I, 046,090

94

1,132,218

987,129

6.9 CONSUMPTION OF OTHER SPECIES BY WOODEN FURNITURE MILL (in3)PENGGUNAAN SPESIES LAIN OLEH FENGILANG PEERBOT KAYU (in')

SpeciesAcacia

A1an Batu/Meraka

Balau

Balau Kumus Hitam/Gengal batuBalau KuningBalau Meinbatu/Meinbatu

Baiau Merah

Beech

Belian

BintangorBungorChengalDarnar Hitam Iseraya KitamDarnar Minyak

Survey

Durian

GeronggangJati

JelutongKapurKasai

KedondongKelat

Kernbang Semangkok

Consumption (in )

KernpasKeranjiKeruing

18.1 30

Kulim

1,166

Light Red Me ranti

5,509

MahoganyMedang

85

Melayar

247

MeIunak

345

Meinpisang

719

Mengkulang

188

Meranti

16,510

914

Me ranti I SerayaMerenti Bukit

2

Me ranti Kuning

832

Merenti MeIantai/MeIantai

23

Me ranti Merah

37,070

50

Me ranti Putih

1,971

Merawan

3,630

Merbau

3,334

351,251

MeinauhMersawa

1,812

2,281

3,470

30

87,064

450,444

2,902

75

1,50086

36

888

94

326

160,612

10

95

27

63

261

933

3,729

I3,373

145

2,897544

SpeciesMixed Hardwood

Mixed Light HardwoodMixed Medium Hardwood

Mixedwood

NYatohOak

Pauh KlangPerupokPine

PoplarPoplar KuningPulai

Rainin

RengasResak

Seiangan BatuSesendok

Surian Batu

Terap NasiTualang/MenggarisOther

TOTAL

Consumption (in )

Species

3,507

Acacia

43,693

Balau

4,552

Bintangor

2,302

Cengal

I2.1 43

Chapca

1,055

Chengal batuJati

3,892

33

Kapur

5,920

Kayu batu

Global Positioning System (GPS)

4,387

Kayu Chapca/Malaysia

2,100

Kernpas

4,378

Kulim

Meranti

32

Merbau

Merpauh

5

3,352

MHW

16

3,262

MLHW

N yato h

130

Red Me ranti

Seraya

65

1,270,729

TOTAL

5

Source: Actual survey, 2007-2008

326

Consumption (in3)362

4

181

o

22

4

5

2

19

74

o

96

85

6

2

725

392

15

60

1,965

5

I. Malaysia Industry Development Authority (MIDA), 2008, http://WWW. inida. gov. my/

ii, Malaysia External Trade Development Corporation (Matrade), 2008,

http://WWW. matrade. gov. my/

in. Malaysia Timber Council (MTC), 2000-2006, http://WWW. rutc. gov. my/

iv. Malaysia Timber Industry Board (MTIB), 2008, http://WWW. intib. gov. my/

v, Forestry Statistics Peninsular Malaysia, 1980-2006, Department of Statistics,

Malaysia, Kuala Lumpur.

REFERENCES

97

^ ~^

00

\O at

\I

V.

19

,*,

^ ^ Q ^


Recommended