C-13 NMR 71 Chem 355 Jasperse C-13 NMR I. Introduction to Spectroscopy Spectroscopy involves gaining information from the absorption, emission, or reflection of light from a sample. There are many other examples of spectroscopy in our experience, but three familiar real-life examples include: 1. X-rays. Dense bone absorbs x-ray radiation. 2. Grocery store scanners. A monochromatic laser is either absorbed (black bar) or reflected (white bar). The simple black-or-white lines with their yes-or-no absorption-or-reflection response essentially produces a binary code, from which products and prices can be determined. 3. Stop lights. A lens is adjusted at timed intervals to enable emission of green, red, or yellow light. In organic chemistry, the most important type of spectroscopy is “NMR” (“Nuclear Magnetic Resonance” spectroscopy). NMR spectroscopy is routinely used for chemical analysis, whether to identify the structure of an unknown, to assess the purity of a product, or to determine ratios of isomers. This week we will use carbon-13 NMR; later we will use hydrogen NMR. Both of these will be used later in the year, especially during second semester lab. During second semester lecture, we will revisit NMR and spend time and a test on interpretation of NMRs. Magnetic Resonance Imagine (“MRI”) is an important hospital application of NMR. (The name was changed from NMR to MRI because some patients were afraid of the word “nuclear”!) II. General Aspects of Spectroscopy Physics The fundamental principles of chemical spectroscopy are illustrated below. Spectroscopy involves having quantized energy levels. You are familiar with the concept of quantized energy levels for electrons (1s, 2s, 2p, 3s, 3d etc.) and electron spins (spin up or spin down), but other things are also quantized (vibrational energies, rotational energies…). Given that there is an exact energy gap between two quantized energy states, a photon of precise energy must be absorbed in order to excite a molecule from the ground state. When an excited state relaxes back to the ground state, that same photon is released. By measuring the exact frequencies of photons that are either absorbed or emitted, we can measure ∆E. The quantity of photons can tell us about how much material is absorbing or emitting. The chemist must then be able to interpret what the frequencies of the photons mean in terms of chemical structure. X hv energy "exites" X falls down "relaxes" X General Picture of Energetics and Spectroscopy 1. Quantized Energy Gaps 2. When a photon with exactly the right energy/frequency/wavelength is absorbed, a sample gets "excited" from its "ground state" to an "excited state" 3. When an exited state "relaxes" back to its ground state, the same ∆E is involved, and a photon with the same energy/frequency/wavelength is released ∆E = hv ∆E = hv
Transcript
C-13 NMR 71 Chem 355 Jasperse C-13 NMR I. Introduction to Spectroscopy Spectroscopy involves gaining information from the absorption, emission, or reflection of light from a sample. There are many other examples of spectroscopy in our experience, but three familiar real-life examples include:
1. X-rays. Dense bone absorbs x-ray radiation. 2. Grocery store scanners. A monochromatic laser is either absorbed (black bar) or reflected
(white bar). The simple black-or-white lines with their yes-or-no absorption-or-reflection response essentially produces a binary code, from which products and prices can be determined.
3. Stop lights. A lens is adjusted at timed intervals to enable emission of green, red, or yellow light.
In organic chemistry, the most important type of spectroscopy is “NMR” (“Nuclear Magnetic Resonance” spectroscopy). NMR spectroscopy is routinely used for chemical analysis, whether to identify the structure of an unknown, to assess the purity of a product, or to determine ratios of isomers. This week we will use carbon-13 NMR; later we will use hydrogen NMR. Both of these will be used later in the year, especially during second semester lab. During second semester lecture, we will revisit NMR and spend time and a test on interpretation of NMRs. Magnetic Resonance Imagine (“MRI”) is an important hospital application of NMR. (The name was changed from NMR to MRI because some patients were afraid of the word “nuclear”!) II. General Aspects of Spectroscopy Physics The fundamental principles of chemical spectroscopy are illustrated below. Spectroscopy involves having quantized energy levels. You are familiar with the concept of quantized energy levels for electrons (1s, 2s, 2p, 3s, 3d etc.) and electron spins (spin up or spin down), but other things are also quantized (vibrational energies, rotational energies…). Given that there is an exact energy gap between two quantized energy states, a photon of precise energy must be absorbed in order to excite a molecule from the ground state. When an excited state relaxes back to the ground state, that same photon is released. By measuring the exact frequencies of photons that are either absorbed or emitted, we can measure ∆E. The quantity of photons can tell us about how much material is absorbing or emitting. The chemist must then be able to interpret what the frequencies of the photons mean in terms of chemical structure.
X
hv energy
"exites"
X
falls down
"relaxes"
X
General Picture of Energetics and Spectroscopy
1. Quantized Energy Gaps2. When a photon with exactly the right energy/frequency/wavelength is absorbed, a sample gets "excited" from its "ground state" to an "excited state"3. When an exited state "relaxes" back to its ground state, the same ∆E is involved, and a photon with the same energy/frequency/wavelength is released
∆E = hv∆E = hv
C-13 NMR 72 III. NMR Physics Certain nuclei (not all) have quantized “nuclear spins”. Being charged objects that spin, a result is that they are magnetic. (A circular flow of charge or electricity always produces a magnetic field, according to the “right hand rule” of electromagnetism.) Nuclei that have quantized spin states are referred to as “NMR active”. Just as electrons have quantized spin states (spin up or spin down), NMR-active nuclei also have quantized spin states, spin up or spin down.
Some NMR-active nuclei: H-1, C-13, N-15, F-19, P-31, Si-29, Se-79, Sn-119 Some NMR-inactive nuclei: C-12, N-14, O-16
The list of NMR inactive nuclei is somewhat unfortunate for organic chemistry! We are largely interested in the chemistry of carbon and the 2nd row elements, but unfortunately the dominant isotopes for carbon, nitrogen, and oxygen are all NMR inactive! Fortunately at least carbon-13 is active. Although only 1% of carbons are C-13, that’s still enough to give us useful information. Hydrogen is also NMR active, and can give us a lot of information (later…). In the presence of an applied magnetic field, nuclear magnets can align with (spin down, �) or against (spin up, �) the field. The energy gap between these spin states is quantized, and depends on the strength of the magnetic field. (As with a bar magnet, the stronger the field, the greater the preference for the magnet to line up correctly…). To “excite” a nucleus from the more stable �state to the less stable �state, radiation with the correct photon frequency is required. When an excited nucleus relaxes back to the �state, a photon with that same frequency is emitted. Since magnetic field strength determines ∆E, and ∆E determines v, the magnetic field thus determines the frequency of the radiation absorbed or emitted.
When an external magnetic field is applied, will all nuclei have the same ∆E and the same photon frequency? No!
1. Different nuclei (H-1 versus C-13) have very different ∆E. Thus an MRI can easily identify whether a particular nuclei is or is not present.
2. In different chemical environments, the same nucleus will have different ∆E. The second point is the key to 13C NMR. Although the external magnetic field (applied by the
spectrometer) may be the same, different carbons in a molecule experience or “feel” difference magnetic fields. This is due to the magnetic fields produced by local electrons and by other nuclei (because moving electrons function as “electron magnets” and moving nuclei function as “nuclear magnets”). The magnetic influence of local electrons and nuclei can reinforce or partially counteract the external field, so that every different carbon “feels” a different Hactual. (H = magnetic field)
1. Spin states are equal in energy in the absence of magnetic field2. As the magnetic field increases, the difference between the two increases3. Since field determines ∆E, and ∆E determines v, the magnetic field thus determines the frequency of the radiation absorbed or emitted when nuclei get exited or relax
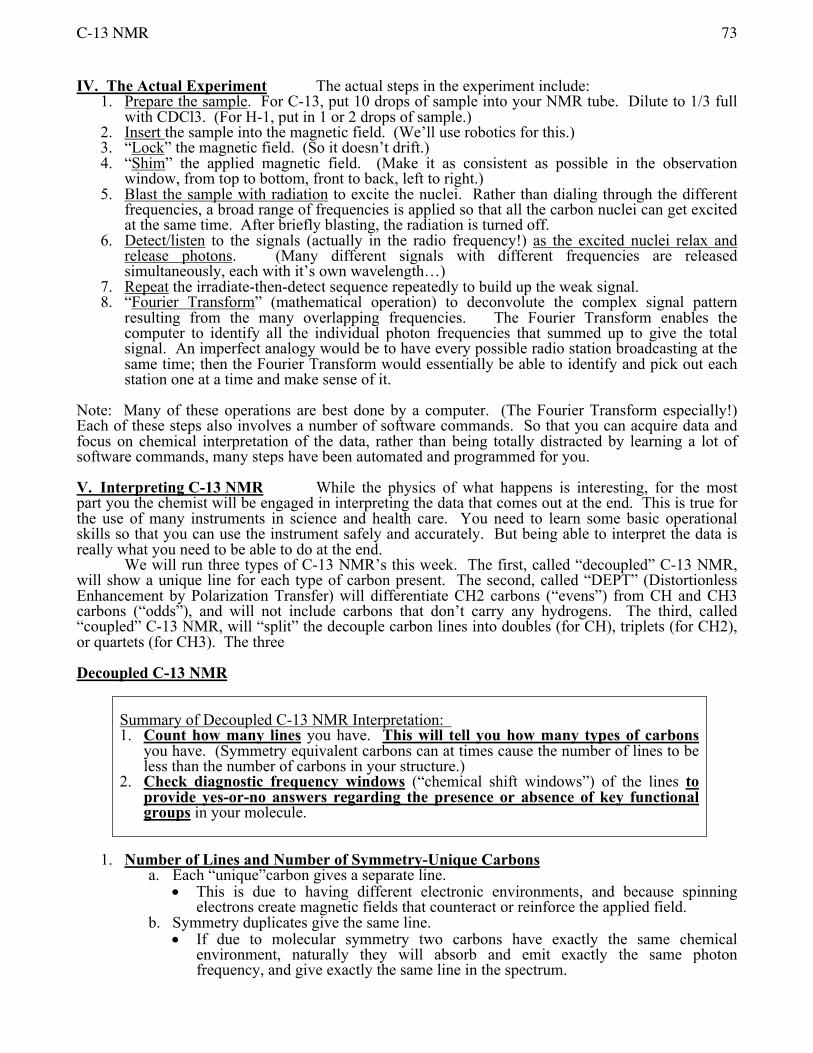
C-13 NMR 73 IV. The Actual Experiment The actual steps in the experiment include:
1. Prepare the sample. For C-13, put 10 drops of sample into your NMR tube. Dilute to 1/3 full with CDCl3. (For H-1, put in 1 or 2 drops of sample.)
2. Insert the sample into the magnetic field. (We’ll use robotics for this.) 3. “Lock” the magnetic field. (So it doesn’t drift.) 4. “Shim” the applied magnetic field. (Make it as consistent as possible in the observation
window, from top to bottom, front to back, left to right.) 5. Blast the sample with radiation to excite the nuclei. Rather than dialing through the different
frequencies, a broad range of frequencies is applied so that all the carbon nuclei can get excited at the same time. After briefly blasting, the radiation is turned off.
6. Detect/listen to the signals (actually in the radio frequency!) as the excited nuclei relax and release photons. (Many different signals with different frequencies are released simultaneously, each with it’s own wavelength…)
7. Repeat the irradiate-then-detect sequence repeatedly to build up the weak signal. 8. “Fourier Transform” (mathematical operation) to deconvolute the complex signal pattern
resulting from the many overlapping frequencies. The Fourier Transform enables the computer to identify all the individual photon frequencies that summed up to give the total signal. An imperfect analogy would be to have every possible radio station broadcasting at the same time; then the Fourier Transform would essentially be able to identify and pick out each station one at a time and make sense of it.
Note: Many of these operations are best done by a computer. (The Fourier Transform especially!) Each of these steps also involves a number of software commands. So that you can acquire data and focus on chemical interpretation of the data, rather than being totally distracted by learning a lot of software commands, many steps have been automated and programmed for you. V. Interpreting C-13 NMR While the physics of what happens is interesting, for the most part you the chemist will be engaged in interpreting the data that comes out at the end. This is true for the use of many instruments in science and health care. You need to learn some basic operational skills so that you can use the instrument safely and accurately. But being able to interpret the data is really what you need to be able to do at the end. We will run three types of C-13 NMR’s this week. The first, called “decoupled” C-13 NMR, will show a unique line for each type of carbon present. The second, called “DEPT” (Distortionless Enhancement by Polarization Transfer) will differentiate CH2 carbons (“evens”) from CH and CH3 carbons (“odds”), and will not include carbons that don’t carry any hydrogens. The third, called “coupled” C-13 NMR, will “split” the decouple carbon lines into doubles (for CH), triplets (for CH2), or quartets (for CH3). The three Decoupled C-13 NMR
Summary of Decoupled C-13 NMR Interpretation: 1. Count how many lines you have. This will tell you how many types of carbons
you have. (Symmetry equivalent carbons can at times cause the number of lines to be less than the number of carbons in your structure.)
2. Check diagnostic frequency windows (“chemical shift windows”) of the lines to provide yes-or-no answers regarding the presence or absence of key functional groups in your molecule.
1. Number of Lines and Number of Symmetry-Unique Carbons a. Each “unique”carbon gives a separate line.
• This is due to having different electronic environments, and because spinning electrons create magnetic fields that counteract or reinforce the applied field.
b. Symmetry duplicates give the same line. • If due to molecular symmetry two carbons have exactly the same chemical
environment, naturally they will absorb and emit exactly the same photon frequency, and give exactly the same line in the spectrum.
C-13 NMR 74
2. “Chemical Shifts” of the Lines (This reflects the energies or photon frequencies/wavelengths associated with the lines.)
220-160 C=O carbonyl carbons, sp2 hybridized 160-100 C alkene or aromatic carbons, sp2 hybridized 100-50 C-O oxygen-bearing carbons, single bonds only, sp3 hybridized 50-0 C alkyl carbons, no oxygens attached, sp3 hybridized
a. Notice that sp2 hybridized carbons come above 100, sp3 hybridized come below b. Notice that oxygenated carbons come higher than non-oxygenated analogs. An sp3-
hybridized carbon with an oxygen comes higher than without, just as an sp2-hybridized carbon comes higher with oxygen than without
c. How do I process and use what I see from my Chemical Shifts? • Check each of the four zones. Each one gives you a yes or no
answer about the presence of absence of the featured group. • Check 220-160. Do I have any carbonyl carbons or not? Easy yes or no question. • Check 160-100. Do I have any alkene/aromatic carbons? Yes or no! If I do, then
how many? If I have two, I probably have an alkene! If I have four to six, I probably have a benzene!
• Check 100-50. Do I have an oxygenated sp3 carbon? Yes or no! Alcohols and esters will normally have one carbon in the 100-50 zone. Ethers will have two.
• Check 50-0. I’ll almost always have some lines there! But how many should tell me how many types of non-oxygenated sp3 carbons I have.
Using Chemical Shifts to Identify Functional Groups in Simple Molecules:
1. An alcohol should show one carbon in the 50-100 zone. 2. A ketone should show one carbon in the 160-220 zone. 3. An ester should show one carbon in each of the 50-100 and the 160-220 zones. 4. An aromatic should show at least four different carbons in the 100-160 zone.
3. Signal Height/Size Two tips: a. Carbons without attached H’s are short. This is common for carbonyls and for
substituted carbons in a benzene ring. b. Symmetry duplication amplifies signal height. (If you have two copies of a carbon, the
line will probably be taller than normal!)
4. Subtracting the Solvent Lines: Don’t Count the 3-Line Triplet at 77 Our samples are routinely diluted with CDCl3, which has a carbon and thus gives a signal. Usually lots more solvent gets used than solute, so potentially the solvent lines could dominate. Fortunately deuterated carbons give a different look: CDCl3 will give a 3-line “triplet” signal at 77. Ignore this signal! Don’t count it as three more unique carbons in your molecule! Don’t conclude that you have three oxygenated sp3 carbons!
OHOH
OH
BrBr Br
How Many Lines per Structure?(Mark any symmetry duplicates)
A B
C D E F
C-13 NMR 75
5. How do I know what’s a real line, from a carbon in my compound from an impurity that I should ignore? No simple way! With experience or some advanced experiments you can often tell, but there is no automatic way to know. For today, if in doubt ask the instructor! The instructor will confirm which lines you should or shouldn’t consider in doing your analysis
Practical Use of Decoupled C13 NMR:
• How many lines/carbons do I have? • How many are carbonyls (160-220), how many are aromatic (100-160), how
many are oxygenated (50-100), and how many are non-oxygenated (0-50)? • Do the chemical shifts suggest ketone, ester, aromatic, or alcohol?
DEPT NMR: Distinguishing C and CH2 carbons from CH and CH3 carbons. The DEPT experiment is done in conjunction with a decoupled C-13 NMR. While more elaborate and even more informative versions of DEPT are available, at the cost of extra time, this week we will use a basic version (called DEPT 135).
Use the following DEPT clues:
• CH2 carbon lines will usually point down • CH and CH3 carbon lines will usually point up • Carbons with no directly attached hydrogens will not appear.
Practical: Look at your decoupled C13 spectrum beside your DEPT spectrum.
• Which carbons are “quaternary” carbons? (the ones with no hydrogens vanish from your DEPT spectrum.
o These are usually carbonyls or substituted aromatic carbons. • Which carbons are CH2 carbons?
o Are any of these oxygenated? (in the 50-100 zone)? • How many CH/CH3 carbons do you have, and in which zones?
Coupled C-13 NMR Whereas “decoupled” C-13 NMR spectra show nice sharp singlet lines for each type of carbon, “coupled” C-13 spectra show the following:
• CH3: four lines (“quartet”) • CH2: three lines (“triplet”) • CH: two lines (“doublet”) • C (no hydrogens): one line (“singlet”)
The information is complementary to DEPT information in that both help to differentiate among different carbons. Coupled C-13 is not used real often in the real world for at last two reasons:
• Signal to noise: The signal to noise is a lot worse than in decoupled C-13 or DEPT NMR, and the cost of improving the signal-to-noise is taking more time.
• Overlap: With coupled C-13 NMR, there are a lot more lines, and overlapping of lines becomes normal and confusing for non- simple molecules.
Practical: Use the coupled carbon can differentiate CH3 from CH carbons
C-13 NMR 76
C13-NMR Interpretation
1. Count how many lines you have. This will tell you how many types of carbons you have. (Symmetry equivalent carbons can at times cause the number of lines to be less than the number of carbons in your structure.)
a. Each “unique”carbon gives a separate line. b. Symmetry duplicates give the same line. c. If there are more carbons in your formula than there are lines in your spectrum, it means
you have symmetry.
2. Check diagnostic frequency windows (“chemical shift windows”) of the lines to provide yes-or-no answers regarding the presence or absence of key functional groups in your molecule.
220-160 C=O carbonyl carbons, sp2 hybridized 160-100 C alkene or aromatic carbons, sp2 hybridized 100-50 C-O oxygen-bearing carbons, single bonds only, sp3 hybridized 50-0 C alkyl carbons, no oxygens attached, sp3 hybridized
3. Use DEPT and/or Couple C13 NMR to Differentiate C, CH, CH2, and CH3 carbons.
Type of C Name DEPT-135 Coupled C13 CH3 Methyl Up Quartert (q) CH2 Methylene Down Triplet (t) CH Methane Up Doublet (d) C (no attached hydrogens)
Quaternary Absent Singlet (s)
4. Aromatics, Symmetry, and C-13 Signals. Most aromatics have symmetry, and both the number
of aromatic lines and the splitting of the aromatic lines can be indicative of the substitution pattern on a benzene. Mono- and para-disubstituted benzenes have symmetry.
4 lines s, d, d, d Monosubstituted benzene. (Has symmetry) 4 lines s, s, d, d Para-disubstituted benzene. (Has symmetry) 6 lines s, s, d, d, d, d Ortho- or meta-disubstituted benzene.
(Has no symmetry) 5. Signal Height/Size
a. Carbons without any attached H’s are short. This is common for carbonyls (aldehydes are the only carbonyl carbons that have hydrogens attached) and for substituted carbons in a benzene ring.
b. Symmetry duplication multiplies signal height (if you have two copies of a carbon, the line will probably be taller than normal!)
C-13 NMR 77 User’s Guide to NMR, 2021 Without Autosampler: Draft 2/1/2021. Help: Dr. Jasperse, Hagen 407J, 477-2230 1. Prepare sample in lab; add sample to sample-holder; adjust sample depth using golden depth finder 2. Eject/Insert (Sample Exchange):
a. Hit “eject” button (below black field) to eject existing sample. (If not visible, click “start” button to make it so)
b. Manually lift out sample-in-sample-holder combination from the probe (place it in a box) c. Place your sample-in-sample-holder into the probe d. Hit “insert” button on the computer. (Wait ≥5 seconds before proceeding with step 3a).
3. Spot Assignment: (Each sample needs to be assigned a sample spot number)
a. Right-click on the lowest-numbered gray spot number in the zones map. (A pulldown will appear) b. Select “Sample in Magnet” (3rd line from the bottom of the pulldown); c. Enter your spot number into the upper field. (Remember your spot number) d. Hit OK.
4. NMR-Experiment Submission:
a. Click “New Study” button in lower left. (A yellow experiment file-name will appear). b. Left-mouse single-click on your sample spot. (A white circle will appear around the sample spot) c. Enter student name(s) into Sample Name field, which is underneath the black field d. Submit: click the green “Submit” button on the lower left side. (your sample spot should turn color) e. Hit “Cancel” to leave submit-sample mode.
a. Don’t forget to do this. If you do, it will cause problems for both you and the ensuing user. b. The yellow experiment file-name will disappear; unfortunately the zones map will too.
f. Re-open “zones” map: Click on little circle icon ( ) to the upper left of the big gray/black panel, and the zones map with all the sample spot numbers should re-open.
a. Note: An experiment should take about 7 minutes. b. There should be an automatic one-page printout upon completion.
C-13 NMR 78
5. Printing an extra copy of spectrum (in case you have a partner) • Must be in zones-map display. If not, click on little circle icon ( )upper left of the spectra-display panel. a. Right click on sample number, and a pulldown will appear b. Click “Show Study” c. Double click on green “PROTON_01” file that will appear in the lower left-hand area. (below your name)
c. Your spectrum should now appear in the display field, where the zones-map appeared before d. Click “Process” button underneath the spectrum display field. (“Start” was highlighted previously) e. Click blue-text-on-white-background “Print” button on lower right to print another copy.
6. Horizontal Expansions
a. Steps 5a-d above describe how to get your spectrum loaded into the display field. b. With spectrum displayed on screen, use a panel of display icons on the far upper right c. Click on the magnifying glass icon (6th icon down, ) d. Move your cursor to the left end of the zone you want to expand, then hold down left mouse
button and slide it to the other end of the zone you want to expand, then release the button. a. To return to the full display, you can either click on the 3rd icon ( ) or the 5th icon ( ). e. Click blue-text-on-white-background “Print” button on lower right to print a copy. (Twice for 2
copies)
7. Exiting so that NMR is Ready for the Next user
a. Click “Start” button underneath the spectrum display field. (“Process” was highlighted previously) b. Re-open “zones” map: Click on little circle icon ( ) to the upper left of the big gray/black panel, and the
zones map with all the sample spot numbers should re-open.
C-13 NMR 79 Chem 355 C-13 NMR Lab (Jasperse): The Experiment General: Each pair should obtain spectra and identify at least two of the unknowns. Each individual must have run one of the two samples. (If you don’t have or want a partner, just prepare and run two yourself.) Queued Samples: Samples can be queued up and run in automated sequence on lab day. Once the sequence is running, (assuming no problems), each sample will require five minutes combined. (This includes loading from the autosampler; running the decoupled carbon; running the DEPT; and running the coupled carbon.) All 24 students could have their samples run within 2 hours. Individual Samples and Signing up for NMR Time: A paper signup sheet will be in the NMR lab. If you don’t want to wait and run in the lab-day sequence queue, you could sign up for a time later on your own. A typical student should be able to finish within 15 minutes. I’m often gone after 6 pm, so running during daytime hours when I can help you if you get stuck is probably smart. Prepare the sample 1. Put 0.2 mL of sample into an NMR tube.
• The exact loading volume is not critical. 2. Then add 0.8 mL of CDCl3 solvent. Again, the exact volume is not critical. 3. Put a cap on the sample. Load and Run the Samples, and Print the Results: See the NMR Usage Instructions.
• For this week, you will run the sequence of experiment called C-DEPT Printing note:
• The instrument can auto-print the three spectra, but you will also want to print copies for your partner.
• A copy machine could be used to do this, or • The prints could be done from the NMR, see the NMR Usage Instructions
Unknown Candidates
O O O O
O
O
O
O
O
O
O
O
OHOH
OH OHOH
H
O O O O
Simple Ketones
Esters
Alcohols
Aromatic Carbonyls
C-13 NMR 80 C-13 NMR Lab Handin Name For each of the two unknowns that you will analyze, hand in the following:
1. For each of the 15 unknown candidates shown on the next page, predict how many carbons you’d get for each box. Hand in this page.
2. Attach the six NMR’s that you should have printed. These should be:
a. The decoupled C13 NMR for your sample b. The DEPT spectrum for your sample c. The coupled C13 NMR for your sample. d. The decoupled C13 NMR for your partner’s sample e. The DEPT spectrum for your partner’s sample f. The coupled C13 NMR for your partner’s sample.
3. Directly on each the two decoupled NMR’s, write down which unknown it was. (“Unknown
A”, “Unknown B”….).
4. Then draw the chemical structure for each of the two unknown, again directly on the decoupled NMRs.
5. Write a letter by each of the carbons in your structures (see examples below)
6. Next to each carbon line in the decoupled NMR, assign the letter of the carbon that best fits.
• Note: in some cases there will be ambiguity. So for example, you might have two lines in the same zone and write “C or D” by each of them, for example.
Example of drawing molecules and then Lettering each of the Carbons
Unknown Candidates
O
B CDE
A O
OA
B D
E
F
C
O O O O
O
O
O
O
O
O
O
O
OHOH
OH OHOH
H
O O O O
Simple Ketones
Esters
Alcohols
Aromatic Carbonyls
C-13 NMR 81 C-13 NMR Lab Handin Name A. For each Structure, fill in the number of carbons under each category column. Information from Decoupled C13 DEPT Information Coupled Info Structure C’s C=O Aryl C-O 0-50 C CH2 CH/CH3 CH CH3 1.