31
I-MANAGER INSTALLATION GUIDE & I-MONITOR USER MANUAL www.i-energyinc.com
Important Information: The instructions in this manual provide a comprehensive overview of:
1. The installation and maintenance of the i-Energy i-Manager device. 2. A step by step user manual for the i-Energy i-Monitor communication platform.
Warning symbol
Safety Instructions:
Please read and understand all instructions and cautionary measures in this manual prior to installing i-Manager device.
Please follow all local electrical regulations, codes and procedures when installing electrical devices.
Please follow all regional and local safety regulations codes and procedures when installing electrical devices.
Note:
The i-Manager is a non-serviceable device. Do not attempt to open, repair or otherwise alter the internal workings of the i-Manager device. Doing so will void all warranties and alleviate i-Energy of any claims resulting in i-Manager defects. If i-Manager device is faulty and fails to function according to the description provided in this manual please contact i-Energy at www.i-energyinc.com for assistance.
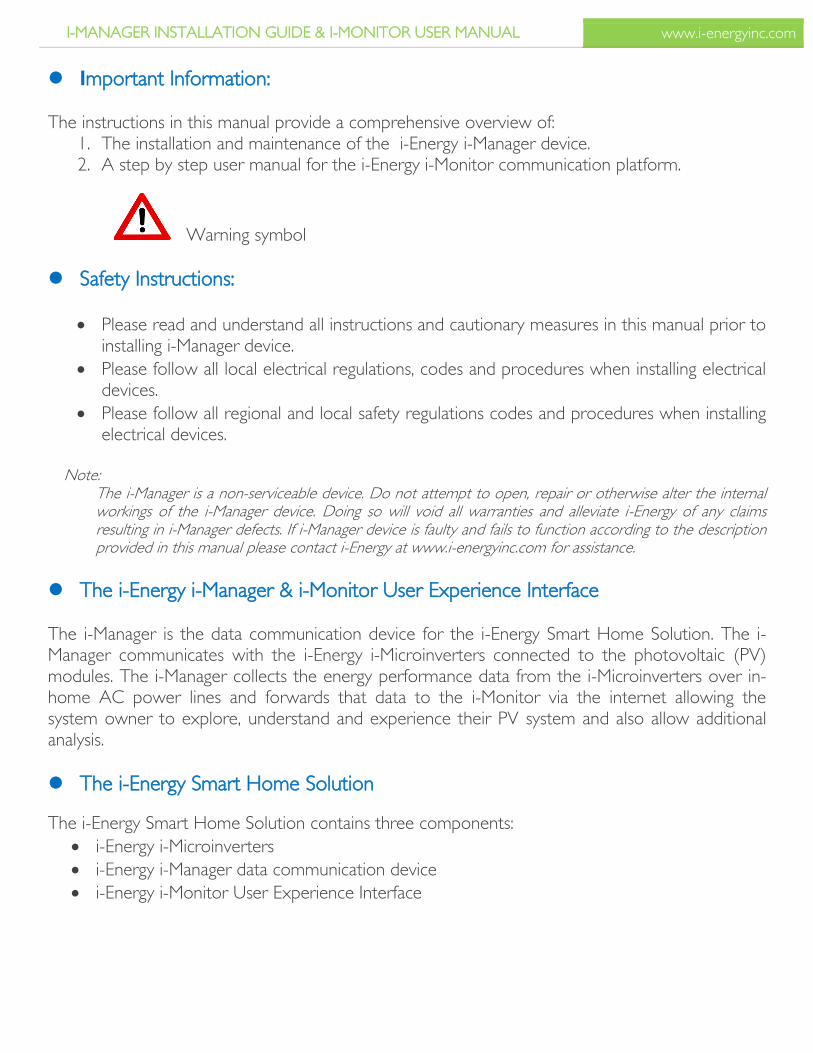
The i-Energy i-Manager & i-Monitor User Experience Interface The i-Manager is the data communication device for the i-Energy Smart Home Solution. The i-Manager communicates with the i-Energy i-Microinverters connected to the photovoltaic (PV) modules. The i-Manager collects the energy performance data from the i-Microinverters over in-home AC power lines and forwards that data to the i-Monitor via the internet allowing the system owner to explore, understand and experience their PV system and also allow additional analysis.
The i-Energy Smart Home Solution
The i-Energy Smart Home Solution contains three components:
i-Energy i-Microinverters
i-Energy i-Manager data communication device
i-Energy i-Monitor User Experience Interface
I-MANAGER INSTALLATION GUIDE & I-MONITOR USER MANUAL www.i-energyinc.com
a. i-Energy i–Microinverters installed on the roof under the PV panels. b. i-Energy i-Manager, the data communication device c. i-Energy i-Monitor User Experience Interface
The i-Energy Smart Home Solution
By component
The i-Energy i-Micro inverter
It is a fully self-contained, integrated DC AC inverter which inverts the DC electricity produced
by each PV panel to house ready AC electricity. This smart solution treats each PV module as an
independent mini power plant optimizing its performance and maximizing its energy output with
proprietary Maximum Power Point Tracking software. This smart solution greatly simplifies
installation, significantly increases system reliability and maximizes the power generated while
allowing for effective system diagnostics.
The i-Energy i-Manager
Its data communication device collects granular performance data from each registered i-
Microinverter in the i-Energy Smart Home Solution via Power Line Communications (PLC) and
transmits that data over the internet to i-Energy’s database for analysis and formatting.
The i-Energy i-Monitor User Experience Interface is a proprietary, web based platform allowing the system owner to experience, explore and understand their i-Energy Smart Home Solution. The i-Monitor provides intuitive and comprehensive real-time system performance data. The web based design allows the
I-MANAGER INSTALLATION GUIDE & I-MONITOR USER MANUAL www.i-energyinc.com
user to access their i-Energy Solution data anytime and anywhere with an internet connected device.
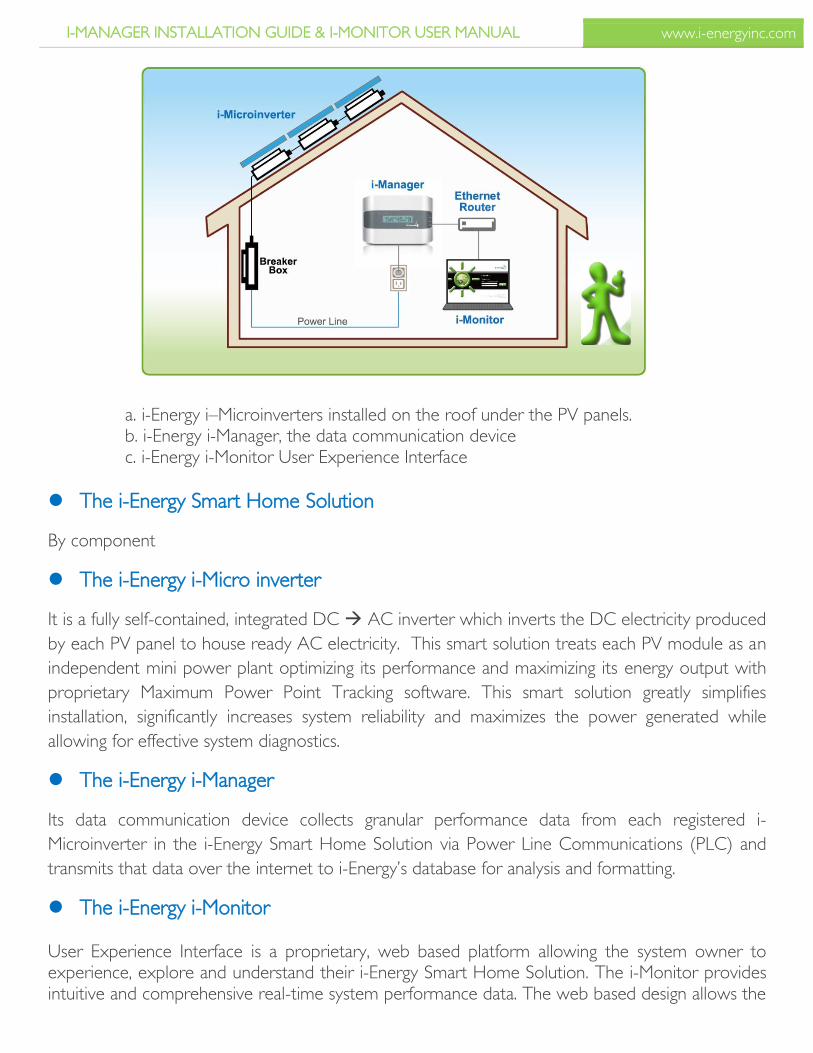
Using The i-Energy i-Manager & i-Monitor User Experience Interface The i-Manager is simple to install and easy to use. The i-Manager connects to the local router via an Ethernet cable and feeds data provided by the i-Microinverters to the i-Monitor database. This process is 100% automatic.
Required actions are simply plugging the i-Manager into the outlet closest to the AC load center and then connecting the i-Manger to the local router using an Ethernet cable. No special tools or equipment are needed to perform these actions.
Getting Started with the i-Manager
The i-Manager is specifically designed to provide an optimal solution for and maximize the energy harvest of residential or light commercial PV systems. Under ideal, optimum conditions a maximum of 72 i-Energy i-Microinverters may be registered to one i-Manager. To create an environment or determine whether an environment meets the ideal and optimum conditions, contact i-Energy directly for technical support. In cases where more than 72 i-Microinverters are used additional i-Managers will be needed.
Note: There is not a limit regarding how many i-Managers and i-Microinverters can be used in a single system. However, to ensure proper system design, allowing for optimum functionality please contact i-Energy at www.i-energyinc.com for support in systems where more than one i-Manager is needed (Systems requiring more than 72 i-Microinverters).
i-Micro inverter
I-MANAGER INSTALLATION GUIDE & I-MONITOR USER MANUAL www.i-energyinc.com
Before Installing the i-Manager:
1. Make sure the i-Manager is placed in a location where the AC cord can reach the outlet closest to the AC load center. (AC connection point of the i-Energy i-Microinverters)
2. DO NOT use a power strip/ power bar, extension cord or any other type of connection extension or line filter. Plug the i-Manager directly into the outlet.
3. For best results unplug any other electrical device which may be sharing the outlet with the i-Manager.
4. Make sure an “always-on” broadband internet connection is present and a broadband router with an open Ethernet port is present.
i-Manager Box Contents
1. i-Manager Data Communications device 2. System Guide Map 3. EZ Installation Guide 4. AC power cord 5. Ethernet cable 1.2 meters
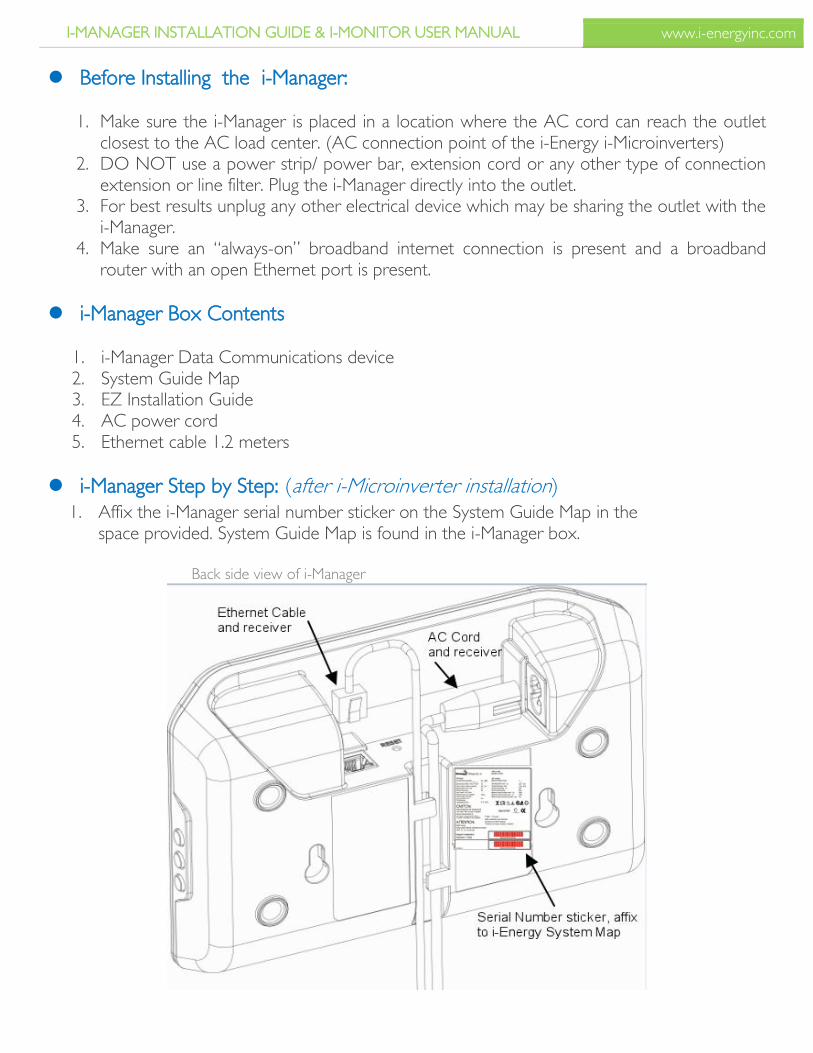
i-Manager Step by Step: (after i-Microinverter installation)
1. Affix the i-Manager serial number sticker on the System Guide Map in the space provided. System Guide Map is found in the i-Manager box.
Back side view of i-Manager
I-MANAGER INSTALLATION GUIDE & I-MONITOR USER MANUAL www.i-energyinc.com
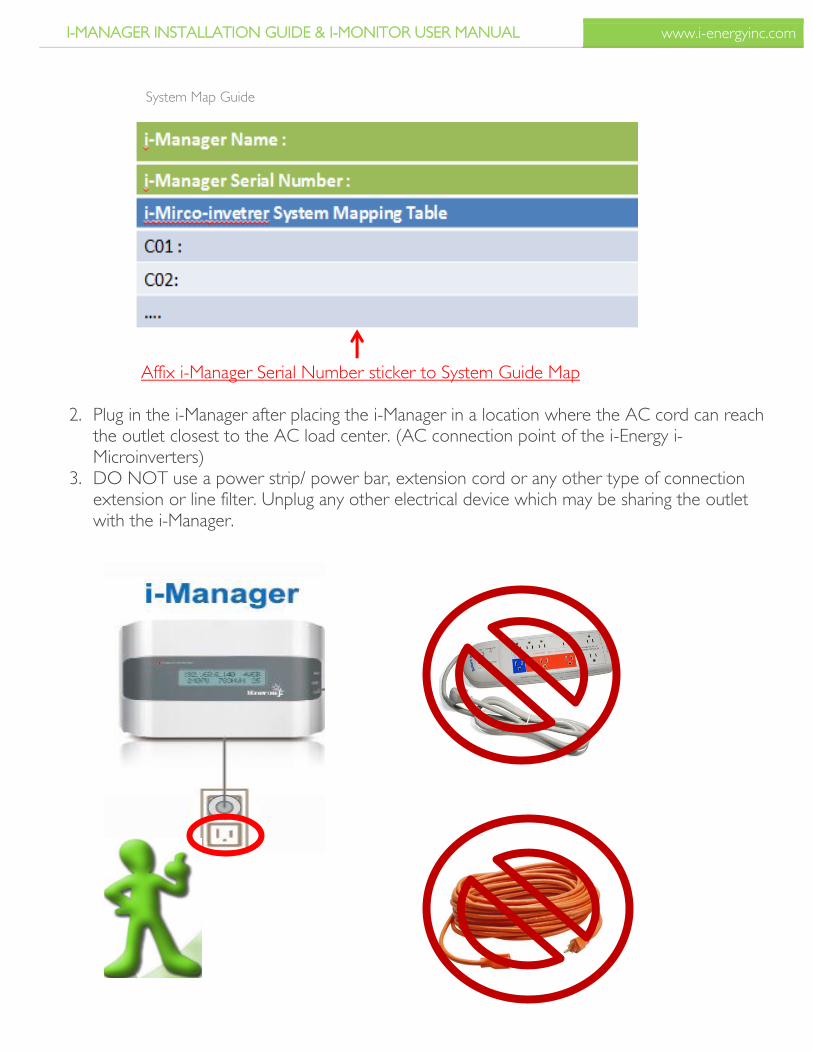
Affix i-Manager Serial Number sticker to System Guide Map
2. Plug in the i-Manager after placing the i-Manager in a location where the AC cord can reach
the outlet closest to the AC load center. (AC connection point of the i-Energy i-Microinverters)
3. DO NOT use a power strip/ power bar, extension cord or any other type of connection extension or line filter. Unplug any other electrical device which may be sharing the outlet with the i-Manager.
System Map Guide
I-MANAGER INSTALLATION GUIDE & I-MONITOR USER MANUAL www.i-energyinc.com
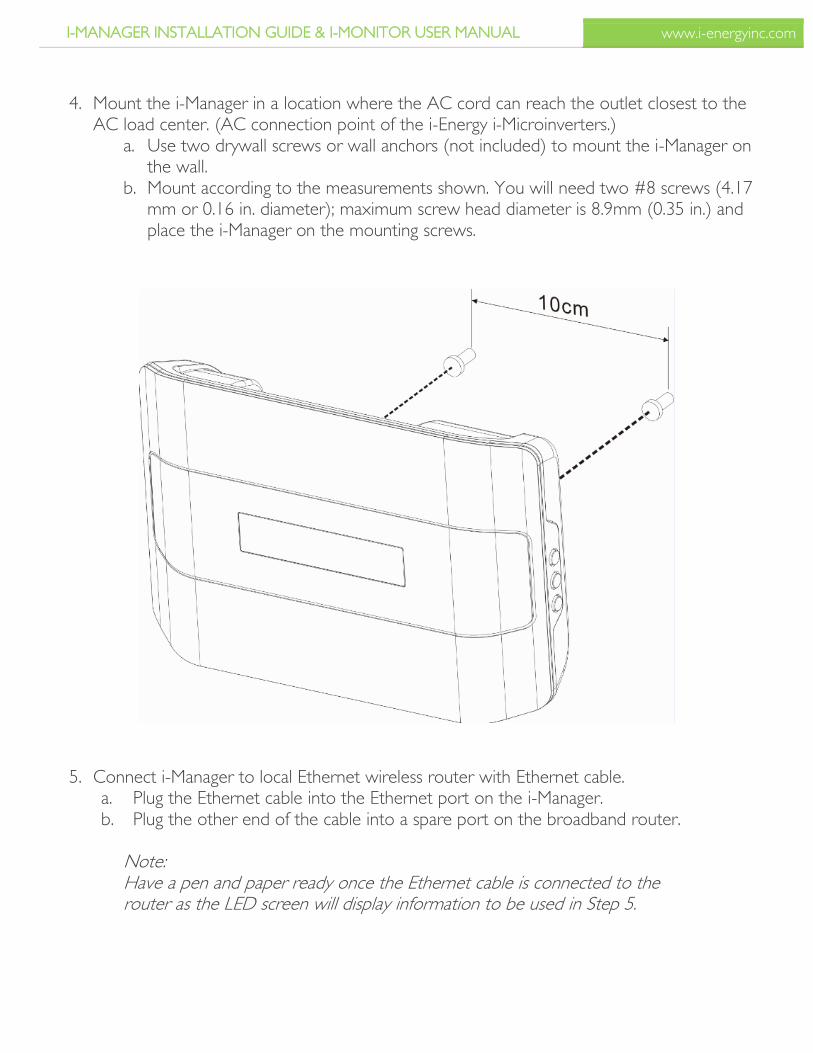
4. Mount the i-Manager in a location where the AC cord can reach the outlet closest to the AC load center. (AC connection point of the i-Energy i-Microinverters.)
a. Use two drywall screws or wall anchors (not included) to mount the i-Manager on the wall.
b. Mount according to the measurements shown. You will need two #8 screws (4.17 mm or 0.16 in. diameter); maximum screw head diameter is 8.9mm (0.35 in.) and place the i-Manager on the mounting screws.
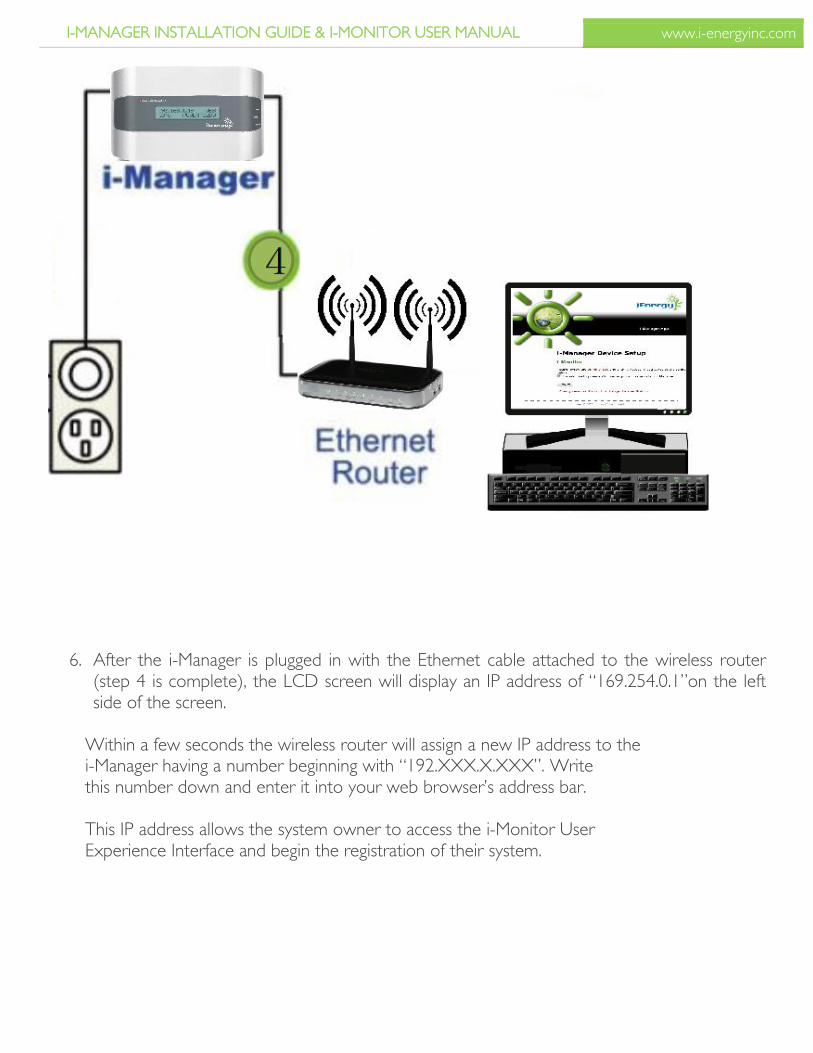
5. Connect i-Manager to local Ethernet wireless router with Ethernet cable. a. Plug the Ethernet cable into the Ethernet port on the i-Manager. b. Plug the other end of the cable into a spare port on the broadband router.
Note: Have a pen and paper ready once the Ethernet cable is connected to the router as the LED screen will display information to be used in Step 5.
I-MANAGER INSTALLATION GUIDE & I-MONITOR USER MANUAL www.i-energyinc.com
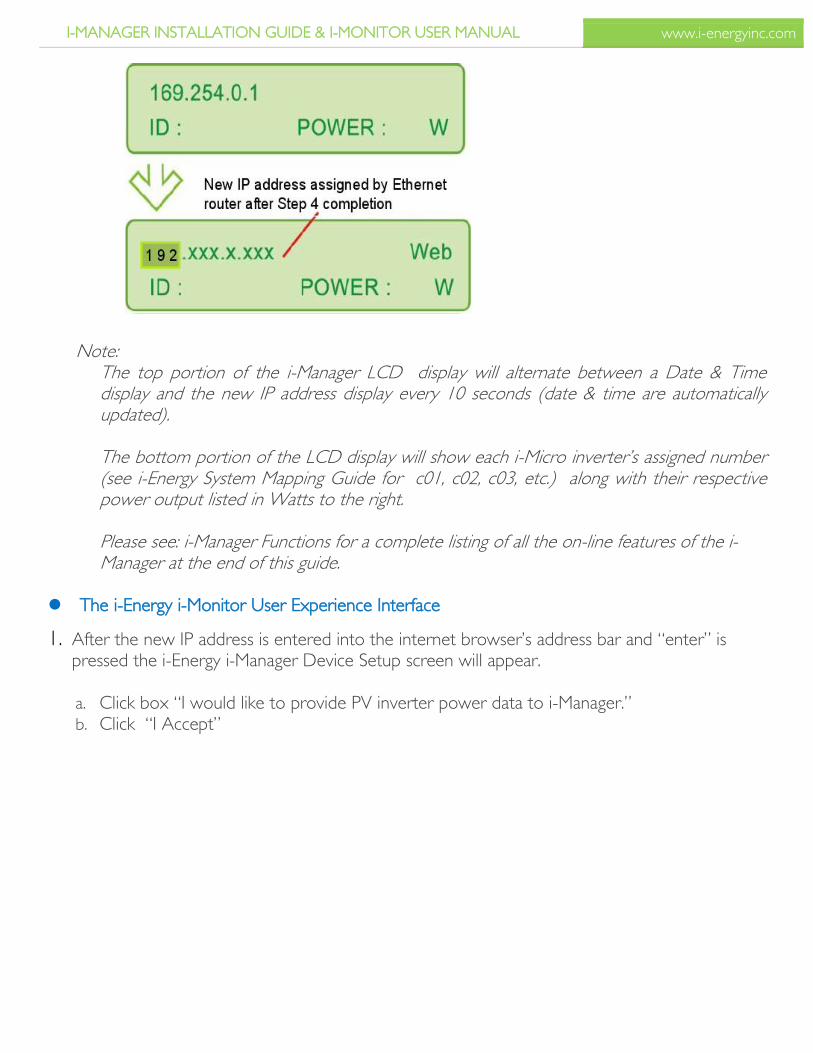
6. After the i-Manager is plugged in with the Ethernet cable attached to the wireless router (step 4 is complete), the LCD screen will display an IP address of “169.254.0.1”on the left side of the screen.
Within a few seconds the wireless router will assign a new IP address to the i-Manager having a number beginning with “192.XXX.X.XXX”. Write this number down and enter it into your web browser’s address bar. This IP address allows the system owner to access the i-Monitor User Experience Interface and begin the registration of their system.
I-MANAGER INSTALLATION GUIDE & I-MONITOR USER MANUAL www.i-energyinc.com
Note: The top portion of the i-Manager LCD display will alternate between a Date & Time display and the new IP address display every 10 seconds (date & time are automatically updated). The bottom portion of the LCD display will show each i-Micro inverter’s assigned number (see i-Energy System Mapping Guide for c01, c02, c03, etc.) along with their respective power output listed in Watts to the right. Please see: i-Manager Functions for a complete listing of all the on-line features of the i-Manager at the end of this guide.
The i-Energy i-Monitor User Experience Interface
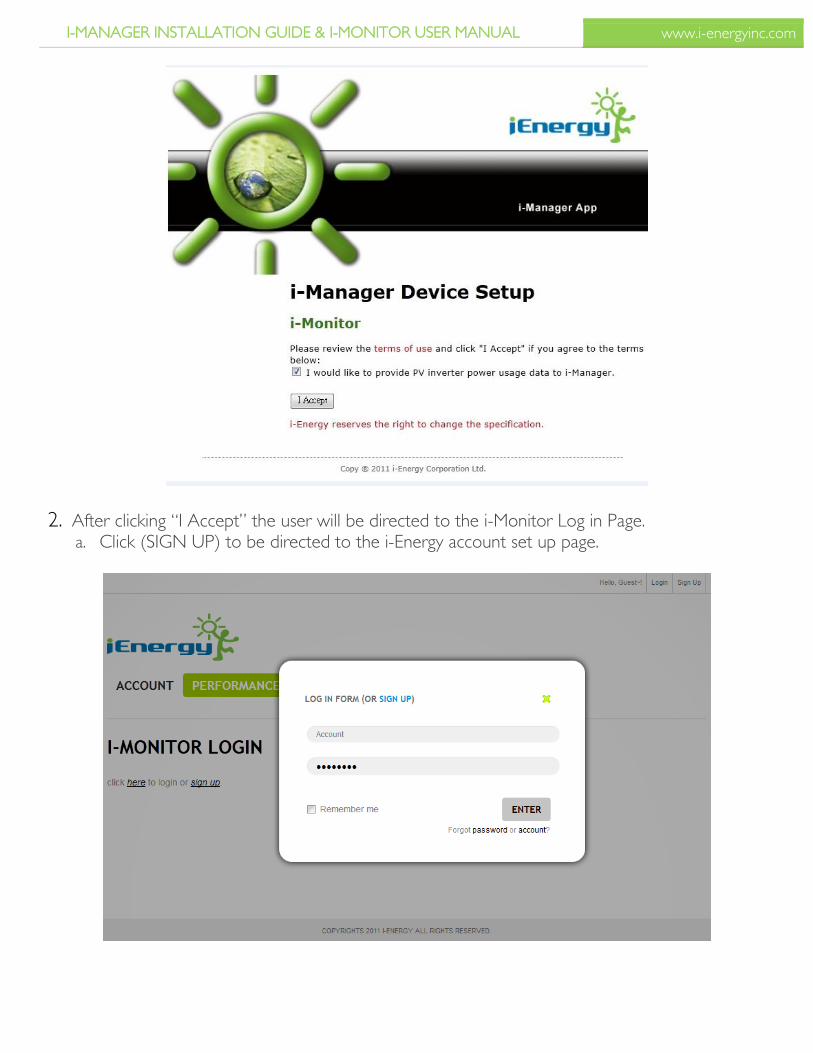
1. After the new IP address is entered into the internet browser’s address bar and “enter” is pressed the i-Energy i-Manager Device Setup screen will appear.
a. Click box “I would like to provide PV inverter power data to i-Manager.” b. Click “I Accept”
I-MANAGER INSTALLATION GUIDE & I-MONITOR USER MANUAL www.i-energyinc.com
2. After clicking “I Accept” the user will be directed to the i-Monitor Log in Page. a. Click (SIGN UP) to be directed to the i-Energy account set up page.
I-MANAGER INSTALLATION GUIDE & I-MONITOR USER MANUAL www.i-energyinc.com
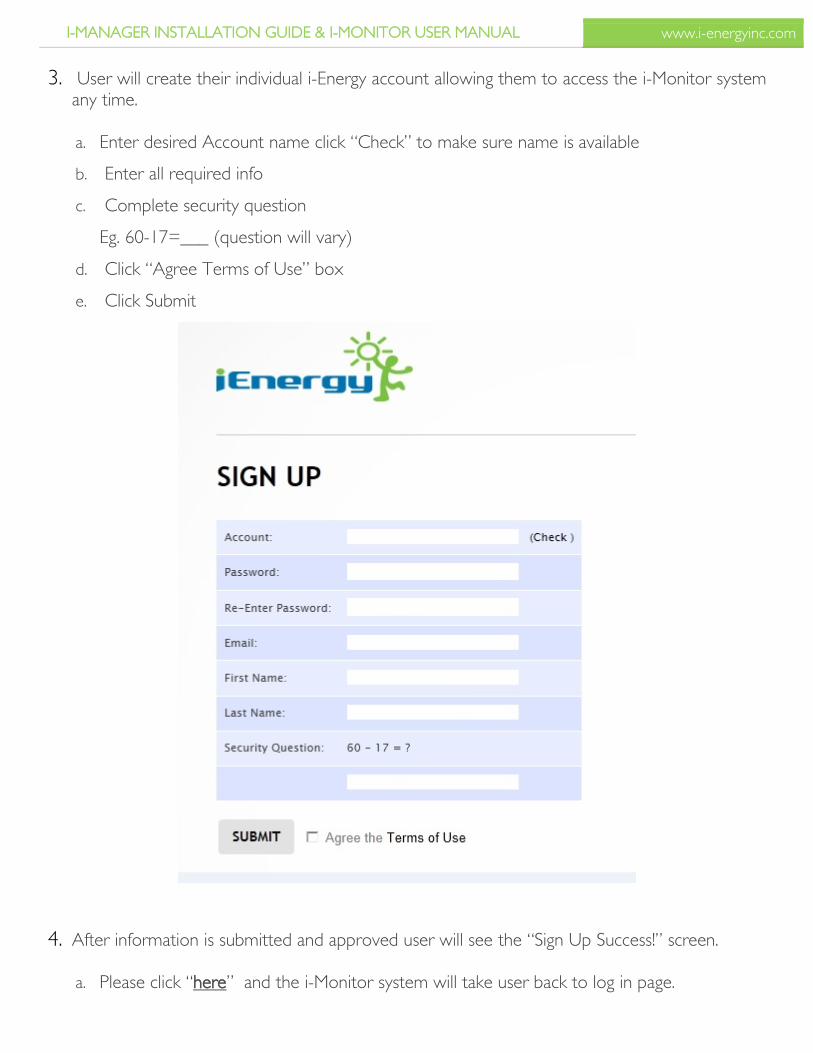
3. User will create their individual i-Energy account allowing them to access the i-Monitor system any time.
a. Enter desired Account name click “Check” to make sure name is available
b. Enter all required info
c. Complete security question
Eg. 60-17=___ (question will vary)
d. Click “Agree Terms of Use” box
e. Click Submit
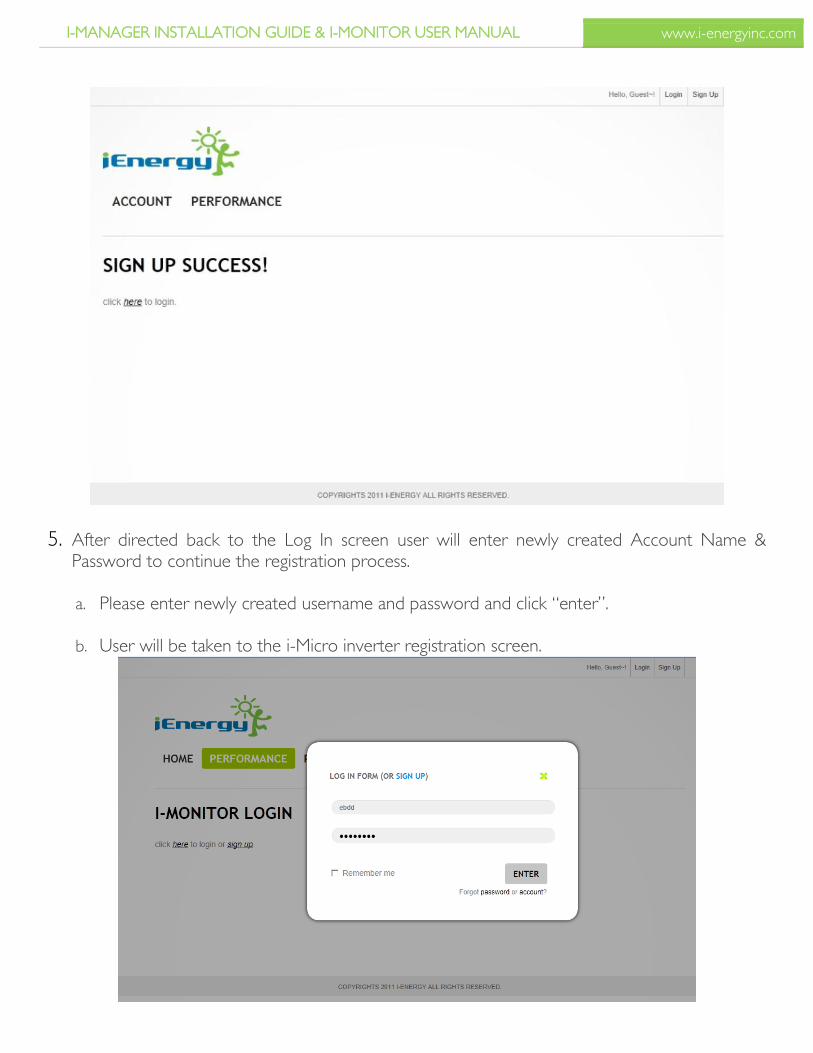
4. After information is submitted and approved user will see the “Sign Up Success!” screen.
a. Please click “here” and the i-Monitor system will take user back to log in page.
I-MANAGER INSTALLATION GUIDE & I-MONITOR USER MANUAL www.i-energyinc.com
5. After directed back to the Log In screen user will enter newly created Account Name & Password to continue the registration process.
a. Please enter newly created username and password and click “enter”.
b. User will be taken to the i-Micro inverter registration screen.
I-MANAGER INSTALLATION GUIDE & I-MONITOR USER MANUAL www.i-energyinc.com
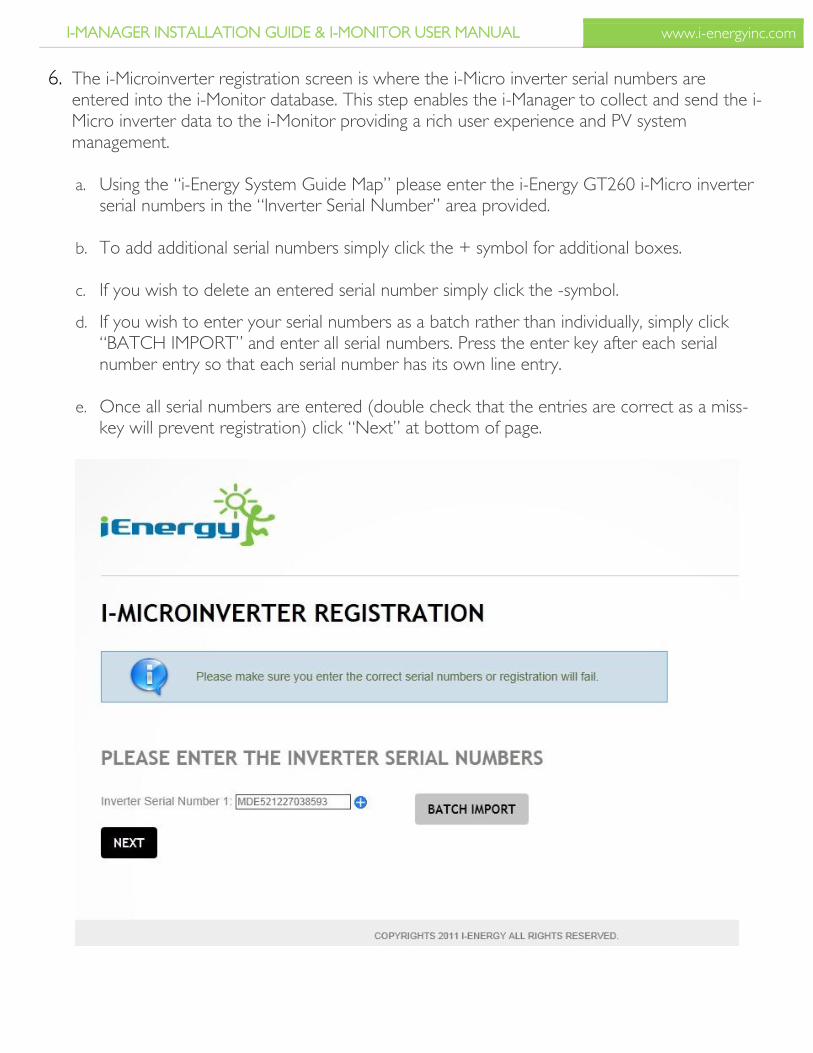
6. The i-Microinverter registration screen is where the i-Micro inverter serial numbers are entered into the i-Monitor database. This step enables the i-Manager to collect and send the i-Micro inverter data to the i-Monitor providing a rich user experience and PV system management. a. Using the “i-Energy System Guide Map” please enter the i-Energy GT260 i-Micro inverter
serial numbers in the “Inverter Serial Number” area provided.
b. To add additional serial numbers simply click the + symbol for additional boxes.
c. If you wish to delete an entered serial number simply click the -symbol.
d. If you wish to enter your serial numbers as a batch rather than individually, simply click “BATCH IMPORT” and enter all serial numbers. Press the enter key after each serial number entry so that each serial number has its own line entry.
e. Once all serial numbers are entered (double check that the entries are correct as a miss-key will prevent registration) click “Next” at bottom of page.
I-MANAGER INSTALLATION GUIDE & I-MONITOR USER MANUAL www.i-energyinc.com
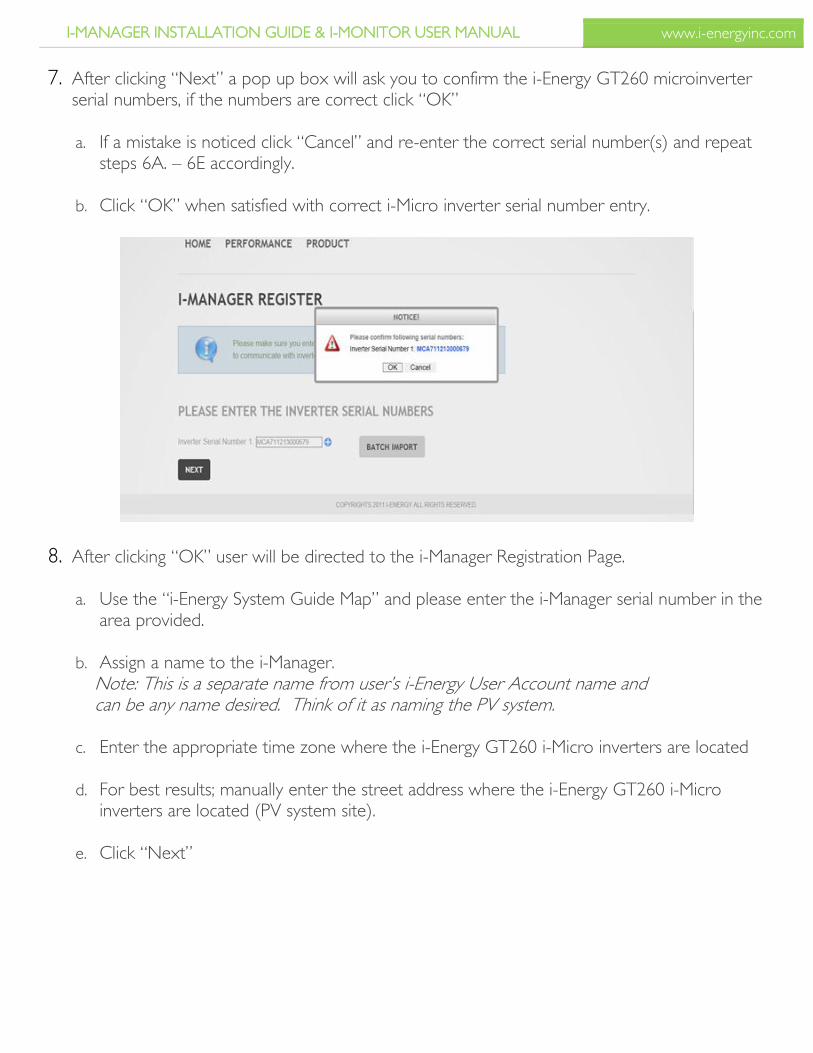
7. After clicking “Next” a pop up box will ask you to confirm the i-Energy GT260 microinverter serial numbers, if the numbers are correct click “OK”
a. If a mistake is noticed click “Cancel” and re-enter the correct serial number(s) and repeat
steps 6A. – 6E accordingly.
b. Click “OK” when satisfied with correct i-Micro inverter serial number entry.
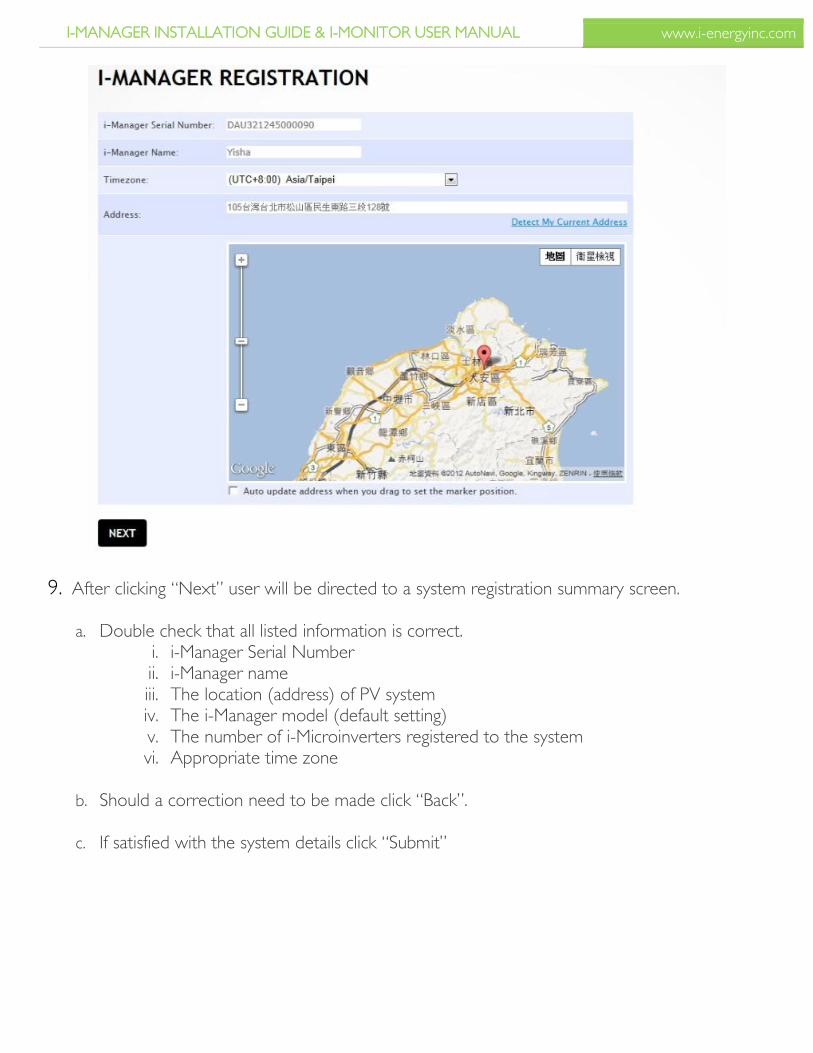
8. After clicking “OK” user will be directed to the i-Manager Registration Page.
a. Use the “i-Energy System Guide Map” and please enter the i-Manager serial number in the area provided.
b. Assign a name to the i-Manager. Note: This is a separate name from user’s i-Energy User Account name and can be any name desired. Think of it as naming the PV system.
c. Enter the appropriate time zone where the i-Energy GT260 i-Micro inverters are located
d. For best results; manually enter the street address where the i-Energy GT260 i-Micro inverters are located (PV system site).
e. Click “Next”
I-MANAGER INSTALLATION GUIDE & I-MONITOR USER MANUAL www.i-energyinc.com
9. After clicking “Next” user will be directed to a system registration summary screen.
a. Double check that all listed information is correct. i. i-Manager Serial Number ii. i-Manager name iii. The location (address) of PV system iv. The i-Manager model (default setting) v. The number of i-Microinverters registered to the system vi. Appropriate time zone
b. Should a correction need to be made click “Back”.
c. If satisfied with the system details click “Submit”
I-MANAGER INSTALLATION GUIDE & I-MONITOR USER MANUAL www.i-energyinc.com
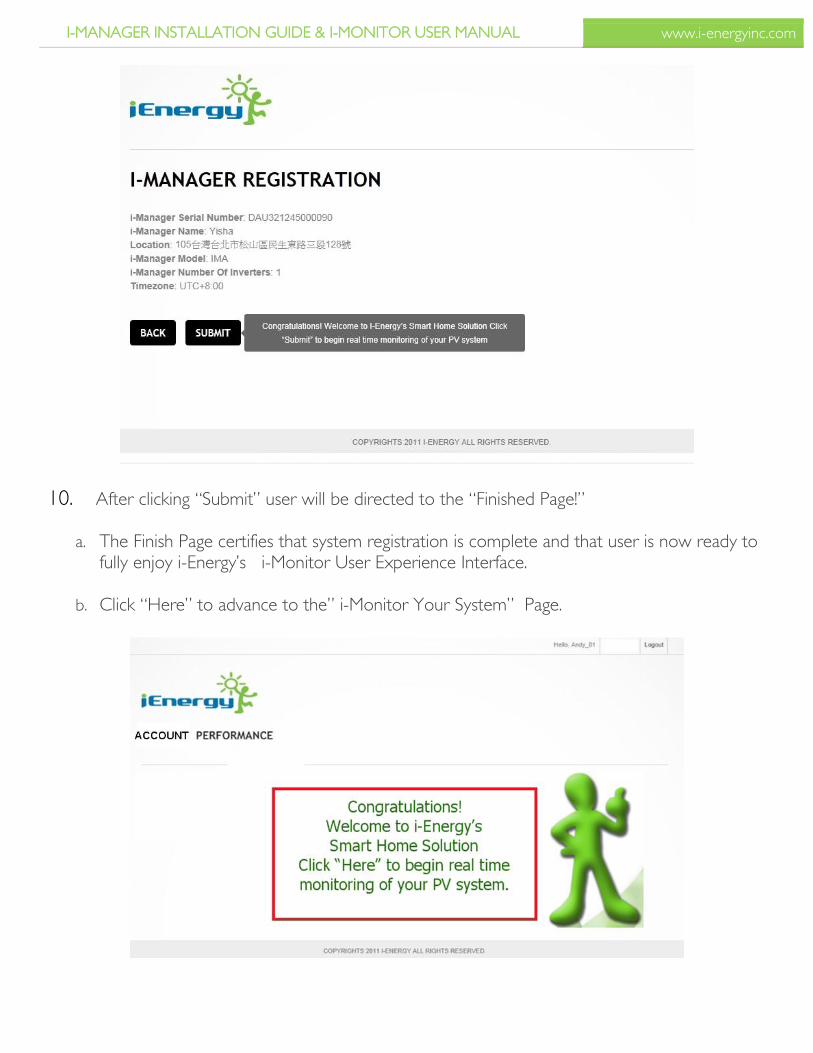
10. After clicking “Submit” user will be directed to the “Finished Page!”
a. The Finish Page certifies that system registration is complete and that user is now ready to fully enjoy i-Energy’s i-Monitor User Experience Interface.
b. Click “Here” to advance to the” i-Monitor Your System” Page.
I-MANAGER INSTALLATION GUIDE & I-MONITOR USER MANUAL www.i-energyinc.com
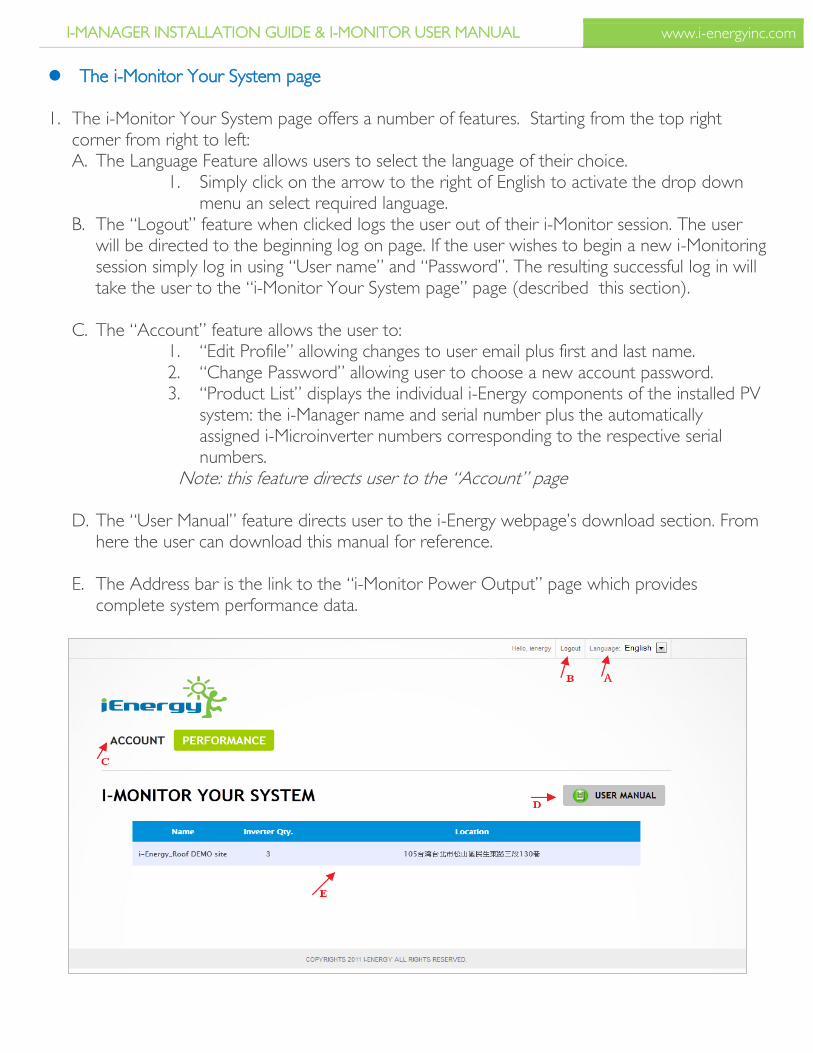
The i-Monitor Your System page
1. The i-Monitor Your System page offers a number of features. Starting from the top right corner from right to left: A. The Language Feature allows users to select the language of their choice.
1. Simply click on the arrow to the right of English to activate the drop down menu an select required language.
B. The “Logout” feature when clicked logs the user out of their i-Monitor session. The user will be directed to the beginning log on page. If the user wishes to begin a new i-Monitoring session simply log in using “User name” and “Password”. The resulting successful log in will take the user to the “i-Monitor Your System page” page (described this section).
C. The “Account” feature allows the user to:
1. “Edit Profile” allowing changes to user email plus first and last name. 2. “Change Password” allowing user to choose a new account password. 3. “Product List” displays the individual i-Energy components of the installed PV
system: the i-Manager name and serial number plus the automatically assigned i-Microinverter numbers corresponding to the respective serial numbers.
Note: this feature directs user to the “Account” page
D. The “User Manual” feature directs user to the i-Energy webpage’s download section. From here the user can download this manual for reference.
E. The Address bar is the link to the “i-Monitor Power Output” page which provides complete system performance data.
I-MANAGER INSTALLATION GUIDE & I-MONITOR USER MANUAL www.i-energyinc.com
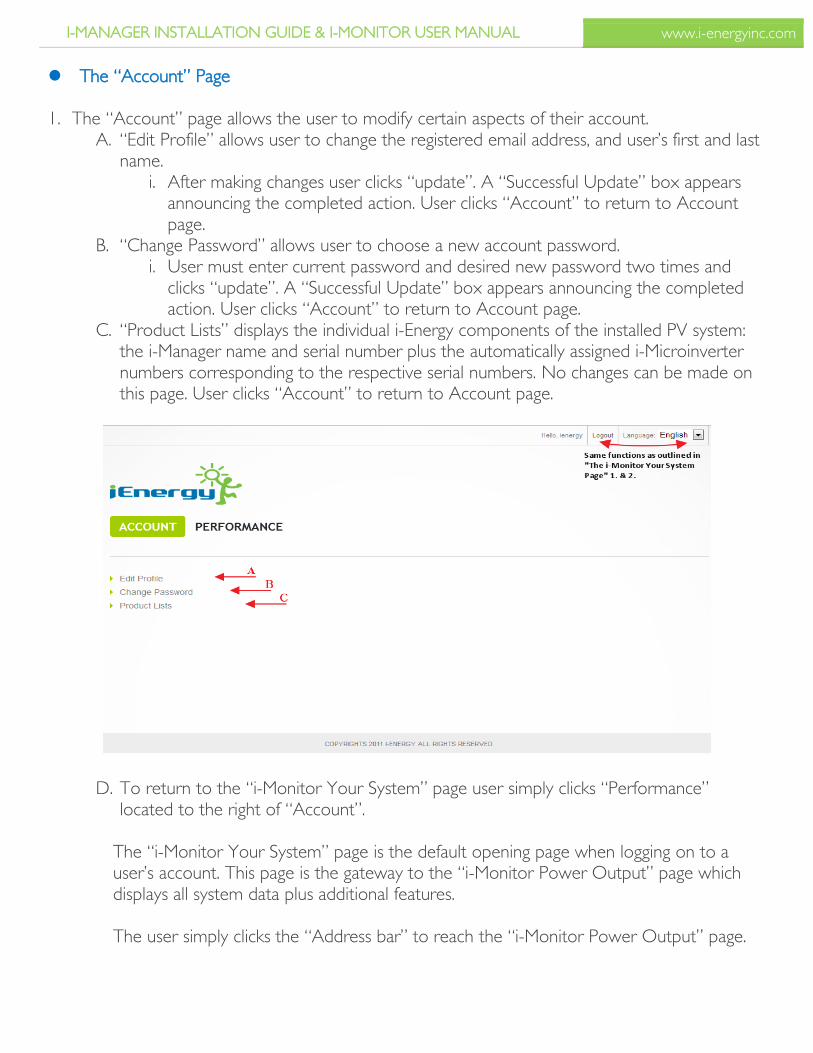
The “Account” Page
1. The “Account” page allows the user to modify certain aspects of their account. A. “Edit Profile” allows user to change the registered email address, and user’s first and last
name. i. After making changes user clicks “update”. A “Successful Update” box appears
announcing the completed action. User clicks “Account” to return to Account page.
B. “Change Password” allows user to choose a new account password. i. User must enter current password and desired new password two times and
clicks “update”. A “Successful Update” box appears announcing the completed action. User clicks “Account” to return to Account page.
C. “Product Lists” displays the individual i-Energy components of the installed PV system: the i-Manager name and serial number plus the automatically assigned i-Microinverter numbers corresponding to the respective serial numbers. No changes can be made on this page. User clicks “Account” to return to Account page.
D. To return to the “i-Monitor Your System” page user simply clicks “Performance” located to the right of “Account”.
The “i-Monitor Your System” page is the default opening page when logging on to a user’s account. This page is the gateway to the “i-Monitor Power Output” page which displays all system data plus additional features.
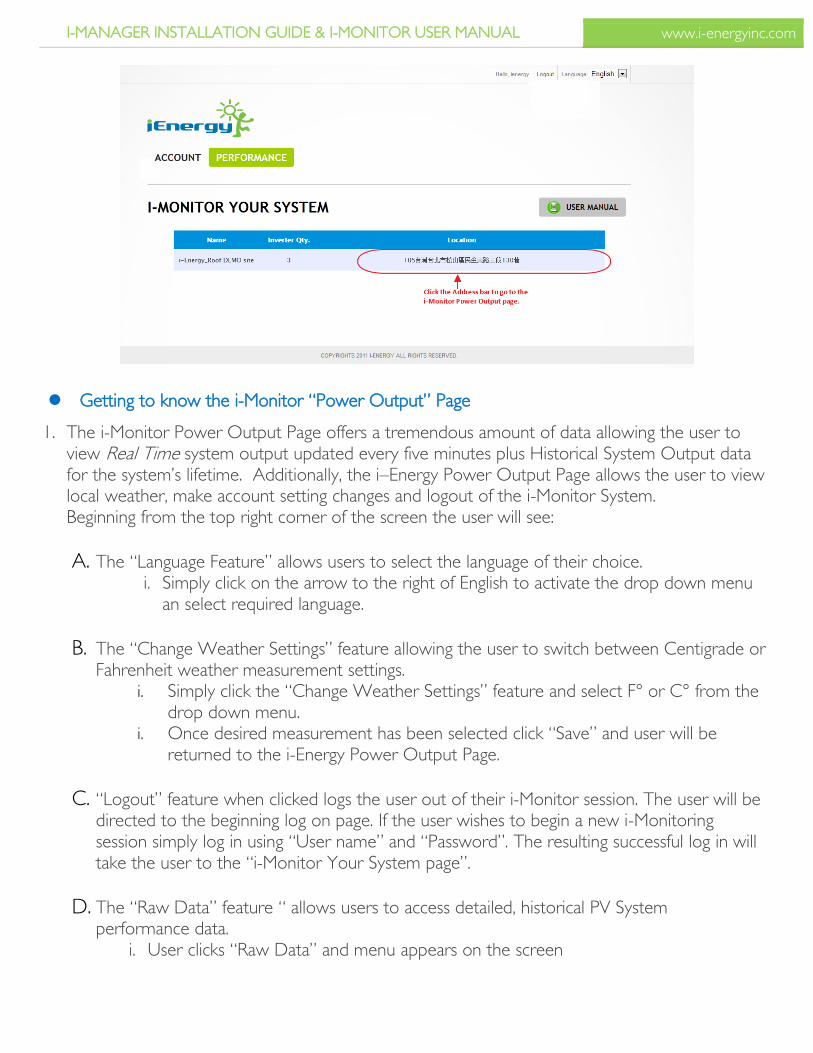
The user simply clicks the “Address bar” to reach the “i-Monitor Power Output” page.
I-MANAGER INSTALLATION GUIDE & I-MONITOR USER MANUAL www.i-energyinc.com
Getting to know the i-Monitor “Power Output” Page
1. The i-Monitor Power Output Page offers a tremendous amount of data allowing the user to view Real Time system output updated every five minutes plus Historical System Output data for the system’s lifetime. Additionally, the i–Energy Power Output Page allows the user to view local weather, make account setting changes and logout of the i-Monitor System. Beginning from the top right corner of the screen the user will see:
A. The “Language Feature” allows users to select the language of their choice. i. Simply click on the arrow to the right of English to activate the drop down menu
an select required language.
B. The “Change Weather Settings” feature allowing the user to switch between Centigrade or Fahrenheit weather measurement settings.
i. Simply click the “Change Weather Settings” feature and select F° or C° from the drop down menu.
i. Once desired measurement has been selected click “Save” and user will be returned to the i-Energy Power Output Page.
C. “Logout” feature when clicked logs the user out of their i-Monitor session. The user will be directed to the beginning log on page. If the user wishes to begin a new i-Monitoring session simply log in using “User name” and “Password”. The resulting successful log in will take the user to the “i-Monitor Your System page”.
D. The “Raw Data” feature “ allows users to access detailed, historical PV System performance data.
i. User clicks “Raw Data” and menu appears on the screen
I-MANAGER INSTALLATION GUIDE & I-MONITOR USER MANUAL www.i-energyinc.com
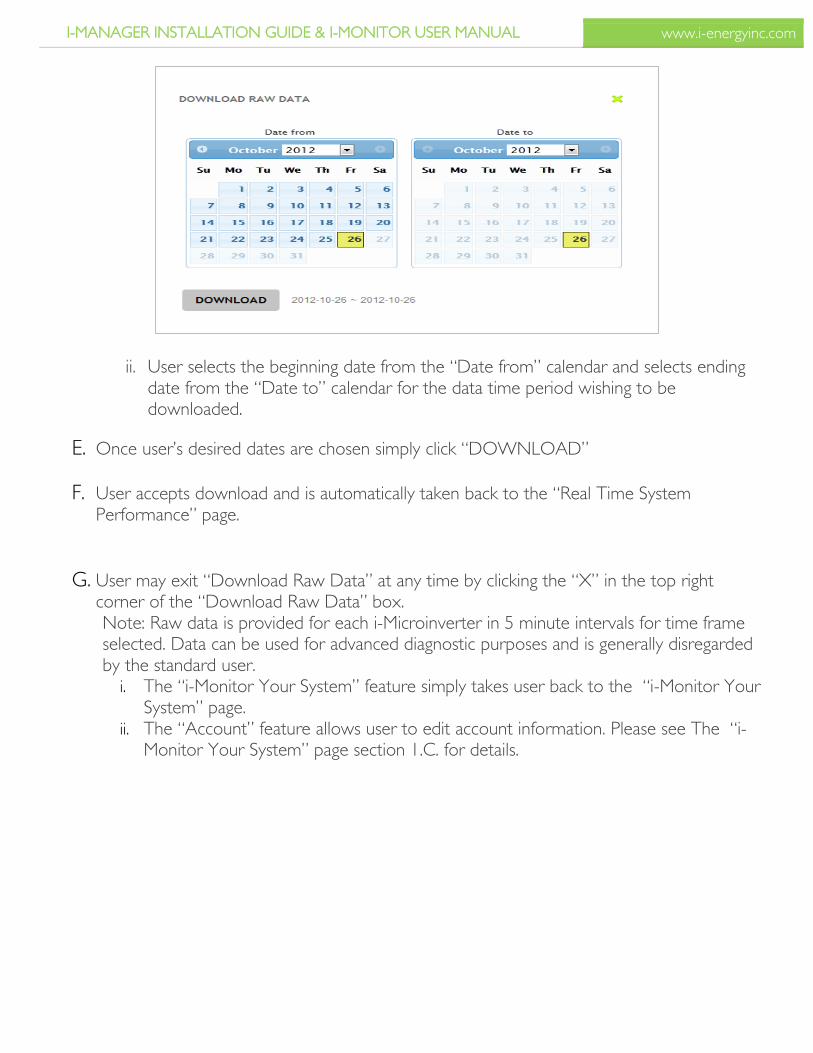
ii. User selects the beginning date from the “Date from” calendar and selects ending date from the “Date to” calendar for the data time period wishing to be downloaded.
E. Once user’s desired dates are chosen simply click “DOWNLOAD”
F. User accepts download and is automatically taken back to the “Real Time System Performance” page.
G. User may exit “Download Raw Data” at any time by clicking the “X” in the top right corner of the “Download Raw Data” box. Note: Raw data is provided for each i-Microinverter in 5 minute intervals for time frame selected. Data can be used for advanced diagnostic purposes and is generally disregarded by the standard user.
i. The “i-Monitor Your System” feature simply takes user back to the “i-Monitor Your System” page.
ii. The “Account” feature allows user to edit account information. Please see The “i-Monitor Your System” page section 1.C. for details.
I-MANAGER INSTALLATION GUIDE & I-MONITOR USER MANUAL www.i-energyinc.com
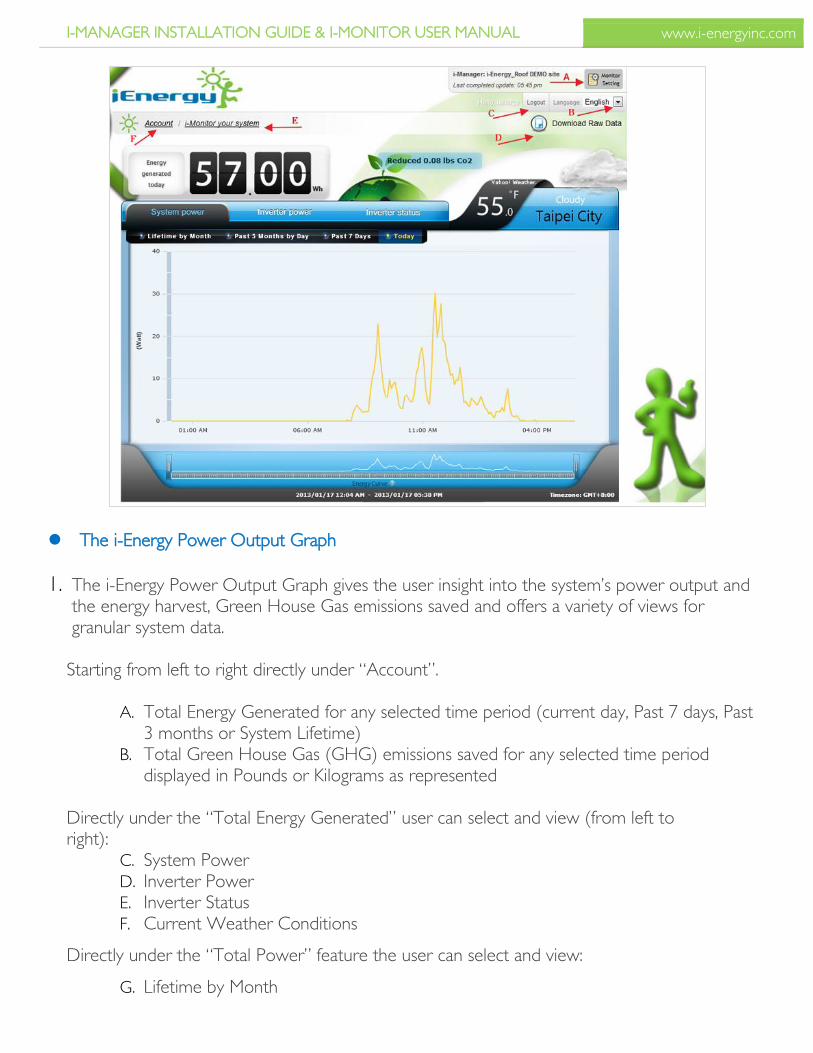
The i-Energy Power Output Graph
1. The i-Energy Power Output Graph gives the user insight into the system’s power output and the energy harvest, Green House Gas emissions saved and offers a variety of views for granular system data.
Starting from left to right directly under “Account”.
A. Total Energy Generated for any selected time period (current day, Past 7 days, Past 3 months or System Lifetime)
B. Total Green House Gas (GHG) emissions saved for any selected time period displayed in Pounds or Kilograms as represented
Directly under the “Total Energy Generated” user can select and view (from left to right):
C. System Power D. Inverter Power E. Inverter Status F. Current Weather Conditions
Directly under the “Total Power” feature the user can select and view:
G. Lifetime by Month
I-MANAGER INSTALLATION GUIDE & I-MONITOR USER MANUAL www.i-energyinc.com
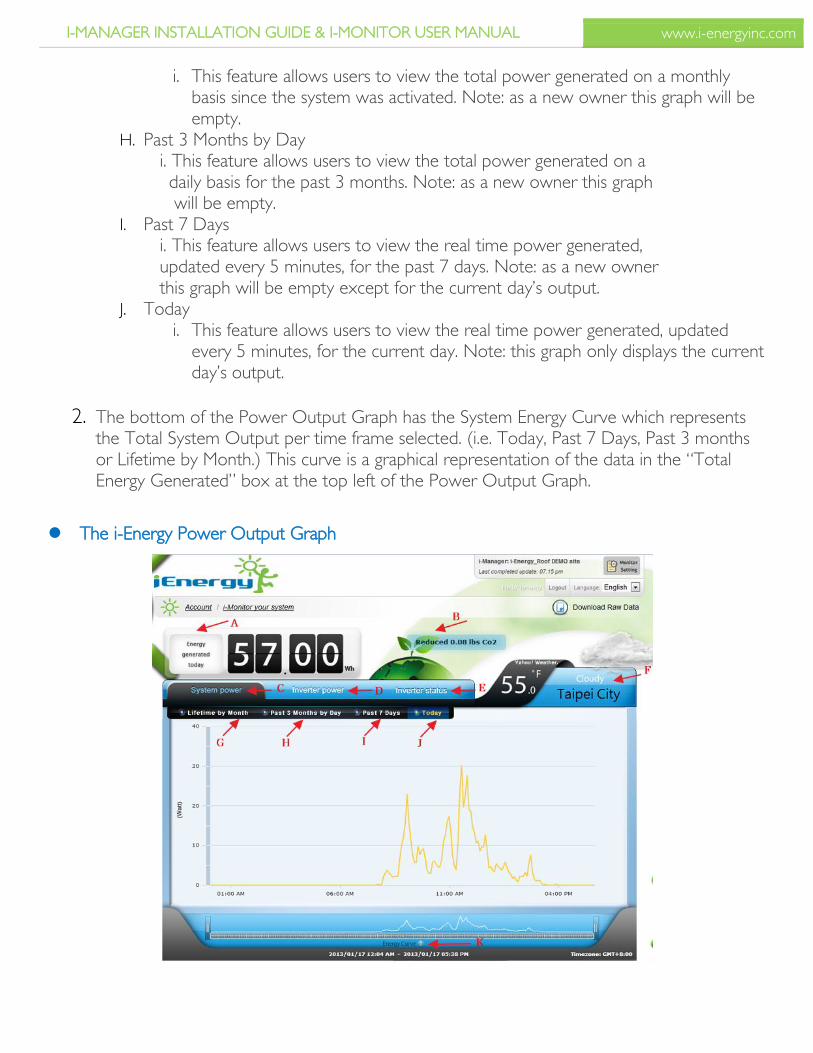
i. This feature allows users to view the total power generated on a monthly basis since the system was activated. Note: as a new owner this graph will be empty.
H. Past 3 Months by Day i. This feature allows users to view the total power generated on a daily basis for the past 3 months. Note: as a new owner this graph will be empty.
I. Past 7 Days i. This feature allows users to view the real time power generated, updated every 5 minutes, for the past 7 days. Note: as a new owner this graph will be empty except for the current day’s output.
J. Today i. This feature allows users to view the real time power generated, updated
every 5 minutes, for the current day. Note: this graph only displays the current day’s output.
2. The bottom of the Power Output Graph has the System Energy Curve which represents the Total System Output per time frame selected. (i.e. Today, Past 7 Days, Past 3 months or Lifetime by Month.) This curve is a graphical representation of the data in the “Total Energy Generated” box at the top left of the Power Output Graph.
The i-Energy Power Output Graph
I-MANAGER INSTALLATION GUIDE & I-MONITOR USER MANUAL www.i-energyinc.com
Getting to Know The Power Output Graph Options:
With the i-Monitor Power Output Page options defined, the user can now select a wide variety of “Power Generated” graphs. For example, a user can select last month’s total power generated in kilowatt hours and use this information to estimate their total electrical bill or estimate how large a credit they can expect from their respective utility provider should such an incentive exist, (net metering, Feed in Tariff, etc.).
Power Output Graph - Total Power Setting:
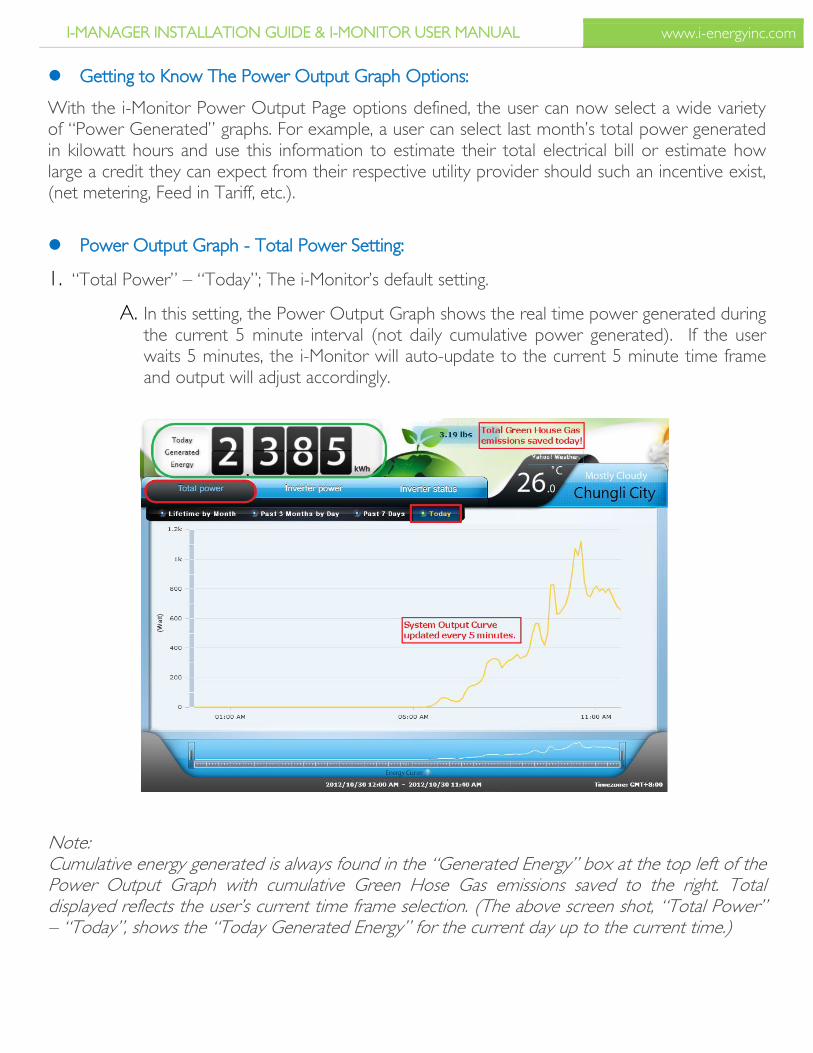
1. “Total Power” – “Today”; The i-Monitor’s default setting.
A. In this setting, the Power Output Graph shows the real time power generated during the current 5 minute interval (not daily cumulative power generated). If the user waits 5 minutes, the i-Monitor will auto-update to the current 5 minute time frame and output will adjust accordingly.
Note: Cumulative energy generated is always found in the “Generated Energy” box at the top left of the Power Output Graph with cumulative Green Hose Gas emissions saved to the right. Total displayed reflects the user’s current time frame selection. (The above screen shot, “Total Power” – “Today”, shows the “Today Generated Energy” for the current day up to the current time.)
I-MANAGER INSTALLATION GUIDE & I-MONITOR USER MANUAL www.i-energyinc.com
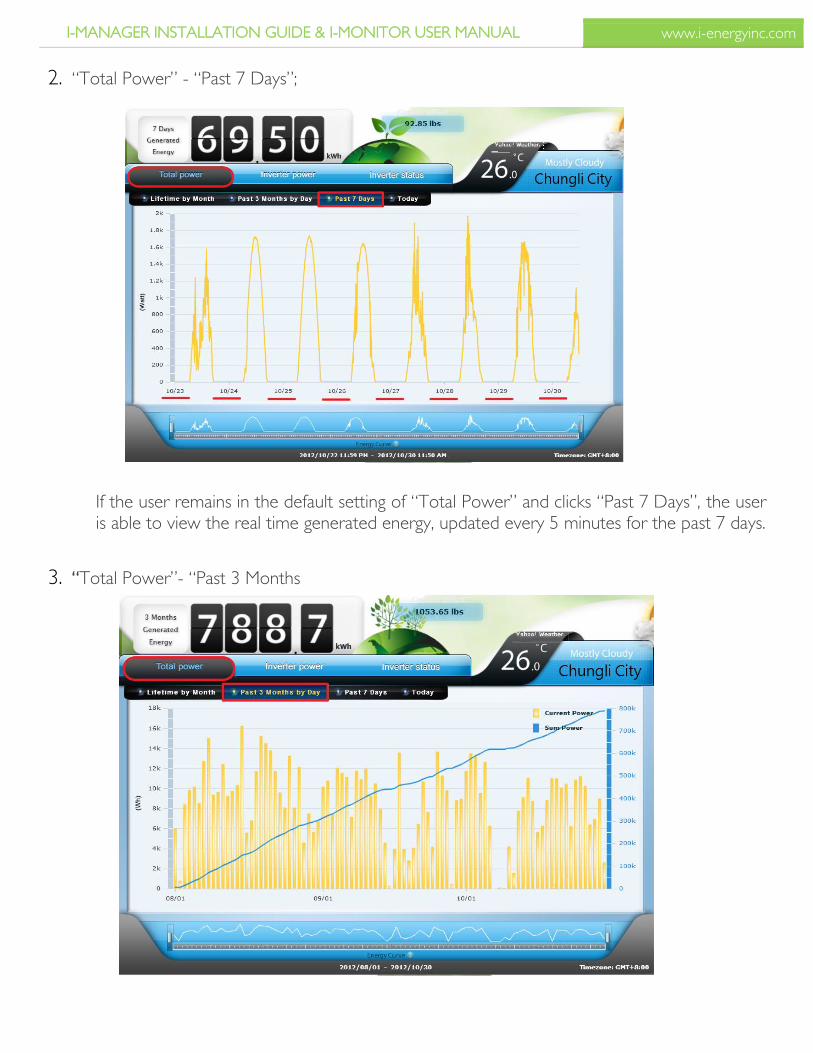
2. “Total Power” - “Past 7 Days”;
If the user remains in the default setting of “Total Power” and clicks “Past 7 Days”, the user is able to view the real time generated energy, updated every 5 minutes for the past 7 days.
3. “Total Power”- “Past 3 Months
I-MANAGER INSTALLATION GUIDE & I-MONITOR USER MANUAL www.i-energyinc.com
If user remains in the default setting of “Total Power” and clicks “Past 3 Months”, user is able to view the real time power generated on a daily basis for the last 3 months. The orange bars show daily total system output while the blue ascending curve represents cumulative system output and will always be ascending. The user can place the cursor over one of the orange bars to obtain that specific day’s output plus the system’s total output to date.
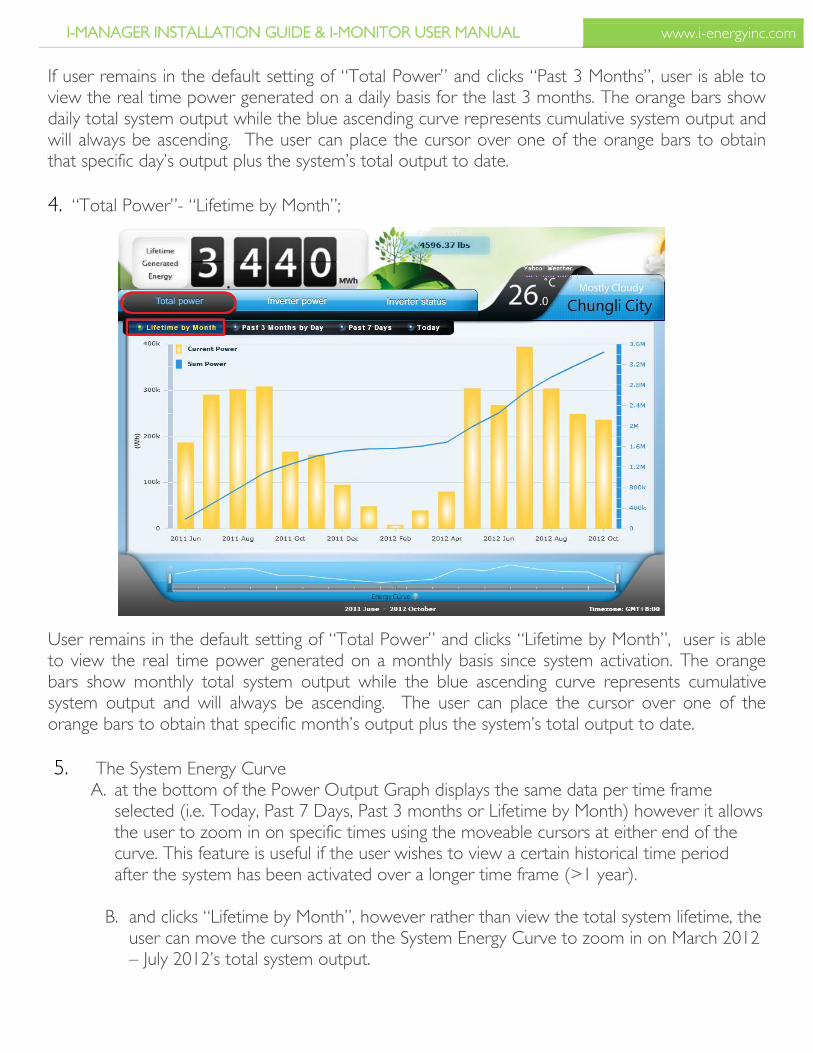
4. “Total Power”- “Lifetime by Month”;
User remains in the default setting of “Total Power” and clicks “Lifetime by Month”, user is able to view the real time power generated on a monthly basis since system activation. The orange bars show monthly total system output while the blue ascending curve represents cumulative system output and will always be ascending. The user can place the cursor over one of the orange bars to obtain that specific month’s output plus the system’s total output to date.
5. The System Energy Curve A. at the bottom of the Power Output Graph displays the same data per time frame
selected (i.e. Today, Past 7 Days, Past 3 months or Lifetime by Month) however it allows the user to zoom in on specific times using the moveable cursors at either end of the curve. This feature is useful if the user wishes to view a certain historical time period after the system has been activated over a longer time frame (>1 year).
B. and clicks “Lifetime by Month”, however rather than view the total system lifetime, the
user can move the cursors at on the System Energy Curve to zoom in on March 2012 – July 2012’s total system output.
I-MANAGER INSTALLATION GUIDE & I-MONITOR USER MANUAL www.i-energyinc.com
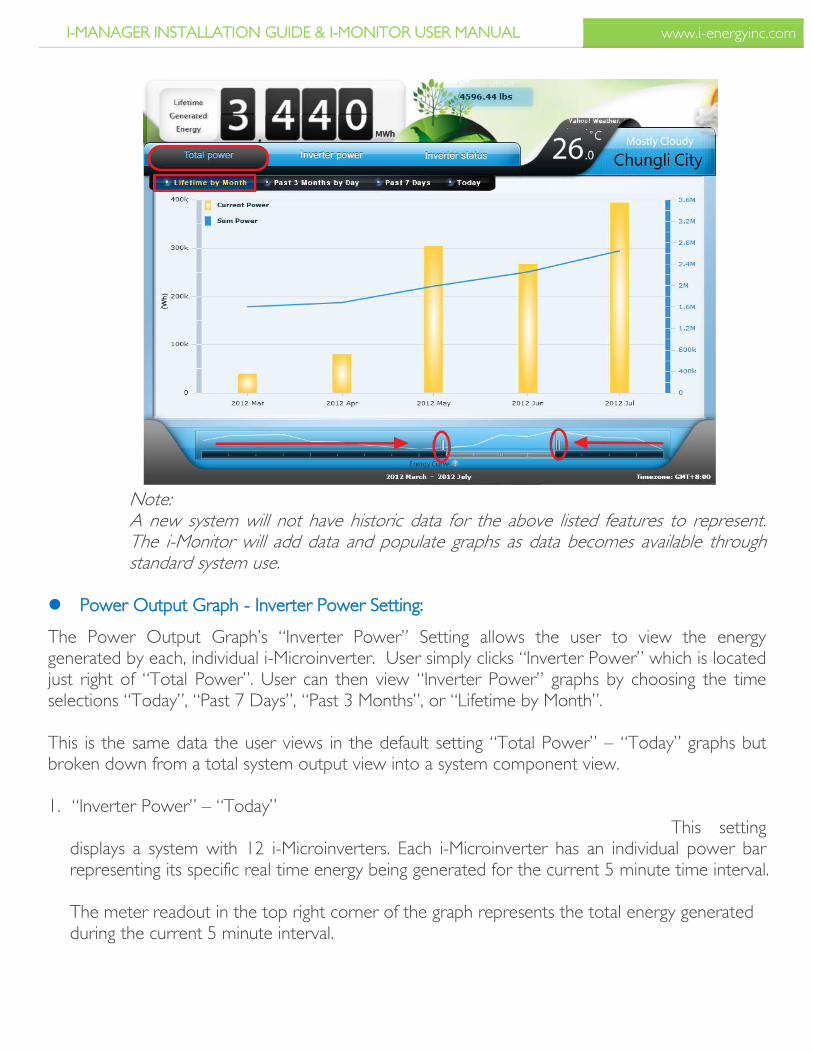
Note: A new system will not have historic data for the above listed features to represent. The i-Monitor will add data and populate graphs as data becomes available through standard system use.
Power Output Graph - Inverter Power Setting:
The Power Output Graph’s “Inverter Power” Setting allows the user to view the energy generated by each, individual i-Microinverter. User simply clicks “Inverter Power” which is located just right of “Total Power”. User can then view “Inverter Power” graphs by choosing the time selections “Today”, “Past 7 Days”, “Past 3 Months”, or “Lifetime by Month”. This is the same data the user views in the default setting “Total Power” – “Today” graphs but broken down from a total system output view into a system component view. 1. “Inverter Power” – “Today”
This setting displays a system with 12 i-Microinverters. Each i-Microinverter has an individual power bar representing its specific real time energy being generated for the current 5 minute time interval.
The meter readout in the top right corner of the graph represents the total energy generated during the current 5 minute interval.
I-MANAGER INSTALLATION GUIDE & I-MONITOR USER MANUAL www.i-energyinc.com
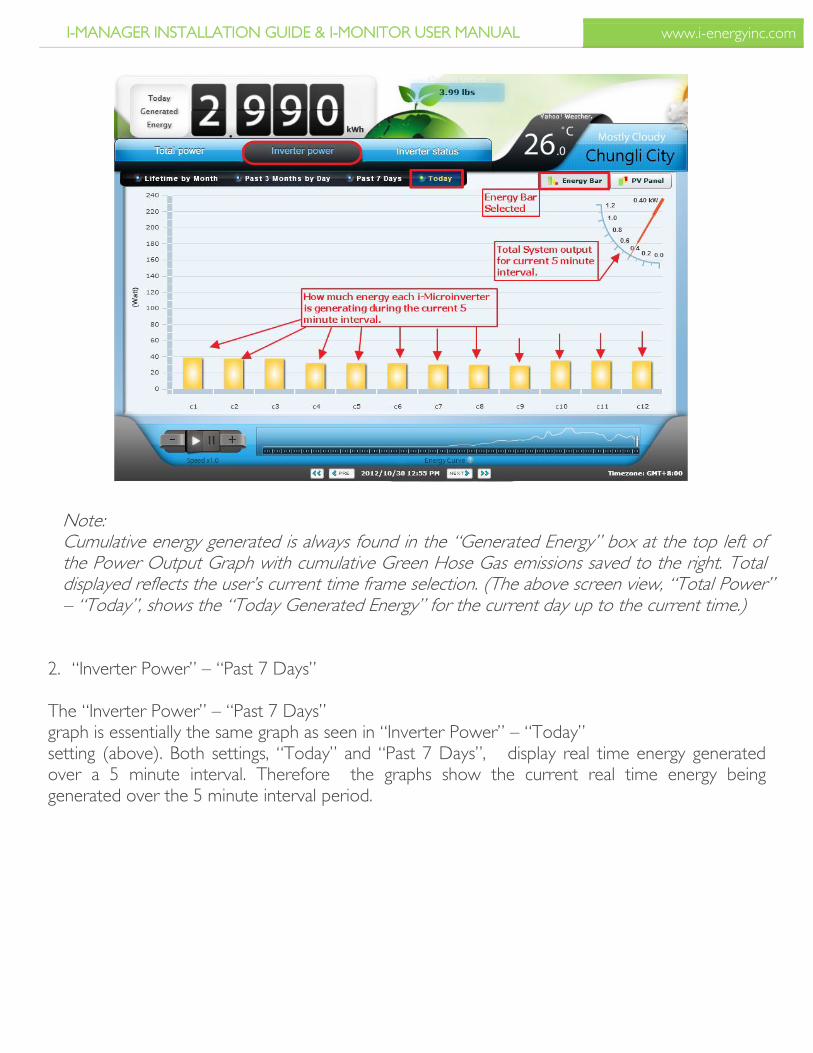
Note: Cumulative energy generated is always found in the “Generated Energy” box at the top left of the Power Output Graph with cumulative Green Hose Gas emissions saved to the right. Total displayed reflects the user’s current time frame selection. (The above screen view, “Total Power” – “Today”, shows the “Today Generated Energy” for the current day up to the current time.)
2. “Inverter Power” – “Past 7 Days”
The “Inverter Power” – “Past 7 Days” graph is essentially the same graph as seen in “Inverter Power” – “Today” setting (above). Both settings, “Today” and “Past 7 Days”, display real time energy generated over a 5 minute interval. Therefore the graphs show the current real time energy being generated over the 5 minute interval period.
I-MANAGER INSTALLATION GUIDE & I-MONITOR USER MANUAL www.i-energyinc.com
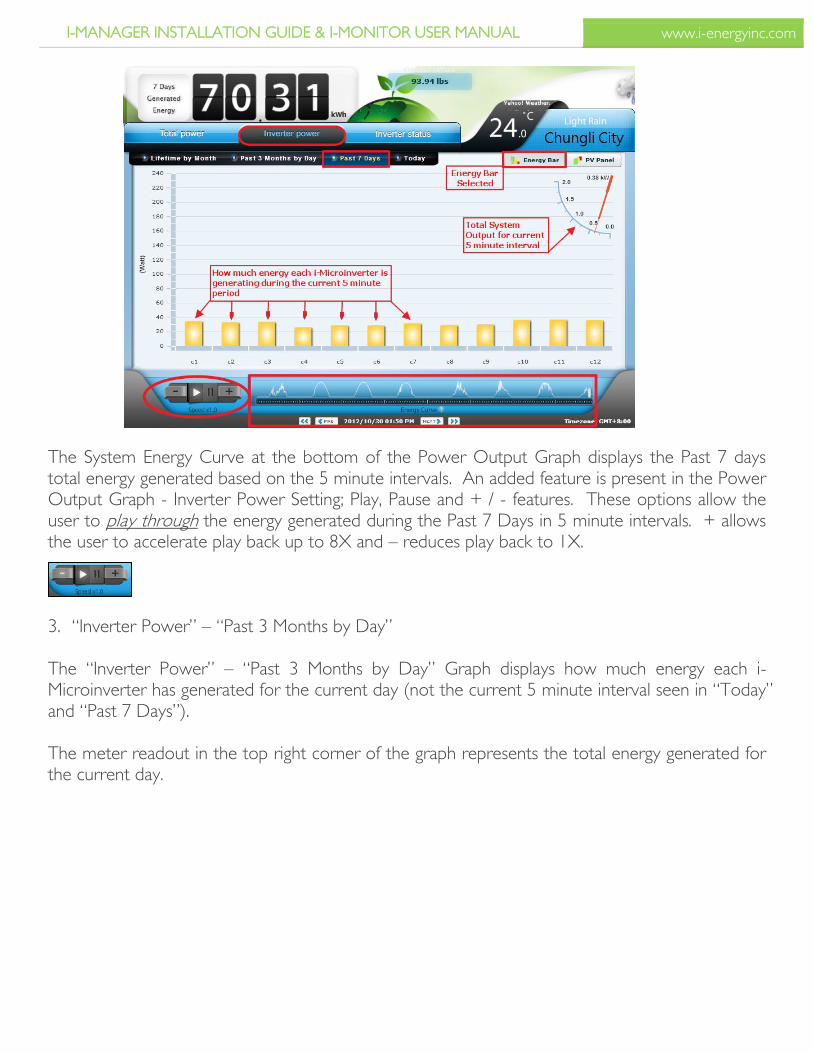
The System Energy Curve at the bottom of the Power Output Graph displays the Past 7 days total energy generated based on the 5 minute intervals. An added feature is present in the Power Output Graph - Inverter Power Setting; Play, Pause and + / - features. These options allow the user to play through the energy generated during the Past 7 Days in 5 minute intervals. + allows the user to accelerate play back up to 8X and – reduces play back to 1X.
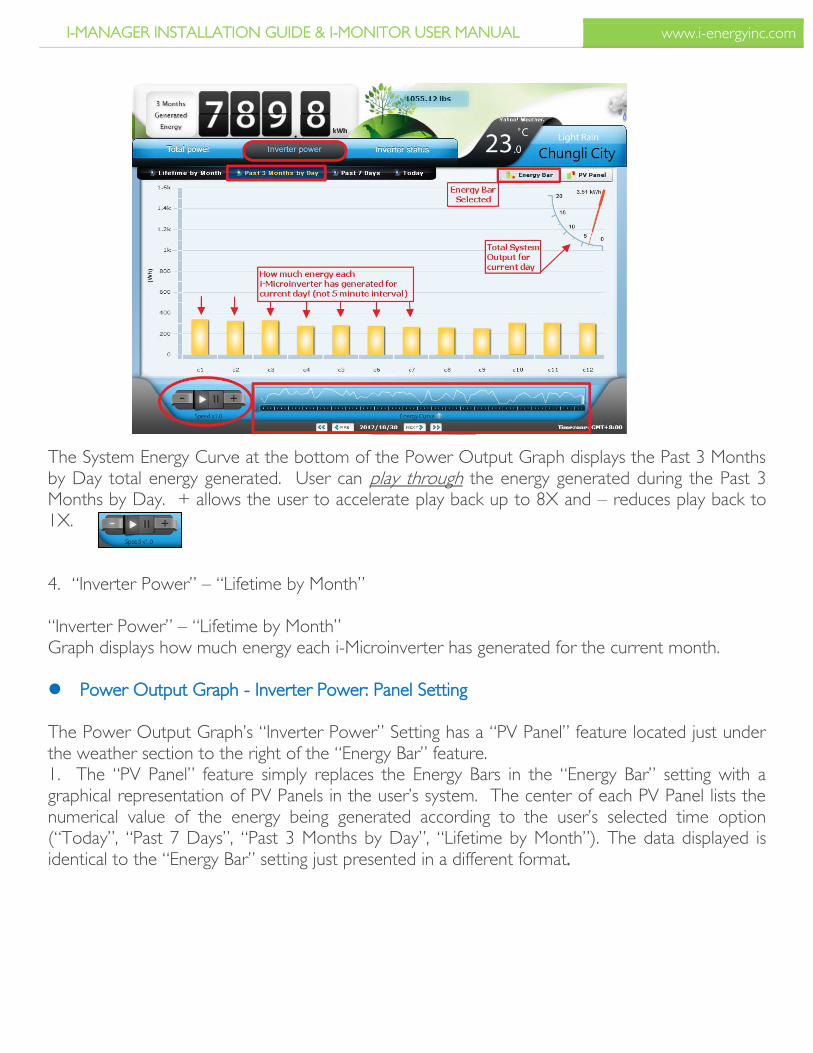
3. “Inverter Power” – “Past 3 Months by Day” The “Inverter Power” – “Past 3 Months by Day” Graph displays how much energy each i-Microinverter has generated for the current day (not the current 5 minute interval seen in “Today” and “Past 7 Days”). The meter readout in the top right corner of the graph represents the total energy generated for the current day.
I-MANAGER INSTALLATION GUIDE & I-MONITOR USER MANUAL www.i-energyinc.com
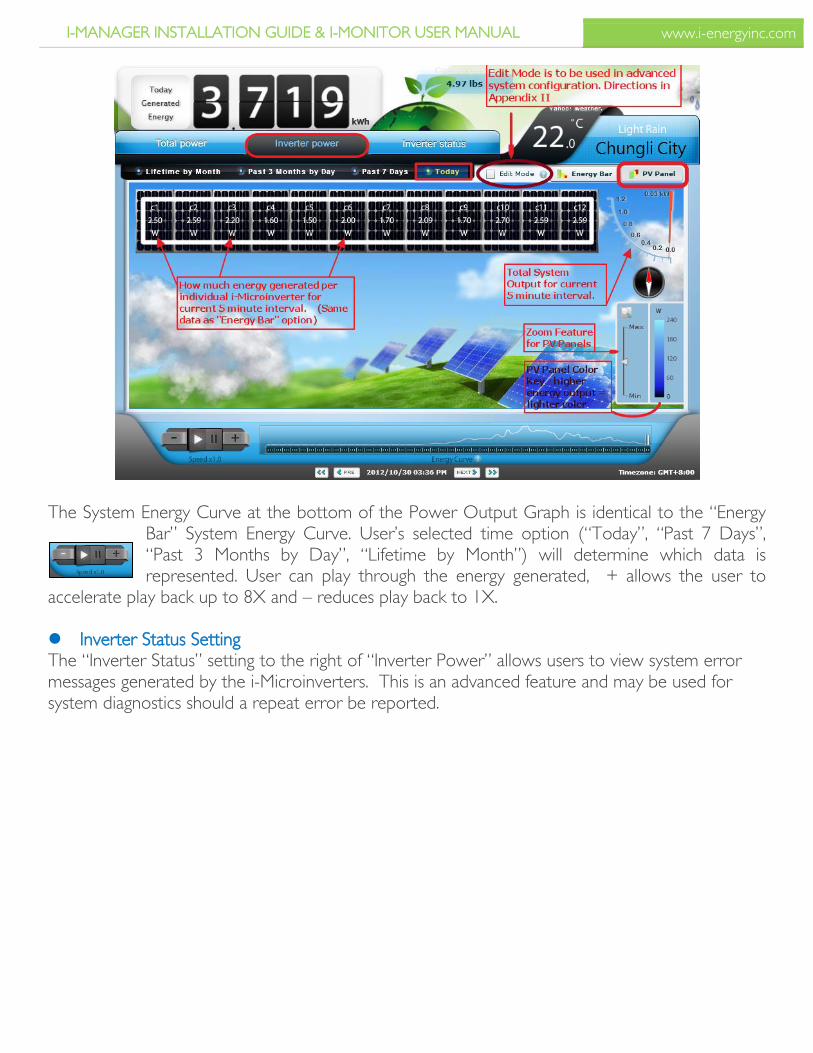
The System Energy Curve at the bottom of the Power Output Graph displays the Past 3 Months by Day total energy generated. User can play through the energy generated during the Past 3 Months by Day. + allows the user to accelerate play back up to 8X and – reduces play back to 1X. 4. “Inverter Power” – “Lifetime by Month” “Inverter Power” – “Lifetime by Month” Graph displays how much energy each i-Microinverter has generated for the current month. Power Output Graph - Inverter Power: Panel Setting The Power Output Graph’s “Inverter Power” Setting has a “PV Panel” feature located just under the weather section to the right of the “Energy Bar” feature. 1. The “PV Panel” feature simply replaces the Energy Bars in the “Energy Bar” setting with a graphical representation of PV Panels in the user’s system. The center of each PV Panel lists the numerical value of the energy being generated according to the user’s selected time option (“Today”, “Past 7 Days”, “Past 3 Months by Day”, “Lifetime by Month”). The data displayed is identical to the “Energy Bar” setting just presented in a different format.
I-MANAGER INSTALLATION GUIDE & I-MONITOR USER MANUAL www.i-energyinc.com
The System Energy Curve at the bottom of the Power Output Graph is identical to the “Energy
Bar” System Energy Curve. User’s selected time option (“Today”, “Past 7 Days”, “Past 3 Months by Day”, “Lifetime by Month”) will determine which data is represented. User can play through the energy generated, + allows the user to
accelerate play back up to 8X and – reduces play back to 1X. Inverter Status Setting The “Inverter Status” setting to the right of “Inverter Power” allows users to view system error messages generated by the i-Microinverters. This is an advanced feature and may be used for system diagnostics should a repeat error be reported.
I-MANAGER INSTALLATION GUIDE & I-MONITOR USER MANUAL www.i-energyinc.com
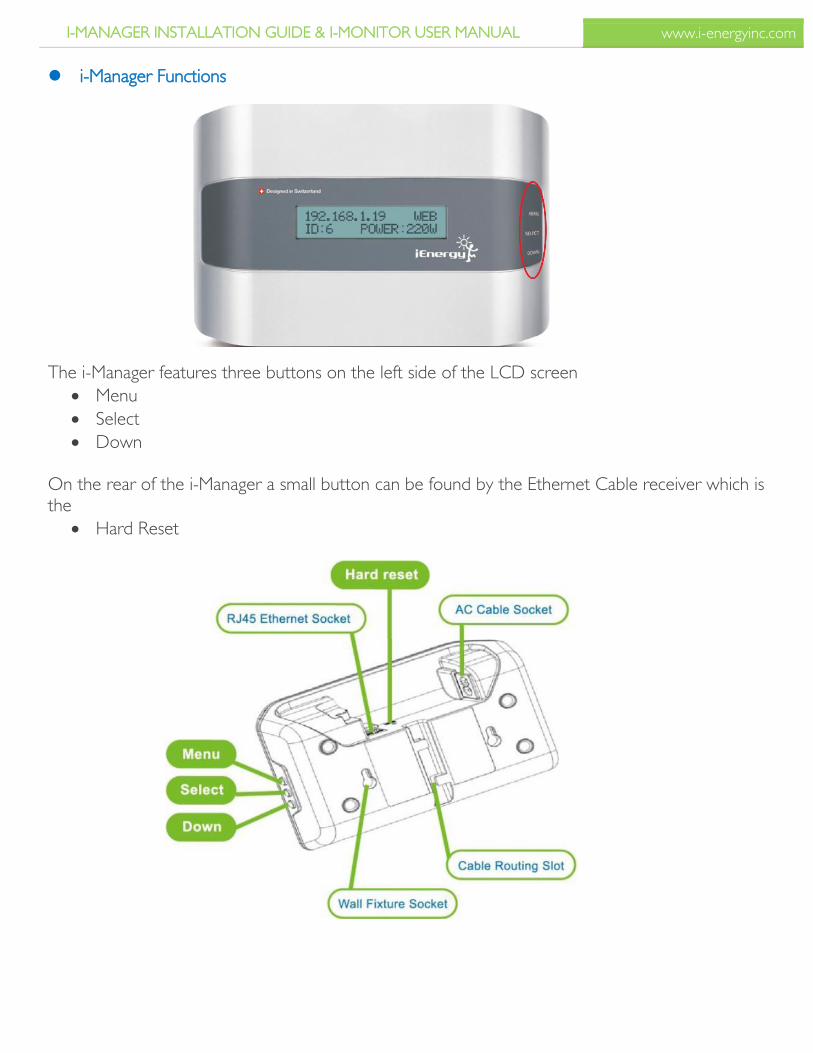
i-Manager Functions The i-Manager features three buttons on the left side of the LCD screen
Menu
Select
Down On the rear of the i-Manager a small button can be found by the Ethernet Cable receiver which is the
Hard Reset


