INSTITUTE OF PHYSICS PUBLISHING JOURNAL OF MICROMECHANICS AND MICROENGINEERING
J. Micromech. Microeng. 16 (2006) 2771–2782 doi:10.1088/0960-1317/16/12/034
Modeling of frictional gas flow effects in apiezoelectrically actuated low leak-ratemicrovalve under high-pressureconditionsC A Johnson1,3, J M Khodadadi1 and E H Yang2
1 Mechanical Engineering Department, Auburn University, 270 Ross Hall, Auburn,AL 36849-5341, USA2 Department of Mechanical Engineering, Stevens Institute of Technology,Castle Point on the Hudson, Hoboken, NJ 07030, USA
Received 19 April 2006, in final form 29 September 2006Published 17 November 2006Online at stacks.iop.org/JMM/16/2771
AbstractOne-dimensional modeling of steady frictional radial flow of a perfect gasthrough a high-pressure piezoelectrically actuated microvalve under lowleak-rate conditions is studied. Focusing on the micro-scale gap between theboss and seat plates, a model was developed for axisymmetric flow betweentwo thermally insulated, parallel disks flowing radially toward an outlet holeat the center of the bottom disk. The fourth-order Runge–Kutta algorithmwas utilized to integrate a system of nonlinear ordinary differentialequations that govern the variations of flow properties. The most notableobservation is that of a drastic increase in density and static pressure incontrast to a rather small increase in the Mach number (or velocity). Thetotal pressure drop was also shown to be significant across the seat rings. A2D Stokes flow model was also derived for incompressible, axisymmetric,radial flow between two concentric parallel disks in order to verify thetrends of the flow property variations from the compressible radial flowmodel. The Stokes flow model trends for both static and total pressureconcurred with the predictions of the radial compressible flow model. Inaddition, a comparison of Stokes flow values for both the static pressure riseand the total pressure drop to that of the numerical results demonstrates thenecessity of accounting for compressibility effects.
(Some figures in this article are in colour only in the electronic version)
1. Introduction
Reduction in the mass and size of a space instrument orsubsystem brings about substantial savings in launch costs.In order to enable the construction of such miniaturizedspacecraft, each subsystem (e.g. propulsion module) has tofit within the spacecraft size, mass and power envelope.The miniaturized propulsion module for such spacecraftswill depend on precisely controlled propellant flow from a3 Current address: Northrop Grumman Laser Systems, 2787 S. OrangeBlossom Trail, Apopka, FL 32703, USA.
pressurized propellant tank. A rapid-actuation, leak-tightmicrovalve at high propellant pressures is therefore required.In addition, microvalves with normally closed operation areneeded, given limited power constraints. Most microvalvesreported previously require further improvement in valveseating and pressure handling capability (Bosch et al 1993,Barth 1995, Lynch et al 2005, Ksrobanek et al 1997, Messneret al 1998, Dubois et al 2001). Prompted by these drawbacks,work at NASA’s Jet Propulsion Laboratory (JPL) has ledto the development of a leak-tight piezoelectric microvalvethat operates at extremely high pressures for microspacecraft
Figure 1. Schematic diagram of the core components of the JPLmicrovalve.
applications (Yang et al 2004). The device is a normallyclosed microvalve assembled and fabricated primarily frommicromachined silicon wafers. The microvalve consists ofa custom-designed piezoelectric stack actuator bonded ontosilicon valve components (such as the seat, boss and tether).The valve seat configurations include narrow-edge seatingrings and tensile-stressed silicon tethers that enable the desired,normally closed, leak-tight operation. Dynamic microvalveoperation has been successfully demonstrated for various inletpressures. This piezoelectric microvalve also has potentialcommercial applications, including DNA analysis, miniaturedrug dosing systems, lab-on-a-chip and total micro-analysis,precision gas and chemical flow control for semiconductormanufacturing, precision dispensing, micro fuel cells andmicro coolers for electronics.
As for the modeling of gaseous microvalves, the worksof Robertson and Wise (2001), van der Wijngaart (2002),van der Wijngaart et al (2005) and Henning (2003) havegreatly contributed to the development of comprehensivegas flow models that account for the relevant operatingconditions. This paper seeks to extend the realm of previous
Seat Ring
Outlet
Inlet
Outlet
Figure 2. Scanning electron micrographs (SEM) of the seat plate of the microvalve.
models by considering the frictional effects within micron-scale passageways of JPL’s gaseous microvalve.
2. Specific JPL microvalve
The schematic of the core components of the microvalveincluding a seat plate consisting of narrow seat rings, a bossplate and a custom designed piezoelectric stack actuator isshown in figure 1. The piezoelectric stack actuator exerts avery high block-force up to one kilo Newton that provides avalve-opening pressure far greater than the seating pressure.In this paper, the seating pressure means the force per areaover the top surface of seat rings. The piezoelectric stackactuator consists of peripheral active zones and an inactivecentral zone. These zones are bonded to the correspondingperipheral and central areas of the boss plate. Application ofa voltage to the piezoelectric stack causes the active zones toexpand vertically, thus lifting the boss center plate away fromthe seat plate. This actuation creates a channel between thetwo seating surfaces, thus permitting the passage of fluids. Aseries of concentric narrow rings (Barth and Gordon 1994) onthe seat plate is designed to provide the redundancy. Scanningelectron micrographs (SEM) of the seat plate of a microvalveare shown in figure 2. These SEMs clearly show the proximityof the inlet and outlet ports. The 1.5 × 10 µm cross-section ofa circular seat ring is clearly visible too. A photograph of themicrovalve package constructed for high-pressure (i.e. >1000psi) testing purpose is shown in figure 3. A schematic drawingof a cut-away view of the microvalve housing that shows themain features is shown in figure 4 (not drawn to scale).
2.1. Characterization of the microvalve
The measured static forward flow rates for helium through anactuated microvalve for various actuation voltages and inletpressures (Yang et al 2004) are shown in figure 5. Piezoelectricactuation was successfully demonstrated for inlet pressures
2772
Modeling of frictional gas flow effects in a piezoelectrically actuated low leak-rate microvalve under high-pressure conditions
Figure 3. Microvalve package before final assembly.
Figure 4. Cut-away view of the microvalve housing (not drawn to scale).
0 5 10 15 20 250
20
40
60
80
100
0
1
2
3
4
Displacem
ent [um]
300 psi 200 psi 100 psi
Flow
rat
e [s
ccm
]
Applied voltage [V]
Figure 5. Measured static forward flow rates of helium for anactuated microvalve for various actuation voltages and inletpressures.
in the range of 0–1000 psi. Measured flow rates, at an actuationvoltage of 10 V, were approximately 52 sccm at an inletpressure of 300 psi. Flow rates at inlet pressures above 300 psiwere above the measurement range of the flow meter used inthe tests. Finally, it needs to be pointed out that the microvalvemodeled in this paper is subject to very high frictional forces,resulting in small flow rates even under high pressures.
3. Modeling issues and reduction of complexity
The flow in the gaseous microvalves is compressible, threedimensional and can be affected by possible non-continuumeffects. A number of difficulties in the computationalmodeling of the detailed three-dimensional flow field withinthe microvalve are encountered. The complexity of geometryand corresponding grid generation with such drasticdifferences between the millimeter-scale housing of the cavityand the micron-scale gap over the seat rings poses a greatchallenge. Furthermore, interaction of the fluid with a movingboundary during dynamic operation is another complicationthat might require dynamic re-meshing.
3.1. Reduction of complexity of geometry and domain ofanalysis
Instead of solving the 3D compressible gaseous flow in theentire microvalve, simplifications of geometry are consideredfor the static operation. Similar approaches have been reportedby others, e.g. Henning (2003). One can note the relativelylarge cavity space as compared to the gap created duringopen static operation (figure 4). Therefore, it can safelybe assumed that within most of the cavity space the gas is
2773
C A Johnson et al
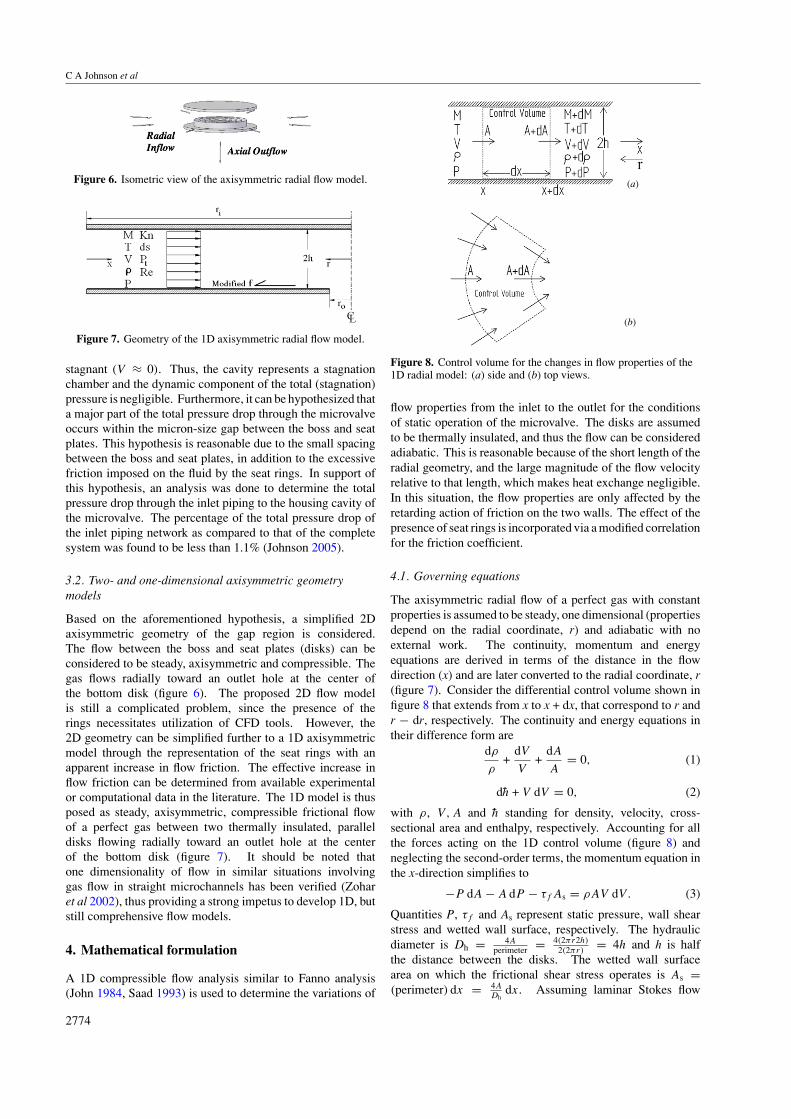
Figure 6. Isometric view of the axisymmetric radial flow model.
Figure 7. Geometry of the 1D axisymmetric radial flow model.
stagnant (V ≈ 0). Thus, the cavity represents a stagnationchamber and the dynamic component of the total (stagnation)pressure is negligible. Furthermore, it can be hypothesized thata major part of the total pressure drop through the microvalveoccurs within the micron-size gap between the boss and seatplates. This hypothesis is reasonable due to the small spacingbetween the boss and seat plates, in addition to the excessivefriction imposed on the fluid by the seat rings. In support ofthis hypothesis, an analysis was done to determine the totalpressure drop through the inlet piping to the housing cavity ofthe microvalve. The percentage of the total pressure drop ofthe inlet piping network as compared to that of the completesystem was found to be less than 1.1% (Johnson 2005).
3.2. Two- and one-dimensional axisymmetric geometrymodels
Based on the aforementioned hypothesis, a simplified 2Daxisymmetric geometry of the gap region is considered.The flow between the boss and seat plates (disks) can beconsidered to be steady, axisymmetric and compressible. Thegas flows radially toward an outlet hole at the center ofthe bottom disk (figure 6). The proposed 2D flow modelis still a complicated problem, since the presence of therings necessitates utilization of CFD tools. However, the2D geometry can be simplified further to a 1D axisymmetricmodel through the representation of the seat rings with anapparent increase in flow friction. The effective increase inflow friction can be determined from available experimentalor computational data in the literature. The 1D model is thusposed as steady, axisymmetric, compressible frictional flowof a perfect gas between two thermally insulated, paralleldisks flowing radially toward an outlet hole at the centerof the bottom disk (figure 7). It should be noted thatone dimensionality of flow in similar situations involvinggas flow in straight microchannels has been verified (Zoharet al 2002), thus providing a strong impetus to develop 1D, butstill comprehensive flow models.
4. Mathematical formulation
A 1D compressible flow analysis similar to Fanno analysis(John 1984, Saad 1993) is used to determine the variations of
(a)
(b)
Figure 8. Control volume for the changes in flow properties of the1D radial model: (a) side and (b) top views.
flow properties from the inlet to the outlet for the conditionsof static operation of the microvalve. The disks are assumedto be thermally insulated, and thus the flow can be consideredadiabatic. This is reasonable because of the short length of theradial geometry, and the large magnitude of the flow velocityrelative to that length, which makes heat exchange negligible.In this situation, the flow properties are only affected by theretarding action of friction on the two walls. The effect of thepresence of seat rings is incorporated via a modified correlationfor the friction coefficient.
4.1. Governing equations
The axisymmetric radial flow of a perfect gas with constantproperties is assumed to be steady, one dimensional (propertiesdepend on the radial coordinate, r) and adiabatic with noexternal work. The continuity, momentum and energyequations are derived in terms of the distance in the flowdirection (x) and are later converted to the radial coordinate, r(figure 7). Consider the differential control volume shown infigure 8 that extends from x to x + dx, that correspond to r andr − dr, respectively. The continuity and energy equations intheir difference form are
dρ
ρ+
dV
V+
dA
A= 0, (1)
dh̄ + V dV = 0, (2)
with ρ, V,A and h̄ standing for density, velocity, cross-sectional area and enthalpy, respectively. Accounting for allthe forces acting on the 1D control volume (figure 8) andneglecting the second-order terms, the momentum equation inthe x-direction simplifies to
−P dA − A dP − τf As = ρAV dV. (3)
Quantities P, τf and As represent static pressure, wall shearstress and wetted wall surface, respectively. The hydraulicdiameter is Dh = 4A
perimeter = 4(2πr2h)
2(2πr)= 4h and h is half
the distance between the disks. The wetted wall surfacearea on which the frictional shear stress operates is As =(perimeter) dx = 4A
Dhdx. Assuming laminar Stokes flow
2774
Modeling of frictional gas flow effects in a piezoelectrically actuated low leak-rate microvalve under high-pressure conditions
of an incompressible fluid flowing radially between twoconcentric disks, a parabolic velocity distribution for the radialvelocity component (Vr) can be derived (Johnson 2005). Theappropriate relation for the wall shear stress is
τf = µ
∣∣∣∣dVr
dz
∣∣∣∣z=+h
= hdP
dr= 3µV
h, (4)
with µ and z being the fluid viscosity and axial coordinate,respectively. The friction factor (f ) is
f = 4τf
12ρV 2
= 8(3µV/h)
ρV 2= 24µ
ρV h= 24
Reh= 96
ReDh
. (5)
Note that the Reynolds number will change in the flowdirection due to the variation of area. Substituting for thewetted surface area As and τf , equation (3) becomes
−P dA − A dP − 1
2ρV 2f
dx
DhA = ρAV dV. (6)
Combining the perfect gas, continuity and energy relationsin their difference form (Johnson 2005) and upon conversion ofthe independent variable x into radial coordinate (r) with dr =−dx, the following differential equation for radial dependenceof the Mach number (M = V/
√γRT ) is obtained:
dM
dr= −γM3 f
Dh
(1 + γ−1
2 M2)
2(1 − M2). (7)
Quantities γ , R and T stand for the ratio of the specificheats, gas constant and temperature, respectively. Differentialequations describing the variations of other flow properties,i.e. pressure, temperature, velocity, density, total pressure (Pt)and entropy change (ds) can be derived. These relations arenot repeated here due to space limitations but can be foundelsewhere (Johnson 2005). It should be noted that for the flowcondition where the fluid will travel radially outward from thesymmetry axis, the above model will hold with minor changesin its derivation.
4.2. Dimensionless form of the differential equations
The governing equations (except the entropy change relation)are non-dimensionalized using the inlet conditions at the outeredge of the disk. Denoting the inlet conditions with subscript‘i’, the dimensionless variables are symbolized by superscript‘+’. The dimensionless forms of the differential equations arethen
dM+
dr+= −
M2i γ ri
Dh
(F 96
ReDh
)M+3(
1 + (γ−1)
2 M2i M+2)
2(1 − M2
i M+2) , (8)
dP +
dr+= −P +
r+− dM+
dr+
((1 + (γ − 1)M2
i M+2)(1 + (γ−1)
2 M2i M+2
))
P +
M+, (9)
dT +
dr+= −dM+
dr+
((γ − 1)M2
i M+T +(1 + (γ−1)
2 M2i M+2
))
, (10)
dV +
dr+= dM+
dr+
(V +
M+
) (1
1 + γ−12 M2
i M+2
), (11)
dρ+
dr+= −
(ρ+
V +
) (dV +
dr+
)−
(ρ+
r+
), (12)
dP +t
dr+= −
(1 − M2
i M+2)(1 + γ−1
2 M2i M+2
) (P +
t
M+
)dM+
dr+, (13)
ds
Cp= − (γ − 1)
γ
dPt
Pt. (14)
Variables with subscript (i) indicate values evaluated at theinlet station, whereas Cp stands for the constant pressurespecific heat. The effect of the presence of the seat rings onthe flow properties is accounted for by employing a modifiedfriction coefficient (F), through correlating the computationaldata of Luy et al (1991). The relevant details are given byJohnson (2005). Although the data of Luy et al (1991) weredeveloped for a channel flow geometry, it is reasonable toalso apply the correlation to the radial flow model becausein taking infinitesimal steps in the radial direction the cross-sectional area does not change drastically. The correlation forthe modified friction coefficient is given by
F = 0.713 826 e3.86602E e0.00117 ReDh , (15)
where E is the dimensionless height of the seat rings (i.e.height/2h) and ReDh
is the Reynolds number based on thehydraulic diameter (4h). Note that the Reynolds numbercan change throughout the flow field. Even though theoriginal computational data of Luy et al (1991) also provideinformation on the spacing between the seat rings, therelatively long distance in relation to the height of the seatrings necessitated ignoring its effect. Based on the existingbody of knowledge on flows past obstacles in passageways,it is generally agreed that the effect of width of the rings isgenerally negligible. The modified friction coefficient canalso depend on non-continuum effects via dependence onthe Knudsen number (Karniadakis et al 2005, among manyothers). As discussed later, the non-continuum effects werenot utilized, since the Knudsen number was shown to decreaseas the gas got closer to the outlet port.
Details of the numerical methods, benchmarkinginformation and results of the predictions based on the radialflow model are now presented.
4.3. Numerical analysis
The fourth-order Runge–Kutta method was employed for thenumerical integration of the system of simultaneous nonlinearordinary differential equations. This method was utilizedbecause of its high accuracy and convenience involving initialvalue problems. It only requires the appropriate initialconditions, beginning and end points and the step size of theindependent variable. Some examples of fluid flow problemsthat are solved using the Runge–Kutta algorithm (Burden andFaires 1997) have been discussed by White (1991).
4.3.1. Initial conditions. The initial conditions for all flowproperties are set equal to unity, except for the entropychange that was set to zero. Additionally, in order tointegrate the differential equations (Equations (8)–(14)), initialcondition quantities for the ratio of specific heats, Machnumber, Reynolds number and modified friction coefficientare required. The working fluid is helium and its propertieswere taken from Tsederburg et al (1971). The initial Reynoldsand Mach numbers are calculated using the initial velocity
2775
C A Johnson et al
Table 1. Measured (Yang et al 2004) and extrapolated initial flow conditions.
Pti (psig) H (µm) Q (SCCM) Q (ACMM) Vi (m s−1) Mi ReDhi E D Fi
Note. SCCM: standard cubic centimeters per minute, ACMM: actual cubic meters per minute.
(derived from flow rate Q), initial density, hydraulic diameterand viscosity of the fluid. The initial Mach number and theReynolds number values are used to initialize the Knudsennumber
(Kni = Mi Re
−1/2Dhi
). The initial value of the modified
friction coefficient is calculated using equation (15).The initial flow conditions were extrapolated from the
experimental results reported by Yang et al (2004) usinga least-squares fit to the measurements shown in figure 5(Johnson 2005). The JPL microvalve successfully operates atpressures up to 1000 psig; however the flowmeter used couldonly measure flow rates with an inlet pressure range up to300 psig. The microvalve has a deflection (shown asdisplacement in figure 5) range of 1–5 µm from the topof the 10 µm seat rings. With the effect of the seat ringsaccommodated in the model by the modified friction factor, thegap between the two disks (H = 2h) varies from 11 to 15 µm.Therefore, 15 sets of initial values were determined for eachof the deflections at three inlet total pressures of 100, 200 and300 psig. The initial flow conditions are tabulated in table 1.It is noted that the Mach numbers are extremely low and theinitial values of ReDhi are of the order of 15 or less. Theenhanced effect of friction due to the presence of the seat ringsat the inlet station is estimated to be as high as 24 times the casewithout the rings. Note that the values of the dimensionlessspacing between the seat rings (D = spacing/2h) are also givenin table 1.
4.3.2. Benchmarking of the computer code and related issues.The predictions of the computer code for the case of no areachange were successfully compared to the analytic solutions(Saad 1993) and the details are given by (Johnson 2005).Having satisfied the benchmarking criteria, the computer codewas confirmed to be accurate and viable. It was determinedduring benchmarking of the computer code that a uniformstep size will not be sufficient in producing accurate results(Johnson 2005). This situation was remedied by employing ashrinking step size (�r+) that was derived from a geometricseries. The step size shrinks at a user-specified percentage ofthe previous step size, i.e,
�r+i+1 = ω�r+
i , (16)
with constant ω < 1. The first step size (�r+1 ) necessary for
the series of steps to end at the user-specified end point is
�r+1 = (
r+N − r+
1
) (1 − ω)
(1 − ωN), (17)
where r+N is the ending point of integration, r+
1 is the beginningpoint and N is the total number of points. Through trial anderror, the most effective ω value was 0.96 for all 15 cases. Thebeginning and end points of integration were r+
1 = r+i = 1 (ri =
3000 µm) and r+N = r+
o = 1/30 (ro = 100 µm), respectively.The number of steps used was 1000.
5. Results and discussion
Fifteen cases were simulated corresponding to the entries oftable 1. The results will be presented for three inlet totalpressure conditions of 100, 200 and 300 psig. These inlet totalpressure values are loosely used to notify operating conditionsin the figures that are presented next.
5.1. Variation of the Reynolds number
The dependence of the local Reynolds number on theradial position for an initial total pressure of 300 psig isshown in figure 9. Starting at the respective initial valuesat r+ = 1 tabulated in table 1, the Reynolds number isconsistently observed to rise as the gas nears the outlet atr+o = ro/ri = 1/30 = 0.033. It can be shown that the
Reynolds number varies inversely with the radial position,r+ (Johnson 2005). The predicted Reynolds number agreedclosely to the analytical Reynolds number relation.
5.2. Variation of the change in entropy
The flow was assumed to be adiabatic and is irreversibledue to friction. Therefore, according to the second law ofthermodynamics there must be an entropy rise in this system.The variations of the change in entropy with the radial positionfor an initial total pressure of 100 psig that is shown infigure 10 clearly exhibit this trend. The observed entropy
2776
Modeling of frictional gas flow effects in a piezoelectrically actuated low leak-rate microvalve under high-pressure conditions
Figure 10. Variation of the change in entropy for an inlet total pressure of 100 psig.
rise is directly related to the incurred loss of the total pressurethat will be discussed in detail below.
5.3. Variation of the Mach number and velocity
Due to the near-isothermal nature of this flow (Johnson 2005),the variations of the Mach number (M+) and velocity (V+)are very similar. In interpreting the predicted Mach number(figure 11) for an initial total pressure of 100 psig, considerequation (8). The hydraulic diameter, gas constant, frictionfactor and M are always positive. Therefore, the denominatordetermines the sign of dM+
dr+ . If the Mach number is lessthan 1, the slope is positive and if the Mach number isgreater than 1 the slope is negative. The operating Machnumbers of the current radial flow cases were subsonic anda gradual increase of the Mach number in the flow directionis expected. As for the dimensionless velocity, the gas isobserved to accelerate in the flow direction (figure 12 for aninitial total pressure of 300 psig); however the velocity riseis not significant. The variation of the dimensionless velocity
for an incompressible fluid(V +
ρ=const. = 1r+
)is also shown,
suggesting that an incompressible fluid will dramaticallyaccelerate in the flow direction. The marked disparity of thepredictions of the compressible model in comparison to theincompressible flow relation points to the obvious need foraccounting for the compressibility effects. It should be notedthat similar conclusions were drawn by Zohar et al (2002)who studied subsonic steady isothermal compressible gas flowin straight and uniform microchannel both analytically andexperimentally.
5.4. Variation of the total pressure
In interpreting the predictions for the variation of the totalpressure (figure 13) for an initial total pressure of 100 psig,consider equation (14). Since the change in entropy forfrictional flow is always positive, this equation indicates thatthere is a decrease in the total pressure regardless of whetherthe flow is subsonic or supersonic. The numerical predictionsof the total pressure drop through the passageway are compared
Figure 12. Variation of the velocity for an inlet total pressure of 300 psig.
to the total pressure drop relation for Stokes flow (Johnson2005)
�Pt = Pti − Pto = −1
4
Q
πh2
[3µ
hln
(ri
ro
)
+ρ
8
Q
π
(1
r2o
− 1
r2i
)], (18)
in table 2 (Q is the volumetric flow rate). It is clear thatthe total pressure drop for the Stokes incompressible flow isconsistently lower than the predictions of the radial modelthat accounts for the compressibility effect. The numericalpredictions of the total pressure drop in comparison to theStokes relation are shown in figure 14. For an imposed totalpressure at the inlet station (Pti = constant), both approachesshow that as the spacing is changed from 11 to 15 µm, theincurred total pressure drop is observed to rise with the massflow rate. Note that the percentage difference between thepredictions and Stokes relation diminishes as the spacing israised. This is expected since the effect of the ring becomesmore negligible as the two disks move apart and the Stokesmodel becomes more realistic.
5.5. Variation of the static pressure
The dependence of the static pressure on the radial coordinatefor an inlet total pressure of 100 psig is shown in figure 15.The pressure rise in the flow direction was observed to beweakly affected by the value of the initial total pressure orthe gap between the two disks. The pressure variation of anideal incompressible fluid (Bernoulli’s equation) is also shownin figure 15. In contrast to the pressure rise trends predictedby the compressible model, Bernoulli’s equation predicts thatthe pressure will decrease in the flow direction. In order toaddress these contradicting behaviors, two other simplifiedmodels for the static pressure variation were derived, namely(a) ideal compressible flow and (b) Stokes flow. For the presentsimulated cases for which Mi are extremely small, the idealcompressible model gives P+ ≈ 1. The predictions of the fluidstatic pressure within the passageway using the Stokes flowmodel are shown in figure 16 for the cases with Pti = 300 psigand H = 11 and 15 µm. The more realistic Stokes model thataccounts for fluid viscosity predicts a static pressure rise thatis in concert with the numerical predictions. The Stokes flow
2778
Modeling of frictional gas flow effects in a piezoelectrically actuated low leak-rate microvalve under high-pressure conditions
Figure 16. Variation of the static pressure for the Stokes flow relation for an inlet total pressure of 300 psig.
relation for the static pressure rise through the passageway,i.e.,
�P = 3µQ
4πh3ln
ri
ro
, (19)
is compared to the pressure rise predictions in table 3. Thecompressible model predictions for static pressure rise throughthe passageway are consistently much higher than those of theStokes flow relation. This marked difference between the twoapproaches further reinforces the need for accounting for thecompressibility effects. In addition to the rigorous theoreticalderivation that is developed to help describe the predictedpressure rise in the flow direction, it is noted that Kwok andLee (1978–1979) have obtained similar results upon applyingan integral method for analysis of compressible flow betweenparallel disks.
5.6. Variation of the density
Due to the predicted negligible temperature change (Johnson2005), density exhibits a similar trend to that of staticpressure (figure 17). The drastic increase in density as
compared to the relatively small increase in the Mach numbersuggests that the fluid is compressed markedly more than itis being accelerated. Using the continuity relation, a simplerealizability condition (i.e. ρ+V +r+ = 1) must be satisfiedby the predicted dimensionless density and velocity valuesat every radial location. This relation was shown to holdextremely well.
5.7. Variation of the Knudsen number
The Knudsen number can be used for determining the validityof the continuum or rarefied flow. The criterion for thecontinuum flow assumption for large Re is (John 1984)
Kn = M√Re
< 0.01. (20)
Variation of the local Knudsen number throughout the flow foran initial total pressure of 100 psig is given in figure 18. Itis observed that Kn is decreasing nonlinearly. This decreaserepresents a shortening of the mean free path that is consistentwith a rise of fluid density in the flow direction. Therefore, the
2780
Modeling of frictional gas flow effects in a piezoelectrically actuated low leak-rate microvalve under high-pressure conditions
continuum assumption remains valid, and it is not necessaryto consider a slip flow condition on the walls.
Finally, the total pressure drop through the outlettube of the microvalve (figure 4) for the conditions ofincompressibility and compressibility was determined. Thesevalues were found to be negligible compared to the totalpressure drop predicted by the radial flow model. This furthersupports the initial hypothesis that most of the total pressuredrop within the valve occurs as the gas flows over the seatrings.
6. Conclusions
The main conclusions of this modeling study are
(1) A 1D flow model was developed for steady, axisymmetric,compressible frictional flow of a perfect gas between twothermally insulated, parallel disks flowing radially towardan outlet hole at the center of the bottom disk. This modelwas implemented to determine the variation of propertiesof the flow between the boss and seat plates of a JPLmicrovalve. The most interesting finding from the flowproperty trends is that of a drastic increase in densityand static pressure in contrast to a rather small increasein the Mach number (or velocity). One can infer fromthese findings that the gas is being compressed markedlythan it is being accelerated. Also of importance, the totalpressure drop was shown to be significant across the seatrings.
(2) A 2D Stokes flow model was derived for incompressible,axisymmetric, radial flow between two concentric paralleldisks. The results of this model were used to verify theflow property variations from the radial flow model. Thetrends of the Stokes flow model for both static and totalpressure were in accordance with the predictions of theradial compressible flow model. In addition, a comparisonof Stokes flow values for both the static pressure riseand the total pressure drop to that of the numericalresults demonstrates the necessity of accounting forcompressibility effects.
(3) The total pressure loss through the inlet and outlet tubes ofthe microvalve was found to be negligible in comparisonto that of the total pressure loss across the seat rings, thusverifying the hypothesis that most of the total pressuredrop occurs across the seat rings between the boss andseat plates.
Acknowledgment
The first author acknowledges the financial support of theAlabama Space Grant Consortium through a fellowship(NASA Training Grant NGT5-40077).
References
Barth P W 1995 Silicon microvalves for gas flow controlTransducers ’95 (Stockholm, Sweden) pp 276–9
Barth P W and Gordon G B 1994 High performance micromachinedvalve orifice and seat US Patent 5,333,831 (August 2, 1994)
Bosch D, Heimhofer B, Muck G, Seidel H, Thumser U andWelser W 1993 A silicon microvalve with combinedelectromagnetic/electrostatic actuation SensorsActuators 37–38 684–92
Burden R L and Faires J 1997 Numerical Analysis 6th edn (PacificGrove, CA: Brooks/Cole Pub. Co.)
Dubois Ph, Guldimann B, Gretillat M-A and de Rooij N F 2001Electrostatically actuated gas microvalve based on a Ta–Si–Nmembrane Proc. 14th IEEE MEMS 2001 Tech. Dig.pp 535–8
Henning A K 2003 Improved gas flow model for microvalves Proc.TRANSDUCERS ’03: 12th Int. Conf. on Solid State Sensors,Actuators and Microsystems (Piscataway, NJ: IEEE Press)pp 1550–3
John J E A 1984 Gas Dynamics 2nd edn (Upper Saddle River, NJ:Prentice-Hall)
Johnson C A 2005 Modeling of frictional gas flow in apiezoelectrically actuated high-pressure microvalve forflowrate control MS Thesis Department of MechanicalEngineering, Auburn University
Karniadakis G, Beskok A and Aluru N 2005 Microflows andNanoflows: Fundamentals and Applications (New York:Springer)
Ksrobanek K D, Kohl M and Miyazaki S 1997 Stress-optimizedshape memory microvalves Proc. 10th IEEE MEMS 1997 Tech.Dig. pp 256–61
Kwok C and Lee P W 1978–79 Integral equation method forcompressible flow between parallel discs Trans. Can. Soc.Mech. Eng. 5 55–8
Luy C-D, Cheng C-H and Huang W-H 1991 Forced convection inparallel-plate channels with a series of fins mounted on the wallAppl. Energy 39 127–44
Lynch B A, Jamieson B G, Roman P A and Zakrzwski C M 2005An empirical study of boss/seat materials and geometries forultra low-leakage MEMS micro-valves Proc. ASME Int.Mechanical Engineering Congress and Exposition ASMEPaper IMECE 2005-81082
Messner S, Muller M, Burger V, Schaible J, Sandmaier H andZengerle R 1998 A normally-closed, bimetallically actuated3-way microvalve for pneumatic applications Proc. 11th IEEEMEMS 1998 Tech. Dig. (Heidelberg) pp 40–4
Robertson J K and Wise K D 2001 Modeling a microfluidic systemusing Knudsen’s empirical equation for flow in the transitionregime J. Vac. Sci. Technol. A 19 358–64
Saad M A 1993 Compressible Fluid Flow 2nd edn (EnglewoodCliffs, NJ: Prentice-Hall)
Tsederburg N V, Popov V N and Morozova N A 1971Thermodynamic and Thermophysical Properties of Heliumed A F Alyab’ev (Jerusalem: Israel Program for ScientificTranslations) (translated from Russian)
van der Wijngaart W 2002 Designing microfluidic controlcomponents PhD Dissertation Royal Institute of Technology,Sweden
van der Wijngaart W, Thorsen A and Stemme G 2005 A seatmicrovalve nozzle for optimal gas-flow capacity atlarge-controlled pressure J. Microelectromech. Syst.14 200–6
White F M 1991 Viscous Fluid Flow 2nd edn (New York:McGraw-Hill)
Yang E-H, Lee C, Mueller J and George T 2004 Leak-tightpiezoelectric microvalve for high-pressure gas micropropulsionJ. Microelectromech. Syst. 13 799–807
Zohar Y, Lee S Y K, Lee W Y, Jiang L and Tong P 2002 Subsonicgas flow in a straight and uniform microchannel J. FluidMech. 472 125–51


![ViX Series - Micromech · in the global industrial market. ... advanced operations such as external encoder following and registration ... Capacitance power module [µF] 3300 6600](https://static.documents.pub/doc/80x56/5b08adb97f8b9a3d018c8891/vix-series-the-global-industrial-market-advanced-operations-such-as-external.jpg)


