47
PROFILE ON THE PRODUCTION OF CALCIUM CARBONATE AND LIME i

PROFILE ON THE PRODUCTION OF CALCIUM
CARBONATE AND LIME
i

TABLE OF CONTENTS
PAGE
I. SUMMARY 29-2
II. PRODUCT DESCRIPTION & APPLICATION 29-3
III. MARKET STUDY AND PLANT CAPACITY 29-4
A. MARKET STUDY 29-4
B. PLANT CAPACITY & PRODUCTION PROGRAM 29-10
IV. MATERIALS AND INPUTS 29-11
A. RAW & AUXILIARY MATERIALS 29-11
B. UTILITIES 29-12
V. TECHNOLOGY & ENGINEERING 29-13
A. TECHNOLOGY 29-13
B. ENGINEERING 29-15
VI. MANPOWER & TRAINING REQUIREMENT 29-19
A. MANPOWER REQUIREMENT 29-19
B. TRAINING REQUIREMENT 29-21
VII. FINANCIAL ANLYSIS 29-21
A. TOTAL INITIAL INVESTMENT COST 29-21
B. PRODUCTION COST 29-23
C. FINANCIAL EVALUATION 29-23
D. ECONOMIC & SOCIAL BENEFITS 29-25
ii
I. SUMMARY
This profile envisages the establishment of a plant for the production of precipitated calcium
carbonate and lime with a capacity of 10,000 tons and 5,000 tons per annum respectively.
Precipitated calcium carbonate is used as filler and coating pigment in the manufacturing of
paper, plastic products and paint while lime widely used in construction industry in the
preparation of mortar and plasters.
Since there are no local producers of precipitated calcium carbonate, the demand for the product
is entirely met through import while the demand for lime is met through both import and local
production. The present (2012) demand for precipitated calcium carbonate and lime is estimated
at 7,655 tons and 6,050 tons, respectively. The demand for calcium carbonate is projected reach
13,561 tons and 21,840 tons by the year 2018 and year 2023, respectively. Similarly, the
unsatisfied demand (supply shortage) for lime is projected reach 8,442 tons and 17,544 tons by
the year 2018 and year 2023, respectively.
The principal raw material required is limestone which is locally available.
The total investment cost of the project including working capital is estimated at Birr 60.34
million (see Table 7.1). From the total investment cost, the highest share (Birr 39.33 million or
65.19%) is accounted by fixed investment cost followed by initial working capital ( Birr 15.66
million or 25.96%) and pre operation cost (Birr 5.34 million or 8.85%). From the total
investment cost Birr 19.35 million or 32.07% is required in foreign currency.
The project is financially viable with an internal rate of return (IRR) of 20.02% and a net present
value (NPV) of Birr 33.70 million, discounted at 10%.
The project can create employment for 69 persons. The establishment of such factory will have
a foreign exchange saving effect to the country by substituting the current imports. The project
will also create forward linkage with the manufacturing and construction sectors and back ward
linkage with the mining sector and also generates income for the Government in terms of tax
revenue and payroll tax.
iii
II. PRODUCT DESCRIPTION AND APPLICATION
Precipitated calcium carbonate is an in organic chemical obtained by calcining naturally
occurring lime stone, slaking and carbonation. Precipitated calcium carbonate is pure form of
lime stone used in the chemical industries.
Precipitated calcium carbonate (PPC) is used as filler & coating pigment for premium quality
paper products. PCC improves optical properties and print characterized of paper products,
improves paper machine productivity & reduces paper making costs through the replacement of
more expensive Pulp fiber & optical brightening agent.
PCC also finds many industrial uses, based on the ability to achieve small particle size and
special crystal shapes. In rigid PVC, such as vinyl siding and fencing, PCC increases impact
strength, with some of the smaller particles able to replace expensive impact modifiers. Nano
PCCs (less than 0.1 micron in size) control viscosity and sag in automotive and construction
sealants, such as PVC plastisols, polysulfide, urethanes and silicones. In paint, PCC’s unique
particle shapes improve hiding and allow reductions in titanium dioxide levels.
An Effective acid neutralizer, PCC is often used in calcium-based antacid tablets and liquids.
Being high in calcium content, PCC enables the formulation of high dosage calcium supplements
and multi-vitamin/mineral tablets. The small particle sizes and special particle shape contribute
to the development of good tasting calcium fortified.
In paint, which is another important applications, calcium carbonate has now established it self
as the main extender. Fineness and particle-size distribution determine the opacity. Moreover,
calcium carbonate offers interesting properties as regard to weather resistance, low abrasiveness,
low electrolyte content, pH stabilizing effect, and improved anti-corrosion and rheological
properties of coatings. Calcium carbonate is also important in water-based system, in which it
contributes to the shortening of the drying time with - for example - important implications in
road - line markings.
iv

Lime is inorganic chemical compound, which is usually known as quick lime or non-slaked lime
obtained from a naturally occurring compound called limestone. Quick lime that is chemically
expressed as calcium oxide, is a strong caustic ingredient widely used in construction industry in
the preparation of mortar and plasters.
It is also used for white washing of houses and building. Iron and steel plants and foundries use
lime as fluxing agent in considerable quantities. Some drugs and pharmaceuticals, paper mills,
pesticides formulation plants, and other chemical processing industries use it as additives.
Moreover, it has a considerable contribution in agriculture as an agent for removal of excess soil
acidity.
III. MARKET STUDY AND PLANT CAPACITY
A. MARKET STUDY
1. Present Supply and Demand
The demand for calcium carbonate in Ethiopia is entirely met through import, while the source of
supply for lime is domestic production and import. The two factories that supply lime to the
domestic market are Dire Dawa Cement Factory and Ethio-Lime Factory of Senkele. Wonji Shoa
Sugar Factory and Caustic Soda S.C located at Zuway also produce lime entirely for their own
consumption. The historical import data of calcium carbonate and the domestic production &
import of lime is shown in Table 3.1 and Table 3.2, respectively.
v
Table 3.1
IMPORT OF CALCIUM CARBONATE
Year Quantity
(Tons)
Value
( `000 Birr)
2000 1,204.5 1,704
2001 879.1 1,496
2002 1,011.3 1,655
2003 1,604.7 3,009
2004 1,842.2 4,190
2005 2,589.0 6,252
2006 3,517.6 8,426
2007 4,892.7 11,118
2008 6,083.2 20,069
2009 4,933.6 22,779
2010 9,210.0 43,326
2011 6,099.5 43,315
Source: - Ethiopian Revenues & Customs Authority.
vi

Table 3.2
DOMESTIC PRODUCTION AND IMPORT OF LIME (TONS)
Year
Domestic
Production1 Import2 Total (1 +2)
2000/01 11,350 - 11,350
2001/02 7,805 - 7,805
2002/03 10,532 4 10,536
2003/04 15,679 94 15,773
2004/05 11,850 29 11,879
2005/06 8,141 584 8,725
2006/07 4,461 2,029 6,490
2007/08 4,068 1,739 5,807
2008/09 3,829 2,416 6,245
2009/10 3,254 111 3,365
Source: - 1.Central Statistical Agency.
2. Ethiopian Revenues & Customs Authority.
As shown in Table 3.1, import of calcium carbonate has been growing from year to year with
minor fluctuations. The yearly average level of import which was only about 1,000 tons during
the period 2000--2003 has increased to a yearly average of 2,012 tons during the period 2003 -
2005. Similarly, the yearly average imported quantity has increased to 4,831 tons during the
period 2006--2008, which is more than double of the preceding three years average. In the recent
vii
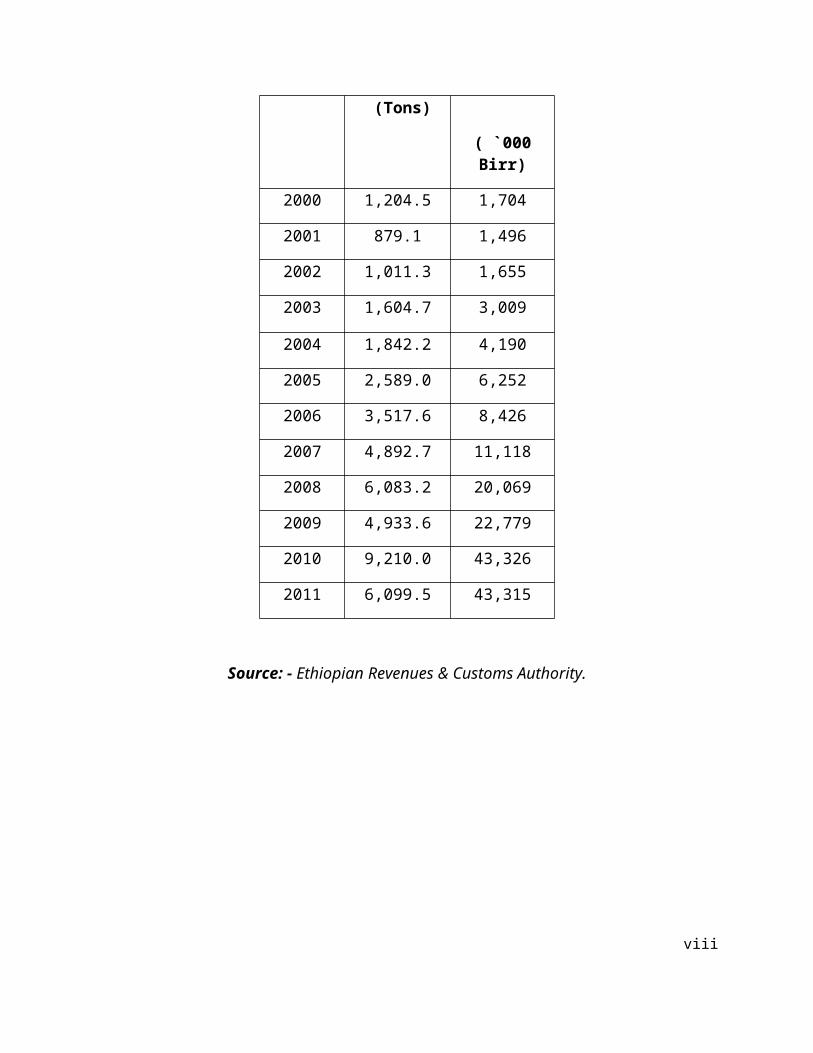
three years (2009--2011) the yearly average level of import has reached to a level of 6,747 tons.
Compared to the preceding years (2006--2008) the total increase is about 40% or annual average
growth rate of 10%.
In terms of value, the country was on the average spending only 1.5 million Birr during the
period 2000-2002. The expenditure for importing calcium carbonate has increased to annual
average of Birr 4.5 million and Birr 13.2 million during the period 2003-2005 and 2006-2008,
respectively. During the recent two years (2010 & 2011), the annual expenditure for importing
calcium carbonate has reached to a level of Birr 43.3 million. The huge increase for the demand
of calcium carbonate is believed to be due to the establishment of a number of end user
industries, mainly in the chemical sub-sector.
With regard to lime domestic production it has generally shown a declining trend. The
production level which was in the range of 7,805 tons and 15,679 tons during the period 2000/01
to 2005/06 has declined to a range of 3,254 tons and 4,461 tons during the period 2006/07 to
2009/10. Information gathered reveals that the major reason for the decline of domestic
production is due to old age the existing factories. Due to lack of adequate domestic production
many users are forced to wait for a long time and the country is forced to import from abroad to
meet the unsatisfied demand.
Unlike the trend in the domestic production, imported quantity has been increasing tremendously
in the past years. Import was almost nil during the period 2000 to 2003 and registered an annual
average of about 62 tons during the period 2004/05. By the year 2006 the imported quantity
reached at a level of 584 tons, which is almost ten times higher compared to the previous two
years average. A huge increase of import is again registered during the three consecutive years of
2007--2009 with annual average of 2,061 tons. Generally, domestic production which was
satisfying the local demand before 2005 is currently satisfying only about 70% of the demand
and the balance is met through import. As a result, import has substantially increased to meet the
gap.
In estimating the current effective demand for calcium carbonate, it is considered as reasonable
to assume that the present demand for the product would be the average of the imported quantity
viii

of the recent two years i.e. year 2010 and 2011. Accordingly the present (year 2012) effective
demand for calcium carbonate is estimated at 7,655 tons. With regard to lime the recent four
years supply from import and domestic production (excluding Wonji Shoa Sugar Factory and
Caustic Soda s.c which fully produce for their own consumption) , which is about 5,000 tons is
taken as the effective demand for year 2010. By applying a 10% annual growth rate year 2012
demand is estimated at 6,050 tons.
2. Demand Projection
The future demand for calcium carbonate depends mainly on the growth of the chemical and
allied industries, which are using it to produce paints and as filler in different chemical and
rubber products. During the past ten years, the annual average growth of demand has been more
than 15% per annum. As per the data of the Ethiopian Investment Agency there are a number of
chemical projects which are licensed for implementation. When the projects become operational
the demand for the product will undoubtedly increase significantly. By considering the past
trend, which was 15% annual growth rate, and future prospects of the industrial sector demand
for calcium carbonate is assumed conservatively to grow by 10% per annum.
Demand for lime is believed to grow parallel with the development of the user industries such as
the construction sector, water and sewerage treatment plants, chemical industries, tanneries,
sugar factories, metallurgical industries as well as the agricultural sector and the like. By
considering the combined effect of the various influencing factors demand for lime in the
country is conservatively assumed to grow at an annual average rate of 12%.
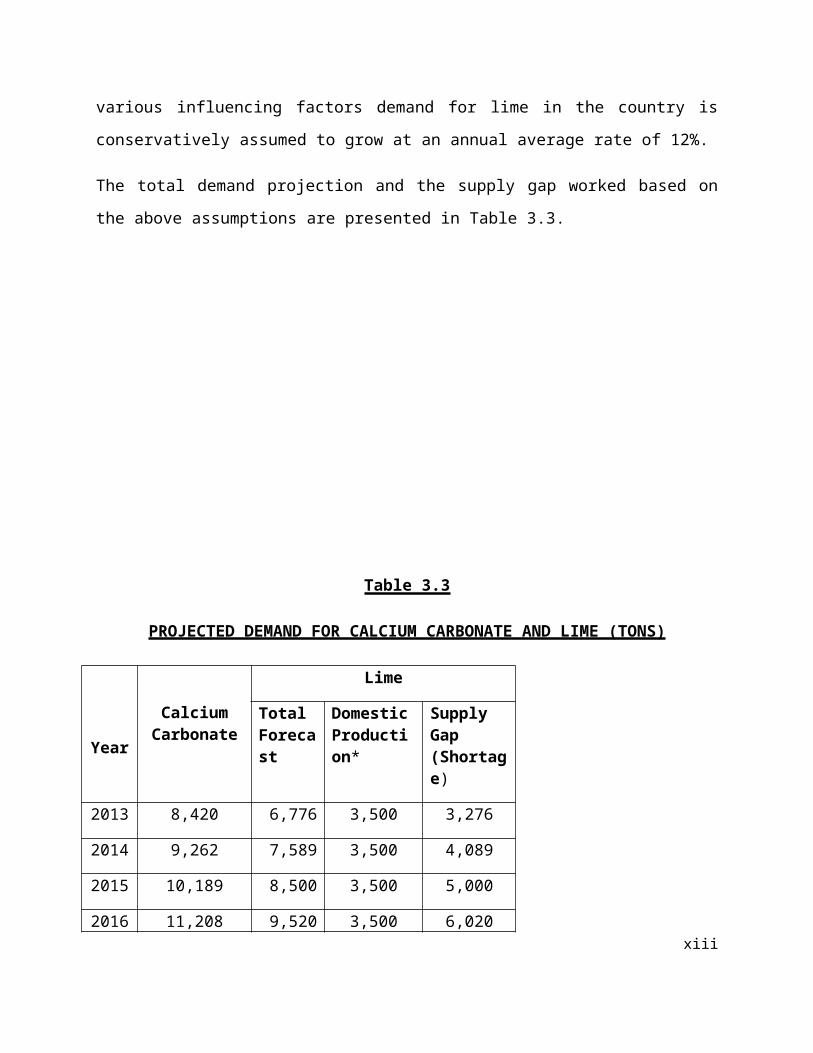
The total demand projection and the supply gap worked based on the above assumptions are
presented in Table 3.3.
ix

Table 3.3
PROJECTED DEMAND FOR CALCIUM CARBONATE AND LIME (TONS)
Year
Calcium Carbonate
Lime
Total Forecast
Domestic Production*
Supply Gap (Shortage)
2013 8,420 6,776 3,500 3,276
2014 9,262 7,589 3,500 4,089
2015 10,189 8,500 3,500 5,000
2016 11,208 9,520 3,500 6,020
2017 12,328 10,662 3,500 7,162
2018 13,561 11,942 3,500 8,442
2019 14,917 13,375 3,500 9,875
2020 16,409 14,980 3,500 11,480
2021 18,050 16,777 3,500 13,277
2022 19,855 18,790 3,500 15,290
2023 21,840 21,044 3,500 17,544
* Average of the past two years is assumed as the existing domestic production excluding the amount produced by
Wonji Sugar & Zuway Caustic Soda factories.
The demand projection, executed in Table 3.2 reveals that the demand for calcium carbonate will
grow from 8,420 tons in the year 2013 to 13,561 tons and 21,840 tons by the year 2018 and year
2023, respectively. Similarly, the unsatisfied demand (supply shortage) for lime will grow from
x

3,276 tons in the year 2013 to 8,442 tons and 17,544 tons by the year 2018 and year 2023,
respectively.
3. Pricing and Distribution
As per the calculations made on the data obtained from the Ethiopian Revenue and Customs
Authority, the recent average CIF value (excluding duty) of imported calcium carbonate is Birr
7,102 per tone. Allowing 20% for customs duty and other import related expenses a factory gate
price of Birr 8,522 per tone is recommended for the purpose of sales revenue projection and
financial analysis.
The current retail price of lime per quintal (100 kg) is Birr 340. Allowing 30 percent for profit
margin and distribution costs a factory gate price Birr 262 per quintal or Birr 2,620 per tone is
recommended as a factory gate price.
The major end users of calcium carbonate are mainly industrial establishment. Most of them are
bulk purchasers and their number as well as geographical distribution is limited. By considering
the number and geographical distribution of the end users direct sale to the end users is
recommended as an appropriate distribution channel for the envisaged project. With regard to
lime, direct sale to bulk consumers such as construction companies and sugar mills and the use
of existing building material shops for small quantity purchasers is recommended as an
appropriate channel. The factory can appoint agents/distributors in the major cities of the
country.
B. PLANT CAPACITY AND PRODUCTION PROGRAM
1. Plant Capacity
In determining the plant capacity of the calcium carbonate and lime production plant, the future
demands of the product and the economies of scale of the available technologies were taken into
consideration. According to the data obtained from the market study, the demand for precipitated
xi

calcium carbonate and lime raises from 8,420 and 3,276 tons to 21,840 and 17,544 tons from
years 2013 to 2023, respectively.
Hence, based on the demand gap and the minimum economic of scale for precipitated calcium
carbonate and lime production, a plant with a capacity of 10,000 of precipitated calcium
carbonate and 5,000 tons of lime per annum is proposed.
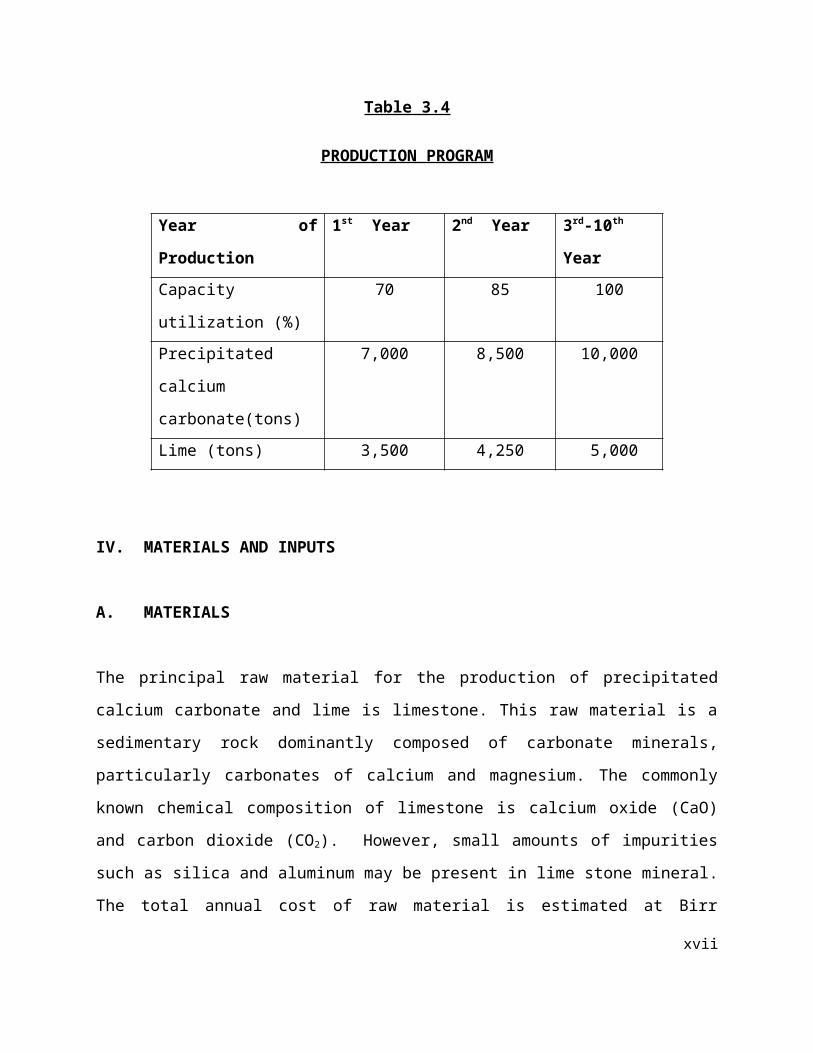
2. Production Program
It is assumed that the precipitated calcium carbonate and lime plant will start at 70% in the first
year, and then raise its production by 85% in the second year and finally operates at 100%
capacity in the third year and then after. The production program of the envisaged plant is given
in Table 3.4.
Table 3.4
PRODUCTION PROGRAM
Year of Production 1st Year 2nd Year 3rd-10th Year
Capacity utilization (%) 70 85 100
Precipitated calcium
carbonate(tons)
7,000 8,500 10,000
Lime (tons) 3,500 4,250 5,000
IV. MATERIALS AND INPUTS
A. MATERIALS
xii
The principal raw material for the production of precipitated calcium carbonate and lime is
limestone. This raw material is a sedimentary rock dominantly composed of carbonate minerals,
particularly carbonates of calcium and magnesium. The commonly known chemical composition
of limestone is calcium oxide (CaO) and carbon dioxide (CO2). However, small amounts of
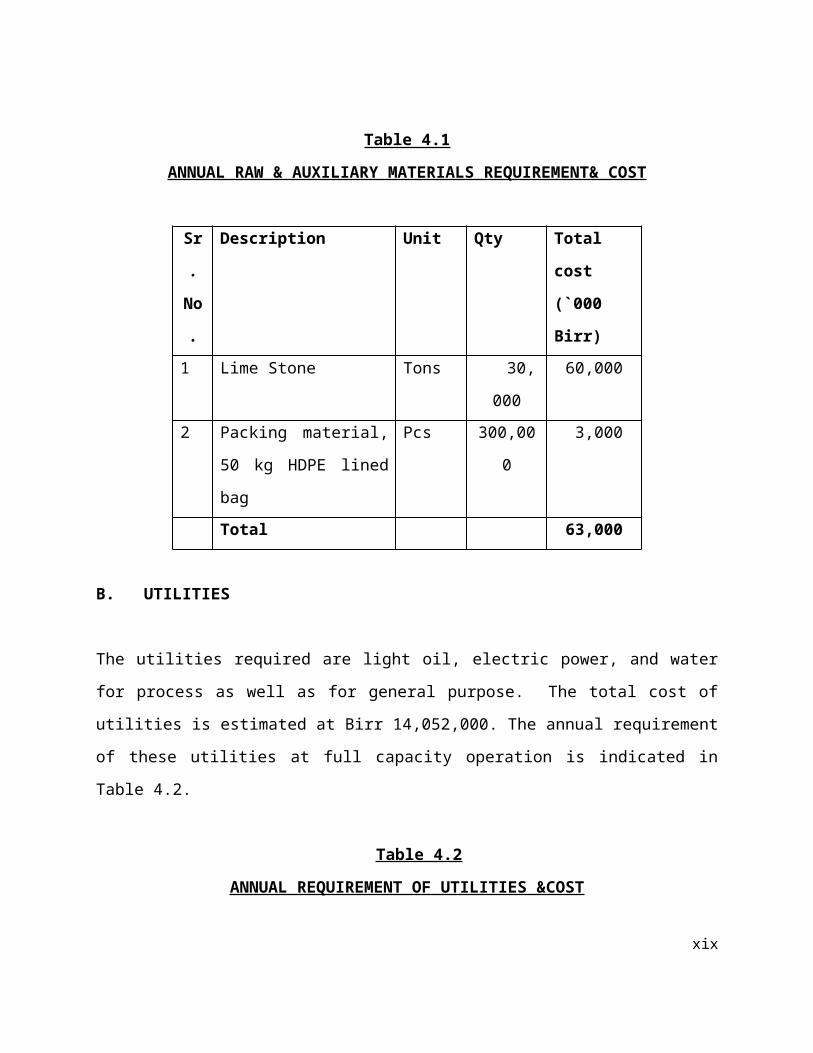
impurities such as silica and aluminum may be present in lime stone mineral. The total annual
cost of raw material is estimated at Birr 63,000,000, which is locally available. The annual
requirement of this raw material is shown in Table 4.1.
xiii

Table 4.1
ANNUAL RAW & AUXILIARY MATERIALS REQUIREMENT& COST
Sr.
No.
Description Unit Qty Total cost
(`000 Birr)
1 Lime Stone Tons 30,000 60,000
2 Packing material, 50 kg
HDPE lined bag
Pcs 300,000 3,000
Total 63,000
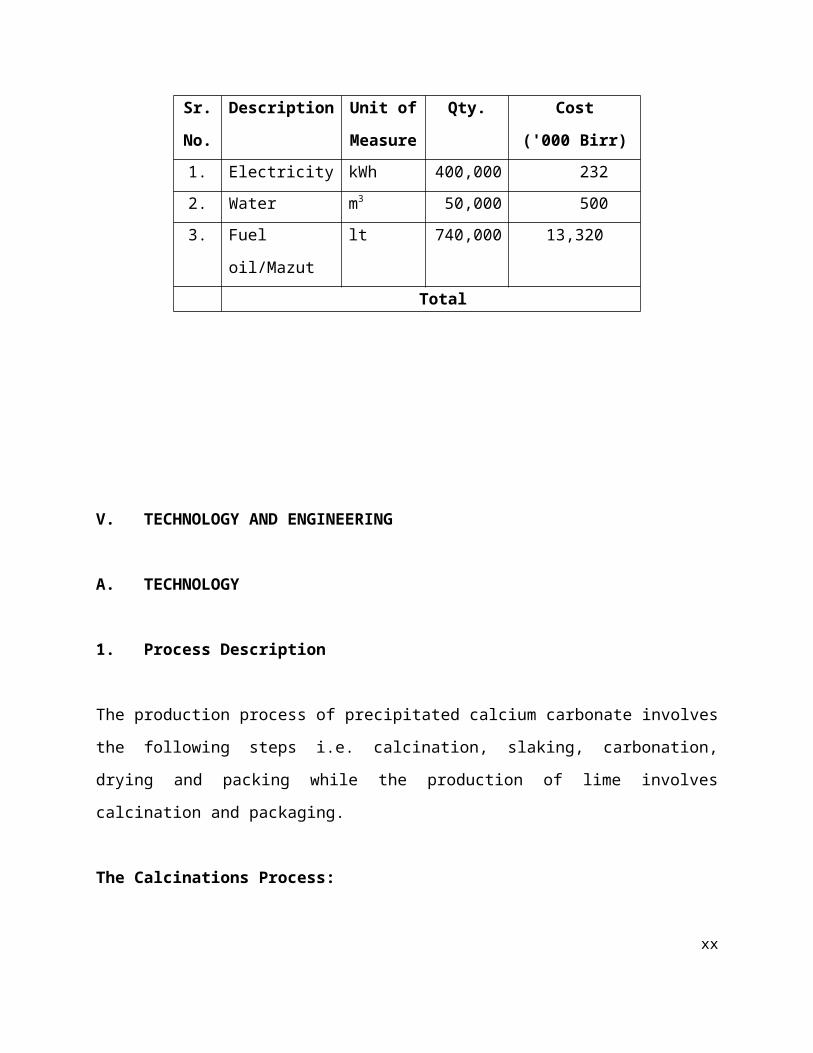
B. UTILITIES
The utilities required are light oil, electric power, and water for process as well as for general
purpose. The total cost of utilities is estimated at Birr 14,052,000. The annual requirement of
these utilities at full capacity operation is indicated in Table 4.2.
Table 4.2
ANNUAL REQUIREMENT OF UTILITIES &COST
Sr.
No.
Description Unit of
Measure
Qty. Cost
('000 Birr)
1. Electricity kWh 400,000 232
2. Water m3 50,000 500
3. Fuel oil/Mazut lt 740,000 13,320
Total 14,052
xiv

V. TECHNOLOGY AND ENGINEERING
A. TECHNOLOGY
1. Process Description
The production process of precipitated calcium carbonate involves the following steps i.e.
calcination, slaking, carbonation, drying and packing while the production of lime involves
calcination and packaging.
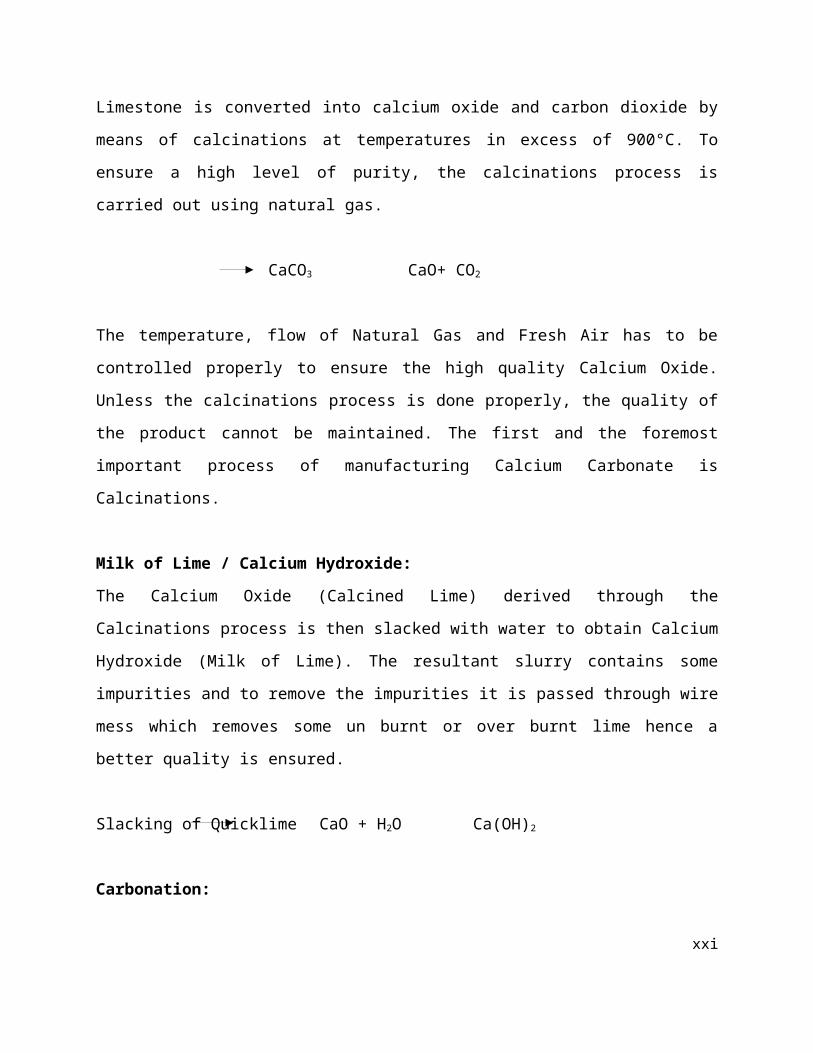
The Calcinations Process:
Limestone is converted into calcium oxide and carbon dioxide by means of calcinations at
temperatures in excess of 900°C. To ensure a high level of purity, the calcinations process is
carried out using natural gas.
CaCO3 CaO+ CO2
The temperature, flow of Natural Gas and Fresh Air has to be controlled properly to ensure the
high quality Calcium Oxide. Unless the calcinations process is done properly, the quality of the
product cannot be maintained. The first and the foremost important process of manufacturing
Calcium Carbonate is Calcinations.
Milk of Lime / Calcium Hydroxide:
The Calcium Oxide (Calcined Lime) derived through the Calcinations process is then slacked
with water to obtain Calcium Hydroxide (Milk of Lime). The resultant slurry contains some
impurities and to remove the impurities it is passed through wire mess which removes some un
burnt or over burnt lime hence a better quality is ensured.
xv

Slacking of Quicklime CaO + H2O Ca(OH)2
Carbonation:
The purified milk of lime is then carbonated with Carbon Dioxide which is derived during the
first process of Calcinations. This process ensures the Calcium Carbonate and water. Proper
temperature and concentration has to be maintained during this process to ensure desired
product. The resultant mixture of calcium carbonate and water is again passed through the wire
mesh to remove any impurity if still left.
Carbonation Ca(OH)2 + CO2 CaCO3 + H2O
Drying:
The drying is a physical process and no chemical changes to the material are made at this stage.
The final stage of the process is water solid separation; water is to be removed from calcium
carbonate. This process is completed in two stages viz. making cake by use of centrifuge which
contains around 30% moisture. The cake then is dried through spindle dryer where the material
travels with hot air at a temperature of more than 300oC.
The material is then packed in HDPE bags at the outlet. The material is packed in inner
laminated HDPE bags to ensure no further quality problems to the material.
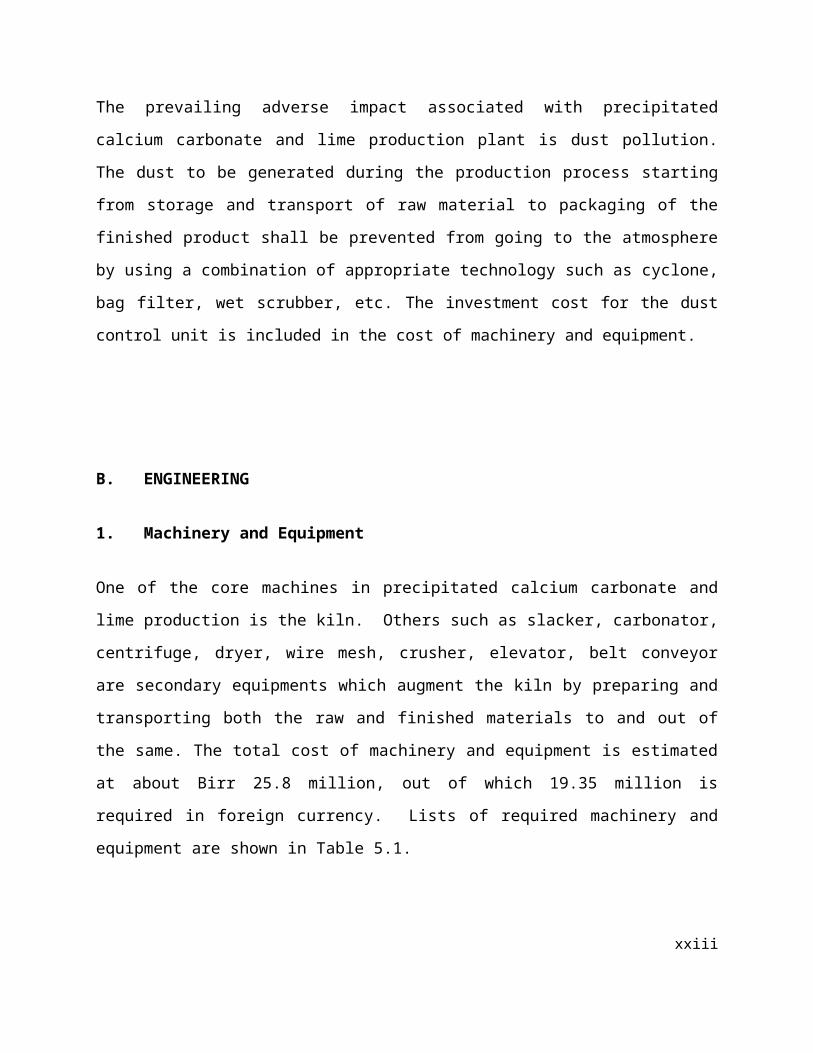
2. Environmental Impact Assessment
The prevailing adverse impact associated with precipitated calcium carbonate and lime
production plant is dust pollution. The dust to be generated during the production process
starting from storage and transport of raw material to packaging of the finished product shall be
prevented from going to the atmosphere by using a combination of appropriate technology such
as cyclone, bag filter, wet scrubber, etc. The investment cost for the dust control unit is included in
the cost of machinery and equipment.
xvi
B. ENGINEERING
1. Machinery and Equipment
One of the core machines in precipitated calcium carbonate and lime production is the kiln.
Others such as slacker, carbonator, centrifuge, dryer, wire mesh, crusher, elevator, belt conveyor
are secondary equipments which augment the kiln by preparing and transporting both the raw
and finished materials to and out of the same. The total cost of machinery and equipment is
estimated at about Birr 25.8 million, out of which 19.35 million is required in foreign currency.
Lists of required machinery and equipment are shown in Table 5.1.
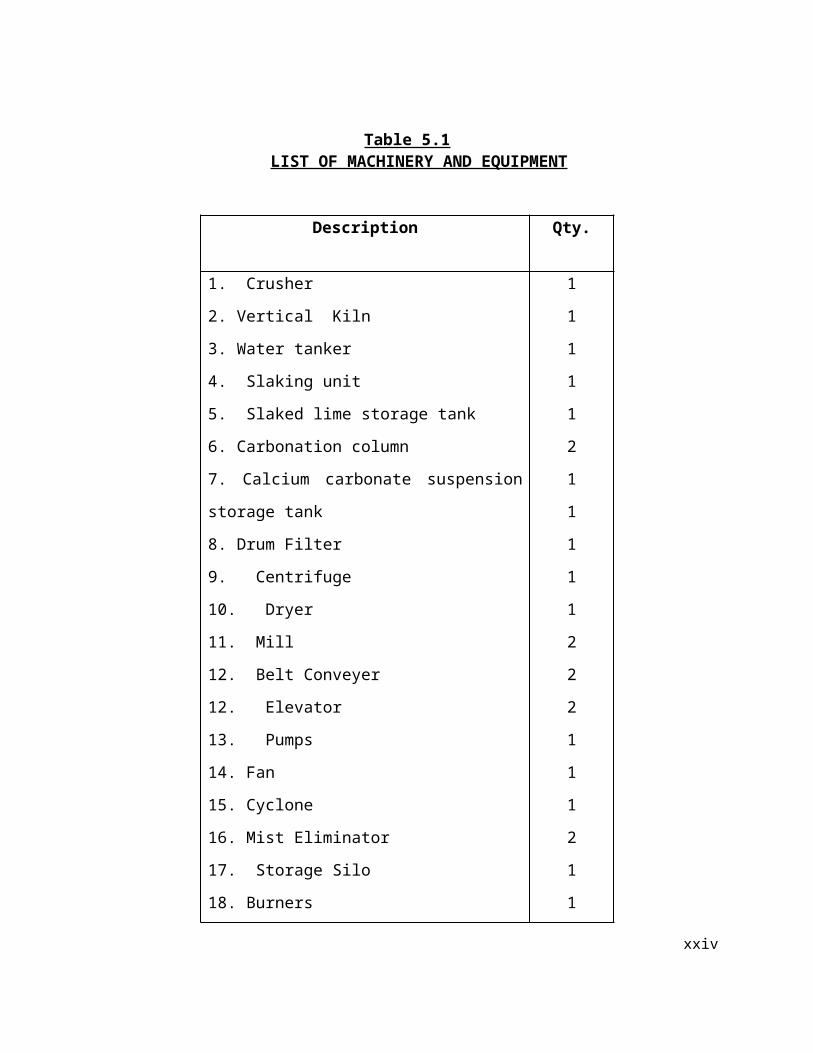
Table 5.1LIST OF MACHINERY AND EQUIPMENT
Description Qty.
1. Crusher
2. Vertical Kiln
3. Water tanker
4. Slaking unit
5. Slaked lime storage tank
6. Carbonation column
7. Calcium carbonate suspension storage tank
8. Drum Filter
9. Centrifuge
10. Dryer
11. Mill
12. Belt Conveyer
1
1
1
1
1
2
1
1
1
1
1
2
xvii
Description Qty.
12. Elevator
13. Pumps
14. Fan
15. Cyclone
16. Mist Eliminator
17. Storage Silo
18. Burners
19. Packing Machine
20. Dust control equipment
2
2
1
1
1
2
1
1
1
2. Land, Building and Civil Works
The plant requires a total of 5,000 m2 area of land, out of which 3,000 m2 is built-up area which
includes Processing area, raw material stock area, offices etc. Assuming construction rate of Birr
4,000 per m2, the total cost of construction is estimated to be Birr 12 million.
According to the Federal Legislation on the Lease Holding of Urban Land (Proclamation No
721/2004) in principle, urban land permit by lease is on auction or negotiation basis, however,
the time and condition of applying the proclamation shall be determined by the concerned
regional or city government depending on the level of development.
The legislation has also set the maximum on lease period and the payment of lease prices. The
lease period ranges from 99 years for education, cultural research health, sport, NGO , religious
and residential area to 80 years for industry and 70 years for trade while the lease payment
period ranges from 10 years to 60 years based on the towns grade and type of investment.
xviii
Moreover, advance payment of lease based on the type of investment ranges from 5% to
10%.The lease price is payable after the grace period annually. For those that pay the entire
amount of the lease will receive 0.5% discount from the total lease value and those that pay in
installments will be charged interest based on the prevailing interest rate of banks. Moreover,
based on the type of investment, two to seven years grace period shall also be provided.
However, the Federal Legislation on the Lease Holding of Urban Land apart from setting the
maximum has conferred on regional and city governments the power to issue regulations on the
exact terms based on the development level of each region.
In Addis Ababa, the City’s Land Administration and Development Authority is directly
responsible in dealing with matters concerning land. However, regarding the manufacturing
sector, industrial zone preparation is one of the strategic intervention measures adopted by the
City Administration for the promotion of the sector and all manufacturing projects are assumed
to be located in the developed industrial zones.
Regarding land allocation of industrial zones if the land requirement of the project is below
5,000 m2, the land lease request is evaluated and decided upon by the Industrial Zone
Development and Coordination Committee of the City’s Investment Authority. However, if the
land request is above 5,000 m2, the request is evaluated by the City’s Investment Authority and
passed with recommendation to the Land Development and Administration Authority for
decision, while the lease price is the same for both cases.
Moreover, the Addis Ababa City Administration has recently adopted a new land lease floor
price for plots in the city. The new prices will be used as a benchmark for plots that are going to
be auctioned by the city government or transferred under the new “Urban Lands Lease Holding
Proclamation.”
The new regulation classified the city into three zones. The first Zone is Central Market District
Zone, which is classified in five levels and the floor land lease price ranges from Birr 1,686 to
Birr 894 per m2. The rate for Central Market District Zone will be applicable in most areas of the
city that are considered to be main business areas that entertain high level of business activities.
xix
The second zone, Transitional Zone, will also have five levels and the floor land lease price
ranges from Birr 1,035 to Birr 555 per m2 .This zone includes places that are surrounding the city
and are occupied by mainly residential units and industries. The last and the third zone,
Expansion Zone, is classified into four levels and covers areas that are considered to be in the
outskirts of the city, where the city is expected to expand in the future. The floor land lease price
in the Expansion Zone ranges from Birr 355 to Birr 191 per m2 (see Table 5.2).
Table 5.2
NEW LAND LEASE FLOOR PRICE FOR PLOTS IN ADDIS ABABA
Zone LevelFloor
Price/m2
Central Market District
1st 1686
2nd 1535
3rd 1323
4th 1085
5th 894
Transitional zone
1st 1035
2nd 935
3rd 809
4th 685
5th 555
Expansion zone
1st 355
2nd 299
3rd 217
4th 191
xx
Accordingly, in order to estimate the land lease cost of the project profiles it is assumed that all
new manufacturing projects will be located in industrial zones located in expansion zones.
Therefore, for the profile a land lease rate of Birr 266 per m2 which is equivalent to the average
floor price of plots located in expansion zone is adopted.
On the other hand, some of the investment incentives arranged by the Addis Ababa City
Administration on lease payment for industrial projects are granting longer grace period and
extending the lease payment period. The criterions are creation of job opportunity, foreign
exchange saving, investment capital and land utilization tendency etc. Accordingly, Table 5.3
shows incentives for lease payment.
Table 5.3
INCENTIVES FOR LEASE PAYMENT OF INDUSTRIAL PROJECTS
Scored PointGrace Period
Payment Completion Period
Down Payment
Above 75% 5 Years 30 Years 10%
From 50 - 75% 5 Years 28 Years 10%
From 25 - 49% 4 Years 25 Years 10%
For the purpose of this project profile, the average i.e. five years grace period, 28 years payment
completion period and 10% down payment is used. The land lease period for industry is 60
years.
Accordingly, the total land lease cost at a rate of Birr 266 per m2 is estimated at Birr 1,330,000 of
which 10% or Birr 133,000 will be paid in advance. The remaining Birr 1,197,000 will be paid in
equal installments with in 28 years i.e. Birr 42,750 annually.
VI. HUMAN RESOURCE AND TRAINING REQUIREMENT
A. HUMAN RESOURCE REQUIREMENTxxi

Total human resource required is 69 persons. The total annual cost of human resource is
estimated at Birr 1,623,000. The details of the human resource requirement and the estimated
annual labor cost, including employees’ benefit, are given in Table 6.1.
Table 6.1
HUMAN RESOURCE REQUIREMENT AND ESTIMATED COST
Sr.
No.
Description No. of
Persons
Monthly
Salary (Birr)
Annual Salary
(Birr)
1 General Manager 1 8,000 96,000
2 Executive Secretary 1 2,500 30,000
3 Production & Technical Head 1 6,000 72,000
4 Commercial Head 1 5,000 60,000
5 Finance & Administration Head 1 5,000 60,000
6 Accountant 2 3,000 36,000
7 Accounts Clerk 1 1,200 14,400
8 Cashier 1 1,500 18,000
9 Purchaser 2 6,000 72,000
10 Store Keeper 2 2,400 28,800
11 Chemist 3 9,000 108,000
12 Shift Leader 3 9,000 108,000
13 Operator 12 18,000 216,000
14 Assistant Operator 12 10,800 129,600
15 Laborer 12 7,200 86,400
16 Mechanic 3 4,500 54,000
17 Electrician 3 4,500 54,000
18 Driver 2 1,600 19,200
19 Guard 6 3,000 36,000
xxii
Sr.
No.
Description No. of
Persons
Monthly
Salary (Birr)
Annual Salary
(Birr)
Sub- total 69 108,200 1,298,400
Employees benefit (25% of basic
salary)
27,050 324,600
Total 135,250 1,623,000
B. TRAINING REQUIREMENT
The production and technical head, mechanic, electrician and quality control worker need at least
two weeks training on the technology, maintenance and quality control. For the rest, on-the-job
training will be sufficient in the time of installation and commissioning by the specialists. Total
training cost is estimated at about Birr 55,000.
VII. FINANCIAL ANALYSIS
The financial analysis of the calcium carbonate and lime project is based on the data presented in
the previous chapters and the following assumptions:-
Construction period 1 year
Source of finance 30 % equity
70 % loan
Tax holidays 3 years
Bank interest 10%
Discount cash flow 10%
Accounts receivable 30 daysxxiii
Raw material local 30 days
Work in progress 1 day
Finished products 30 days
Cash in hand 5 days
Accounts payable 30 days
Repair and maintenance 5% of machinery cost
A. TOTAL INITIAL INVESTMENT COST
The total investment cost of the project including working capital is estimated at Birr 60.34
million (see Table 7.1). From the total investment cost, the highest share (Birr 39.33 million or
65.19%) is accounted by fixed investment cost followed by initial working capital ( Birr 15.66
million or 25.96%) and pre operation cost (Birr 5.34 million or 8.85%). From the total
investment cost Birr 19.35 million or 32.07% is required in foreign currency.
Table 7.1
INITIAL INVESTMENT COST ( ‘000 Birr)
Sr. No Cost Items
Local Cost
Foreign Cost
Total Cost
% Share
1 Fixed investment 1.1 Land Lease 133.00 133.00 0.221.2 Building and civil work 12,000.00 12,000.00 19.891.3 Machinery and equipment 6,450.00 19,350.00 25,800.00 42.761.4 Vehicles 900.00 900.00 1.491.5 Office furniture and equipment 500.00 500.00 0.83 Sub total 19,983.00 19,350.00 39,333.00 65.192 Pre operating cost *
2.1 Pre operating cost 1,395.00 1,395.00 2.312.2 Interest during construction 3,947.40 3,947.40 6.54 Sub total 5,342.40 5,342.40 8.853 Working capital ** 15,663.48 15,663.48 25.96 Grand Total 40,988.89 19,350.00 60,338.89 100
xxiv

* N.B Pre operating cost include project implementation cost such as installation, startup,
commissioning, project engineering, project management etc and capitalized interest during
construction.
** The total working capital required at full capacity operation is Birr 22.59 million. However,
only the initial working capital of Birr 15.66 million during the first year of production is
assumed be funded through external sources. During the remaining years the working capital
requirement will be financed by funds generated internally (for detail working capital
requirement see Appendix 7.A.1).
B. PRODUCTION COST
The annual production cost at full operation capacity is estimated at Birr 91.16 million (see Table
7.2). The cost of raw material account for 69.11% of the production cost. The other major
components of the production cost are utility, depreciation and financial cost which account for
15.41%, 6.75% and 4.17%, respectively. The remaining 4.56% is the share of repair and
maintenance, labor overhead and administration cost. For detail production cost see Appendix
7.A.2.
Table 7.2
ANNUAL PRODUCTION COST AT FULL CAPACITY (YEAR FOUR)
Items Cost %Raw Material and Inputs 63,000.0
0 69.11Utilities 14,052.0
0 15.41Maintenance and repair 1,290.0
0 1.42Labour direct 1,298.4
0 1.42
xxv
Labour overheads 324.60 0.36
Administration Costs 500.00 0.55
Land lease cost - -Cost of marketing and distribution 750.0
0 0.82Total Operating Costs 81,215.0
0 89.09Depreciation 6,149.0
0 6.75Cost of Finance 3,799.3
8 4.17Total Production Cost 91,163.3
8 100
C. FINANCIAL EVALUATION
1. Profitability
Based on the projected profit and loss statement, the project will generate a profit throughout its
operation life. Annual net profit after tax will grow from Birr 5.24 million to Birr 11.42 million
during the life of the project. Moreover, at the end of the project life the accumulated net cash
flow amounts to Birr 97.16 million. For profit and loss statement and cash flow projection see
Appendix 7.A.3 and 7.A.4, respectively.
2. Ratios
In financial analysis financial ratios and efficiency ratios are used as an index or yardstick for
evaluating the financial position of a firm. It is also an indicator for the strength and weakness of
the firm or a project. Using the year-end balance sheet figures and other relevant data, the most
important ratios such as return on sales which is computed by dividing net income by revenue,
return on assets (operating income divided by assets), return on equity (net profit divided by
equity) and return on total investment (net profit plus interest divided by total investment) has
been carried out over the period of the project life and all the results are found to be satisfactory. xxvi

3. Break-even Analysis
The break-even analysis establishes a relationship between operation costs and revenues. It indicates the level at which costs and revenue are in equilibrium. To this end, the break-even point for capacity utilization and sales value estimated by using income statement projection are computed as followed.
Break- Even Sales Value = Fixed Cost + Financial Cost = Birr 41,202,000
Variable Margin ratio (%)
Break- Even Capacity utilization = Break- even Sales Value X 100 = 39.12%
Sales revenue
4. Pay-back Period
The pay- back period, also called pay – off period is defined as the period required for recovering
the original investment outlay through the accumulated net cash flows earned by the project.
Accordingly, based on the projected cash flow it is estimated that the project’s initial investment
will be fully recovered within 6 years.
5. Internal Rate of Return
The internal rate of return (IRR) is the annualized effective compounded return rate that can be
earned on the invested capital, i.e., the yield on the investment. Put another way, the internal rate
of return for an investment is the discount rate that makes the net present value of the
investment's income stream total to zero. It is an indicator of the efficiency or quality of an
investment. A project is a good investment proposition if its IRR is greater than the rate of return
that could be earned by alternate investments or putting the money in a bank account.
Accordingly, the IRR of this project is computed to be 20.02% indicating the viability of the
project.
6. Net Present Value
Net present value (NPV) is defined as the total present (discounted) value of a time series of cash
flows. NPV aggregates cash flows that occur during different periods of time during the life of a
project in to a common measuring unit i.e. present value. It is a standard method for using the
xxvii

time value of money to appraise long-term projects. NPV is an indicator of how much value an
investment or project adds to the capital invested. In principle, a project is accepted if the NPV is
non-negative. Accordingly, the net present value of the project at 10% discount rate is found to
be Birr 33.70 million which is acceptable. For detail discounted cash flow see Appendix 7.A.5.
D. ECONOMIC AND SOCIAL BENEFITS
The project can create employment for 69 persons. The project will generate Birr 27.48 million
in terms of tax revenue. The establishment of such factory will have a foreign exchange saving
effect to the country by substituting the current imports. The project will also create forward
linkage with the manufacturing and construction sectors and back ward linkage with the mining
sector and also generates income for the Government in terms of tax revenue and payroll tax.
Appendix 7.A
FINANCIAL ANALYSES SUPPORTING TABLES
xxviii

xxix

Appendix 7.A.1NET WORKING CAPITAL ( in 000 Birr)
Items Year 2 Year 3 Year 4 Year 5 Year 6 Year 7 Year 8 Year 9 Year 10 Year 11
Total inventory11,025.0
013,387.5
015,750.0
015,750.0
015,750.0
015,750.0
015,750.0
015,750.0
015,750.0
015,750.0
0
Accounts receivable 4,756.29 5,762.10 6,767.92 6,767.92 6,771.48 6,771.48 6,771.48 6,771.48 6,771.48 6,771.48
Cash-in-hand 33.18 40.29 47.40 47.40 48.00 48.00 48.00 48.00 48.00 48.00
CURRENT ASSETS15,814.4
719,189.9
022,565.3
222,565.3
222,569.4
822,569.4
822,569.4
822,569.4
822,569.4
822,569.4
8
Accounts payable 150.99 183.35 215.70 215.70 215.70 215.70 215.70 215.70 215.70 215.70
CURRENT LIABILITIES 150.99 183.35 215.70 215.70 215.70 215.70 215.70 215.70 215.70 215.70
TOTAL WORKING CAPITAL
15,663.48
19,006.55
22,349.62
22,349.62
22,353.78
22,353.78
22,353.78
22,353.78
22,353.78
22,353.78
27

Appendix 7.A.2PRODUCTION COST ( in 000 Birr)
Item Year 2 Year 3 Year 4 Year 5 Year 6 Year 7 Year 8 Year 9 Year 10 Year 11
Raw Material and Inputs 44,100 53,550 63,000 63,000 63,000 63,000 63,000 63,000 63,000 63,000
Utilities 9,836 11,944 14,052 14,052 14,052 14,052 14,052 14,052 14,052 14,052
Maintenance and repair 903 1,097 1,290 1,290 1,290 1,290 1,290 1,290 1,290 1,290
Labour direct 909 1,104 1,298 1,298 1,298 1,298 1,298 1,298 1,298 1,298
Labour overheads 227 276 325 325 325 325 325 325 325 325
Administration Costs 350 425 500 500 500 500 500 500 500 500
Land lease cost 0 0 0 0 43 43 43 43 43 43Cost of marketing and distribution 750 750 750 750 750 750 750 750 750 750
Total Operating Costs 57,076 69,145 81,215 81,215 81,258 81,258 81,258 81,258 81,258 81,258
Depreciation 6,149 6,149 6,149 6,149 6,149 530 530 530 530 530
Cost of Finance 0 4,342 3,799 3,257 2,714 2,171 1,628 1,086 543 0
Total Production Cost 63,225 79,636 91,163 90,621 90,121 83,959 83,416 82,873 82,331 81,788
28
Appendix 7.A.3INCOME STATEMENT ( in 000 Birr)
ItemYear 2
Year 3
Year 4
Year 5
Year 6
Year 7
Year 8
Year 9 Year 10 Year 11
Sales revenue 68,670 83,385 98,100 98,10098,10
0 98,100 98,100 98,100 98,100 98,100
Less variable costs 56,326 68,395 80,465 80,46580,46
5 80,465 80,465 80,465 80,465 80,465
VARIABLE MARGIN 12,345 14,990 17,635 17,63517,63
5 17,635 17,635 17,635 17,635 17,635
in % of sales revenue 17.98 17.98 17.98 17.98 17.98 17.98 17.98 17.98 17.98 17.98
Less fixed costs 6,899 6,899 6,899 6,899 6,942 1,323 1,323 1,323 1,323 1,323
OPERATIONAL MARGIN 5,446 8,091 10,736 10,73610,69
3 16,312 16,312 16,312 16,312 16,312
in % of sales revenue 7.93 9.70 10.94 10.94 10.90 16.63 16.63 16.63 16.63 16.63
Financial costs 4,342 3,799 3,257 2,714 2,171 1,628 1,086 543 0
GROSS PROFIT 5,446 3,749 6,937 7,479 7,979 14,141 14,684 15,227 15,769 16,312
in % of sales revenue 7.93 4.50 7.07 7.62 8.13 14.42 14.97 15.52 16.07 16.63
Income (corporate) tax 0 0 0 2,244 2,394 4,242 4,405 4,568 4,731 4,894
NET PROFIT 5,446 3,749 6,937 5,236 5,586 9,899 10,279 10,659 11,039 11,419
in % of sales revenue 7.93 4.50 7.07 5.34 5.69 10.09 10.48 10.87 11.25 11.64
29

Appendix 7.A.4CASH FLOW FOR FINANCIAL MANAGEMENT ( in 000 Birr)
Item Year 1 Year 2 Year 3 Year 4 Year 5 Year 6 Year 7 Year 8 Year 9 Year 10 Year 11 Scrap
TOTAL CASH INFLOW 40,728 88,432 83,417 98,132 98,100 98,100 98,100 98,100 98,100 98,100 98,100 33,634
Inflow funds 40,728 19,762 32 32 0 0 0 0 0 0 0 0
Inflow operation 0 68,670 83,385 98,100 98,100 98,100 98,100 98,100 98,100 98,100 98,100 0
Other income 0 0 0 0 0 0 0 0 0 0 0 33,634TOTAL CASH OUTFLOW 40,728 76,837 82,290 93,817 92,143 91,797 93,099 92,719 92,339 91,959 86,151 0Increase in fixed assets 40,728 0 0 0 0 0 0 0 0 0 0 0
Increase in current assets 0 15,814 3,375 3,375 0 4 0 0 0 0 0 0
Operating costs 0 56,326 68,395 80,465 80,465 80,508 80,508 80,508 80,508 80,508 80,508 0Marketing and Distribution cost 0 750 750 750 750 750 750 750 750 750 750 0
Income tax 0 0 0 0 2,244 2,394 4,242 4,405 4,568 4,731 4,894 0Financial costs 0 3,947 4,342 3,799 3,257 2,714 2,171 1,628 1,086 543 0 0Loan repayment 0 0 5,428 5,428 5,428 5,428 5,428 5,428 5,428 5,428 0 0
SURPLUS (DEFICIT) 0 11,595 1,127 4,315 5,957 6,303 5,001 5,381 5,761 6,141 11,949 33,634
30

CUMULATIVE CASH BALANCE 0 11,595 12,721 17,036 22,993 29,296 34,297 39,678 45,439 51,580 63,529 97,163
31

Appendix 7.A.5DISCOUNTED CASH FLOW ( in 000 Birr)
Item Year 1Year
2 Year 3Year
4 Year 5Year
6 Year 7Year
8 Year 9Year
10 Year 11 Scrap
TOTAL CASH INFLOW 0 68,670 83,385 98,100 98,100 98,100 98,100 98,100 98,100 98,100 98,100 33,634
Inflow operation 0 68,670 83,385 98,100 98,100 98,100 98,100 98,100 98,100 98,100 98,100 0
Other income 0 0 0 0 0 0 0 0 0 0 0 33,634
TOTAL CASH OUTFLOW 56,391 60,419 72,488 81,215 83,463 83,652 85,500 85,663 85,826 85,989 86,151 0
Increase in fixed assets 40,728 0 0 0 0 0 0 0 0 0 0 0
Increase in net working capital 15,663 3,343 3,343 0 4 0 0 0 0 0 0 0
Operating costs 0 56,326 68,395 80,465 80,465 80,508 80,508 80,508 80,508 80,508 80,508 0
Marketing and Distribution cost 0 750 750 750 750 750 750 750 750 750 750 0
Income (corporate) tax 0 0 0 2,244 2,394 4,242 4,405 4,568 4,731 4,894 0
NET CASH FLOW -56,391 8,251 10,897 16,885 14,637 14,448 12,600 12,437 12,274 12,111 11,949 33,634
CUMULATIVE NET CASH FLOW -56,391-
48,140 -37,243-
20,358 -5,721 8,727 21,327 33,764 46,038 58,150 70,098103,73
2
Net present value -56,391 7,501 9,006 12,686 9,997 8,971 7,112 6,382 5,726 5,136 4,607 12,967
Cumulative net present value -56,391-
48,890 -39,885-
27,199 -17,201 -8,230 -1,118 5,264 10,990 16,127 20,734 33,701
NET PRESENT VALUE 33,701INTERNAL RATE OF RETURN 20.02%NORMAL PAYBACK 6 years
32
![Ethio-CoP-MfDR-Concept Note June 2010 Version 2nd Draft[1]](https://static.documents.pub/doc/80x56/577d1e641a28ab4e1e8e6ed5/ethio-cop-mfdr-concept-note-june-2010-version-2nd-draft1.jpg)


![[Pick the date] - Ethio Muslims Media · P ¨¨]¡ “ v ¨ ¨ “ “ ” w‰ }} ¨“ ¨ P ...](https://static.documents.pub/doc/80x56/5e1e9c04270e1a63e1057a2e/pick-the-date-ethio-muslims-media-p-aoe-v-aoe-aoe-a-wa-.jpg)
