I I I I I I I 822 :'KH 86 V ire international reference centre forcommunity water supply and sanitation who collaborating centre '¡\. cir centre international de reference pour l.'approvisionnernent en eau collective et I'assainissement centre collaborant de I'oms DRAFT 1987-06-03/dv ur ONLY WATER SUPPLY AND SANITATION A baseline study in seven villages in Kandal and Kampong Speu Kampuchea •'••> I I I I UNICEF/IRC
Transcript
IIIIIII
822:'KH 86
V
ireinternational reference centreforcommunity water supplyand sanitation
who collaborating centre
'¡\.
circentre international de referencepour l.'approvisionnernenten eau collective et I'assainissement
centre collaborant de I'oms
DRAFT 1987-06-03/dv
ur ONLYWATER SUPPLY AND SANITATION
A baseline study in seven villagesin Kandal and Kampong Speu
Kampuchea
•'••>
IIII
UNICEF/IRC
DRAFT 1987-06-03/dv
IIIIIIIIIIIIIIIII
LIBRARY, INTERNATIONAL REFERENCE fCENTRE FOri COMMUNITY WATER SUPPLY ¡AND CAPITA¡"!O;-J \\i"!C) {P.O. Box 93; 90. 2509 AD The Hague jTul. (070) 81 49 11 erX 141/142
RN:LO: K.H
WATER SUPPLY AND SANITATION
A baseline study in seven villagesin Kandal and Kampong Speu
Kampuchea
Prepared by:
Oum SophalLy Kosal ManyMarieke Boot
October/November 1986
This report was prepared for the UNICEP-assisted Rural Water Supplyand Sanitation Programme in Kampuchea
UNICEF/International Reference Centre forCommunity Water Supply and Sanitation
P.O. Box 931902509 AD The Hague
The Netherlands
DRAFT 1987-06-03/dv
IIIIIIIIIIIIIIIIIIII
Table of contents
1. INTRODUCTIONThe water supply and sanitation programmeProject area and village characteristicsProject implementationBaseline survey
2. METHODOLOGY 4Preliminary investigation 4Preparation of questionnaires 5Training of interviewers 5Selection of villages 6Selection of households 6Field-work 7Data processing 7Time and manpower inputs 7
3. THE SAMPLE POPULATION 9The villages 9The households 10
4. WATER SOURCES 12Rainwater 12Well-water 13Pond water 15Canal water 17River water 18Selection of water sources: a reasoned choice 19Implications for the project 20
5. WATER COLLECTION, STORAGE AND USE 21Water collection 21Water storage 21Water for drinking 23Hand washing 23Bathing and laundry 24Implications for the project 25
6. DEFECATION PRACTICES AND LATRINE USE 27Defecation practices 27Latrine use 28Characteristics of household latrines 30Implications for the project 32
7. HEALTH 34Health and health knowledge 34Health services from the health centres 37Implications for the project 39
DRAFT 1987-06-03/dv
IIIIIIIIIIIIIIIIIIII
Acknowledgement
This baseline study has been carried out as a co-operative effort bythe Centre National d'Hygiene et d'Epidémiologie (CNHE), UNICEP andthe International Reference Centre for Community Water Supply andSanitation (IRC). The following staff members of the Ministry ofHealth participated in the data collection, tabulation and analysis:
Mrs Keo Solida Mr Khuon Nguon HengMrs Prak Piseth Raing Sey Mr Non SamithMrs Chin Lay Heak Mr Chey PhossarraMr Po Sy Oeum Mr Srey-Chan-ThânMr Pech Run Mr Meas Ham Leing
Mr Long Kean Hong from the Provincial Health Office of Kandalparticipated in most of the field work. Numerous people at Srok, Khumand Phum level kindly contributed to the study.
Mr Hans Spruijt, UNICEP, acted as resource person and Mrs AliciaSpruijt did all the data processing.
The continued contribution and support from all these people aregratefully acknowledged.
iIIIIIIIIIIIIIIIIIIII
DRAFT 1987-06-03/dv
1. INTRODUCTION
The water supply and sanitation programe
The UNICEF assisted water supply and sanitation programme, implementedby the Ministry of Health, started in 1981 with the rehabilitation ofwater supply systems for hospitals and other vital institutions, whichhad been destroyed during the 1970-1978 period.
In 1985, a first project phase was developed for a rural water supplyand sanitation programme. Aim of the programme is to contribute to areduction of water and sanitation related diseases through theprovision of safe and accessible water supply and sanitationfacilities in the rural areas. Project components consist of:
construction of village water wells equiped with handpumps;construction of household latrines;hygiene and sanitation education.
Project area and village characteristics
The first project phase (1986-1988) includes seven districts or"Sroks" in two provinces:
Kandal Province: Srok Phnom PenhSrok Ponhea LuSrok Kandal StungSrok Dangkar (since the end of 1986 part
of the capital city Phnom Penh)
Kampong Speu Province: Srok Oudong
Srok Samraong TongSrok Kong Pisei
The seven districts cover an area of about 3000 km^, immediate north,west and south of the capital city phnom Penh (see map on page 2).According to 1985 figures, the total population is about 400.000,distributed between 1403 villages ("Phums") which are grouped in 101communities ("Khums").
The project started with a short investigation to assess the presentwater supply situation in the villages. Based on this investigation,villages could be classified in two main categories:
villages with abundant surface water available at a short distanceduring the whole year;
- villages with a lack of water, especially during the dry season.
About 60% of the villages and 70% of the total population belong tothe second category. Of these villages, some 500 have unprotectedhand-dug wells, either in use or abandoned, and some 50 villages havedrilled wells from the sixties, most of them presently abandoned.
PROVINCEDE
KAMPONG SPEU
DELIMITATION DU SITE DU PROJET, PHASE N° 1 à 8
(PEOYINCÊS HE KA1ÍDAL ET BE KAMPQHG SPEU, KAMPUCHEA)
SITE VISITE A L'OCCASION DE MISSIONS D1EVALUATION
SUE LE TERRADf
E c h e l l e :
oo
IoI
oUl
Carte N° 1:Deesin du s i t e du projet
Pro^rammé'ní^approvisiormeDient en eau etd'aesalnisBement de1'lfflICEF, 1905-1968
IIIIIIIIIIIIIIIIIIIII
DRAFT 1987-06-03/dv
Project implementation
Water supply activities include rehabilitation of wells where possibleand drilling of new wells where necessary. All wells will be equipedwith a handpump (India mark 1 or 2). Selection criteria for thevillages are as follows:
walking distance to a permanent source of safe water is more than500 metres for villages with a population of over 200;
- walking distance to a permanent source of safe water is more than1000 meters for villages with a population of 150-200.
One well with handpump is provided for up to 400 people.
Implementation started in the second half of 1985. Up till November1986, about 250 wells have been constructed and pumps installed.Latrine construction, for the present in one village, started inSeptember 1986. The target for 1988 is to construct 1000 wells for300.000 people (75% of the project area's population) and to construct50.000 household latrines. Manpower training will include welldrilling and digging, handpump installation and maintenance. Atvillage level, water supply and sanitation committees will be formedwhich will be responsible for the day-to-day care of the handpump andthe promotion of personal and environmental hygiene.
Baseline survey
One of the planned activities in support of the programme is asocio-cultural baseline survey in the present project area. Thepurpose of the survey is threefold:
to provide baseline data for the design and development of thehygiene education component of the programme;
- to provide guidance to the design and implementation of thesanitation component of the programme, particularly latrineconstruction;
- to provide baseline data for any future evaluation of theprogramme.
An additional purpose of the baseline survey is to strengthen theresearch capability of staff of the Ministry of Health.
The survey should provide baseline data with respect to:
- daily patterns of water collection and water use;- walking distance to water sources;- incidence of water and sanitation related diseases;
human waste disposal.
The baseline survey was carried out in October 1986 by the CentreNational d1 Hygiene et d'Epidémiologie (CNHE) under the Ministry ofHealth in co-operation with the International Reference Centre forCommunity Water Supply and Sanitation (IRC). The results of thissurvey are presented in this report (Chapter 3-7). In chapter 2, theselected methodology if briefly outlined.
DRAFT 1987-06-03/dv
2. METHODOLOGY
Preliminary Investigation
To determine the relevant issues and questions for the baselinesurvey, key interviews were held with representatives of:
the Ministry of Health;the Health Department of the Kandal Province;
- the Women Association (Association des Femmes);the Dirtectorate of Mother and Child Care (Direction ProtectionMaternelle et Infantile (PMI)); •the RINE Programme (RINE equals Rehydration, Immunisation, mNutrition and Education).
In addition, short visits were paid to six villages, three in Srok IDangkor and three in Srok Samraong Tong. Information was gatheredthrough observations, group discussions and discussions with _individual household members. Also, informal meetings were held with IKhum and Phum representatives. One health centre (infirmérie) was •visited to allow the consultant to get an impression of the localhealth system and the registration system used for patients visiting Ithe centre. 8
The preliminary investigation indicated a number of possibilities aswell as restrictions with regard to the baseline survey:
• During the rainy season, water collection and water use patternsare rather complex in most villages, due to the fact that variouswater sources are available within a relative short walkingdistance. For this reason, it was decided not to includeobservations to collect data on this subject, as this would gobeyond the time set for the present study.
• It proved to be difficult to find reliable socio-economic
No restrictions were encountered in discussing subjects related todefecation practices, neither in groups, nor with individualhousehold members. Also, there was no objection for men to discussthese subjects with women.
•
Iindicators to classify villages and households. As an aftermath of Ithe 1970-1978 period, the physical outlook of houses providesinsufficient indication. Landownership and agricultural producealso do not provide suitable indicators, the farming system being Iof a collective type. The general impression was that socio- Ieconomic differentiation is relatively small, though existent.Therefore, for this survey, the ability to buy soap and the number •of jars per household are used as tentative indicators. I
Within the available time, it was not possible to find suitable •indicators to classify kitchens and to collect data on food Ihandling. An additional study may be necessary to cover these ™aspects.
IIII
IIIIIIIIIIIIIIIIIIIII
DRAFT 1987-06-03/dv
Preparation of questionnaires
Four draft questionnaires were developed:
1. Questionnaire for the village chief (Chef de Village).Purpose of this questionnaire was to collect general data onvillage characteristics. At the same time, the questionnaire wasused to determine to what extent village chiefs could provideuseful baseline data on the water supply and sanitation situationin their villages. (See annex 1)
2. Household questionnaire.This questionnaire included questions about water collection,storage and use, the walking distance to various water sources,the incidence of water and sanitation related diseases andsanitation practices. (See annex 2)
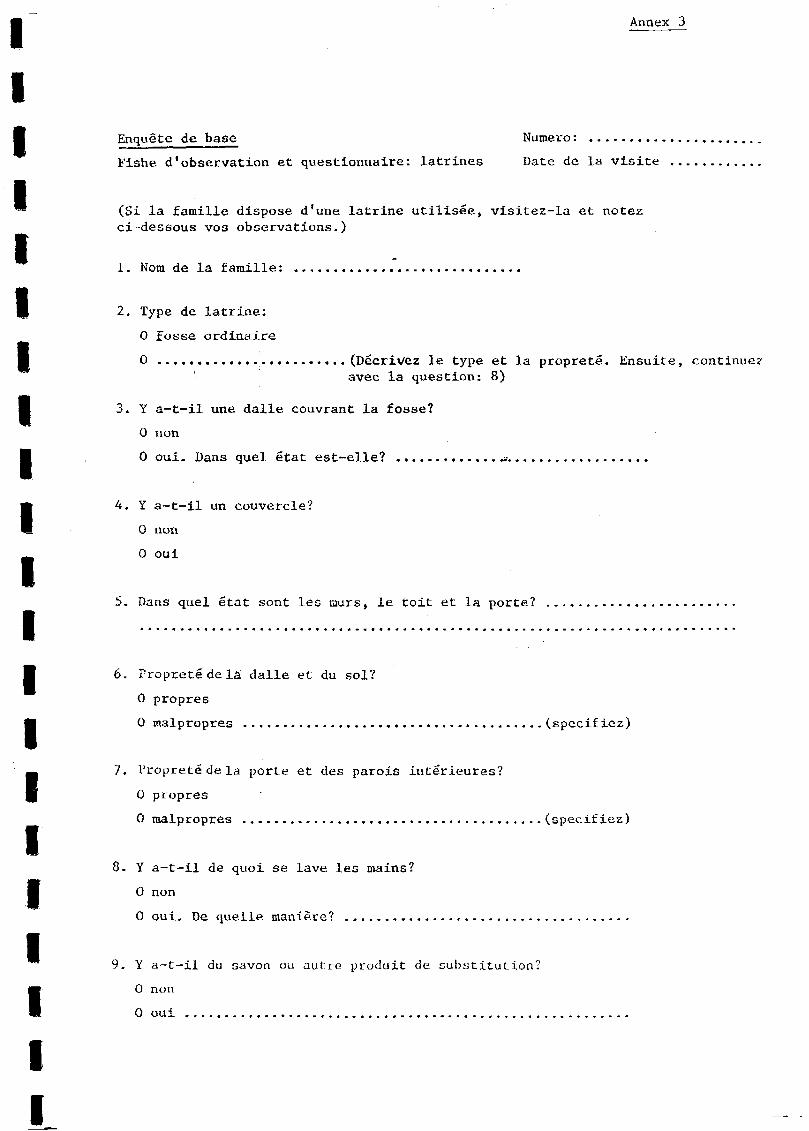
3. Latrine observation sheet.This sheet was to be used in addition to the householdquestionnaire in case a family had a latrine at its disposal, (seeannex 3)
4. Health centre information sheet.This sheet was developed to collect information about theincidence of water and sanitation related diseases. At the sametime the sheet meant to provide information on available healthstaff at Khum level. (See annex 4)
The draft questionnaires were discussed and adapted where necessary ina general meeting with representatives of the Ministry of Health andthe Programme Officer of UNICEP.
All questionnaires were translated into Khmer. As this was done as agroup effort, it was not deemed necessary to retranslate the Khmerversion into French to check its accuracy.
The questionnaires were only tested during the training of theinterviewers. In retrospect it would have been an advantage to alsohad them tested in a village as it would have permitted somesimplifications (for example, the questions on water source selectionand storage of water) and an improved lay-out of the householdquestionnaire.
Training of interviewers
Ten people were trained as interviewers. The group comprised doctorsand pharmacists, all working within the Ministry of Health.
Training took half a day and included:an introduction to the Water Supply and Sanitation Programme;
- an introduction to the purpose of the baseline study;a short interview training; anda practice run of the various questionnaires/information sheets.
DRAFT 1987-06-03/dv
Selection of villages
Together with representatives of the Ministry of Health and theProgramme Officer of UNICEF it was decided to select eight villages intwo districts; Dangkar and Kandal Stung, it was agreed that theselection of villages should reflect the different characteristicswith respect to:
water sources (well, river, pond, canal); a
distance to a main road; distance to Phnom Penh; •future ratio population-pump. *
Prerequisite would be that no project activities were started as yet Iin the villages to be selected. |
In selecting villages, use was made of available village data mcollected during the short investigation at the start of the programme I(see Chapter 1). Selection of villages proved to be difficult as thevillages were not easy to classify, especially with respect to watersources and distance to a main road, and a considerable number of •villages was already affected by the programme. •
Of the selected villages, two happened to be inaccessible due to Bfloods caused by heavy rains and therefore were replaced by two |others. However, one of these villages had to be struck off the listas it did not fit the selected criteria. am
In view of the sampling restrictions and problems mentioned above andthe total number of villages selected, the results of this studycannot be simply extrapolated to the whole project area. •
Selection of households IAs the household situation appeared to be rather homogeneous percluster of houses, it was not deemed necessary to include all village _households in the sample. Instead, it was decided to interview an •equal number of households per village for easy comparison. In each *village, 30 households would be interviewed to ensure that the samplewould also be representative for the more populated villages. I
Two sampling methods were tried out:
One of the methods used was to walk through the whole village, guided •by the village chief and to assign each interviewer to a cluster ofhouses where she/he interviewed three households at random (for _example, every second or third household, dependent on the total Inumber of households in the village). The advantage of this method was •a general overview of the whole village before interviewing wasstarted. The method seemed to be without risks as each village chief Uhas an intimate knowledge of his village, and villages are generally Qsmall and easy to survey. However, once this method almost produced asampling mistake when the village chief originally introduced us to •the old village only because he considered a newly built neighbourhood Ias distinct.
III
II1IIIIIIIIIIIIIIIIII
DRAFT 1987-06-03/dv
The second method involved a random sample drawn from the villageregisters which contain up-to-date information about the number ofhouseholds per village, including the names of the household members.Sampling details are presented in Annex 5, This method worked withoutany problem.
For any future quantitative study, it is recommended to combine bothmethods. An observation walk through the whole village will allow fora better idea of the local situation and daily practices of thevillage population. The use of the village register will give moreconfidence about the representativeness of the sample.
Field-work
Before visiting the villages, the authorities at Srok, Khum and Phumlevels were informed about the forthcoming survey and their permissionand cooperation obtained. Also the Women Association (Association desFemmes) was informed and often one of their representatives waspresent in the village to aid the interviewers.
Field-work was done per village, allowing the interviewers to work asa team, what was felt to be an advantage. However, this approachprevented the chance of getting a deeper understanding of localpractices and circumstances as the the visit never took longer thanhalf a day.
For the household survey, preference was given to interviewing thewoman of the household in view of her role in water and sanitation.When she was not present, another household member above 16 years ofage was interviewed. Dependent on the number of children in thehousehold, an interview took 30-45 minutes.
Completed questionnaires were checked by the interviewers themselves,followed by a routine check by one of the authors. This turned out tobe a valuable procedure, contributing to a higher quality of data-recording .
Data processing
Tabulation of data was done by hand on data collection sheets. As thewhole interview team was involved in this activity, this did nost takemore than a couple of days. Then all data were entered in a computer,using the D Base III programme. This took much more time as did thecomputer analysis, mainly due to being unfamiliar with the ins andouts of D Base ill. In retrospect, preference should have been givento data analysis by hand. Not only this would have permitted acollective analysis by the corporate team, but also would haveproduced much quicker results.
Time and Manpower inputs
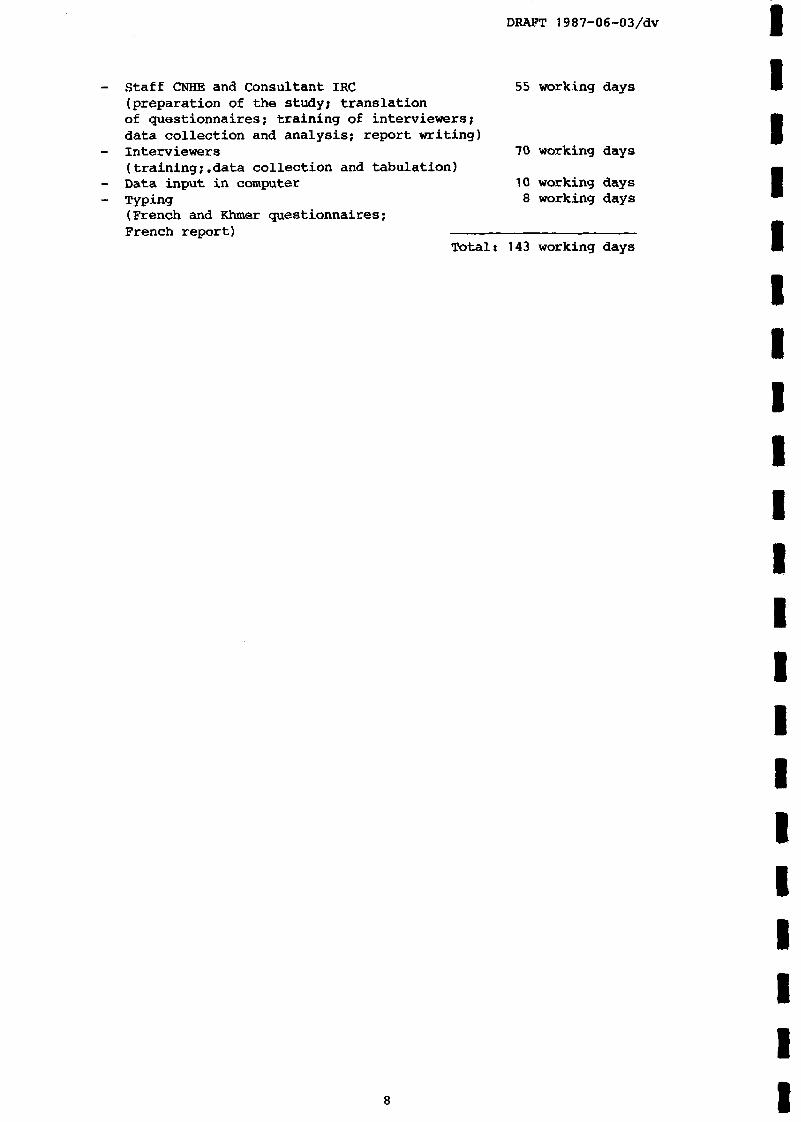
A rough estimation is given of the time and manpower inputs used tocomplete the baseline study. The total number of workings days amountsto 143 and is made up of the following:
Staff CNHE and Consultant IRC(preparation of the study; translationof questionnaires; training of interviewers;data collection and analysis; report writing)Interviewers(training;.data collection and tabulation)Data input in computerTyping(French and Khmer questionnaires;French report)
DRAFT 1987-06-03/dv
55 working days
70 working days
10 working days8 working days
Total: 143 working days
IIIIIIIIIIIIIIIIIIIII
IIIIIIIIIIIIIIII
DRAFT 1987-06-03/dv
3. THE SAMPLE POPULATION
The villages
All seven villages included in the baseline study are situated within aone-and-a-half hour drive from the capital city Phnom Penh. Five belong toSrok Dangkor and two to Srok Kandal Stung.
The number of inhabitants ranges from 193 in Kap Kong to 415 in Prey Kei,with an average of 283 per village. The average household size is 4.1 andthe average man-woman ratio is 100:130. Population details are summarizedbelow.
Table 1: Population characterists of the sample villages
Houses are generally made of wood, leaves and/or corrugated iron.Whereas elevated houses are preferred, they are expersive to buildand many households live at ground level, especially since the1970-1979 period. Houses consist of one or two rooms, sometimes more.Kitchens, sometimes not more than a place with three fire stones, aresituated in, under, leaning against or detached from the house. Withthe exception of Char, all houses are surrounded by a big or smallyard.
In all villages but Kap Kong stagnant water is a common problem during therainy season. Household waste does not give any trouble as yet as mostwaste is organic and thrown in a compost pit. Occasionally rats and mouseare a nuisance.
The main source of income is rice cultivation. Three villages (Kmut,Char and Prey Sampor) have two yields a year. Fruit and vegetablesgrown in the yards or gardens near the houses provide an importantsecondary source, often for household consumption only, and sometimesalso for the market. To what extent livestock (cattle, pigs, chickens)are important beyond subsistance level is not known, other economicactivities include small-scale production of palm sugar, sack-weavingfrom palm leaves, fishing and sale of fish. In Kap Kong, one third ofthe male population works as "bicyclette porteur" in Phnom Penh fromOctober to December.
DRAFT 1987-06-03/dv
Prey MoulKap KongKmutCharPrey SamporBakouPrey Kei
1500 m1500 m2000 m1500 m1250 m50 m10 m
800 m900 m2000 m2000 m1050 m1200 m200 m
The households
Total 208 994
IIThe distance from the villages to a main road is only considerable for
Prey Moul, whereas Prey Kei is situated along the main road. Bakou isbuilt alongside the river. The walking distance between the centre of Ieach village and the nearest primary school and health post m(infirmerie) nowhere exceeds two km. Details are given in the tablebelow. m
Table 2: Walking distance between the centre of each village and the —
nearest primary school and health post I
Village Distance to primary school Distance to health post
IIII
The baseline study included 30 households per village, with the gexception of Prey Sampor and Bakou where only 29 households could be Ivisited. In total, the study covers nearly half of all households,that is 208 out of 457. Table 3 presents an overview of the number ofhouseholds and household members covered by the study. I
Table 3: Number of households and household members included in the •baseline study £
Village No. of households No. of household members •
IThe 208 households comprise 564 women and 430 men, resulting in a •men-women ration of 100:131. The number of households without a male J[adult is 33 (or 16%). The average household size is 4.7 with fourone-person households and seven households with nine members or more. MAbout 58% (or 120) families have one or more children with the age of I0-5 years old.
10
III
IIIIIIIIIIIIIIIIIIII
DRAFT 1987-06-03/dv
As discussed before in Chapter 2, preference was given to interviewthe female heads of the households. As a result, 159 (76%) of therespondents were female. For future studies, it might be considered toselect a larger proprotion of men, especially with respect to thosesubjects where the opinion and experience of men may differ from thatof women (see for example Chapter 6).
The majority of houses in the sample have been built at ground level(141 or 68%), have walls made of woven palm leaves (131 or 64%) andthatched roofs (124 or 60%). The number of elevated houses constructedof wood with roofs of corrugated iron or tiles is 43 (20%) and aremainly found in Prey Moul, Prey Sampor and Bakou.
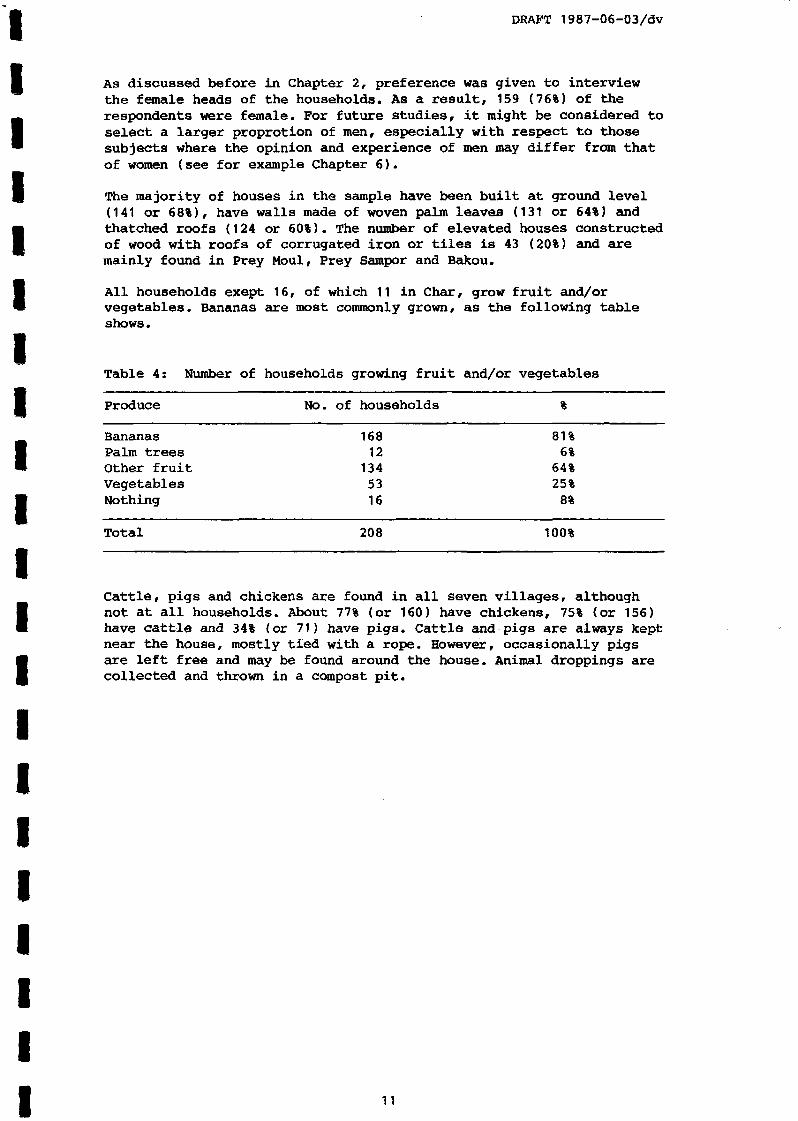
All households exept 16, of which 11 in Char, grow fruit and/orvegetables. Bananas are most commonly grown, as the following tableshows.
Table 4: Number of households growing fruit and/or vegetables
Produce No. of households %
Bananas 168 81%
Palm trees 12 6%Other fruit 134 64%Vegetables 53 25%Nothing 16 8%
Total 208 100%
Cattle, pigs and chickens are found in all seven villages, althoughnot at all households. About 77% (or 160) have chickens, 75% (or 156)have cattle and 34% (or 71) have pigs. Cattle and pigs are always keptnear the house, mostly tied with a rope. However, occasionally pigsare left free and may be found around the house. Animal droppings arecollected and thrown in a compost pit.
11
DRAFT 1987-06-03/dv
4. WATER SOURCES
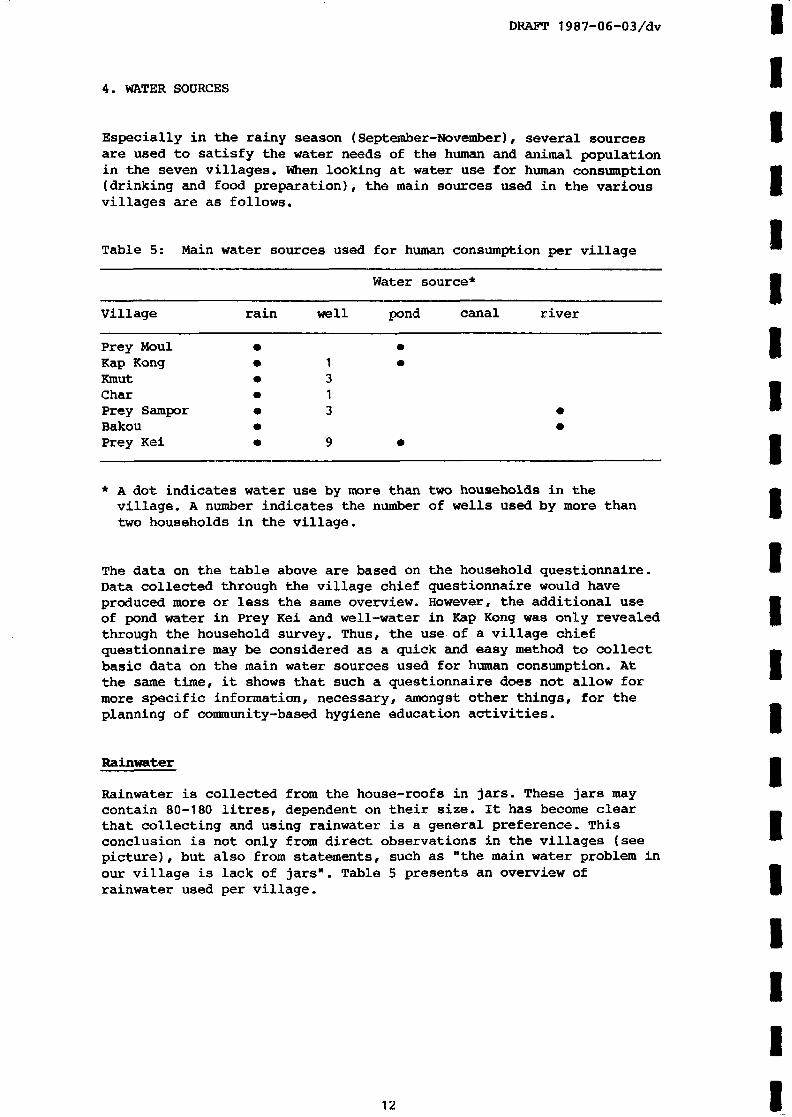
Especially in the rainy season (September-November), several sourcesare used to satisfy the water needs of the human and animal populationin the seven villages. When looking at water use for human consumption(drinking and food preparation), the main sources used in the variousvillages are as follows.
* A dot indicates water use by more than two households in thevillage. A number indicates the number of wells used by more thantwo households in the village.
The data on the table above are based on the household questionnaire.Data collected through the village chief questionnaire would haveproduced more or less the same overview. However, the additional useof pond water in Prey Kei and well-water in Kap Kong was only revealedthrough the household survey. Thus, the use of a village chiefquestionnaire may be considered as a quick and easy method to collectbasic data on the main water sources used for human consumption. Atthe same time, it shows that such a questionnaire does not allow formore specific information, necessary, amongst other things, for theplanning of community-based hygiene education activities.
Rainwater
Rainwater is collected from the house-roofs in jars. These jars maycontain 80-180 litres, dependent on their size. It has become clearthat collecting and using rainwater is a general preference. Thisconclusion is not only from direct observations in the villages (seepicture), but also from statements, such as "the main water problem inour village is lack of jars". Table 5 presents an overview ofrainwater used per village.
12
IIII1IIIIIIIIIIIIIIII
IIIIIIIIIIIIIIIIIIIII
DRAFT 1987-06-03/dv
Table 6: Rainwater use per village (N=208)
Village
Prey MoulKap KongKmutCharPrey SamporBakouPrey Kei
Total
Humanconsumptiononly
81697171517
89 (43%)
Number of
Human cons+ bathing/laundry
161073596
56 (27%)
households
Human consumption+ bathing/laundry + cattle
4200010
7 (3%)
Totalhumanconsumption
28281610222523
152 (73%)
Of all households in the sample, 56 (or 27%) do not use rainwater atall. Lack of jars and nearby wells seem to be the two main reasons.
The above table shows that rainwater is primarily reserved for humanconsumption. The main reasons given are custom * (43%) and taste (40%)followed by the closeness to home (32%). Water hygiene was mentionedby 24% of the respondents **.
Reasons put forward for the use of rainwater differ somewhat pervillage, probably dependent on the other sources available. In PreyKei, the village with nine wells, taste proves to be all important. InKap Kong, the village with a poor quality well, hygiene scores high.Both in Kap Kong and Prey Moul, where ponds are at a considerabledistance, closeness to the house is a more important reason.
Despite a strong preference for rainwater and the tendency to serve itfor human consumption, most households have to rely also on drinkingwater from other sources, even in the rainy season, as the storagecapacity is often not sufficient to bridge the time between tworainfalls. The data presented further will illustrate this point.
Well-water
In the rainy season, wells are an important water source in four ofthe seven villages. About 36% (or 74 households) use well-water forhuman consumption and about 42% (or 88 households) use well-water forbathing and laundry. Table 7 provides the details.
**
Custom may be considered as a valuable indicator in as much as ithelps us to realize that people may be very much accustomed to aparticular water source without giving it second thoughts.However, the answer "custom" does not reveal much information oncriteria for water source selection.Many respondents mentioned more than one reason. Percentage istaken from N=152, that is all respondents who use rainwater.
13
DRAFT 1987-06-03/dv
Table 7: Well-water use per village in the rainy season (N=*208)
Number of households
Village
Prey MoulKap KongKmutCharPrey SamporBakou
Prey Kei
Total
Humancons.only
0118200
12
Humancons. +bathing/laundry
10151615010
57
Humancons. +bathing/laundry+ live-stock
0010004
5
Subtotalhumancons.
11172417014
74(36%)
Bathing/laundry
0253907
26
Bathing/laundry+ live-stock
0021000
3
(Total
1 '
3 ¡24 ¡28 ,26 i
0 '21 '
103 (50%),
The distance to the nearest well is less than 100 metres for 72% ofthe households using well-water. For nearly 44% of these households,the distance does not exceed 50 metres. Especially in Prey Kei thewells are very close to the houses. Only three households have to walkover 250 metres, of which one 300 metres (in Char) and two 500 metres(one in Char and one in Prey Sampor).
The reasons most frequently put forward for the selection ofwell-water are quantity and custom, with respectively 49% and 45%.Taste and clarity (= colour) score low, which may not be surprising,as well-water in Kmut is generally muddy and well-water in Charcontains a lot of iron. In Prey Kei, we already assessed a clearpreference for rainwater because of its taste. Hygiene does not seemto be an important consideration anywhere.
In the dry season, the percentage of households using well-waterincreases to 57% (or 119) for human consumption and 60% (or 125) forall purposes. Table 8 shows a breakdown per village (see next page).
The table clearly shows the difference between Kmut, Char and Prey Samporwhere nearly all households rely on well-water during the dry season andBakou and Prey Moul where all households have to fall back on surface water(as will be further discussed on the following pages).
As in the rainy season, water hygiene scores low as reason for theselection of well-water. In Kap Kong, the village with the poor well, thescore is even zero. Again the most important reasons for the selection ofwell-water are quantity and custom. For Prey Sampor, closeness to the houseis an additional important consideration.
14
IIII1IIIIIIIIIIIIIIII
IIIIIIIIIIIIIIIIIIIII
DRAFT 1987-06-03/dv
Table 8: Well-water use per village in the dry season (N=208)
Number of households
Village
Prey MoulKap KongKmutCharPrey SamporBakouPrey Kei
Total
Humancons.only
0306001
10
Humancons. +bathing/laundry
05181420012
69
Humancons. +bathing/laundry+ live-stock
061110409
40
Subtotalhumancons.
014293024022
119(57%)
Bathing/laundry
0010400
5
Bathing/laundry+ live-stock
0000100
Total
014303029022
125 (60%)
Also in the dry season, nobody is walking more than 500 metres to drawwater from a well. Just over 3% (or 4 of the households usingwell-water) has to cover 300-500 metres. About 70% (or 88 households)draw their water from a well within 100 metres distance.
All wells seem to be used for all purposes. However, one or morehygienic rules are generally applied with the objective to keep thewater as clean as possible. Thus, most wells have a cover and bathingand laundry is are usually done at some metres distance from the well.In Prey Kei, most wells have a three sided screen at some 5-10 metresdistance which is used for bathing and sometimes for laundry anddish-washing. Nonetheless, some problems were also observed. Wellswere sometimes only half-covered. The platform around the well was notalways kep clean and one platform was so slippery with algae thatskill was needed to step on it. Surroundings of a well without aplatform was naturally often muddy. No well was equipped with aspecial bucket and rope to draw water.
Pond water
Whereas a total of 78 households (or 37%) use pond water in the rainyseason, only 18 households (or 9%) collect it for human consumption.This number becomes even less significant when we realize that only 7households (or 3%) use pond water exclusively, thus not in addition torainwater and/or well-water. Table 9 provides an overview of the use ofpond water in the rainy season.
15
DRAFT 1987-06-03/dv
Table 9: Pond water use per village in the rainy season (N=208)
In the dry season, the picture changes considerably when many morehouseholds in Prey Moul, Kap Kong and Prey Kei have to rely on pondwater for their daily needs. Table 10 illustrates this.
Table 10: Pond water use per village in the dry season (N=208)
Number of households
Village
Human Human Human { Subcons. cons. + cons. + , totalonly bathing/ bathing/ i human
laundry laundry i consump-f+ live ' tionstock '
Prey MoulKap KongKmutCharPrey SamporBakouPrey Kei
0000001
2500003
281800007
,30I 23i 0i 01 01 0'11
Total 10 53 i 64(31%)
Bathing/ Bathing/ Live-,Totallaundry laundry stock i
+ live istock
i 93 (45%)i
In comparison with the distance to the wells, the distance to theponds is generally much longer. In the rainy season, just over 30% ofthe households using pond water have to walk less than 100 metres. Inthe dry season this percentage falls back to 14%. The percentage ofhouseholds which has to walk 250 metres or more is 42% in the rainyseason and 51% in the dry season. However, the distance to a pond doesnot exceed 1000 metres anywhere, also not in the dry season.
16
IIIIIIIIIIIIIIIIIIIII
IIIIIIIIIIIIIIIIIIIII
DRAFT 1987-06-03/dv
Quantity and custom seem to be the most important reasons for the useof pond water. Quantity was mentioned by 40% of the households usingpond water and custom by 68%.
Canal water
Canal water does not seem to be of any importance for humanconsumption. It is mainly used for cattle and to a lesser extent forbathing and laundry, in the rainy season, some 40% (or 83) of thehouseholds use water from a canal; in the dry season» this percentagedrops back to 6% (or 12 households). Table 11 and 12 provide thedetails.
Table 11; Canal water use per village in the rainy season (N=208)
Number of households
Village
Prey MoulKap KongKmutCharPrey SamporBakouPrey Kei
Total
Humancons.only
0010000
1
Humancons. +bathing/laundry
0100000
1
Subtotalhumancons.
0110000
2 (1%)
Bathing/laundry
4632001
16
Live-stock
14414129
8
65
Total |
181118 '14949 ,
83 (40%)
Table 12: Canal water use per village in the dry season (N=208)
Number of households
Village
Prey MoulKap KongKmutCharPrey SamporBakouPrey Kei
Total
Humancons.only
0010000
1
Humancons. +bathing/laundry
stock
0010000
1
Humancons. +bathing+ live-
0000000
0
Subtotalhumancons.
0020000
2(1%)
Bathing/laundry
0000000
0
Bathing/laundry+ live-stock
0000000
0
Live-stock
0052201
10
Total
i
0 i
0 •
7 '2 \
2 ¡0 ,1 i
12 (6%) '
17
DRAFT 1987-06-03/dv
Quantity and custom are again the most frequently mentioned reasons for theselection of canal water. The few households which use canal water forhuman consumption do so because of its taste; one household because ofcustom.
In the dry season, the distance to a canal is within 500 metres foreverybody. In the rainy season people may take their cattle to a canalwhich is as far as 2000 metres away, whereas 50% of the households usingcanal water will find it within 100 metres. It is not known why some peopletake their cattle so far during the rainy season, but we assume that it hasto do with agricultural activities. One of the households using canal waterfor human consumption has to walk 500 metres, the others less.
River water
Only Prey Sampor and Bakou have a river within walking distance. Bakouis even situated at the bank of a river which makes the river animportant source of water throughout the year. Table 13 shows the useof river water in the rainy season.
Table 13: use of river water per village in the rainy season (N=208)*
Number of households
Village
.^ Prey Sampor- j Bakou
^Total
Humancons.only
20
2
Humancons. +bathing/laundry
26
8
Humancons. +bathing/laundry+ live-stock
16
7
Subtotalhumancons.
512
17(8%)
Bathing/laundry
26
8
Bathing/laundry+ live-stock
05
5
Live-stock
64
10
Total
1327
40 (19%)
* As no river water is used in the other villages, these are not included in thetable. However, percentage is taken from the total sample.
All households in Prey Sampor which draw river water for humanconsumption do so because of its taste. The people have to walk800-1000 metres to collect the water. In Bakou, taste is nevermentioned as a reason and households which use river water for humanconsumption do so because of the quantity and the closeness to thehouses (less than 50 metres).
Quantity and custom are the most important reasons for the use ofriver water for bathing, laundry and livestock. The walking distancefor people in Bakou does not exceed 200 metres. In Prey Sampor, thedistance to the river is between 300 and 1000 metres.
In the dry season, more households rely on river water, as thefollowing table shows.
18
IIIIIIIIIIIIII1IIIIII
IIIIIIIIIIIIIIIIIIIII
DRAFT 1987-06-03/dv
Table 14: Ose of river water per village in the dry season (N=208)
Number of households
Village
Prey SamporBakou
Total
Humancons.only
40
4
Humancons. +bathing/laundry
28
10
Humancons. +bathing/laundry+ live-stock
521
26
Subtotalhumancons.
1129
40(19%)
Bathing/laundry+ live-stock
50
5
Live-stock
40
4
Total
20 i29 •
49 (24%),
In the dry season, there is no alternative for Bakou than to takewater from the river for all purposes. Thus, the main reasonsmentioned are custom and quantity. Closeness to the houses and tasteare secondary reasons. To draw water from the river, one household hasto walk 500 metres, the other households, not more than 200 metres, ofwhich 50% less than 50 metres.
In Prey Sampor, the choice is often made for well-water instead ofriver water (see above). One reason probably is the difference indistance. To draw water from the river, all households but one have towalk more than 250 metres. However, the eleven households which useriver water for human consumption take the pains to walk 1000-1300metres. They are doing so because they prefer the taste of riverwater. Other reasons for the use of river water are its clarity andquantity or custom.
Selection of water sources; a reasoned choice
The discussion above shows that whenever various water sources areavailable, choices are made which sources are used for what purposes.Where the choice is limited or non-existent, water from the samesource is used for all purposes and availability, in this studyexpressed in terms of quantity and custom, is the sole criterion.Where several sources are within reach, other considerations also cameto the fore.
Rainwater is highly valued and used to the extent rain fall andstorage capacity permit. It is primarily reserved for humanconsumption and reasons as taste, closeness to the home, and hygieneare often mentioned next to custom. The reason put forward mostfrequently differs per village and seems to be affected by thecharacteristics of the other water sources available.
19
DRAFT 1987-06-03/dv
Well-water is valued because of its availability. Taste, clarity andhygiene generally score low. Where well-water competes with surfacewater, the former is often selected for reasons of proximity. However,a number of households takes the trouble of a long walking distance toa river or canal, because they prefer the taste of surface water. Asummary overview of water source selection for human consumption ispresented in annex 6.
Unlike rainwater, well-water and surface water are frequently used forbathing and laundry. For cattle, surface water is the more commonsource, followed by well-water.
Implications for the project
The introduction of a new water supply as envisaged by the projectwill change the array of choices with respect to water sourceselection. From the available data it may be expected that the newsupply will have to compete with other sources, especially rainwater,and water preferred for reasons of proximity and/or taste. Thus,source selection will have to be an important issue of the hygieneeducation programme. Especially the taste may be an important aspectto address, as well-water is not much valued for this reason.
With respect to the use of rainwater for human consumption the project £should decide on a general policy in close cooperation with thepopulation. Either it may be decided to discourage rainwater ^consumption once the handpump has been installed, or it may be Ipreferred to also direct the hygiene education programme to a safe *collection of rainwater. A complicating factor for the latter is thelarge number of thatched roofs which makes a safe selection of Brainwater doubtful. Some water quality tests may be indicated to allow mfor a more reasoned decision.
Informal information from villages already served with a new supply Irevealed some additional points of attention for the hygiene educationprogramme. First of all, a number of wells seem to contain a lot ofiron and thus a discussion should be included on the effects of iron Ion health and clothes and how to reduce the iron content in water ™before consumption. Also water pumping should be addressed as this issometimes felt to be more burdensome as compared with drawing waterwith a bucket.
20
I1IIIIII
Q S.
DENMARK:
GERMANY: 0
I I I 1 I I I I I t I I I I I I I I I I I I I I ! I I
11IIIIIII1IIIIIIIIIII
DRAFT 1987-06-03/dv
5. WATER COLLECTION, STORAGE AND USE
Water collection
Water collection is not a specific task of any of the householdmembers. Instead, the person with time to spend or the person whoneeds the water goes to collect it. This situation is underlined bythe data in the following table.
Table 15: Main water collectors of the household (N=208)
Taking into account the man-woman ratio, men's contribution to watercollection becomes even more positive. Why sons collect watercomparatively less often is not known.
Water is collected by the household members themselves. Although wecame across water selling in other villages, it does not seem to occurin the sample villages.
People have to walk to fetch water, usually the water is carried intwo buckets with the help of a yoke. From informal discussions itbecame clear that one pair of buckets and yoke is sometimes shared byseveral households. Occasionally the water is carried in pots, eitheron the head or on the hip. About 10% (or 14 households) use at times acart carrying a drum. Two thirds of these carts are drawn by an ox andone third by a man or woman.
Although we did not include a question on the cleaning of buckets andpots before water collection, our limited observations indicate thatthey are often rinsed, sometimes scrubbed, either at home or at thesource before fresh water is fetched. However, we never happened tosee that buckets or pots were covered during transportation.
Water storage
Water storage capacity at home differs per village and per family. Thefollowing table presents an overview.
21
DRAFT 1987-06-03/dv
Table 16: Number of jars per household per village (N=208)
Village
Prey MoulKap KongKmutCharPrey SamporBakouPrey Kei
Total
No.
0
101161268
44(21%)
of jars
1
5111219121914
92(44%)
per
2
131255446
49
household
3-7
11720102
(24%) 23(11%)
totalno. ofjars
78643029232734
285(1
average no.of jars perhousehold
2.62.11.01.00.80.91.1
00%) 1.4
Thus, Prey Moul and Kap Kong are relatively well-off, as far as jarsare concerned. A considerable number of households have two jars ormore and only one household in Prey Moul has to do without any. Worstoff is Prey Sampor, both with respect to the number of households nothaving a single jar, and to the average number of jars per household.Kmut also has a considerable number of households without a jar, oronly having one.
About 27% (or 57 households) have one or two small jars containing30-50 litres, either in addition to, or instead of a normal size jar.Combining the data on smaller and bigger jars, we find 7 households(or 3%) without a single jar. These households are found in variousvillages.
Some 60% of the households clean their jars with water only, theothers with water and a bruch or some straw. Jars are cleaned varyingfrom once a day to once a month; the majority of households (131 or66%) clean their jars once or twice a week. However, these figuresshould be considered with some precaution. From additionalinformation, we got the idea that jars are generally cleaned before arainfall and thus the frequency may depend on the weather. Also, fulljars are left until they are (nearly) empty before they are cleaned.And what is more, it proved to be a general practice to add freshwater to the water already in the jar, without cleaning in between(All except 6 households indicated to do so).
A large number of jars does not seem to be covered: 157 (or 55%).However, all households except one prove to have at least one jarcovered. From observations we may assume that the jar which iscovered, often contains water for drinking and kitchen use. However,observations also made clear that these jars are often only partiallycovered.
In most cases the interviewers judged the clarity of the water in thejars as insufficient. Sometimes worms were observed. The problem ofwater clarity may be quite understandable when we remember the sourcesof the water.
22
11IIIIIII1I1IIII11I1I
IIII1IIIIIII1I1IIII11
DRAFT 1987-06-03/dv
In addition to, or instead of jars, 47 pots are used by 38 households(or 18%). Only 16 (or 34%) of these pots are covered. The pots arekept in the house or the kitchen, either on the ground or on a table.
Water for drinking
About 41% (or 85) of the households in the sample do have a specialcontainer in which water is kept for drinking. Sometimes this is akettle, usually with boiled water. Sometimes it is a pot or little jarin the house or near the kitchen, in the latter case the water is alsoused for food preparation.
Thus, quite a number of households take care to keep the water theydrink as clean as possible. However, except for the boiled water, thewater in the special containers cannot be expected to be safe, as thesource from which it is taken and the way it is transported cannot betrusted.
The other households (123 or 59%) take water for drinking from a jaror pot, also used for other purposes. As we already stated before, thewater for drinking is usually taken from the covered one. To take thewater, a cup is used without a handle. This cup either floats on thewater in the jar or is placed upside-down on the cover. While takingwater, hands easily touch the water. Contamination of water throughhands is thus very likely, both directly and indirectly via the cup.
Hand washing
A majority of the respondents told us to wash hands before eating,with 20% (or 41) not doing so. Hand washing before food preparationscores just over 30%, whereas hand washing after defecation or aftencleaning the baby's bottom is often not done. The following tablepresents the details.
Table 17: Hand washing practices (N=208)
Occasion
Before eatingBefore food preparationAfter defecationAfter cleaning baby's bottomWhen collecting waterAfter workWhen hands are dirty
No. of respondents
16764394730309
%
80%31%19%23%14%14%4%
From the above data, we may conclude that hand washing is a matter ofconcern and surely should be an important aspect of any hygieneeducation programme.
23
DRAFT 1987-06-03/dv
Table 18: Use of soap
Hand washing
Without soapSometimes with soapAlways with soap
Total
for hand washing (N=208)
No. of respondents
1293940
208
%
62%19%19%
100%
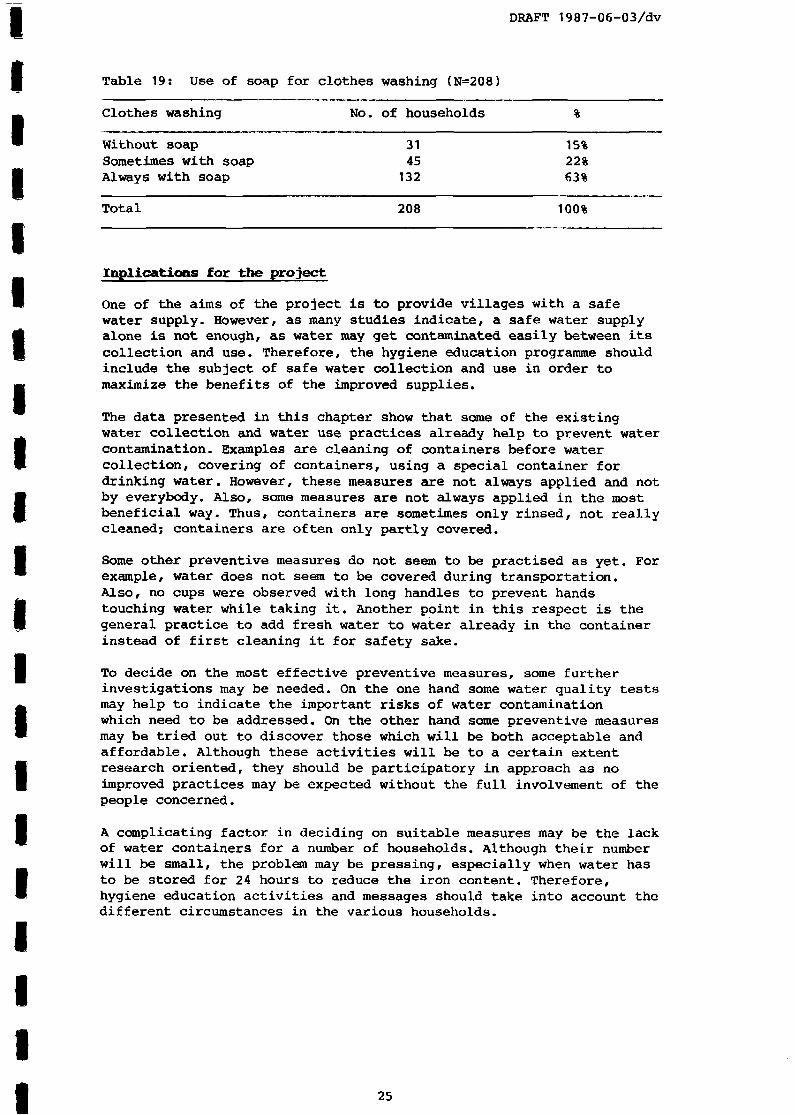
Clothes are more commenly washed with soap than hands. The followingoverview presents the data.
I1About 62% of the respondents wash their hands without soap. The other
respondents either wash their hands always with soap, oroccassionally. The situation seems to be somewhat the same in all Mseven villages. According to the village chief questionnaire, a number mof households in Kap Kong, Knut, Prey Sampor and Prey Kei cannotalways afford to buy soap. Thus, the affordability and use of soapseems to be a subject for further discussion. I
II1I
Bathing and laundry
IIt proves to be general practice to bath near the water source. Only •13 respondents and their families regularly bath at home. Thesefamilies are found in Prey Sampor (3), Kap Kong (3) and Prey Kei (7). •The seven families in Prey Kei bath themselves within the protection Iof a three sided screen near their private well. All other families *(men and women) bath at a public water source. In case they usewell-water or pond water they generally take care to keep the water as Mclean as possible by bathing at some metres distance from the source. jp
There does not seem to be any difference between bathing habits of men mand women. All prefer to bath several times per day and do so if they Ican. Only 24% of the adults and 14% of the children indicated to bathjust once a day. All babies except one are washed several times perday, usually at home. To get a better idea of the water requirements Iin the future, we asked in which season people bath themselves more 9often. Nearly 74% (or 153 respondents) indicated to bath more often inthe dry season, whereas 23% (or 48) answered more in the rainy •season. For 3% (or 7 respondents) the season does not influence their gbathing habits. Relating these answers to the villages where therespondents live, we find a remarkably high number of respondents (16) «in prey Moul who indicate to bath more often in the rainy season. This •most likely has to do with scarcety of water in the dry season.
Just like bathing, laundry is usually done near the water source (97% •of the households are doing so), and exactly 50% of the respondents •indicated to take care to wash the clothes at some metres distancefrom the source. The households which wash clothes exclusively at •home, all live in Prey Kei with a well nearby. g
III
24
IIIIIIIIIIIIIIIIIIIII
DRAFT 1987-06-03/dv
Table 19: Use of soap for clothes washing (N=208)
Clothes washing
Without soapSometimes with soapAlways with soap
Total
No. of households
3145132
208
%
15%22%63%
100%
Inplications for the project
One of the aims of the project is to provide villages with a safewater supply. However, as many studies indicate, a safe water supplyalone is not enough, as water may get contaminated easily between itscollection and use. Therefore, the hygiene education programme shouldinclude the subject of safe water collection and use in order tomaximize the benefits of the improved supplies.
The data presented in this chapter show that some of the existingwater collection and water use practices already help to prevent watercontamination. Examples are cleaning of containers before watercollection, covering of containers, using a special container fordrinking water. However, these measures are not always applied and notby everybody. Also, some measures are not always applied in the mostbeneficial way. Thus, containers are sometimes only rinsed, not reallycleaned; containers are often only partly covered.
Some other preventive measures do not seem to be practised as yet. Forexample, water does not seem to be covered during transportation.Also, no cups were observed with long handles to prevent handstouching water while taking it. Another point in this respect is thegeneral practice to add fresh water to water already in the containerinstead of first cleaning it for safety sake.
To decide on the most effective preventive measures, some furtherinvestigations may be needed. On the one hand some water quality testsmay help to indicate the important risks of water contaminationwhich need to be addressed. On the other hand some preventive measuresmay be tried out to discover those which will be both acceptable andaffordable. Although these activities will be to a certain extentresearch oriented, they should be participatory in approach as noimproved practices may be expected without the full involvement of thepeople concerned.
A complicating factor in deciding on suitable measures may be the lackof water containers for a number of households. Although their numberwill be small, the problem may be pressing, especially when water hasto be stored for 24 hours to reduce the iron content. Therefore,hygiene education activities and messages should take into account thedifferent circumstances in the various households.
25
DRAFT 1987-06-03/dv
In villages with an improved water supply we came across watersellers. These water sellers may be a special target group in thehygiene education programme as the way they collect and sell water may Ugreatly influence its safety. |
Hand washing will be an important hygiene education issue, especially mhand washing after defecation and before food preparation. As soap is Inot always affordable, suitable substitutes should be part of thediscussion. Prom informal discussions it became clear that womensometime use their foot to clean babies bottom. Thus feet washing Imight also be addressed where it applies. •
Bathing seems to be a much appreciated activity. It may be expected •that the new supply also will serve this purpose, especially in the |dry season when the need for frequent bathing is generally more felt.As one pump has to serve up to 400 people, this may create problems of ^accessability such as long waiting times and thus people restoring to •old sources to collect water for human consumption. Therefore, rules Bfor bathing and laundry might be an important point for discussion inthe hygiene education programme. I
To help prevent contamination of water at the pump site, a specialslab for bathing and laudry may be required at a few meters distance g|from the pump. This will be the more important in case the new supply Iis an improved shallow well. Additional hygiene education may help tofurther reinforce the present custom to bath and wash away from thewater source. I
26
IIIIII1IIII
IIIIIIIIIIIIIIIIIIII
DRAFT 1987-06-03/dv
6. DEFECATION PRACTICES AND LATRINE USE
Defecation practices
In all seven villages most people defecate in the open, either at theborder of their yard, in the field or at the river site. Only 30respondents appear to regularly use a latrine. The following tablepresents the details.
Table 20: Defecation site
Site No. of respondents
At the border of the yardin the fieldAt the bank of the riverLatrine
8194330
39%46%1%14%
Total 208 100%
Young children do not seem to use a latrine at all. Just like babiesthey defecate in the yard. Only the distance to the house changes withage: babies more often defecate quite near to the house whereas youngchildren increasingly use the border of the yard.
Table 21: Defecation site of babies and young children (between 1 and3 years old)
Site
CloseAt the
Total
to theborder
houseof the yard
Babies
4120
61
%
67%33%
100%
Young children
4544
89
%
51%49%
100%
Most respondents indicated that the faeces of adults, babies and youngchildren are covered (see Table 22). Faeces of babies and youngchildren even seem to be more generally covered than those of adults.Covering is done in the following way: with the help of a hoe a littlehole is dug in which the faeces are disposed and subsequently covered.
Table 22: Covering of faeces according to age group (As percentage ofthe total number of persons in a particular group)
Age group
BabiesYoung childrenAdults (respondents)
Total
Faeces covered (%)
84%93%69%
78%
27
DRAFT 1987-06-03/dv g
To what extent faeces are covered as a daily routine is not known. In ™any case the responses indicate that there is a norm to cover faeces.There seems to be no custom to throw babies' and children's faeces ÊÊinto the latrine, as nobody reported to do so. |
Cleaning material used after defecation differs for children and •adults. Whereas babies and young children are cleaned with water, Iadults mostly use leaves. One adult reported to occasionally usepaper, another grass. This material is said to be covered togetherwith the faeces. •
Table 23: Material used for cleaning after defecation according to •age group (As percentage of the total number of persons in ga particular group)
Age group
BabiesYoung childrenAdults
Total
Water
95%98%24%
54%
Material used (%)
Leaves
5%2%76%
46%
Cleaning of young children after defecation is normally done by one ofthe parents, sometimes by a brother or sisterchild itselfs. Table 24 presents an overview.
Parent 73 84%Parent and brother/sister 10 12%Brother/sister 3 3%Parent and child him/herself 1 1 %
Latrine use
III1
the parents, sometimes by a brother or sister and occasionally by the B
iTable 24: Person who cleans the bottom of the young child (N=*87)
Acting person No. of families %
II
From all respondents in the sample, nearly 50% never used a latrine in Itheir lives. This figure seems to apply to both women and men. The Mrespondents who used a latrine one time or more, are not evenlydistributed over the villages, as the following table will show. M
28
IIII
II11IIIIIII1IIIIII1II
DRAFT 1987-06-03/dv
Table 25: Respondents with experience in latrine use per village(N=208)
The difference in the number of respondents with experience in latrineuse is greatest between Bakou (24%) and Prey Sampor (76%). Reasons forthe great variation in percentages seem to be manifold, but should befurther investigated before more final statements can be made. One ofthe reasons Prey Sampor is scoring so high probably is due to the factthat this village used to be a model village.
When we asked the respondents whether they thought a latrine would beuseful, we received the following answers:
Table 26: Opinion on utility of latrines
Opinion No. of respondents %
Latrine is useful 159 77%
Latrine is not useful 43 21%Do not know 5 2%No answer 1
Total 208 100%
Combining the data of Table 25 and 26 shows that also a majority (or58%) of the respondents who never used a latrine, consider a latrineto be useful. Not surprisingly, the lowest interest in latrines isfound in Bakou.
The 159 respondents (or 77%) who affirmed the utility of latrinesvoiced various resaons for their opinion. The possibility to use humanfaeces as manure was the reason most frequently mentioned. The use ofhuman faeces as manure is known from the seventies. However, it is notyet sufficiently clear whether it is actually being used or will beused as manure. Hygienic reasons also were often put forward, such as:"prevention of diseases"; "protection against flies"; or just"hygiene". Seven times a latrine was considered to be useful toprevent a "bad smell". Three respondents mentioned "privacy" as mostimportant reason. Below the reasons are summarized.
29
DRAFT 1987-06-03/dv |
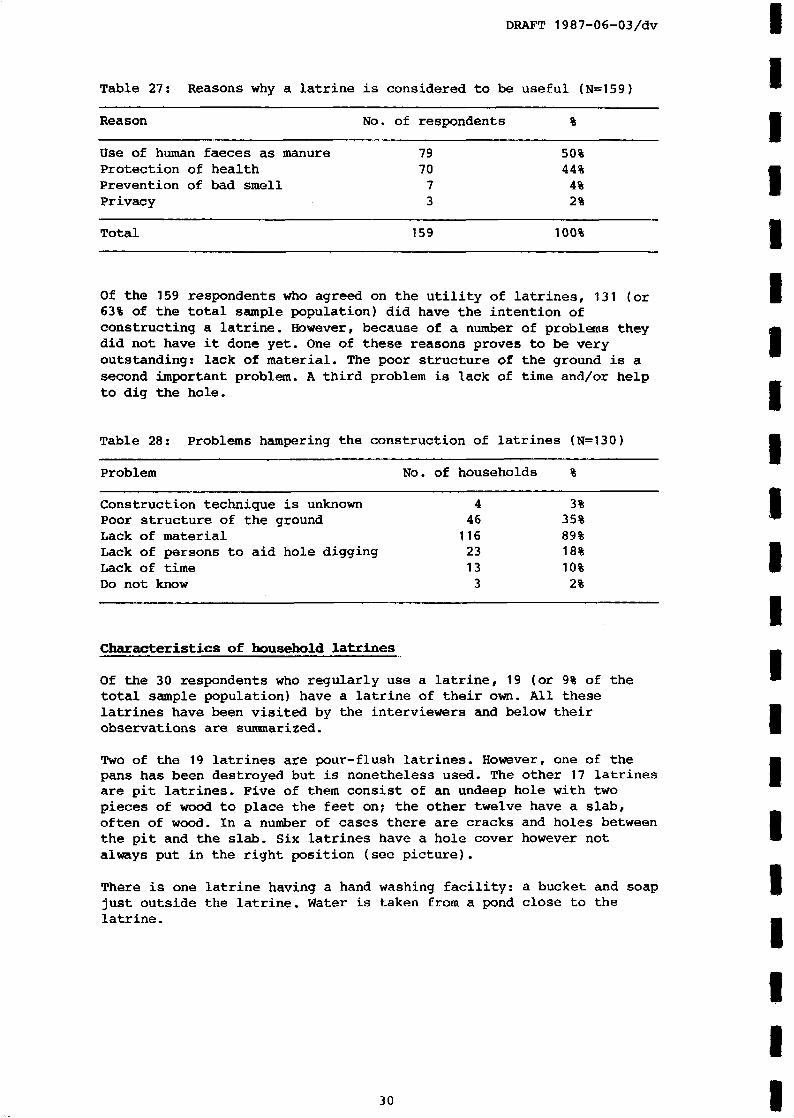
ITable 27: Reasons why a latrine is considered to be useful (N=159)
Reason No. of respondents % fl
Ose of human faeces as manure 79 50%Protection of health 70 44% MPrevention of bad smell 7 4% •Privacy 3 2%
Total 159 100%
44611623133
3%35%89%18%10%2%
Characteristics of household latrines
IIOf the 159 respondents who agreed on the utility of latrines, 131 (or
63% of the total sample population) did have the intention ofconstructing a latrine. However, because of a number of problems they mdid not have it done yet. One of these reasons proves to be very Ioutstanding: lack of material. The poor structure of the ground is asecond important problem. A third problem is lack of time and/or helpto dig the hole. •
Table 28: Problems hampering the construction of latrines (N=130)
Problem No. of households %
Construction technique is unknownPoor structure of the groundLack of materialLack of persons to aid hole digging 23 18% BLack of time 13 10% WDo not know
II
IIOf the 30 respondents who regularly use a latrine, 19 (or 9% of the
total sample population) have a latrine of their own. All theselatrines have been visited by the interviewers and below their Uobservations are summarized. I
Two of the 19 latrines are pour-flush latrines. However, one of the •pans has been destroyed but is nonetheless used. The other 17 latrines •are pit latrines. Five of them consist of an undeep hole with twopieces of wood to place the feet on; the other twelve have a slab,often of wood. In a number of cases there are cracks and holes between Ithe pit and the slab. Six latrines have a hole cover however not •always put in the right position (see picture).
There is one latrine having a hand washing facility: a bucket and soap (jjust outside the latrine. Water is taken from a pond close to thelatrine. m
30
III
IIII1IIIIIIIIIIIIIIII
DRAFT 1987-06-03/dv
Four of the latrines are used by more than one household: two latrinesby six households; one latrine by four to five households; and onelatrine by two households. The reasons and rules for sharing latrinesare not sufficiently known. One respondent indicated that otherhouseholds also used their latrine because they could not constructone themselves due to a high groundwater table.
The problem of a high groundwater table and also the risk of collapseseem to be rather general. As a result, most pits are very shallow.Even though, some latrines can only be used in the dry season as theyare flooded in the rainy season. One of the households solved thisproblem by digging in an old cracked jar. other households constructedelevated latrines as an alternative solution.
The superstructures of the latrines are nearly always made of localand/or waste material, such as palm tree leaves, car doors, wood,corrugated iron, sheet iron. Often parts are lacking such as a roof,a wall and/or a door (or a fixed half-door) (see picture).
In view of the above description, it is not amazing that thecleanliness of the latrines is not easily maintained. The observationsof the interviewers are summarized below.
Table 29: Cleanliness of the latrines
Part of the latrine Clean Unclean Not applicable Total no.(* = no answer) of latrines
It is remarkable that four out of the five latrines which areconstructed with iron plates are evaluated as being clean. It might bethat these latrines are easier to clean but it is also possible thatcompared to the other latrines they give a cleaner impression. For alatrine programme both aspects could be of importance.
All latrines except one are situated at a distance of more than 10metres both from houses and wells.
On our question what the latrine owners considered to be the mainadvantages of using a latrine, the following answers were received.
31
Table 30: Advantages of using a latrine (N=19)
DRAFT 1987-06-03/dv |
I•
Advantage No. of respondents % |
Privacy* 10 53% mProtection against the rain 8 42% IHygiene 14 74%Production of manure 2 11 %Prevention of bad smells 1 5%Close to the house 1 5%
In Kmer: having walls around you.
II
Hygiene is the advantage most frequently mentioned. This could justify Ithe assumption that the latrine owners relate latrine use to health ™protection. However, when we compare this finding with the data onlatrine cleanliness we must conclude that this relation is at least Iquestionable. Only 4 out of the 14 latrine owners who mentioned •hygienic reasons had a clean slab and/or soil. Thus, this mightindicate a difference between health knowledge and health practice. •
Privacy is another advantage frequently mentioned. From informaldiscussions in the villages we gathered privacy to be a more important _consideration for women than men. However, the limited quantative data •available do not support this impression. Four of the five male ™respondents mentioned privacy as an important advantage forthemselves. Thus tentatively it may be that privacy is valued by both Iwomen and men. |
Our doubt expressed before on the use of human faeces as manure is mstrengthened by the data above. Only 2 latrine owners reported the Iproduction of manure to be an advantage.
Implications for the project B
Although many respondents indicated an interest in latrines, we cannot Mexpect a latrine programme to be quick and easy. At present most |people defecate in the open and a considerable number of people neverused a latrine before. Therefore, it is not likely that they will «change their practices without good reasons. •
Advantages of latrines use as put forward by present users willrequire further exploration to get a deeper understanding of what Imight motivate people to change their defecation habits. In this Ibaseline study a majority of users mentioned hygiene as an advantage.However, there is much evidence from all over the world that hygiene •alone is not a sufficient reason. Privacy was another advantage |frequently mentioned and this might be an important additionalmotivating factor, especially in densely populated villages without _proper places to hide oneself. I
32
III
IIIIIIIIII1IIIIIIIIII
DRAFT 1987-06-03/dv
As may be clear from the above it is foreseen that the latrineprogramme primarily will be a village motivation programme. Theprogramme should start in an early phase and continue long afterlatrine construction has been completed. Special care should be takenthat all households in the village participate in the programme as tomaximize health benefits. This might imply that some households areoffered help by fellow villagers to dig the hole and to arrange formaterial to construct the superstructure. If acceptable, sharing oflatrines might also be considered.
As the number of people having experience in latrine use differsconsiderable per village, the programme should be flexible by nature.Thus, in villages like Bakou motivation may take longer and also moreinformation may need to be given about the ins and outs of latrines. Alatrines model may aid to this end. All village programmes shouldinclude discussions about a proper and exclusive use of the latrine(and what to do at night, or when you have diarrhoea or when you arefar away from home); latrine use by children; where to throw babiesfeaces; use of water, leaves and/or paper as cleansing material;suitable hand washing facilities; use of hole covers with a longhandle; latrine cleaning; purpose of the vent pipe.
in villages where no latrine programme will be carried out, hygieneeducation activities primarily should focus on reinforcing thepractice of covering faeces and of hand washing. Slowly, more emphasismay be put on constructing latrines with local material and communityeffort only. However, care should be taken that latrines will be up tostandard as to avoid that they will become a new health risk insteadof a protection of health.
33
DRAFT 1987-06-03/dv
7. HEALTH
Health and health knowledge
In the two weeks preceeding the baseline, 228 household members (145children and 83 adults) were reported to be ill. Together this is 23%of the total number of persons included in the survey.
Table 31: Number of persons ill per household (N=208)
No. of children illin the household
012345
Total
No. ofholds
1047521521
208
house-%
50%36%10%2%1%1%
100%
No. of adults ill No. of house-in the household holds %
012345
Total
13957102
67%27%5%1%
208 100%
Together these 228 people suffered from 242 diseases. The diseasesmentioned are summarized in the following table.
Table 32: Type of disease and number of persons affected (N=228)
Total number of persons affected: 228average number of diseases per person: 1.06
Malaria is not found in the area itself. All cases are imported.Such as Polio, Tuberculosis, Hepatitis, Flu, etc.
Thus, most people who were ill during the two weeks preceeding thebaseline suffered from unspecified fever (42% or 95 persons). To whatextent this fever is caused by a water and sanitation-related diseaseis not known. Diarrhoea is the second important disease with 60persons (or 26%) affected. Of the total sample population this is 6%.More babies were suffering from diarrhoea than (seven cases werereported which amounts to 11% of the total number of babies).
34
IIIIIIIIIIIIIIIIIIIII
IIIIIIIIIIIIIIIIIIIII
DRAFT 1987-06-03/dv
To get a deeper understanding of perceived health problems, we askedthe respondents what they considered to be the most importantdisease(s) in their village. The answers are presented in table 33.
Table 33: The most important disease(s) in the village as perceivedby the respondents (N=208)
Disease No. of respondentsmentioning this disease
Diarrhoea/DysenteryWorm diseasesBye diseasesSkin diseasesMalariaUnspecified feverMeaslesDengueDo not know
156442067324418514
75%21%10%32%15%21%9%2%7%
The above table shows that 75% of the respondents perceive diarrhoeato be an important disease. Skin and worm diseases are also frequentlymentioned. Unspecified fever, on the other hand, scores comparativelylow.
When we asked during which season diarrhoea is a more serious problem,the following answers were received.
Table 34i The season in which diarrhoea is perceived to be a moreserious problem
Season No. of respondents
More cases of diarrhoeaduring the rainy seasonMore cases of diarrhoeaduring the dry seasonNo difference betweenthe seasonsDo not know
56
97
1441
27%
47%
6%20%
Total 208 100%
Especially male respondents (67%) mentioned the dry season to be theworst season. A comparison by village shows that except for PreySampor and Bakou, the majority of respondents judge the problem ofdiarrhoea to be more serious during the dry season. The fact that themajority of respondents in Prey Sampor and Bakou consider diarrhoea amore serious problem in the rainy season might be related to the factthat they rely more heavily on surface (river) water.
35
Parents of children between 0-5 years of age were asked what they dowhen their child suffers from diarrhoea. Their answers show thatdiarrhoea is treated in a large number of ways, but most often throughmedicines, whether or not supplied by the health centre.
DRAFT 1987-06-03/dv I
II
Table 35: Remedies used when children between 0-5 years of age have Idiarrhoea (N=120) '
Remedy No. of respondents %
Medicines 95 79%Visit to health centre 76 63%Visit to local healer 9 8%ORT 21 18%Abstinence of food and drink 24 20%Domestic remedy 43 36%Sorcery 11 9%
These 134 respondents mentioned the following diseases possiblytransmitted by human faeces.
10522941223
78%16%7%3%9%17%
50%11%4%2%6%11%
IIII
With regard to the prevention of water and sanitation-related diseasessome questions were included about disease transmission. A majority of m134 respondents (or 64%) felt that faeces may transmit diseases. •
Table 36: Opinion about disease transmission through human faeces I
(N=208) M
Opinion No. of respondents % •
Human faeces may transmit disease 134 64%
Human faeces cannot transmit disease 48 23% «
Do not know 26 13% I
ITable 37: Diseases transmitted through human faeces according to the
opinion of the respondents (N=134) ^Disease transmitted No. of respondents % % of total •
Remarkable is the knowledge about the danger of human faeces for thetransmission of diarrhoea. However, how this transmission iseffectuated is much less known. Only the role of flies seems to becommon knowledge. Even people who do not know which diseases aretransmitted through human faeces, pointed at the danger of flies.Additional informal talks made clear that the role of flies in diseasetransmission had been part of a hygiene education campaign severalyears ago. It is noteworthy that 17 respondents (or 13%) mention therisk of disease transmission through latrines (see table 38).
Table 38: Routes of disease transmission according to the opinion ofthe respondents (N=134)
Route No. of respondents % % of totalsample population
WaterFoodPersonal hygieneLatrinesFliesDo no know
2530101711910
19%22%7%13%89%7%
12%14%5%8%
57%5%
Health services fro» the health centres
Every Khum has its own health centre with one or more nurses, midwivesand/or "healers" who received a professional education from several weeksto several years. Below an overview is given.
Table 39: Health centres and health personnel in the survey area
* matrones are village midwives with a lot of experience and a short formaltraining
37
DRAFT 1987-06-03/dv
Prom the records in the health centres, data were obtained on thenumber of patients visiting the centres during the past three years.The following tables summarize the number of cases of important waterand sanitation-related diseases treated in the centres.
Table 40: Number of cases of unspecified diarrhoea and dysenterytreated in the health centres covering the seven villages(N=19618 for 1984; N=22366 for 1985 and 1986)
Village
Prey MoulKap KongKmutCharPrey SamporBakouPrey Kei
Total
Table 41:
Village
Prey MoulKap KongKmutCharPrey SamporBakouPrey Kei
Total
Diarrhoe1984
32759896-350475811
2657(14%)
Number of <
1985
20961180312349237910
2708(12%)
rases of
1986*
36312091393993493591156
3974(18%)
eye andhealth centres covering the1984; N=22366 for 1985 and
Eye diseases1984
500275260-450480120
2085(11%)
1985
31419422456363470138
1759(8%)
1986*
211242146127174
1058424
2382(11%)
Dysentery1984
43227372-18732725
1181(6%)
skin diseases
1985
33291302331709622
947(4%)
treated
1986*
64369333519227583
1053(5%)
in theseven villages (N=19618 for1986)
Skin1984
801289311-650847538
3434(18%)
disease1985
613448219123581526579
3089(14%)
1986*
249262-217208978409
2323(10%)
* 1986 covers January to September
38
IIIIIIIIIIIIIIIIIIIII
IIIIIIIIIIIIIIIIIIIIi
DRAFT 1987-06-03/dv
Table 42:
Village
Number of cases of worm diseases and denguehealth centres covering the seven villages1984; N=22366 for 1985 and 1986)
Diarrhoea is generally perceived as being an important health problemin the villages. As such the prevention of diarrhoea might prove to bean important motivating force in the hygiene education programme.However, it should be realized that the relation between faeces anddiarrhoea is sometimes unknown, sometimes partially known. This doesnot imply that we would suggest to focus the hygiene educationprogramme on increasing people's knowledge of disease transmission.Instead it is suggested that in discussing possible preventivemeasures the possible benefits should be part of the discussion.
The available data from the health centres show that not onlydiarrhoeas are common diseases, but also eye, skin and worm diseases.Further investigation will be needed to get a deeper understanding towhat extent more frequent bathing will help to prevent eye and skindiseases. (For the moment we assume that the problem cannot be solvedby more frequent bathing as the respondents indicated to bath alreadyvery often).
The data from the health centres do not provide sufficient indicationabout seasonal differences in the incidence of diarrhoea. Therefore,the opinion of the respondents cannot be checked against the officialrecords. With the information we have so far, it might be moreeffective to discuss the problem of diarrhoea in the dry season asmost respondents indicated the problem being more serious during thisseason.
The number of patients visiting the health centres indicate that quitea number of people seek official medical help. This is confirmed bythe answers of the parents when asked what they would do when theirchild suffers from diarrhoea. This may lead to the tentativeconclusion of a positive attitude to the services provided by thehealth centres. When we add to this the number of cases of water andsanitation related diseases treated in the health centres and theoverall availability of health personnel, the present health workersmight become important preventive health motivators in the futurehygiene education programme. However this would increase their workload, for which compensation would be required.
39
I
IIIIIIIIIIIIIIIIIIIII
Annex 1
UNITED NATIONS CHILDREN'S FUND WMfl FONDS DES NATIONS UNIES POUR L'ENFANCE
ENQUETE DE BASE
Questionnaire: Chef de Village Numero:Date de la Visite:
Donnees genérales du village
1. Noai de 1 a provi nee;2. Norn du Khum:3. Nont du Phums4. Nombre d "habitants;
Date du recensement:.................... -.Nombre d ' hommes: ................... Nombre des fenimes: ....
5. Nombre de families;Date du recensement;
¿>. La distance à pied entre le centre du village et 1 ecole:
7. La distance a pied entre le centre du village et i ínfirmerie:
Situation actuei le en ce qui concerne 1 alimentation en eau
8. D'ou provi ent 1 'eau útil i see par les villageois?
En sai son de pluie:O eau de pluie:O pui ts, nombre: -O mare , nombre: , ,O canalO rivièreO „
En sai son sèche:O eau de pluieO puits, nombre:..O mare, nombre:...O canalO
UNITED NATIONS CHILDREN'S FUND WE FONOS OES NATIONS UNIES POUR L'ENFANCE
9. Y—a—t~il des problèmes concernant 1 'al imentation en eau duvillage?
O quanti té: (specifier )O qual i té: (specifies)O distance à parcourir: (spécifiez)O - -
10- Les différents points d'eau du village sont-ils útil isées àdes usages différents? (Par example: pour i eau de boisson/de bain/de bétai1)?
O non J
O oui T rãison:
11. Y—a—t—il des règlements, des limitations ou d'autres |
dispositions concernant 1'usage des points d'eau et leur
maintenance? tm
12. Est-ce que les víllageois considèrent 1'eau dune provenance •(par exemplei eau de pluie/mare/rivière/puits) plus saineque 1'eau d'une autre provenance?
. /3
IO n onO oui, 1 'eau de ......................est consideré pi us sai ne _
que 1 'eau de....................raison: •
O je ne sais pas
AssainÍ55ewent et situation sanitaire du village •
13. Ou les villageois jettent-ils les ordures do/nest i quês?O dans la cour près de la maison |O dans des fosses domestiquesO brulées ^O compostées •O •
Y—a-t—il des problèmes (par exemple des rats)? I
III
III
UNITED NATIONS CHILDREN'S FUND fSSBS FONOS DES NATIONS UNIES POUR L'ENFANCE
- 4 -
18. Y-a-t—il (aus5i) des latrinef publiques ou des latrinescol leeti ves?
o ouiO nonO je ne sais pas
Í9. Les utilisateurs de latrines publiques e*t de latrinesfamíliales éprouvent-ils des problèmes?
2O. Peut-on d'habitude acheter du savon à une distanceraisonnable?
0 non , r ai son:oui
IIO a 1 école
O à 1'Intirmerie _O pour une groupe de -families I
Peut-on s'y 1 aver les mains?
K.) nonO oui T des problèmes de 0 propeté
O odeurs désagréablesO mouchesO effondrements0 I
O je ne sais pas •
IIII
II
A un prix abordable?O non •O oui pour toutes les -familiesO oui seulement pour quelques f ami 11 es (spéci + ier)
21. Quels sont les problémes principaux concernant la santé auvi 11 age? •
•'» I
III
• UNITED NATIONS CHILDREN'S FUND f S B F0NDS DES NATI0NS UNIES P0UR L'ENFANCE
I
IIIIIII
IIIIIII
14. Y~a—t-il dans le village desendroits ou I eau restestagnante?
0 nor»O oui , mente en sai son sèche? O non
O oui
A-t-on essayé de drainer cette eau stagnante:
15. Y—a—t —i 1 dans le village des cours des maisons qui sontparfois inondés?
O non J
O oui, raison; O par la pluieO par la fleuve
ló. Qu les villageois vont-ils déféquer le plus souvant?
O en bordure de la caur:O dans la rizièreO . au>: champsO dans les latrineso
17- Combien le village compte—t-iI de latrines familiales?
• O estimation actuei leO recensement effectué le:...
De quel type sont les latrines?
O tosses ordinaireç
. /A
UNITED NATIONS CHILDREN'S FUND FONDS DES NATIONS UNIES POUR L'ENFANCE
IIIIIIIIIIIIIIIIII
22. Dans votre village, est-ce qu'i 1 y a:- un activaste sanitaire? O* non
O ou i- une raatrone (accoucheuse traditionelle)? O non
O ou i- un membre de 1'Association des Femmes? O non
O ou i
Moyens de subsistance du village
23. Quelles activités agricoles ont lieu au village tout au longde 1 'année?
O culture du riz une -fois par ânO culture du riz.deux fois par anO . . .........-.........,....-.........-----.-..-.. - . -
24. Est—ce que les villageois cultivent des fruits et deslegumes en sai son des pluies?
O non , rai son:
O oui . Dans quel but?:
Et en sai son seche?
0 non , r ai son: ,....
oui . Dans quel but?; -
25. Y a—t—il d'autres activités économiques au village?
O artisanat:O réparateur:O peti te entrepri se:O
./ó
UNITED NATIONS CHILDREN'S FUND t l U FONDS DES NATIONS UNIES POUR L'ENFANCE
6
2ó- Avez"vous des remar ques s££c i a1 es?
Merci beaucoup de prendre le temps de repondré á toutes ees |questions.
IRemarques de 1 'enqueteur/enquetrice: -
i:::::::::::;:::::::::::;::;;::::::::::::;::;;::::::::::::::: I
iiiiiiiiiiii
Annex 2
uNITEO NATIONS CHILDREN'S FUND f | | p FONDS DES NATIONS UNIES POUR L'ENFANCE
IIIIIIIIIIIIII
ENQUETE DE BASE
Questionnaire : Families Numero:Date de la visito:
Nora de la province :Nom du Srok:Worn du Khum:........Nom du Phum:Nom de la -f ami lie:..
Données de la famille:
í. Combien y—a-t-il de personnes dans votre í-emi 11 e (ménaqe)'
Memores de la -families Sexe Age## Ecoleíttt1.2.3.4.5.6.7.S.
Note: # Entourer la personne enquetée## Seulement pour les enfants
Maladies
2. Est-ce que dans votre famille, une ou plusieurs personnes ontéfcé malades durant les deux dernières semaines?
Personne malade Mal adíe
UNITED NATIONS CHILDREN'S FUND f S » FONDS DES NATIONS UNIES POUR L'ENFANCE
4- A quelle saison est-ce que les diarrhées ae manifestent leplus souvent?
O sai son des pluies: (speci f lez)sai son sèche: (spec if iez)
O autrement: .
5. Que faites-vous quand votre enfant a la diarrhée ?
O remede de bonne femraeO medi caments: (spéc i f i e¿ )0 abstention de liquide et d'aliments0 seis de réhydration (ORS>O al ler a 1 ' In-f irmerieO al 1er au guérisseur localo
IIII
3- Quelles sont les maladies les plus frequentes dans votrevillage?
O diarrhéee •O dysenterie0 vers/parasytes •O rougeole IO maladie des yeuxO mal adie de peau —O dengue IO fiévre—hémorragique *O
IIIIIIIIIIIII
ò. Ou allez-vous chercher 1 "eau de boisson en sai son des pluí esPour quelles raisons? A quelle distance de votre maison?
(Posez les memes questions au sujet des autres utilisationsde 1'eau. Notes les réponses sur le tableau ci-dessous)
| UNITED NATIONS CHILDREN'S FUND
IChoix des points d'eau
IIIIIIIIII
FONDS DES NATIONS UNIES POUR L'ENFANCE
Choix despoints d'eauen saisondes pluies
eau de pluie
puits ordinaire
mare
canal
riviere
son
bois
type
ine
cuis
ive
less
d•usage
1 ; **
03 ^
bain
boeu
abrei
| c
n
boeu
ss• pca-w•O
raison
<3a coul<
<utífíí
hygi<
quant
•hábil
distanceà piedtí Io 1m • d)
-H ! •a
Ajouts:
IIIII
UNITED NATIONS CHILDREN'S FUND FONDS DES NATIONS UNIES POUR L'ENFANCE
- 4 -
(Posez les «nemes questions pour la sai son séche)
Choix despoints d'eauen saisonsèche
eau de pluie
puits ordinaire
mare
canal
riviere
boisson
type
cuisine
lessive
j
i
;
d'usagebain
i
i
j
i
|
m >0 0)
11 boeufs/bain
distance
raison
goüt
couleur
hygiene
i
t
j!•
quantité
•habitude
distanceà pied
à la mais
nombre de
metres
Ajouts:
Pui sage et stockaqe de 1 *eau
S. Qui va chercher 1 ' eau. dans votre f ami lie le plus souvent'1
O la mere
O le père0 1 a -f i 11 eO le garçonO
9. Buel recipient utilisen-vous pour transporter i eau?
O deux seaux avec itn joug
O pot
O
IIIIIIIIIIIIIIIIIIIII
I UNITED NATIONS CHILDREN'S FUND Wg$ PONDS DES NATIONS UNIES POUR L'ENFANCE
IIIIIIIIIIIIIIIIII
10. Comment transportez vous 1'eau?
O A piedO à bicycletteO en charrette
11- Comment gardez—vous 1'eau a la maison?
O jarre nombre: (observei>type de couvercle: (observez )
O pot nombre: (observe; >emplacement: (observei >type de couvercle: (observez)
Est-ce qu'i 1 y a un recipient particulier pour I eau á boi re?
O nonO oui
12- (Demandes a la personne enquetée de vous montrer comment etavetz quel ustensile elle prends 1 'eau à boi re? Observez ou setrouve 1'ustensile et si ses doigts touchent I'eau).
O 1'ustensile se trouve dans I'eau de la jarre0 1 'ustensile se trouve -,.,,.,..„O oui, les doigts touchent 1'eau0 non, les doigts ne touchent pas I'eau
14. (Pour les -families qui ont une jarre)Nettayez-vaus la jarre dans 1aquelle vous gardes I 'eau?
O nonO oui , comment?:
combien de fois?: par semaine: par n-vo
Propreté corporelle
15. Quand vous lavez—vous les mains?
O avant les repasO avant de préparer de la nourritureO après defecationO après avoir nettoyé les fesses du bebeO en allant chercher de 1 eau
II
UNITED NATIONS CHILDREN'S FUND ffflfr FONOS DES NATIONS UNIES POUR L'ENFANCE
II
Avec quoi vous lavez-vous les mains?
O seulement avec de 1'eauO avec de 1'eau et du savonO autre: avec
18. <Quand il y a un bebé)Ou baignez-vous le bebé?
O a l a mai sonO au point d*eau
Plusieurs Une fois -...(""'i p<--fois par jour par jour semaine
1 esles hommes: .les enfants:le bebé:
IIOu VDUS lavez-vous les mains et que -faites-vous de 1 'eau
aprés? _
".'."'.I'.'.'/.'.'.'.'.'.'.'.'. IZIIIIIIIIIIIIIIZZZZZIZZZIIIIIIIIZIZIZIZZZI •16. Vous m 'avez di t que vous uti 1 isez 1 'eau de I
pour vous baigner. Est—ce que vous vous faaignez à cet endroit Ila, ou transportez-vous 1'eau 4 la maison?
0 à cet endroit là O dans/au bord du point d eau IO a quelques metres de distance
O à la maison: (specifier) _
17. Et les autres membres de votre fami lie?
II
19. Combien de fois on se baigne-t-on dans votre -famille? I
III20. Est—ce qu'on se baigne plus ou moins en saison des pluies qu'
en saison sèche?
O plus en saison des pluies •O plus en saison sèche I
. il
III
UNITED NATIONS CHILDREN'S FUND Wm FONDS DES NATIONS UNIES POUR L'ENFANCE
I
III
- 7 -
Lessive
21 - Vous m' av&z, di t que vaus uti 1 isez 1 'eau de ..................pour faire la lessive. Est-ce que vous faites la lessive àcet endroit la, ou transportez-vous 1 eau a la maison?
O à cet endroit là O dans/au bord du point d'eauO à quelques metres de distance
U à la maison <speci-fiez>
22. Avec quoi faites—vous la lessive?
O seulement avec de 1'eauO avec de 1'eau et du savonO autre: avec
23. Ou jetez-vous 1"eau sale après la lessive?
Evacuation des selles
24. Ou allez-vous déféquer le plus souvent?
O en bordure de. la courO dans la riviereO aux champsO dans des latrines (continuez avec la question 24)
Couvrez—vous le selles?
O non
O oui
25. Ou déféquent les bebés?
O à Xa roaison/près de la maisonO en bordure de la courO
UNITED NATIONS CHILDREN'S FUND W f W FONOS DES NATIONS UNIES POUR L'ENFANCE
I- a -
Que faites-an des selles?
II
Nettoyez—vaus les fesses du bebé après qu'i 1 ait dé+équé? •
II
20- Ou déféquent les jeunes enfants (1 à 3 ans)?
O non0 oui, avec: 0 de 1'eau
O avec des feuillesO avec de 1'herbéQue faites—vous de cela:
O A la maison/près de la maisonO en bordure de la courO
Que -fait-on des selles?
Avec quoi?
O de 1'eauO des feuillesO de 1'herbéO
Que faites—vous de cela?
II
Qui nettoie les -fesses des jeunes enfants?
O la mere/le pere |O le frere/la soeurO lui—meme m
° I
IIIIIII
IIIIIIIIIIIIIIII11
UNITED NATIONS CHILDREN'S FUND « g U FONDS DES NATIONS UNIES POUR L'ENFANCE
- 9 -
27. Quels moyens utilisent les autres membres dans votre fsmillepour se nettoyer après avoir defequé?
O de 1'eauO des feuillesO de 1 herbéO
28. Que font-ils de cela?
(Si la -f amille dispose d'une latrine, continues avec la íiched'observation sur les latrines et après ãwec la question 33)
29. Avez—vous déjà utilise une latrine?
O non
O oui •
30. Pensez—vous une latrine est utile?
O nonO oui , pourquoi?:31. fivez-vous eu 1-'intention de construiré une latrine vous-meme?
O non (continuer avec question 33)O oui
32. Quels sont les problèmes pour construiré une latrine?
O la technique de construction est inconnueO la structure du sol est mauvaiseO il manque les cnateriauxO il manque les personnes pour creuser une fosseO
./1O
UNITED NATIONS CHILDREN'S FUND f l | i FONDS DES NATIONS UNIES POUR L'ENFANCE
O non (cDntinuez avec la question 3ó)O ou iO je ne sais pas (continuez awa la question 3ó)
O diarrhée, dysenterie, choleraO ver sO maladies de peauO maladies des yeu>;O
O bruléesO enterréesO déversées dans une -fosse sur le terrainO
(Observez aussi).
37. Aves—vaus des cochons?
O non
O oui . Ou 1 es (netted vousí . . . . . . . . . . . . . . .
. /1O
IIIII- 10 -
Connaissance des maladies
I3. Pensez— vous que les selles peuvent entrainer des maladies?
I34. Quelles maladies? I
III
35. Comment les selles peuvent-ils transmettre des maladies?
0 1'eau saleO le manque d'hygiene alimentaireO le manque d'hygiene corporelleO le manque de latrines •O les mouches •O
Propçeté des environs I
3ó. Comment vous débarrassez-vous des ordures?
III
Que faites vous a-vea les excrements? O du compost m
" IIII
11
IIII1II11III11I
UNITED NATIONS CHILDREN'S FUND WSS FONDS DES NATIONS UNIES POUR L'ENFANCE
- li -
38. Avez-vous des boeufs?
O nonO o u i . u 1es mettez v o u s : . . . . . . . . . . . . . . . . . . . . . . . . . . . . . . .
ue -faites vous avec les excrements O du compostO ,
39. ftvez—vous des ponies?
40. Avez—vous des remarques speciales?
Merei beaucoup de prendre le temps de repondré a toutes eesquestions.
Observations
41. Observations sur la maison:
O maison en pai lieO maison en boia (elevee)O maison pilotéO maison a terreO toit en paille0 toit en tuileO toit en tole0 _...*
42. Observations sur le potager
O palmíersO bananiersO autres íruits: „O 1 éguraes:
4o.. Remarques de 1 'enqueteur/enquetri ce
•
III
m Annex 3
I• Enquête de base Numero:
Fishe d'observation et questionnaire: latrines Date de la visite
' (Si la famille dispose d'une latrine utilisée, visitez-la et notezci-dessous vos observations.)
I1. Norn de la faraille:
B 2. Type de latrine:
0 fosse ordinaire
• 0 ..,,. (Décrivez le type et la propreté. Ensuite, continue?avec la question: 8)
IIII
5. Dans quel êtat sont les laurs, le toit et la porte?
I • ;•;:
M 6. Froprete de la" dalle et du sol?
0 propres
3, Y a-t-il une dalle couvrant la fosse?
0 non
0 oui- Dans quel état est-elle?
A. Y a-t-il un couvercle?
0 non
0 oui
0 raalpropres (specif iez)
_ 7. Fropreté de la porte et des parois intéríeures?
f 0 propres
0 raalpropres (specifíez)
8. Y a-t-il de quoi se lave les mains?
• 0 non
0 oui. De quelle maniere?
I 9- Y a-t-il du savon ou autre produit de substituLion?
0 non
0 oui
O difficulté's de nettoyage
0 les petites enfants ont peur d'utíliser la latrine
0 difficultés d'entretien
0
III10. Propreté des environs:
0 propre I
0 malpropre (specif iez)
11. La position de la latrine: *
metres loin de la maison" «
metres loin du puits (si applicable) |
12. Autres remarques •
(Posez les questions suivantes â la personne enquêtee:)
13. Quels avantages eprouvez-vous en utilisant la-< latrine?
0 intimite m
0 à l'abri de la pluie I
0 raisons d'hygiene _
o •••••• •• I
14. Quels problèmes éprouvez-vous en utilisant la latrine? I
0 odeur
0 petite et noire •
IIIIIIII
H)
Annex 4
Enquête de base
Fishe d'information: Infirmerie
Numero:
Date de la visite
1. Norn de la province:
2. Norn du Srok:
3. Nom du Khum:
4. Nombre des villages dans le Khum:
5. Nombre des habitants dans le Khum:
6. Nombre des cas de principales maladies d'apres les statistiques de1'infirmerie:
diarrhée
dysenterie
vers/parasites
rougeole
maladie des yeux
maladie de peau
malaria
fièvre-hémorragique
1984
J-D
1985
J-D
1986
J F M A M J J A S 0
1: Nombre des cas de décès d'apres les statistiquey de 1'infirmerie.
diarrhée
rougeole
1984
J-D
1985
J-D
1986
J F M A M J J A S 0
i
8, Personnel de I1infirmerie:
Nombre d'infirmiers/mières:
Nombre de sages fcumies: ...
Nombre de guérisseurs: ....
II1IIIIIIIIII1IIIIIII
Annex 5
Instructions pour 1'execution de l'échantillonnage
Dans chaqué village, 30 manages seront interviewés. Ces ménagesdoivent être choisis au hasard en utilisant la procedure suivante:
1. Numérotez tous les manages du village;
2. Divisez le nombre de manages dans le village par 30 (par exemple8A divisé par 30 font 2,8);
3. Arrondissez si cela est nécessaire (dans notre example 2,8 estarrondi à 3; cela signifie qu'un ménage sur trois sera visité);
4. Décidez par quel ménage (numero 1, 2 ou 3) vous commencerez. Pourcela tirez un nombre au hasard et commencez les visites par leménage portant ce nombre (par exemple, si nous tirons le nombre2, les ménages numérotés 2, 5, 8, etc. devront être visites);
5. Si les calculs ci-dessus donnent moins de 30 ménages, divisez lenombre total de ménages par la difference (dans notre exemple, sinous visitons un ménage sur trois nous n'en visiterons que 28 aulieu de 30; la difference est 2; divisions 84 par 2, ce qui donne42; le premier des deux ménages restant à être visité portera lenumero 42 :2 = 21 et le deuxième portera 21 + 42 = 63; dans notreexemple nous devrons done visiter les ménages numérotés comraesuit: 2, 5, 8, 11, 14, 17, 20, 21, 23, 26, etc.).
II1I1III1IIIIIIIIIIII
DRAFT 1987-06-03/dv
Annex 6
Summary overview of water source selection for human consumption
Table A Overview water sources used for human consumption in therainy season (N=208)
Village
Prey HoulKap KongKmutCharPrey SamporBakouPrey Kei
Total
rain
28281610222523
152 (73%)
well
11172417014
74
Water Source
pond
5601204
(36%) 18 (9%)
canal
0110000
2 (1%)
river
00005120
17 (8%)
Table B Overview water sources used for human consumption in thedry season (N=208)