122
2016 IMD World Talent Report By the IMD World Competitiveness Center

2016IMD World Talent ReportBy the IMD World Competitiveness Center

IMD World Talent Report 2016
November 2016IMD World Talent Report 2016
Copyright© 2016 by IMDInstitute for Management DevelopmentCh. de Bellerive 23P.O. Box 915CH-1001 LausanneSwitzerland
For further information, please contact the IMD World Competitiveness Center
Tel : +41 21 618 02 51Fax : +41 21 618 02 04
e-mail : [email protected]: www.imd.org/wcceShop: www.wcceshop.org
The IMD World Competitiveness Center team:
At IMD Professor Arturo Bris Director of IMD World Competitiveness Center Christos Cabolis Chief Economist & Head of Operations José Caballero Senior Economist Maëlle Desard Marketing Specialist Fabian Grimm Research Assistant Madeleine Hediger Data Research and Online Services Specialist Catherine Jobin Order and Sales administrator Luchia Mallet Programs and Client Relationship Manager William Milner Information Researcher Lu Wang Research Specialist
with the collaboration of IMD’s Information Center and Information Systems Department
At KAESCO Jean-François KaeserConsulting
We also have the privilege of collaborating with a unique network of Partner Institutes, and other organizations, which guarantees the relevance of the data gathered.

IMD World Talent Report 2016
1
Contents
Rankings 3
IMD World Talent Ranking 2016 4
Factor 1: Investment and Development 2016 5
Factor 2: Appeal 2016 6
Factor 3: Readiness 2016 7
IMD World Talent 2015-2016 Evolution 9
IMD World Talent Ranking 2016 Leaderboard 11
IMD World Talent Rankings 2007 - 2016 12
Analysis: Talent Competitiveness and the Quality of Leadership 15
Profiles 23
Criteria 85
Factor 1: Investment and Development 2016 86
Factor 2: Appeal 2016 91
Factor 3: Readiness 2016 98
Methodology 105
Appendix 109
Notes and Sources 110
Partner Institutes 115
Co
nten
ts

IMD World Talent Report 2016
2

IMD World Talent Report 2016
3
Ran
kin
gs

IMD World Talent Report 2016
4
1 Switzerland - 100.0
2 Denmark - 90.7
3 Belgium +6 85.8
4 Sweden +7 84.6
5 Netherlands - 82.8
6 Finland - 82.5
7 Norway -3 82.5
8 Austria +11 82.5
9 Luxembourg -6 81.7
10 China Hong Kong +2 81.4
11 Germany -4 80.8
12 Canada -4 79.9
13 New Zealand +5 79.7
14 USA - 79.3
15 Singapore -5 78.8
16 Iceland +1 77.8
17 Australia -4 77.6
18 Ireland -2 77.5
19 Malaysia -4 72.7
20 United Kingdom +1 71.9
21 Israel +1 71.7
22 Portugal +3 70.0
23 Estonia +10 69.6
24 Taiwan -1 69.3
25 Lithuania -1 68.7
26 UAE -6 68.6
27 Qatar +2 68.5
28 France -1 67.8
29 Poland +3 67.2
30 Japan -4 65.5
31 Czech Republic -1 65.0
32 Spain +7 63.3
33 Latvia -5 63.1
34 Italy +8 62.9
35 Slovenia +3 62.3
36 Greece -1 61.5
37 Thailand -3 60.4
38 Korea Rep. -7 59.6
39 Slovak Republic +8 57.5
40 Jordan -3 56.8
41 Russia +4 55.5
42 South Africa +9 54.5
43 China Mainland -3 53.8
44 Indonesia -3 52.8
45 Brazil +12 52.8
46 Turkey - 52.2
47 Chile -4 51.9
48 Kazakhstan -12 51.7
49 Ukraine +6 50.2
50 Hungary +6 50.1
51 Philippines -7 50.0
52 Romania -4 48.7
53 Croatia +5 48.7
54 Colombia -4 48.6
55 Argentina -2 47.7
56 Mexico -7 47.6
57 Bulgaria +4 45.0
58 Mongolia -4 44.5
59 Peru - 43.6
60 India -8 42.8
61 Venezuela -1 38.2
IMD World Talent Ranking 2016
The IMD World Talent Ranking 2016 shows the overall ranking for 61 economies. The economies are ranked from the most to the least competitive, and the change from the previous year’s ranking are also shown. The scores are actually indices (0-100) generated for the unique purpose of constructing graphics.
IMD World Talent Report 2016
5
1 Switzerland - 100.0
2 Denmark - 90.7
3 Belgium +6 85.8
4 Sweden +7 84.6
5 Netherlands - 82.8
6 Finland - 82.5
7 Norway -3 82.5
8 Austria +11 82.5
9 Luxembourg -6 81.7
10 China Hong Kong +2 81.4
11 Germany -4 80.8
12 Canada -4 79.9
13 New Zealand +5 79.7
14 USA - 79.3
15 Singapore -5 78.8
16 Iceland +1 77.8
17 Australia -4 77.6
18 Ireland -2 77.5
19 Malaysia -4 72.7
20 United Kingdom +1 71.9
21 Israel +1 71.7
22 Portugal +3 70.0
23 Estonia +10 69.6
24 Taiwan -1 69.3
25 Lithuania -1 68.7
26 UAE -6 68.6
27 Qatar +2 68.5
28 France -1 67.8
29 Poland +3 67.2
30 Japan -4 65.5
31 Czech Republic -1 65.0
32 Spain +7 63.3
33 Latvia -5 63.1
34 Italy +8 62.9
35 Slovenia +3 62.3
36 Greece -1 61.5
37 Thailand -3 60.4
38 Korea Rep. -7 59.6
39 Slovak Republic +8 57.5
40 Jordan -3 56.8
41 Russia +4 55.5
42 South Africa +9 54.5
43 China Mainland -3 53.8
44 Indonesia -3 52.8
45 Brazil +12 52.8
46 Turkey - 52.2
47 Chile -4 51.9
48 Kazakhstan -12 51.7
49 Ukraine +6 50.2
50 Hungary +6 50.1
51 Philippines -7 50.0
52 Romania -4 48.7
53 Croatia +5 48.7
54 Colombia -4 48.6
55 Argentina -2 47.7
56 Mexico -7 47.6
57 Bulgaria +4 45.0
58 Mongolia -4 44.5
59 Peru - 43.6
60 India -8 42.8
61 Venezuela -1 38.2
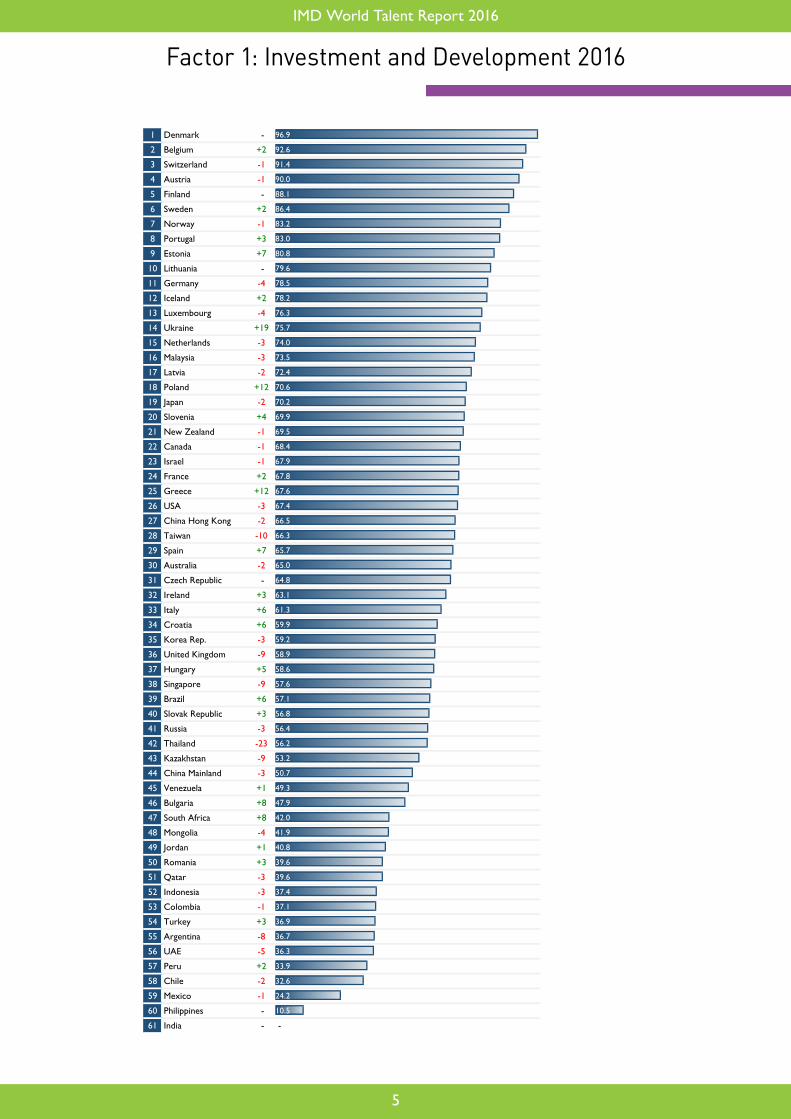
Factor 1: Investment and Development 2016
1 Denmark - 96.9
2 Belgium +2 92.6
3 Switzerland -1 91.4
4 Austria -1 90.0
5 Finland - 88.1
6 Sweden +2 86.4
7 Norway -1 83.2
8 Portugal +3 83.0
9 Estonia +7 80.8
10 Lithuania - 79.6
11 Germany -4 78.5
12 Iceland +2 78.2
13 Luxembourg -4 76.3
14 Ukraine +19 75.7
15 Netherlands -3 74.0
16 Malaysia -3 73.5
17 Latvia -2 72.4
18 Poland +12 70.6
19 Japan -2 70.2
20 Slovenia +4 69.9
21 New Zealand -1 69.5
22 Canada -1 68.4
23 Israel -1 67.9
24 France +2 67.8
25 Greece +12 67.6
26 USA -3 67.4
27 China Hong Kong -2 66.5
28 Taiwan -10 66.3
29 Spain +7 65.7
30 Australia -2 65.0
31 Czech Republic - 64.8
32 Ireland +3 63.1
33 Italy +6 61.3
34 Croatia +6 59.9
35 Korea Rep. -3 59.2
36 United Kingdom -9 58.9
37 Hungary +5 58.6
38 Singapore -9 57.6
39 Brazil +6 57.1
40 Slovak Republic +3 56.8
41 Russia -3 56.4
42 Thailand -23 56.2
43 Kazakhstan -9 53.2
44 China Mainland -3 50.7
45 Venezuela +1 49.3
46 Bulgaria +8 47.9
47 South Africa +8 42.0
48 Mongolia -4 41.9
49 Jordan +1 40.8
50 Romania +3 39.6
51 Qatar -3 39.6
52 Indonesia -3 37.4
53 Colombia -1 37.1
54 Turkey +3 36.9
55 Argentina -8 36.7
56 UAE -5 36.3
57 Peru +2 33.9
58 Chile -2 32.6
59 Mexico -1 24.2
60 Philippines - 10.5
61 India - -

IMD World Talent Report 2016
6
Factor 2: Appeal 2016
1 Switzerland - 100.0
2 USA - 86.8
3 Luxembourg - 81.2
4 Sweden +9 79.2
5 China Hong Kong +5 78.9
6 Ireland +1 78.8
7 Canada -3 78.1
8 Germany -3 78.1
9 Qatar +8 78.0
10 UAE -2 77.6
11 Denmark -2 76.2
12 Netherlands -1 75.4
13 New Zealand +3 74.7
14 Norway -8 74.0
15 Belgium +5 73.5
16 United Kingdom -4 71.3
17 Austria +5 71.3
18 Australia -4 70.7
19 Singapore -1 70.0
20 Iceland +3 68.5
21 Japan -6 67.4
22 Malaysia -3 65.3
23 Finland -2 65.1
24 Thailand +1 64.9
25 Israel -1 64.2
26 Taiwan - 62.8
27 Chile - 62.6
28 Spain +5 62.2
29 South Africa +5 61.9
30 France - 61.5
31 Indonesia -3 59.9
32 Jordan -3 59.1
33 Mexico +3 57.0
34 Czech Republic -3 57.0
35 Philippines - 56.8
36 Estonia +1 56.7
37 Italy +10 56.6
38 Lithuania +1 56.0
39 Colombia +3 56.0
40 Portugal -2 54.4
41 India -1 53.4
42 Peru +7 53.3
43 Korea Rep. -11 53.2
44 Turkey +2 52.4
45 Latvia -4 50.4
46 Poland +6 50.4
47 Slovenia +7 49.9
48 Brazil - 49.0
49 Slovak Republic +4 48.6
50 Greece - 47.1
51 Argentina +5 43.3
52 Romania -8 43.2
53 Russia +2 42.8
54 China Mainland -9 42.7
55 Kazakhstan -12 42.5
56 Mongolia -5 41.0
57 Bulgaria +3 40.2
58 Croatia - 38.7
59 Ukraine -2 36.7
60 Hungary -1 36.7
61 Venezuela - 27.5
IMD World Talent Report 2016
7
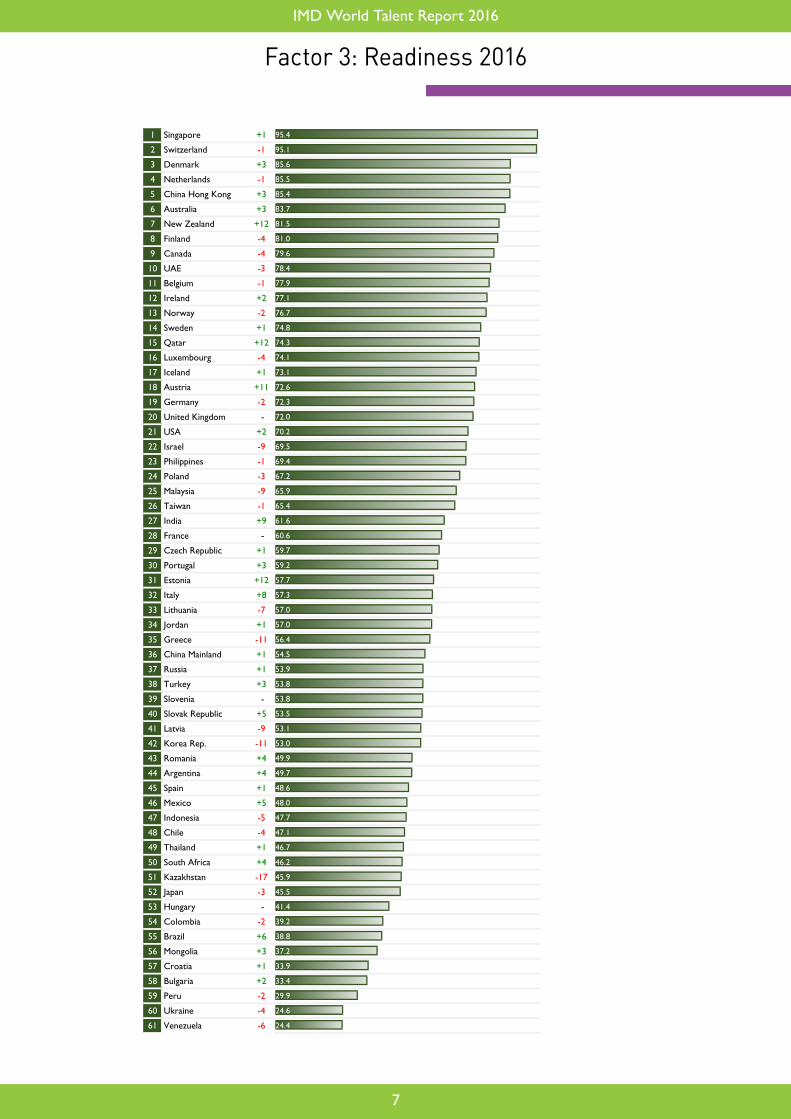
Factor 3: Readiness 2016
1 Switzerland - 100.0
2 USA - 86.8
3 Luxembourg - 81.2
4 Sweden +9 79.2
5 China Hong Kong +5 78.9
6 Ireland +1 78.8
7 Canada -3 78.1
8 Germany -3 78.1
9 Qatar +8 78.0
10 UAE -2 77.6
11 Denmark -2 76.2
12 Netherlands -1 75.4
13 New Zealand +3 74.7
14 Norway -8 74.0
15 Belgium +5 73.5
16 United Kingdom -4 71.3
17 Austria +5 71.3
18 Australia -4 70.7
19 Singapore -1 70.0
20 Iceland +3 68.5
21 Japan -6 67.4
22 Malaysia -3 65.3
23 Finland -2 65.1
24 Thailand +1 64.9
25 Israel -1 64.2
26 Taiwan - 62.8
27 Chile - 62.6
28 Spain +5 62.2
29 South Africa +5 61.9
30 France - 61.5
31 Indonesia -3 59.9
32 Jordan -3 59.1
33 Mexico +3 57.0
34 Czech Republic -3 57.0
35 Philippines - 56.8
36 Estonia +1 56.7
37 Italy +10 56.6
38 Lithuania +1 56.0
39 Colombia +3 56.0
40 Portugal -2 54.4
41 India -1 53.4
42 Peru +7 53.3
43 Korea Rep. -11 53.2
44 Turkey +2 52.4
45 Latvia -4 50.4
46 Poland +6 50.4
47 Slovenia +7 49.9
48 Brazil - 49.0
49 Slovak Republic +4 48.6
50 Greece - 47.1
51 Argentina +5 43.3
52 Romania -8 43.2
53 Russia +2 42.8
54 China Mainland -9 42.7
55 Kazakhstan -12 42.5
56 Mongolia -5 41.0
57 Bulgaria +3 40.2
58 Croatia - 38.7
59 Ukraine -2 36.7
60 Hungary -1 36.7
61 Venezuela - 27.5
1 Singapore +1 95.4
2 Switzerland -1 95.1
3 Denmark +3 85.6
4 Netherlands -1 85.5
5 China Hong Kong +3 85.4
6 Australia +3 83.7
7 New Zealand +12 81.5
8 Finland -4 81.0
9 Canada -4 79.6
10 UAE -3 78.4
11 Belgium -1 77.9
12 Ireland +2 77.1
13 Norway -2 76.7
14 Sweden +1 74.8
15 Qatar +12 74.3
16 Luxembourg -4 74.1
17 Iceland +1 73.1
18 Austria +11 72.6
19 Germany -2 72.3
20 United Kingdom - 72.0
21 USA +2 70.2
22 Israel -9 69.5
23 Philippines -1 69.4
24 Poland -3 67.2
25 Malaysia -9 65.9
26 Taiwan -1 65.4
27 India +9 61.6
28 France - 60.6
29 Czech Republic +1 59.7
30 Portugal +3 59.2
31 Estonia +12 57.7
32 Italy +8 57.3
33 Lithuania -7 57.0
34 Jordan +1 57.0
35 Greece -11 56.4
36 China Mainland +1 54.5
37 Russia +1 53.9
38 Turkey +3 53.8
39 Slovenia - 53.8
40 Slovak Republic +5 53.5
41 Latvia -9 53.1
42 Korea Rep. -11 53.0
43 Romania +4 49.9
44 Argentina +4 49.7
45 Spain +1 48.6
46 Mexico +5 48.0
47 Indonesia -5 47.7
48 Chile -4 47.1
49 Thailand +1 46.7
50 South Africa +4 46.2
51 Kazakhstan -17 45.9
52 Japan -3 45.5
53 Hungary - 41.4
54 Colombia -2 39.2
55 Brazil +6 38.8
56 Mongolia +3 37.2
57 Croatia +1 33.9
58 Bulgaria +2 33.4
59 Peru -2 29.9
60 Ukraine -4 24.6
61 Venezuela -6 24.4

IMD World Talent Report 2016
8
Inve
stm
ent
and
deve
lopm
ent
fact
or
App
eal f
acto
r
Rea
dine
ss fa
ctor
55 51 44 Argentina
30 18 6 Australia
4 17 18 Austria
2 15 11 Belgium
39 48 55 Brazil
46 57 58 Bulgaria
22 7 9 Canada
58 27 48 Chile
27 5 5 China Hong Kong
44 54 36 China Mainland
53 39 54 Colombia
34 58 57 Croatia
31 34 29 Czech Republic
1 11 3 Denmark
9 36 31 Estonia
5 23 8 Finland
24 30 28 France
11 8 19 Germany
25 50 35 Greece
37 60 53 Hungary
12 20 17 Iceland
61 41 27 India
52 31 47 Indonesia
32 6 12 Ireland
23 25 22 Israel
33 37 32 Italy
19 21 52 Japan
49 32 34 Jordan
43 55 51 Kazakhstan
35 43 42 Korea Rep.
17 45 41 Latvia
10 38 33 Lithuania
13 3 16 Luxembourg
16 22 25 Malaysia
59 33 46 Mexico
48 56 56 Mongolia
15 12 4 Netherlands
21 13 7 New Zealand
7 14 13 Norway
57 42 59 Peru
60 35 23 Philippines
18 46 24 Poland
8 40 30 Portugal
51 9 15 Qatar
50 52 43 Romania
41 53 37 Russia
38 19 1 Singapore
40 49 40 Slovak Republic
20 47 39 Slovenia
47 29 50 South Africa
29 28 45 Spain
6 4 14 Sweden
3 1 2 Switzerland
28 26 26 Taiwan
42 24 49 Thailand
54 44 38 Turkey
56 10 10 UAE
14 59 60 Ukraine
36 16 20 United Kingdom
26 2 21 USA
45 61 61 Venezuela
2016
IMD World Talent Factor Rankings 2016
lowest, medium, & best Factor ranks

IMD World Talent Report 2016
9
2016 Country 2015Change from 2015
2016 Country 2015Change from 2015
1 Switzerland 1 - → 32 Spain 39 +7 ↗2 Denmark 2 - → 33 Latvia 28 -5 ↘3 Belgium 9 +6 ↗ 34 Italy 42 +8 ↗4 Sweden 11 +7 ↗ 35 Slovenia 38 +3 ↗5 Netherlands 5 - → 36 Greece 35 -1 ↘6 Finland 6 - → 37 Thailand 34 -3 ↘7 Norway 4 -3 ↘ 38 Korea Rep. 31 -7 ↘8 Austria 19 +11 ↗ 39 Slovak Republic 47 +8 ↗9 Luxembourg 3 -6 ↘ 40 Jordan 37 -3 ↘10 China Hong Kong 12 +2 ↗ 41 Russia 45 +4 ↗11 Germany 7 -4 ↘ 42 South Africa 51 +9 ↗12 Canada 8 -4 ↘ 43 China Mainland 40 -3 ↘13 New Zealand 18 +5 ↗ 44 Indonesia 41 -3 ↘14 USA 14 - → 45 Brazil 57 +12 ↗15 Singapore 10 -5 ↘ 46 Turkey 46 - →16 Iceland 17 +1 ↗ 47 Chile 43 -4 ↘17 Australia 13 -4 ↘ 48 Kazakhstan 36 -12 ↘18 Ireland 16 -2 ↘ 49 Ukraine 55 +6 ↗19 Malaysia 15 -4 ↘ 50 Hungary 56 +6 ↗20 United Kingdom 21 +1 ↗ 51 Philippines 44 -7 ↘21 Israel 22 +1 ↗ 52 Romania 48 -4 ↘22 Portugal 25 +3 ↗ 53 Croatia 58 +5 ↗23 Estonia 33 +10 ↗ 54 Colombia 50 -4 ↘24 Taiwan 23 -1 ↘ 55 Argentina 53 -2 ↘25 Lithuania 24 -1 ↘ 56 Mexico 49 -7 ↘26 UAE 20 -6 ↘ 57 Bulgaria 61 +4 ↗27 Qatar 29 +2 ↗ 58 Mongolia 54 -4 ↘28 France 27 -1 ↘ 59 Peru 59 - →29 Poland 32 +3 ↗ 60 India 52 -8 ↘30 Japan 26 -4 ↘ 61 Venezuela 60 -1 ↘31 Czech Republic 30 -1 ↘
The IMD World Talent 2015 - 2016 Evolution
IMD World Talent Report 2016
10
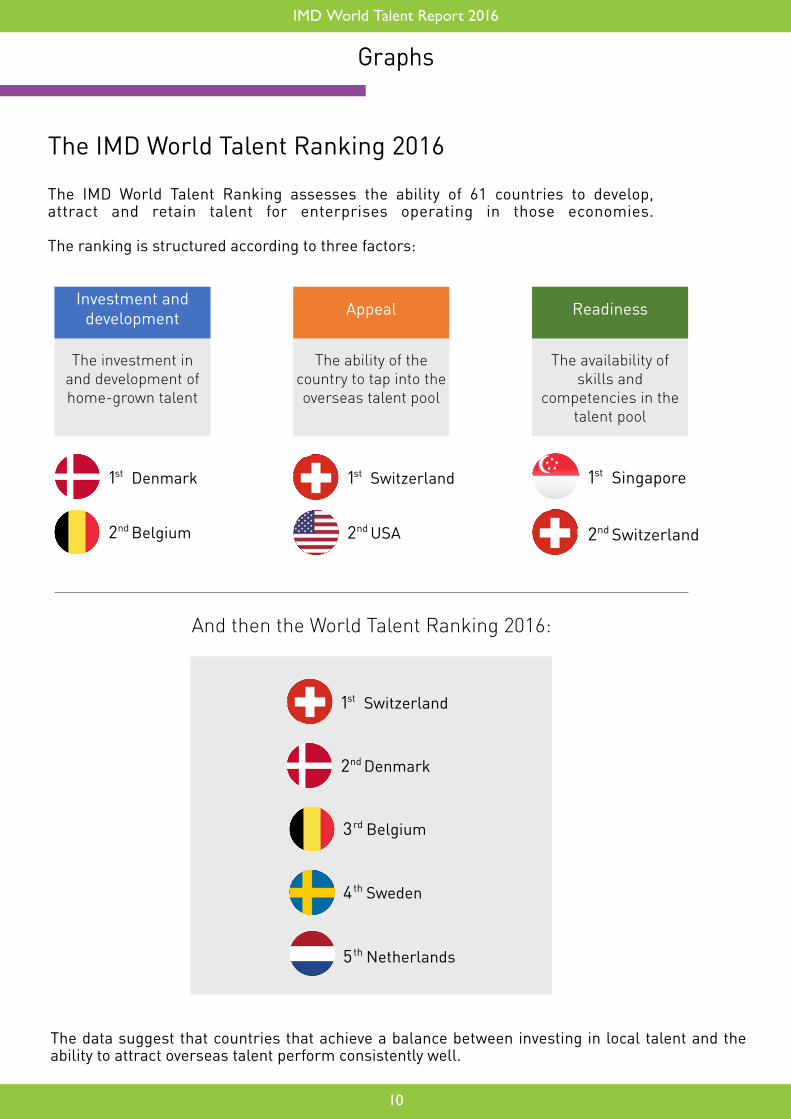
Graphs
The IMD World Talent Ranking 2016 The IMD World Talent Ranking assesses the ability of 61 countries to develop, attract and retain talent for enterprises operating in those economies. The ranking is structured according to three factors:
The data suggest that countries that achieve a balance between investing in local talent and the ability to attract overseas talent perform consistently well.
Investment and development
The investment in and development of home-grown talent
Appeal
The ability of the country to tap into the overseas talent pool
Readiness
The availability of skills and
competencies in the talent pool
1st
2nd
Denmark
Belgium
1st
2nd
Switzerland
USA
1st
2nd
Singapore
Switzerland
And then the World Talent Ranking 2016:
1st
2nd
Switzerland
Denmark
3rd Belgium
4th Sweden
5th Netherlands
IMD World Talent Report 2016
11
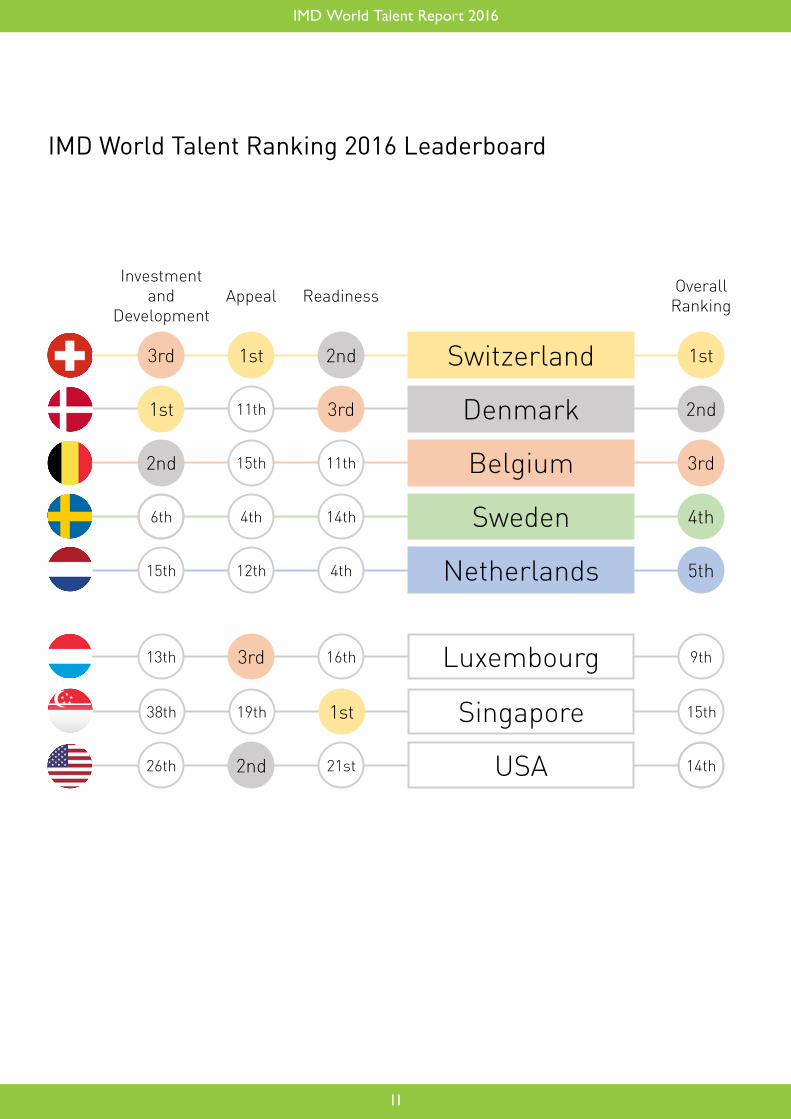
IMD World Talent Ranking 2016 Leaderboard
Switzerland
Denmark
Belgium
Sweden
Netherlands
1st
2nd
3rd
4th
5th
2nd
3rd
11th
14th
4th
1st
11th
15th
4th
12th
3rd
1st
2nd
6th
15th
Investment and
DevelopmentAppeal Readiness Overall
Ranking
Luxembourg 9th16th3rd13th
USA 14th21st2nd26th
Singapore 15th1st19th38th

IMD World Talent Report 2016
12
Belgium
Sweden
Switzerland
Luxembourg
Malaysia
Netherlands
Norway
Singapore
Austria
Canada
Denmark
Finland
Germany
Iceland
1st 1st 1st 1st 1st 1st 1st 1st 1st 1st
2nd
2nd
2nd
2nd 2nd
2nd 2nd 2nd 2nd 2nd
3rd
3rd
3rd
3rd 3rd
3rd 3rd
3rd
3rd
3rd
4
4
4
4
4
4 4 4
4
45 5
5
5
5
5
5
5
5 5
2007 2008 2009 2010 2011 2012 2013 2014 2015 2016
The IMD World Talent Ranking Top 5: 2007 - 2016
The IMD World Talent Ranking 2016 The most talent competitive countries: 2007-2016
Talent competitive countries rank in the top 10 for 5 years or more during the period from 2007 to 2016. They show a balanced approach between their commitment to education, investment in the development of local talent and their ability to attract overseas talent. The talent competitiveness strategies that these countries adopt strive to fulfil the demands of their economies. Talentcompetitive countries thus exhibit a high level of “agility” in the development of policies that impact their talent pipeline.
Austria
Belgium
Canada
Denmark
6 4 9 14 13 11 19 8
9 11 6 18 10 17 9 3
7 10
Norway
Singapore
Sweden
Switzerland
3 4
Finland
Netherlands
15 8
10 6
17 13
12
2 3 2 3 3 2 2 2 2 2
5
13 18
4 8 5 4 4 4 6 6
8 7 5 7 8 7 5 7 5
7
4 2 8 9 17 9 17 16 10 15
3 2 2 3
2013 2014 2015
10 13 10 6 7 10 4
7 5 8 8 8
2016
1 1 1 1
2007 2008 2009 2010 2011 2012
3 9 11 4
1 1 1 1 1 1
5 5

IMD World Talent Report 2016
13
Overall Ranking
Country \ Year 2007 2008 2009 2010 2011 2012 2013 2014 2015 2016
Argentina 41 48 49 44 45 44 53 55 53 55Australia 9 11 11 17 12 20 20 19 13 17Austria 3 4 6 4 9 14 13 11 19 8Belgium 15 8 9 11 6 18 10 17 9 3Brazil 37 31 34 40 47 45 48 52 57 45Bulgaria 51 51 45 58 59 59 60 60 61 57Canada 10 6 7 10 7 5 8 8 8 12Chile 27 27 33 31 26 29 44 44 43 47China Hong Kong 18 17 18 21 20 13 19 21 12 10China Mainland 40 50 50 46 43 50 45 43 40 43Colombia 34 42 55 51 39 56 51 54 50 54Croatia 53 46 53 55 57 57 57 58 58 53Czech Republic 24 28 24 26 25 30 28 37 30 31Denmark 2 3 2 3 3 2 2 2 2 2Estonia 29 25 32 28 30 32 37 30 33 23Finland 17 13 4 8 5 4 4 4 6 6France 23 19 21 20 28 26 26 24 27 28Germany 16 16 12 16 11 10 6 3 7 11Greece 28 36 40 36 44 46 33 42 35 36Hungary 20 26 30 33 38 39 49 51 56 50Iceland --- --- --- 5 4 12 18 14 17 16India 26 33 31 34 29 34 42 48 52 60Indonesia 50 40 41 37 32 42 32 25 41 44Ireland 6 10 13 18 16 8 11 6 16 18Israel 12 15 16 14 15 17 15 18 22 21Italy 43 44 46 42 52 37 43 47 42 34Japan 25 30 23 29 31 41 35 28 26 30Jordan 33 23 44 53 53 36 50 39 37 40Kazakhstan --- --- 35 32 37 28 38 32 36 48Korea Rep. 44 39 38 35 33 33 39 40 31 38Latvia --- --- --- --- --- --- 31 23 28 33Lithuania 32 34 26 25 35 31 22 29 24 25Luxembourg 7 14 17 12 18 15 16 13 3 9Malaysia 14 12 15 6 14 11 9 5 15 19Mexico 49 52 52 54 50 49 40 50 49 56Mongolia --- --- --- --- --- --- --- --- 54 58Netherlands 8 7 5 7 8 7 5 7 5 5New Zealand 19 21 20 22 22 25 25 26 18 13Norway 13 18 10 13 10 6 7 10 4 7Peru --- 45 54 57 56 53 55 57 59 59Philippines 47 41 42 45 46 35 29 41 44 51Poland 45 43 37 30 40 38 30 36 32 29Portugal 30 32 29 39 27 24 34 33 25 22Qatar --- --- 22 27 23 22 24 22 29 27Romania 52 55 56 41 41 55 58 38 48 52Russia 39 53 47 48 55 54 56 53 45 41Singapore 4 2 8 9 17 9 17 16 10 15Slovak Republic 36 38 36 49 51 51 52 46 47 39Slovenia 35 29 28 50 48 43 47 49 38 35South Africa 48 49 51 52 54 52 54 56 51 42Spain 38 37 48 47 36 48 46 45 39 32Sweden 5 5 3 2 2 3 3 9 11 4Switzerland 1 1 1 1 1 1 1 1 1 1Taiwan 21 20 27 19 19 19 23 27 23 24Thailand 31 24 25 24 24 27 27 34 34 37Turkey 46 35 39 43 42 40 36 35 46 46UAE --- --- --- --- 34 23 14 15 20 26Ukraine 42 47 43 38 49 47 41 31 55 49United Kingdom 22 22 19 23 21 21 21 20 21 20USA 11 9 14 15 13 16 12 12 14 14
Venezuela 54 54 57 56 58 58 59 59 60 61
no. countries 54 55 57 58 59 59 60 60 61 61
IMD World Talent Ranking 2007-2016
* The red point indicates the year(s) of lowest rank

IMD World Talent Report 2016
14

IMD World Talent Report 2016
15
An
alysis

IMD World Talent Report 2016
16
Talent Competitiveness and the Quality of Leadership:
Evidence from Global Leadership Capabilities and Competencies
I. Introduction
In this essay, we hold that that government policies may affect private sector outcomes in terms of talentdevelopment.Weproposethatspecificpublicpoliciescanexercisestronginfluenceonthequality of leadership capabilities and competencies available in a particular economy. Policies that increase total expenditure in education, personal security and the protection of private property, as well as the internationalization of the workforce, may determine the supply of high quality business leaders in a country.
In order to assess these interactions, we carry out a series of initial statistical tests to identify which talentcompetitivenessindicators(i.e., input)fromtheIMDWorldTalentReporthaveasignificantstatistical influenceon theGlobalLeadership Index (GLI)and itscomponentsat the factor (i.e.,capabilities) and sub-factor (i.e., competencies) levels.
This essay presents a summary discussion of talent competitiveness and its structure. It then introduces the GLI and its components and goes on to discuss the results of the statistical tests. The essay concludes by highlighting that evidence does indeed indicate that the quality of leadership capabilities and competencies are driven by investment in education and by the diversity of the workforce and its exposure to internationalization factors.
II. Talent competitiveness
Talent is the set of individual competencies necessary for enterprises and the economy to achieve long-term sustainable value. There are two components to talent. 1) “hard” competencies, which are structural and function as enablers of development – for example, investment in the educational system and the quality of education (as measured by pupil-teacher ratios); and 2) “soft” competencies, which are in a sense the outcome of hard competencies and include employees’ motivation and language skills. Talent development requires the effective assessment and planning of human resources, and comprises several essential elements of both hard and soft competencies. These factors go beyond a mere increase in investment and include other elements that boost, for example, the motivation and productivity of the workforce through suitable incentives.
Talent competitiveness is thus the extent to which an economy strikes a balance between hard and soft talent components, which enables it to achieve long-term value creation. Table 1 presents the structure of talent competitiveness. Methodological details and all the corresponding data are presented later in the report.
Table 1. The structure of talent competitiveness

IMD World Talent Report 2016
17
III. Global leadership
The GLI assesses individual global leadership capabilities. It is composed of four leadership capabilities or factors: Strategic, execution, stakeholder and personal. Strategic leadership evaluates the capacity of leaders to define strategic objectives for an organization. Executionleadership is the ability to implement the organization’s strategy in order to achieve specificobjectives.Stakeholder leadershiprefers to thecapacityof individuals toengageotherrelevantplayers to achieve changes in the organization. Finally, personal leadership focuses on individual characteristics that allow leaders, for example, to inspire others. Each of these capabilities is composed of four competencies or sub-factors. Competencies, in turn, are developed through three survey questions that evaluate the respondents’ leadership practices. The “envisioning the future” competency, for example, is assessed by questions that determine the respondents’ contribution to establishing their organization’s shared vision. Similarly, “practicing organizational stewardship” is evaluated by questions that bring stakeholders to the core of leadership practices by, for example, striving for an in-depth understanding of their interests and needs.1 Table 2 introduces the structure of the GLI.
Table 2. The structure of global leadership
GLI data are available for all the countries included in the IMD World Talent Report. The number of survey responses varies per country and in some cases, for example Iceland and Mongolia, there is notasufficientnumberofresponsestobeincludedintheanalysis.Intotal,weused9,775surveyresponses from the GLI database. These were collected during the period from 2014 to 2016. We take an average of individual country responses to bring the GLI data to the same level of analysis (i.e., country) as that of the talent indicators.
1 For methodological details in the development of the GLI overall – factors and sub-factors – see https://global-leader-index.imd.org/help-center/methodology.

IMD World Talent Report 2016
18
IV. Talent competitiveness and the quality of leadership
All significant results are mapped in Tables 3 to 5. The left column of each table lists the different measures of leadership capabilities and competencies. The top row includes the talent competitiveness indicators. An "X" signals a statistically significant relationship between aparticular talent competitiveness indicator and a leadership measure. Each table corresponds to one of the talent competitiveness factors: Investment and development (Table 3), Appeal (Table 4) and Readiness (Table 5)
Florida (2002) argues that highly skilled talent is attracted by the existing level of diversity in the receivingcommunitiesandwefindsomeevidencethatsupportsthisclaim.Weusethepercentageof female labor force as a proxy for workforce diversity. Table 3 shows that an increasing percentage of the female labor force partially drives two leadership capabilities: strategic and stakeholder leadership. Table 3 and 4illustratethatstrategicleadershipisalsohighlyinfluencedbytotalpublicexpenditure on education, the quality of healthcare infrastructure, the prioritization given to the attraction and retention of talent, and the level of remuneration. In addition, Table 5 suggests that strategic leadership is also driven by three indicators of internationalization: the availability of seniormanagerswithinternationalexperience,languageskillsandstudentmobility.Thisfindingis in keeping with the research conclusion of future skilled migration (see Kerr et al., 2016). The drivers of stakeholder leadership also include expenditure on education, remuneration, language skills, student mobility and importantly, high personal security and sound protection of private property.
Table 3. Mapping talent competitiveness and global leadership: Investment and development

IMD World Talent Report 2016
19
Table 4. Mapping talent competitiveness and global leadership: Appeal
Table 5. Mapping talent competitiveness and global leadership: Readiness

IMD World Talent Report 2016
20
With regard to the other two dimensions of leadership capabilities – execution and personal leadership – evidence highlights the fundamental role of expenditure on education for both dimensions. Other drivers of personal leadership capabilities include personal security and protection of private property, and student mobility.
At the GLI competencies level (i.e., sub-factors), health infrastructure, international experience and languageskillsarekeyforcompetenciesrelatingtosettingeffectivestrategicobjectives;thatistheabilitytodefineandremainfocusedonlong-termstrategiesratherthanshort-termresults.In the context of the GLI, driving innovation competencies include the ability to encourage creative thinking and the production of innovative solutions. Evidence shows that innovation competencies are driven by a greater female labor force, remuneration packages (both for services professions and management), student mobility and strong educational achievements (as assessed by PISA).
We find that the quality of a country’s health infrastructure is statistically significant forcompetencies that the GLI sets as being fundamental for communicating and implementing a company’s vision and strategy. There is also evidence that the cost of living, a limited brain drain and an effective tax system contribute to the clarity and execution of the vision and strategy. International mobility also drives these competencies. In the context of execution leadership, in addition, competencies that make it possible to align cross-functionally (e.g., the alignment of strategicobjectivesthroughouttheorganization),areinfluencedbythepercentageofthefemalelabor force, remuneration and the availability of skilled labor.
Themobilizing stakeholders andmanaging conflict (e.g., encouraging constructive discussion)competencies are both driven by expenditure on education, the percentage of female labor force and language skills. In addition, the effectiveness of the health infrastructure, remuneration of management,aneffectivepersonalincometaxrateandstudentmobilityarestatisticallysignificantformobilizingstakeholders.Intermsofmanagingconflict,weidentifyotherdriversincludingthelevel of personal security and the protection of private property as well as the availability of skilled labor,seniormanagerswithsignificantinternationalexperienceandacademicachievements.
With reference to personal leadership, evidence suggests that building team orientation competencies are driven by the female labor force indicators, remuneration, student mobility and education attainment. The percentage of female labor force is also statistically significantfor competencies related to empowering others (e.g., delegation of authority to increase others’ efficiency). The extent of the country’s attractiveness for foreign highly skilled people and theremuneration of management also drive the empowering competencies. Finally, we find thatexposure to internationalization (i.e., student mobility) and level of educational achievements are also fundamental for the empowering people sub-factor.
V. Conclusions
In the context of this study, the evidence shows that the most essential drivers of business leadership capabilities and competencies are indicators related to diversity and internationalization (i.e., international experience, language skills and mobility). Evidence thus suggests that increasing the female labor force leads to the attraction and/or development of effective high quality leadership. In addition, preliminary tests highlight the positive leadership synergies that are achieved by the exposure of the workforce to international experience, language skills and mobility factors (measures we use as proxies for internationalization). The latter offers a strong source of global knowledge, broader experience and understanding of a wider set of best practices.
Tests also show that investment in education and the strength of the country’s health infrastructure positively affect the quality of the available business leadership. Compensation levels are similarly important but seem to play a less important role than investment in education, diversity and internationalization. In short, the evidence shows that the impact of talent competitiveness on high quality leadership results from achieving a fair degree of harmonization between particular “hard” elements of talent (e.g., investment in education) and some of their “soft” counterparts (e.g., language skills). Public policies that ensure alignment between both sets of talent components contribute much to the competitiveness of their economies.

IMD World Talent Report 2016
21
References
Florida, R. (2002). The Economic Geography of Talent. Annals of the Association of American geographers, Vol. 92, Iss. 4, 743-755. Kerr, S.P., W. Kerr, C. Ozden and C. Parsons. (2016). Global Talent Flows. Journal of Economic Perspectives, Vol. 30, Iss. 4, 83-106.

IMD World Talent Report 2016
22
5 Best Ranked Criteria 5 Worst Ranked Criteria

IMD World Talent Report 2015
23
IMD World Talent Report 2016
5 Best Ranked Criteria 5 Worst Ranked Criteria
Profiles

IMD World Talent Report 2016
24
5 Best Ranked Criteria 5 Worst Ranked Criteria
ARGENTINA
Rank 2016
of 61
Criteria Value 2016 Rank
Total Public Expenditure on Education Percentage of GDP 1.60 % 59
Public Expenditure on Education per Pupil (Secondary) Percentage of GDP per capita 20.88 % 29
Pupil-Teacher Ratio (Primary Education) Ratio of students to teaching staff 12.66 ratio 15
Pupil-Teacher Ratio (Secondary Education) Ratio of students to teaching staff 23.82 ratio 55
Apprenticeships Are sufficiently implemented 4.05 Survey [0..10] 46
Employee Training Is a high priority in companies 5.00 Survey [0..10] 51
Female Labor Force Percentage of total labor force - % -
Health Infrastructure Meets the needs of society 4.95 Survey [0..10] 37
Criteria Value 2016 Rank
Cost-of-Living Index Index of a basket of goods & services 92.10 index 49
Attracting and Retaining Talents Is a priority in companies 5.76 Survey [0..10] 48
Worker Motivation Is high 4.71 Survey [0..10] 53
Brain Drain Does not hinder competitiveness in your economy 4.10 Survey [0..10] 39
Quality of Life Is high 5.70 Survey [0..10] 38
Foreign High-Skilled People Are attracted to your country's business environment 4.10 Survey [0..10] 45
Remuneration in Services Professions Gross annual income including supplements such as bonuses 14,700 US$ 38
Remuneration of Management Total base salary plus bonuses and long-term incentives 115,379 US$ 42
Effective Personal Income Tax Rate Percentage of an income equal to GDP per capita 15.50 % 24
Personal Security and Private Property Rights Are adequately protected 4.05 Survey 56
Criteria Value 2016 Rank
Labor Force Growth Percentage change 0.29 % 45
Skilled Labor Is readily available 5.76 Survey [0..10] 34
Finance Skills Are readily available 6.54 Survey [0..10] 30
International Experience Of senior managers is generally significant 5.90 Survey [0..10] 19
Competent Senior Managers Are readily available 5.43 Survey [0..10] 37
Educational System Meets the needs of a competitive economy 4.52 Survey [0..10] 41
Science in Schools Is sufficiently emphasized 3.76 Survey [0..10] 50
University Education Meets the needs of a competitive economy 5.52 Survey [0..10] 33
Management Education Meets the needs of the business community 6.24 Survey [0..10] 30
Language Skills Are meeting the needs of enterprises 5.90 Survey [0..10] 32
Student Mobility Inbound Foreign tertiary-level students per 1000 inhabitants 0.95 number 43
Educational Assessment - PISA PISA survey of 15-year olds 397.00 Value 51
5555
51
OverallInvestment & Development
Appeal
44
Factor 1 : Investment and Development
Factor 2 : Appeal
Factor 3 : Readiness
Readiness
43
4748
47
55
44
50
52
56
51
41
45
53
48
4444
53
55
53
55
2012 2013 2014 2015 2016

IMD World Talent Report 2015
25
IMD World Talent Report 2016
5 Best Ranked Criteria 5 Worst Ranked Criteria
AUSTRALIA
Rank 2016
of 61
Criteria Value 2016 Rank
Total Public Expenditure on Education Percentage of GDP 5.26 % 25
Public Expenditure on Education per Pupil (Secondary) Percentage of GDP per capita 16.54 % 45
Pupil-Teacher Ratio (Primary Education) Ratio of students to teaching staff 15.61 ratio 29
Pupil-Teacher Ratio (Secondary Education) Ratio of students to teaching staff 12.02 ratio 27
Apprenticeships Are sufficiently implemented 4.94 Survey [0..10] 22
Employee Training Is a high priority in companies 5.98 Survey [0..10] 26
Female Labor Force Percentage of total labor force 46.09 % 29
Health Infrastructure Meets the needs of society 7.06 Survey [0..10] 22
Criteria Value 2016 Rank
Cost-of-Living Index Index of a basket of goods & services 87.00 index 46
Attracting and Retaining Talents Is a priority in companies 7.32 Survey [0..10] 19
Worker Motivation Is high 6.18 Survey [0..10] 28
Brain Drain Does not hinder competitiveness in your economy 5.69 Survey [0..10] 22
Quality of Life Is high 9.25 Survey [0..10] 7
Foreign High-Skilled People Are attracted to your country's business environment 7.33 Survey [0..10] 12
Remuneration in Services Professions Gross annual income including supplements such as bonuses 51,497 US$ 6
Remuneration of Management Total base salary plus bonuses and long-term incentives 163,541 US$ 27
Effective Personal Income Tax Rate Percentage of an income equal to GDP per capita 21.81 % 43
Personal Security and Private Property Rights Are adequately protected 8.81 Survey 9
Criteria Value 2016 Rank
Labor Force Growth Percentage change 1.84 % 12
Skilled Labor Is readily available 6.51 Survey [0..10] 15
Finance Skills Are readily available 7.76 Survey [0..10] 12
International Experience Of senior managers is generally significant 5.60 Survey [0..10] 29
Competent Senior Managers Are readily available 6.40 Survey [0..10] 17
Educational System Meets the needs of a competitive economy 7.57 Survey [0..10] 11
Science in Schools Is sufficiently emphasized 5.62 Survey [0..10] 26
University Education Meets the needs of a competitive economy 7.14 Survey [0..10] 16
Management Education Meets the needs of the business community 6.98 Survey [0..10] 19
Language Skills Are meeting the needs of enterprises 5.82 Survey [0..10] 34
Student Mobility Inbound Foreign tertiary-level students per 1000 inhabitants 10.73 number 1
Educational Assessment - PISA PISA survey of 15-year olds 512.50 Value 14
1730
18
OverallInvestment & Development
Appeal
6
Factor 1 : Investment and Development
Factor 2 : Appeal
Factor 3 : Readiness
Readiness24
23
25
28
30
23 23
16
14
18
12
19
17
9
6
20 2019
13
17
2012 2013 2014 2015 2016

IMD World Talent Report 2016
26
5 Best Ranked Criteria 5 Worst Ranked Criteria
AUSTRIA
Rank 2016
of 61
Criteria Value 2016 Rank
Total Public Expenditure on Education Percentage of GDP 5.00 % 29
Public Expenditure on Education per Pupil (Secondary) Percentage of GDP per capita 26.95 % 9
Pupil-Teacher Ratio (Primary Education) Ratio of students to teaching staff 11.92 ratio 10
Pupil-Teacher Ratio (Secondary Education) Ratio of students to teaching staff 9.35 ratio 9
Apprenticeships Are sufficiently implemented 8.06 Survey [0..10] 3
Employee Training Is a high priority in companies 7.59 Survey [0..10] 4
Female Labor Force Percentage of total labor force 46.91 % 19
Health Infrastructure Meets the needs of society 8.48 Survey [0..10] 3
Criteria Value 2016 Rank
Cost-of-Living Index Index of a basket of goods & services 79.40 index 36
Attracting and Retaining Talents Is a priority in companies 7.33 Survey [0..10] 18
Worker Motivation Is high 7.62 Survey [0..10] 4
Brain Drain Does not hinder competitiveness in your economy 5.65 Survey [0..10] 23
Quality of Life Is high 9.71 Survey [0..10] 2
Foreign High-Skilled People Are attracted to your country's business environment 5.02 Survey [0..10] 30
Remuneration in Services Professions Gross annual income including supplements such as bonuses 40,720 US$ 15
Remuneration of Management Total base salary plus bonuses and long-term incentives 260,394 US$ 4
Effective Personal Income Tax Rate Percentage of an income equal to GDP per capita 31.01 % 61
Personal Security and Private Property Rights Are adequately protected 8.54 Survey 12
Criteria Value 2016 Rank
Labor Force Growth Percentage change 0.98 % 26
Skilled Labor Is readily available 5.39 Survey [0..10] 41
Finance Skills Are readily available 7.10 Survey [0..10] 21
International Experience Of senior managers is generally significant 6.06 Survey [0..10] 16
Competent Senior Managers Are readily available 5.37 Survey [0..10] 39
Educational System Meets the needs of a competitive economy 5.87 Survey [0..10] 27
Science in Schools Is sufficiently emphasized 4.62 Survey [0..10] 43
University Education Meets the needs of a competitive economy 6.90 Survey [0..10] 20
Management Education Meets the needs of the business community 6.74 Survey [0..10] 20
Language Skills Are meeting the needs of enterprises 6.42 Survey [0..10] 27
Student Mobility Inbound Foreign tertiary-level students per 1000 inhabitants 8.36 number 4
Educational Assessment - PISA PISA survey of 15-year olds 506.00 Value 19
84
17
OverallInvestment & Development
Appeal
18
Factor 1 : Investment and Development
Factor 2 : Appeal
Factor 3 : Readiness
Readiness
5
23 3
4
26
28
14
22
17
10
7
24
29
18
1413
11
19
8
2012 2013 2014 2015 2016

IMD World Talent Report 2015
27
IMD World Talent Report 2016
5 Best Ranked Criteria 5 Worst Ranked Criteria
BELGIUM
Rank 2016
of 61
Criteria Value 2016 Rank
Total Public Expenditure on Education Percentage of GDP 6.44 % 7
Public Expenditure on Education per Pupil (Secondary) Percentage of GDP per capita 38.55 % 1
Pupil-Teacher Ratio (Primary Education) Ratio of students to teaching staff 12.67 ratio 16
Pupil-Teacher Ratio (Secondary Education) Ratio of students to teaching staff 9.67 ratio 12
Apprenticeships Are sufficiently implemented 4.35 Survey [0..10] 40
Employee Training Is a high priority in companies 6.07 Survey [0..10] 23
Female Labor Force Percentage of total labor force 47.13 % 16
Health Infrastructure Meets the needs of society 9.02 Survey [0..10] 2
Criteria Value 2016 Rank
Cost-of-Living Index Index of a basket of goods & services 73.10 index 23
Attracting and Retaining Talents Is a priority in companies 7.46 Survey [0..10] 15
Worker Motivation Is high 6.42 Survey [0..10] 24
Brain Drain Does not hinder competitiveness in your economy 6.11 Survey [0..10] 15
Quality of Life Is high 9.05 Survey [0..10] 12
Foreign High-Skilled People Are attracted to your country's business environment 5.89 Survey [0..10] 21
Remuneration in Services Professions Gross annual income including supplements such as bonuses 41,133 US$ 14
Remuneration of Management Total base salary plus bonuses and long-term incentives 242,321 US$ 9
Effective Personal Income Tax Rate Percentage of an income equal to GDP per capita 25.97 % 52
Personal Security and Private Property Rights Are adequately protected 8.18 Survey 18
Criteria Value 2016 Rank
Labor Force Growth Percentage change -1.66 % 59
Skilled Labor Is readily available 6.42 Survey [0..10] 16
Finance Skills Are readily available 7.82 Survey [0..10] 8
International Experience Of senior managers is generally significant 7.40 Survey [0..10] 4
Competent Senior Managers Are readily available 6.93 Survey [0..10] 7
Educational System Meets the needs of a competitive economy 7.71 Survey [0..10] 8
Science in Schools Is sufficiently emphasized 6.63 Survey [0..10] 10
University Education Meets the needs of a competitive economy 7.96 Survey [0..10] 6
Management Education Meets the needs of the business community 7.30 Survey [0..10] 10
Language Skills Are meeting the needs of enterprises 8.46 Survey [0..10] 7
Student Mobility Inbound Foreign tertiary-level students per 1000 inhabitants 4.37 number 11
Educational Assessment - PISA PISA survey of 15-year olds 510.00 Value 16
32
15
OverallInvestment & Development
Appeal
11
Factor 1 : Investment and Development
Factor 2 : Appeal
Factor 3 : Readiness
Readiness
89
13
4
2
20
12
18
20
15
24
17
20
1011
18
10
17
9
3
2012 2013 2014 2015 2016

IMD World Talent Report 2016
28
5 Best Ranked Criteria 5 Worst Ranked Criteria
BRAZIL
Rank 2016
of 61
Criteria Value 2016 Rank
Total Public Expenditure on Education Percentage of GDP 6.40 % 9
Public Expenditure on Education per Pupil (Secondary) Percentage of GDP per capita 22.66 % 26
Pupil-Teacher Ratio (Primary Education) Ratio of students to teaching staff 22.40 ratio 54
Pupil-Teacher Ratio (Secondary Education) Ratio of students to teaching staff 17.26 ratio 50
Apprenticeships Are sufficiently implemented 4.62 Survey [0..10] 33
Employee Training Is a high priority in companies 5.57 Survey [0..10] 39
Female Labor Force Percentage of total labor force 48.00 % 9
Health Infrastructure Meets the needs of society 1.72 Survey [0..10] 60
Criteria Value 2016 Rank
Cost-of-Living Index Index of a basket of goods & services 84.40 index 44
Attracting and Retaining Talents Is a priority in companies 6.27 Survey [0..10] 42
Worker Motivation Is high 5.25 Survey [0..10] 41
Brain Drain Does not hinder competitiveness in your economy 4.27 Survey [0..10] 36
Quality of Life Is high 4.32 Survey [0..10] 54
Foreign High-Skilled People Are attracted to your country's business environment 3.55 Survey [0..10] 53
Remuneration in Services Professions Gross annual income including supplements such as bonuses 17,117 US$ 36
Remuneration of Management Total base salary plus bonuses and long-term incentives 120,351 US$ 41
Effective Personal Income Tax Rate Percentage of an income equal to GDP per capita 8.54 % 10
Personal Security and Private Property Rights Are adequately protected 3.81 Survey 57
Criteria Value 2016 Rank
Labor Force Growth Percentage change 6.45 % 2
Skilled Labor Is readily available 4.69 Survey [0..10] 51
Finance Skills Are readily available 5.04 Survey [0..10] 54
International Experience Of senior managers is generally significant 4.34 Survey [0..10] 56
Competent Senior Managers Are readily available 4.84 Survey [0..10] 48
Educational System Meets the needs of a competitive economy 2.68 Survey [0..10] 59
Science in Schools Is sufficiently emphasized 2.65 Survey [0..10] 60
University Education Meets the needs of a competitive economy 4.31 Survey [0..10] 53
Management Education Meets the needs of the business community 4.59 Survey [0..10] 54
Language Skills Are meeting the needs of enterprises 3.04 Survey [0..10] 59
Student Mobility Inbound Foreign tertiary-level students per 1000 inhabitants 0.08 number 54
Educational Assessment - PISA PISA survey of 15-year olds 398.00 Value 49
4539
48
OverallInvestment & Development
Appeal
55
Factor 1 : Investment and Development
Factor 2 : Appeal
Factor 3 : Readiness
Readiness
36
31
35
45
39
5658
41
48 48
28
36
5961
55
45
48
52
57
45
2012 2013 2014 2015 2016

IMD World Talent Report 2015
29
IMD World Talent Report 2016
5 Best Ranked Criteria 5 Worst Ranked Criteria
BULGARIA
Rank 2016
of 61
Criteria Value 2016 Rank
Total Public Expenditure on Education Percentage of GDP 3.35 % 51
Public Expenditure on Education per Pupil (Secondary) Percentage of GDP per capita 20.38 % 30
Pupil-Teacher Ratio (Primary Education) Ratio of students to teaching staff 17.63 ratio 47
Pupil-Teacher Ratio (Secondary Education) Ratio of students to teaching staff 13.04 ratio 37
Apprenticeships Are sufficiently implemented 2.83 Survey [0..10] 59
Employee Training Is a high priority in companies 5.02 Survey [0..10] 48
Female Labor Force Percentage of total labor force 46.60 % 24
Health Infrastructure Meets the needs of society 3.13 Survey [0..10] 54
Criteria Value 2016 Rank
Cost-of-Living Index Index of a basket of goods & services 56.30 index 2
Attracting and Retaining Talents Is a priority in companies 6.53 Survey [0..10] 34
Worker Motivation Is high 4.53 Survey [0..10] 56
Brain Drain Does not hinder competitiveness in your economy 1.96 Survey [0..10] 59
Quality of Life Is high 4.00 Survey [0..10] 55
Foreign High-Skilled People Are attracted to your country's business environment 2.98 Survey [0..10] 56
Remuneration in Services Professions Gross annual income including supplements such as bonuses 7,891 US$ 56
Remuneration of Management Total base salary plus bonuses and long-term incentives 43,794 US$ 55
Effective Personal Income Tax Rate Percentage of an income equal to GDP per capita 20.30 % 36
Personal Security and Private Property Rights Are adequately protected 3.27 Survey 59
Criteria Value 2016 Rank
Labor Force Growth Percentage change -0.86 % 58
Skilled Labor Is readily available 4.42 Survey [0..10] 53
Finance Skills Are readily available 4.98 Survey [0..10] 55
International Experience Of senior managers is generally significant 4.58 Survey [0..10] 49
Competent Senior Managers Are readily available 3.84 Survey [0..10] 57
Educational System Meets the needs of a competitive economy 2.69 Survey [0..10] 58
Science in Schools Is sufficiently emphasized 3.17 Survey [0..10] 54
University Education Meets the needs of a competitive economy 2.86 Survey [0..10] 61
Management Education Meets the needs of the business community 3.76 Survey [0..10] 60
Language Skills Are meeting the needs of enterprises 5.71 Survey [0..10] 37
Student Mobility Inbound Foreign tertiary-level students per 1000 inhabitants 1.60 number 30
Educational Assessment - PISA PISA survey of 15-year olds 442.50 Value 41
5746
57
OverallInvestment & Development
Appeal
58
Factor 1 : Investment and Development
Factor 2 : Appeal
Factor 3 : Readiness
Readiness
46
5051
54
46
5960
5960
5758
5960 60
5859
60 6061
57
2012 2013 2014 2015 2016
IMD World Talent Report 2016
30
5 Best Ranked Criteria 5 Worst Ranked Criteria
CANADA
Rank 2016
of 61
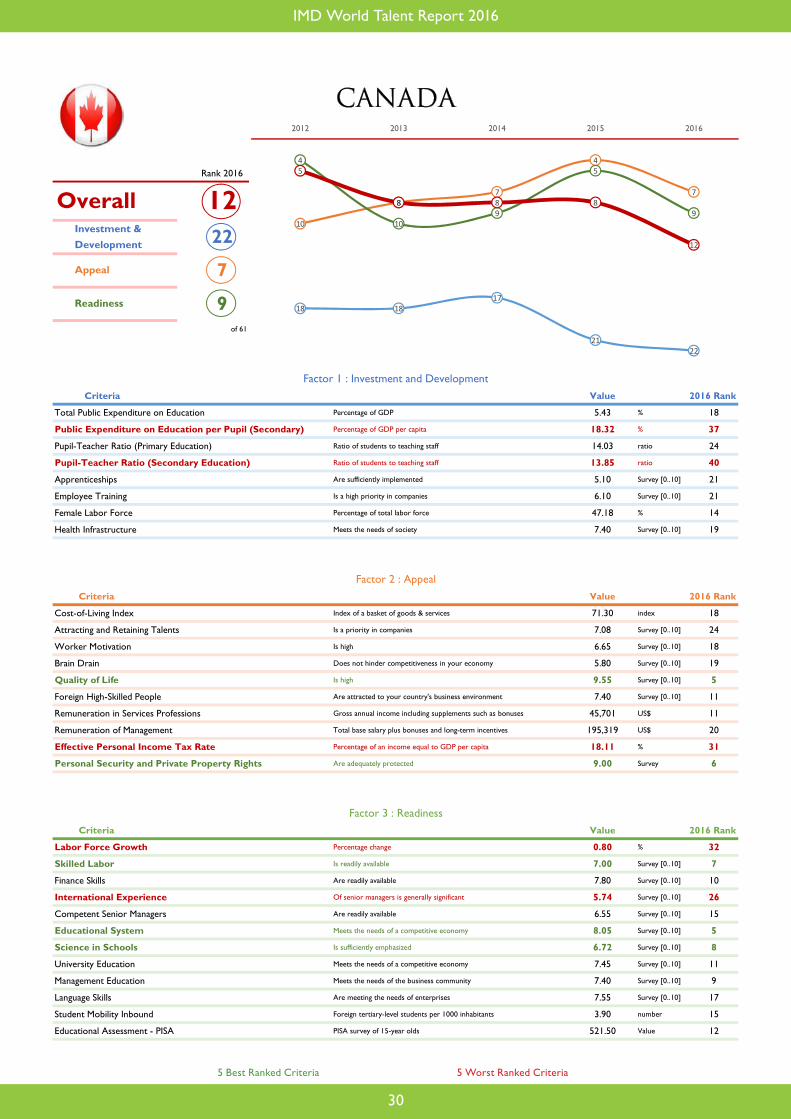
Criteria Value 2016 Rank
Total Public Expenditure on Education Percentage of GDP 5.43 % 18
Public Expenditure on Education per Pupil (Secondary) Percentage of GDP per capita 18.32 % 37
Pupil-Teacher Ratio (Primary Education) Ratio of students to teaching staff 14.03 ratio 24
Pupil-Teacher Ratio (Secondary Education) Ratio of students to teaching staff 13.85 ratio 40
Apprenticeships Are sufficiently implemented 5.10 Survey [0..10] 21
Employee Training Is a high priority in companies 6.10 Survey [0..10] 21
Female Labor Force Percentage of total labor force 47.18 % 14
Health Infrastructure Meets the needs of society 7.40 Survey [0..10] 19
Criteria Value 2016 Rank
Cost-of-Living Index Index of a basket of goods & services 71.30 index 18
Attracting and Retaining Talents Is a priority in companies 7.08 Survey [0..10] 24
Worker Motivation Is high 6.65 Survey [0..10] 18
Brain Drain Does not hinder competitiveness in your economy 5.80 Survey [0..10] 19
Quality of Life Is high 9.55 Survey [0..10] 5
Foreign High-Skilled People Are attracted to your country's business environment 7.40 Survey [0..10] 11
Remuneration in Services Professions Gross annual income including supplements such as bonuses 45,701 US$ 11
Remuneration of Management Total base salary plus bonuses and long-term incentives 195,319 US$ 20
Effective Personal Income Tax Rate Percentage of an income equal to GDP per capita 18.11 % 31
Personal Security and Private Property Rights Are adequately protected 9.00 Survey 6
Criteria Value 2016 Rank
Labor Force Growth Percentage change 0.80 % 32
Skilled Labor Is readily available 7.00 Survey [0..10] 7
Finance Skills Are readily available 7.80 Survey [0..10] 10
International Experience Of senior managers is generally significant 5.74 Survey [0..10] 26
Competent Senior Managers Are readily available 6.55 Survey [0..10] 15
Educational System Meets the needs of a competitive economy 8.05 Survey [0..10] 5
Science in Schools Is sufficiently emphasized 6.72 Survey [0..10] 8
University Education Meets the needs of a competitive economy 7.45 Survey [0..10] 11
Management Education Meets the needs of the business community 7.40 Survey [0..10] 9
Language Skills Are meeting the needs of enterprises 7.55 Survey [0..10] 17
Student Mobility Inbound Foreign tertiary-level students per 1000 inhabitants 3.90 number 15
Educational Assessment - PISA PISA survey of 15-year olds 521.50 Value 12
1222
7
OverallInvestment & Development
Appeal
9
Factor 1 : Investment and Development
Factor 2 : Appeal
Factor 3 : Readiness
Readiness 18 1817
2122
10
87
4
7
4
109
5
9
5
8 8 8
12
2012 2013 2014 2015 2016

IMD World Talent Report 2015
31
IMD World Talent Report 2016
5 Best Ranked Criteria 5 Worst Ranked Criteria
CHILE
Rank 2016
of 61
Criteria Value 2016 Rank
Total Public Expenditure on Education Percentage of GDP 4.08 % 41
Public Expenditure on Education per Pupil (Secondary) Percentage of GDP per capita 15.15 % 50
Pupil-Teacher Ratio (Primary Education) Ratio of students to teaching staff 22.53 ratio 55
Pupil-Teacher Ratio (Secondary Education) Ratio of students to teaching staff 24.80 ratio 57
Apprenticeships Are sufficiently implemented 3.97 Survey [0..10] 49
Employee Training Is a high priority in companies 5.02 Survey [0..10] 50
Female Labor Force Percentage of total labor force 41.09 % 48
Health Infrastructure Meets the needs of society 3.97 Survey [0..10] 47
Criteria Value 2016 Rank
Cost-of-Living Index Index of a basket of goods & services 76.80 index 32
Attracting and Retaining Talents Is a priority in companies 6.29 Survey [0..10] 40
Worker Motivation Is high 5.97 Survey [0..10] 34
Brain Drain Does not hinder competitiveness in your economy 6.06 Survey [0..10] 16
Quality of Life Is high 6.38 Survey [0..10] 36
Foreign High-Skilled People Are attracted to your country's business environment 7.14 Survey [0..10] 14
Remuneration in Services Professions Gross annual income including supplements such as bonuses 16,341 US$ 37
Remuneration of Management Total base salary plus bonuses and long-term incentives 196,703 US$ 17
Effective Personal Income Tax Rate Percentage of an income equal to GDP per capita 17.02 % 28
Personal Security and Private Property Rights Are adequately protected 5.87 Survey 40
Criteria Value 2016 Rank
Labor Force Growth Percentage change 1.39 % 20
Skilled Labor Is readily available 4.76 Survey [0..10] 49
Finance Skills Are readily available 6.48 Survey [0..10] 31
International Experience Of senior managers is generally significant 5.90 Survey [0..10] 19
Competent Senior Managers Are readily available 5.87 Survey [0..10] 30
Educational System Meets the needs of a competitive economy 3.46 Survey [0..10] 55
Science in Schools Is sufficiently emphasized 2.79 Survey [0..10] 58
University Education Meets the needs of a competitive economy 5.37 Survey [0..10] 36
Management Education Meets the needs of the business community 6.29 Survey [0..10] 29
Language Skills Are meeting the needs of enterprises 3.30 Survey [0..10] 57
Student Mobility Inbound Foreign tertiary-level students per 1000 inhabitants 0.17 number 53
Educational Assessment - PISA PISA survey of 15-year olds 434.00 Value 45
4758
27
OverallInvestment & Development
Appeal
48
Factor 1 : Investment and Development
Factor 2 : Appeal
Factor 3 : Readiness
Readiness52
57 56 5658
30
44
27 27 27
21
31
4644
48
29
44 44 43
47
2012 2013 2014 2015 2016
IMD World Talent Report 2016
32
5 Best Ranked Criteria 5 Worst Ranked Criteria
CHINA HONG KONG
Rank 2016
of 61
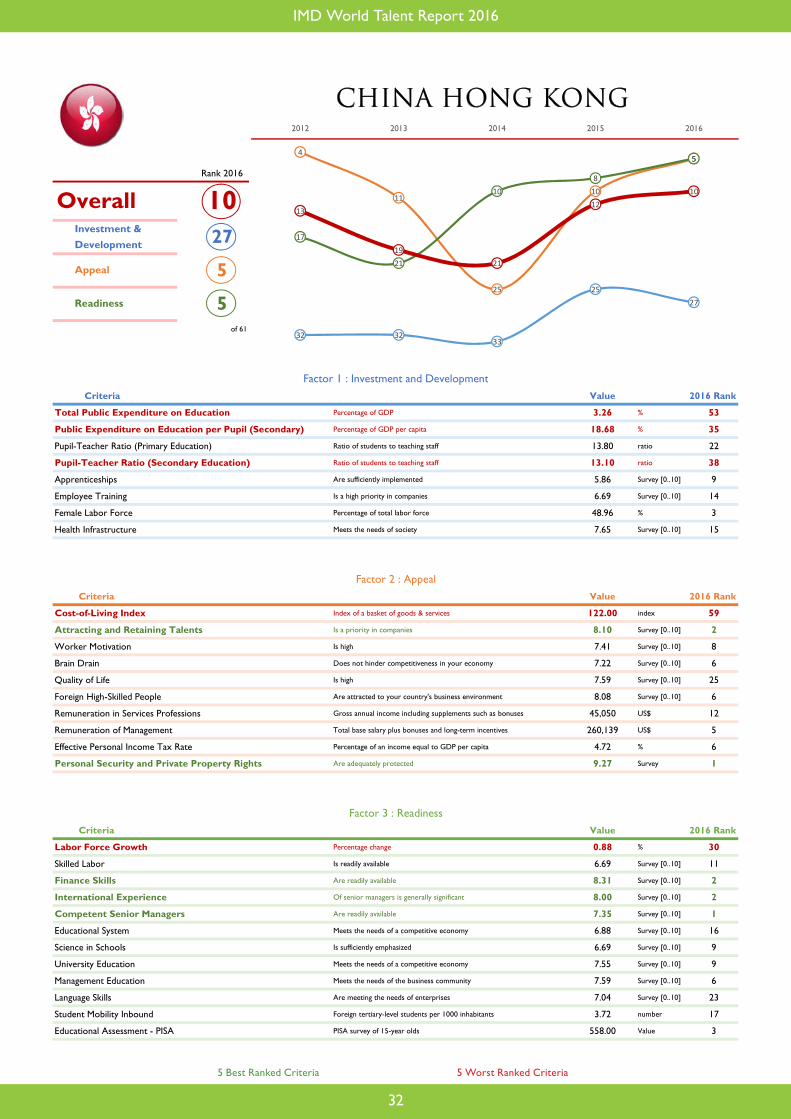
Criteria Value 2016 Rank
Total Public Expenditure on Education Percentage of GDP 3.26 % 53
Public Expenditure on Education per Pupil (Secondary) Percentage of GDP per capita 18.68 % 35
Pupil-Teacher Ratio (Primary Education) Ratio of students to teaching staff 13.80 ratio 22
Pupil-Teacher Ratio (Secondary Education) Ratio of students to teaching staff 13.10 ratio 38
Apprenticeships Are sufficiently implemented 5.86 Survey [0..10] 9
Employee Training Is a high priority in companies 6.69 Survey [0..10] 14
Female Labor Force Percentage of total labor force 48.96 % 3
Health Infrastructure Meets the needs of society 7.65 Survey [0..10] 15
Criteria Value 2016 Rank
Cost-of-Living Index Index of a basket of goods & services 122.00 index 59
Attracting and Retaining Talents Is a priority in companies 8.10 Survey [0..10] 2
Worker Motivation Is high 7.41 Survey [0..10] 8
Brain Drain Does not hinder competitiveness in your economy 7.22 Survey [0..10] 6
Quality of Life Is high 7.59 Survey [0..10] 25
Foreign High-Skilled People Are attracted to your country's business environment 8.08 Survey [0..10] 6
Remuneration in Services Professions Gross annual income including supplements such as bonuses 45,050 US$ 12
Remuneration of Management Total base salary plus bonuses and long-term incentives 260,139 US$ 5
Effective Personal Income Tax Rate Percentage of an income equal to GDP per capita 4.72 % 6
Personal Security and Private Property Rights Are adequately protected 9.27 Survey 1
Criteria Value 2016 Rank
Labor Force Growth Percentage change 0.88 % 30
Skilled Labor Is readily available 6.69 Survey [0..10] 11
Finance Skills Are readily available 8.31 Survey [0..10] 2
International Experience Of senior managers is generally significant 8.00 Survey [0..10] 2
Competent Senior Managers Are readily available 7.35 Survey [0..10] 1
Educational System Meets the needs of a competitive economy 6.88 Survey [0..10] 16
Science in Schools Is sufficiently emphasized 6.69 Survey [0..10] 9
University Education Meets the needs of a competitive economy 7.55 Survey [0..10] 9
Management Education Meets the needs of the business community 7.59 Survey [0..10] 6
Language Skills Are meeting the needs of enterprises 7.04 Survey [0..10] 23
Student Mobility Inbound Foreign tertiary-level students per 1000 inhabitants 3.72 number 17
Educational Assessment - PISA PISA survey of 15-year olds 558.00 Value 3
1027
5
OverallInvestment & Development
Appeal
5
Factor 1 : Investment and Development
Factor 2 : Appeal
Factor 3 : Readiness
Readiness
32 3233
2527
4
11
25
10
5
17
21
108
5
13
1921
1210
2012 2013 2014 2015 2016

IMD World Talent Report 2015
33
IMD World Talent Report 2016
5 Best Ranked Criteria 5 Worst Ranked Criteria
CHINA MAINLAND
Rank 2016
of 61
Criteria Value 2016 Rank
Total Public Expenditure on Education Percentage of GDP 3.62 % 46
Public Expenditure on Education per Pupil (Secondary) Percentage of GDP per capita - % -
Pupil-Teacher Ratio (Primary Education) Ratio of students to teaching staff 16.85 ratio 39
Pupil-Teacher Ratio (Secondary Education) Ratio of students to teaching staff 15.14 ratio 44
Apprenticeships Are sufficiently implemented 4.30 Survey [0..10] 43
Employee Training Is a high priority in companies 5.89 Survey [0..10] 27
Female Labor Force Percentage of total labor force - % -
Health Infrastructure Meets the needs of society 4.48 Survey [0..10] 41
Criteria Value 2016 Rank
Cost-of-Living Index Index of a basket of goods & services 110.60 index 56
Attracting and Retaining Talents Is a priority in companies 6.96 Survey [0..10] 27
Worker Motivation Is high 5.76 Survey [0..10] 37
Brain Drain Does not hinder competitiveness in your economy 3.95 Survey [0..10] 42
Quality of Life Is high 5.26 Survey [0..10] 45
Foreign High-Skilled People Are attracted to your country's business environment 5.63 Survey [0..10] 24
Remuneration in Services Professions Gross annual income including supplements such as bonuses 12,355 US$ 52
Remuneration of Management Total base salary plus bonuses and long-term incentives 129,374 US$ 37
Effective Personal Income Tax Rate Percentage of an income equal to GDP per capita 21.06 % 40
Personal Security and Private Property Rights Are adequately protected 5.24 Survey 46
Criteria Value 2016 Rank
Labor Force Growth Percentage change 0.38 % 42
Skilled Labor Is readily available 5.35 Survey [0..10] 43
Finance Skills Are readily available 5.59 Survey [0..10] 48
International Experience Of senior managers is generally significant 4.02 Survey [0..10] 58
Competent Senior Managers Are readily available 5.46 Survey [0..10] 36
Educational System Meets the needs of a competitive economy 4.21 Survey [0..10] 47
Science in Schools Is sufficiently emphasized 5.35 Survey [0..10] 32
University Education Meets the needs of a competitive economy 4.50 Survey [0..10] 49
Management Education Meets the needs of the business community 5.05 Survey [0..10] 46
Language Skills Are meeting the needs of enterprises 5.07 Survey [0..10] 42
Student Mobility Inbound Foreign tertiary-level students per 1000 inhabitants 0.07 number 55
Educational Assessment - PISA PISA survey of 15-year olds 596.50 Value 1
4344
54
OverallInvestment & Development
Appeal
36
Factor 1 : Investment and Development
Factor 2 : Appeal
Factor 3 : Readiness
Readiness48
45 45
41
44
50
45
40
45
54
35
40
50
3736
50
45
43
40
43
2012 2013 2014 2015 2016

IMD World Talent Report 2016
34
5 Best Ranked Criteria 5 Worst Ranked Criteria
COLOMBIA
Rank 2016
of 61
Criteria Value 2016 Rank
Total Public Expenditure on Education Percentage of GDP 4.70 % 32
Public Expenditure on Education per Pupil (Secondary) Percentage of GDP per capita 16.95 % 42
Pupil-Teacher Ratio (Primary Education) Ratio of students to teaching staff 24.98 ratio 56
Pupil-Teacher Ratio (Secondary Education) Ratio of students to teaching staff 25.50 ratio 58
Apprenticeships Are sufficiently implemented 5.33 Survey [0..10] 16
Employee Training Is a high priority in companies 5.57 Survey [0..10] 40
Female Labor Force Percentage of total labor force 43.14 % 42
Health Infrastructure Meets the needs of society 2.38 Survey [0..10] 58
Criteria Value 2016 Rank
Cost-of-Living Index Index of a basket of goods & services 67.20 index 11
Attracting and Retaining Talents Is a priority in companies 5.32 Survey [0..10] 54
Worker Motivation Is high 5.59 Survey [0..10] 38
Brain Drain Does not hinder competitiveness in your economy 3.93 Survey [0..10] 43
Quality of Life Is high 4.68 Survey [0..10] 50
Foreign High-Skilled People Are attracted to your country's business environment 4.58 Survey [0..10] 39
Remuneration in Services Professions Gross annual income including supplements such as bonuses 20,538 US$ 34
Remuneration of Management Total base salary plus bonuses and long-term incentives 145,701 US$ 31
Effective Personal Income Tax Rate Percentage of an income equal to GDP per capita 8.59 % 11
Personal Security and Private Property Rights Are adequately protected 4.61 Survey 50
Criteria Value 2016 Rank
Labor Force Growth Percentage change 2.19 % 11
Skilled Labor Is readily available 5.13 Survey [0..10] 46
Finance Skills Are readily available 5.44 Survey [0..10] 50
International Experience Of senior managers is generally significant 4.89 Survey [0..10] 40
Competent Senior Managers Are readily available 4.67 Survey [0..10] 50
Educational System Meets the needs of a competitive economy 3.72 Survey [0..10] 52
Science in Schools Is sufficiently emphasized 3.09 Survey [0..10] 55
University Education Meets the needs of a competitive economy 4.63 Survey [0..10] 46
Management Education Meets the needs of the business community 4.89 Survey [0..10] 50
Language Skills Are meeting the needs of enterprises 3.48 Survey [0..10] 56
Student Mobility Inbound Foreign tertiary-level students per 1000 inhabitants 0.54 number 48
Educational Assessment - PISA PISA survey of 15-year olds 387.50 Value 52
5453
39
OverallInvestment & Development
Appeal
54
Factor 1 : Investment and Development
Factor 2 : Appeal
Factor 3 : Readiness
Readiness
56
53
55
5253
52
47
45
42
39
52
42
54
52
54
56
51
54
50
54
2012 2013 2014 2015 2016
IMD World Talent Report 2015
35
IMD World Talent Report 2016
5 Best Ranked Criteria 5 Worst Ranked Criteria
CROATIA
Rank 2016
of 61
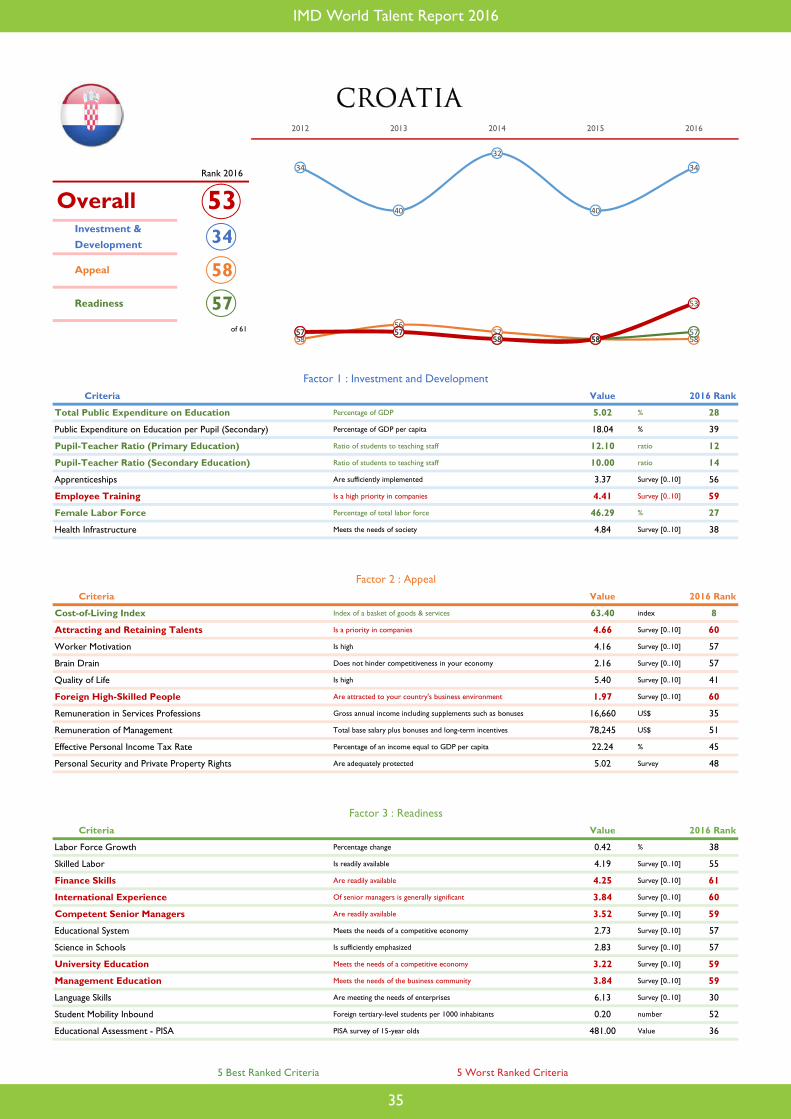
Criteria Value 2016 Rank
Total Public Expenditure on Education Percentage of GDP 5.02 % 28
Public Expenditure on Education per Pupil (Secondary) Percentage of GDP per capita 18.04 % 39
Pupil-Teacher Ratio (Primary Education) Ratio of students to teaching staff 12.10 ratio 12
Pupil-Teacher Ratio (Secondary Education) Ratio of students to teaching staff 10.00 ratio 14
Apprenticeships Are sufficiently implemented 3.37 Survey [0..10] 56
Employee Training Is a high priority in companies 4.41 Survey [0..10] 59
Female Labor Force Percentage of total labor force 46.29 % 27
Health Infrastructure Meets the needs of society 4.84 Survey [0..10] 38
Criteria Value 2016 Rank
Cost-of-Living Index Index of a basket of goods & services 63.40 index 8
Attracting and Retaining Talents Is a priority in companies 4.66 Survey [0..10] 60
Worker Motivation Is high 4.16 Survey [0..10] 57
Brain Drain Does not hinder competitiveness in your economy 2.16 Survey [0..10] 57
Quality of Life Is high 5.40 Survey [0..10] 41
Foreign High-Skilled People Are attracted to your country's business environment 1.97 Survey [0..10] 60
Remuneration in Services Professions Gross annual income including supplements such as bonuses 16,660 US$ 35
Remuneration of Management Total base salary plus bonuses and long-term incentives 78,245 US$ 51
Effective Personal Income Tax Rate Percentage of an income equal to GDP per capita 22.24 % 45
Personal Security and Private Property Rights Are adequately protected 5.02 Survey 48
Criteria Value 2016 Rank
Labor Force Growth Percentage change 0.42 % 38
Skilled Labor Is readily available 4.19 Survey [0..10] 55
Finance Skills Are readily available 4.25 Survey [0..10] 61
International Experience Of senior managers is generally significant 3.84 Survey [0..10] 60
Competent Senior Managers Are readily available 3.52 Survey [0..10] 59
Educational System Meets the needs of a competitive economy 2.73 Survey [0..10] 57
Science in Schools Is sufficiently emphasized 2.83 Survey [0..10] 57
University Education Meets the needs of a competitive economy 3.22 Survey [0..10] 59
Management Education Meets the needs of the business community 3.84 Survey [0..10] 59
Language Skills Are meeting the needs of enterprises 6.13 Survey [0..10] 30
Student Mobility Inbound Foreign tertiary-level students per 1000 inhabitants 0.20 number 52
Educational Assessment - PISA PISA survey of 15-year olds 481.00 Value 36
5334
58
OverallInvestment & Development
Appeal
57
Factor 1 : Investment and Development
Factor 2 : Appeal
Factor 3 : Readiness
Readiness
34
40
32
40
34
58
5657
58 5857 57
58 585757 57
58 58
53
2012 2013 2014 2015 2016

IMD World Talent Report 2016
36
5 Best Ranked Criteria 5 Worst Ranked Criteria
CZECH REPUBLIC
Rank 2016
of 61
Criteria Value 2016 Rank
Total Public Expenditure on Education Percentage of GDP 5.17 % 26
Public Expenditure on Education per Pupil (Secondary) Percentage of GDP per capita 25.35 % 16
Pupil-Teacher Ratio (Primary Education) Ratio of students to teaching staff 18.79 ratio 49
Pupil-Teacher Ratio (Secondary Education) Ratio of students to teaching staff 11.14 ratio 20
Apprenticeships Are sufficiently implemented 3.48 Survey [0..10] 54
Employee Training Is a high priority in companies 5.64 Survey [0..10] 37
Female Labor Force Percentage of total labor force 43.51 % 41
Health Infrastructure Meets the needs of society 7.38 Survey [0..10] 20
Criteria Value 2016 Rank
Cost-of-Living Index Index of a basket of goods & services 67.90 index 13
Attracting and Retaining Talents Is a priority in companies 6.53 Survey [0..10] 33
Worker Motivation Is high 6.03 Survey [0..10] 32
Brain Drain Does not hinder competitiveness in your economy 5.54 Survey [0..10] 26
Quality of Life Is high 8.20 Survey [0..10] 19
Foreign High-Skilled People Are attracted to your country's business environment 4.85 Survey [0..10] 32
Remuneration in Services Professions Gross annual income including supplements such as bonuses 12,607 US$ 45
Remuneration of Management Total base salary plus bonuses and long-term incentives 98,835 US$ 44
Effective Personal Income Tax Rate Percentage of an income equal to GDP per capita 20.63 % 38
Personal Security and Private Property Rights Are adequately protected 6.89 Survey 33
Criteria Value 2016 Rank
Labor Force Growth Percentage change 0.23 % 47
Skilled Labor Is readily available 4.63 Survey [0..10] 52
Finance Skills Are readily available 5.77 Survey [0..10] 43
International Experience Of senior managers is generally significant 5.84 Survey [0..10] 24
Competent Senior Managers Are readily available 5.05 Survey [0..10] 44
Educational System Meets the needs of a competitive economy 5.57 Survey [0..10] 32
Science in Schools Is sufficiently emphasized 5.15 Survey [0..10] 38
University Education Meets the needs of a competitive economy 5.77 Survey [0..10] 31
Management Education Meets the needs of the business community 6.33 Survey [0..10] 28
Language Skills Are meeting the needs of enterprises 6.13 Survey [0..10] 29
Student Mobility Inbound Foreign tertiary-level students per 1000 inhabitants 3.82 number 16
Educational Assessment - PISA PISA survey of 15-year olds 503.50 Value 21
3131
34
OverallInvestment & Development
Appeal
29
Factor 1 : Investment and Development
Factor 2 : Appeal
Factor 3 : Readiness
Readiness
33
37
46
31 31
37
32
37
31
34
29 29
38
3029
30
28
37
3031
2012 2013 2014 2015 2016

IMD World Talent Report 2015
37
IMD World Talent Report 2016
5 Best Ranked Criteria 5 Worst Ranked Criteria
DENMARK
Rank 2016
of 61
Criteria Value 2016 Rank
Total Public Expenditure on Education Percentage of GDP 7.64 % 2
Public Expenditure on Education per Pupil (Secondary) Percentage of GDP per capita 29.44 % 7
Pupil-Teacher Ratio (Primary Education) Ratio of students to teaching staff 11.80 ratio 9
Pupil-Teacher Ratio (Secondary Education) Ratio of students to teaching staff 11.55 ratio 25
Apprenticeships Are sufficiently implemented 6.83 Survey [0..10] 5
Employee Training Is a high priority in companies 7.60 Survey [0..10] 3
Female Labor Force Percentage of total labor force 47.01 % 18
Health Infrastructure Meets the needs of society 8.27 Survey [0..10] 7
Criteria Value 2016 Rank
Cost-of-Living Index Index of a basket of goods & services 90.00 index 47
Attracting and Retaining Talents Is a priority in companies 8.21 Survey [0..10] 1
Worker Motivation Is high 8.06 Survey [0..10] 1
Brain Drain Does not hinder competitiveness in your economy 7.25 Survey [0..10] 5
Quality of Life Is high 9.52 Survey [0..10] 6
Foreign High-Skilled People Are attracted to your country's business environment 5.24 Survey [0..10] 28
Remuneration in Services Professions Gross annual income including supplements such as bonuses 59,093 US$ 2
Remuneration of Management Total base salary plus bonuses and long-term incentives 204,150 US$ 15
Effective Personal Income Tax Rate Percentage of an income equal to GDP per capita 29.67 % 60
Personal Security and Private Property Rights Are adequately protected 9.23 Survey 2
Criteria Value 2016 Rank
Labor Force Growth Percentage change 0.92 % 27
Skilled Labor Is readily available 7.03 Survey [0..10] 6
Finance Skills Are readily available 8.17 Survey [0..10] 4
International Experience Of senior managers is generally significant 6.72 Survey [0..10] 11
Competent Senior Managers Are readily available 7.04 Survey [0..10] 3
Educational System Meets the needs of a competitive economy 7.90 Survey [0..10] 6
Science in Schools Is sufficiently emphasized 6.79 Survey [0..10] 6
University Education Meets the needs of a competitive economy 7.98 Survey [0..10] 5
Management Education Meets the needs of the business community 8.00 Survey [0..10] 2
Language Skills Are meeting the needs of enterprises 8.98 Survey [0..10] 1
Student Mobility Inbound Foreign tertiary-level students per 1000 inhabitants 5.26 number 9
Educational Assessment - PISA PISA survey of 15-year olds 499.00 Value 22
21
11
OverallInvestment & Development
Appeal
3
Factor 1 : Investment and Development
Factor 2 : Appeal
Factor 3 : Readiness
Readiness
1 1 1 1 1
5
3
9 9
11
13
11
4
6
3
2 2 2 2 2
2012 2013 2014 2015 2016

IMD World Talent Report 2016
38
5 Best Ranked Criteria 5 Worst Ranked Criteria
ESTONIA
Rank 2016
of 61
Criteria Value 2016 Rank
Total Public Expenditure on Education Percentage of GDP 5.92 % 13
Public Expenditure on Education per Pupil (Secondary) Percentage of GDP per capita 27.09 % 8
Pupil-Teacher Ratio (Primary Education) Ratio of students to teaching staff 13.04 ratio 18
Pupil-Teacher Ratio (Secondary Education) Ratio of students to teaching staff 10.57 ratio 17
Apprenticeships Are sufficiently implemented 4.76 Survey [0..10] 30
Employee Training Is a high priority in companies 6.78 Survey [0..10] 11
Female Labor Force Percentage of total labor force 48.81 % 5
Health Infrastructure Meets the needs of society 5.83 Survey [0..10] 34
Criteria Value 2016 Rank
Cost-of-Living Index Index of a basket of goods & services 65.40 index 10
Attracting and Retaining Talents Is a priority in companies 7.14 Survey [0..10] 22
Worker Motivation Is high 6.10 Survey [0..10] 30
Brain Drain Does not hinder competitiveness in your economy 3.49 Survey [0..10] 47
Quality of Life Is high 6.44 Survey [0..10] 34
Foreign High-Skilled People Are attracted to your country's business environment 4.42 Survey [0..10] 42
Remuneration in Services Professions Gross annual income including supplements such as bonuses 13,655 US$ 39
Remuneration of Management Total base salary plus bonuses and long-term incentives 88,771 US$ 48
Effective Personal Income Tax Rate Percentage of an income equal to GDP per capita 15.50 % 25
Personal Security and Private Property Rights Are adequately protected 6.93 Survey 31
Criteria Value 2016 Rank
Labor Force Growth Percentage change 1.29 % 23
Skilled Labor Is readily available 3.22 Survey [0..10] 61
Finance Skills Are readily available 4.92 Survey [0..10] 57
International Experience Of senior managers is generally significant 4.75 Survey [0..10] 46
Competent Senior Managers Are readily available 3.80 Survey [0..10] 58
Educational System Meets the needs of a competitive economy 6.78 Survey [0..10] 17
Science in Schools Is sufficiently emphasized 6.44 Survey [0..10] 13
University Education Meets the needs of a competitive economy 6.51 Survey [0..10] 23
Management Education Meets the needs of the business community 6.41 Survey [0..10] 26
Language Skills Are meeting the needs of enterprises 7.25 Survey [0..10] 21
Student Mobility Inbound Foreign tertiary-level students per 1000 inhabitants 1.42 number 31
Educational Assessment - PISA PISA survey of 15-year olds 531.00 Value 8
239
36
OverallInvestment & Development
Appeal
31
Factor 1 : Investment and Development
Factor 2 : Appeal
Factor 3 : Readiness
Readiness
9
15 15 16
9
4749
32
37 36
40 39 39
43
3132
37
30
33
23
2012 2013 2014 2015 2016

IMD World Talent Report 2015
39
IMD World Talent Report 2016
5 Best Ranked Criteria 5 Worst Ranked Criteria
FINLAND
Rank 2016
of 61
Criteria Value 2016 Rank
Total Public Expenditure on Education Percentage of GDP 6.43 % 8
Public Expenditure on Education per Pupil (Secondary) Percentage of GDP per capita 34.70 % 2
Pupil-Teacher Ratio (Primary Education) Ratio of students to teaching staff 13.20 ratio 19
Pupil-Teacher Ratio (Secondary Education) Ratio of students to teaching staff 12.71 ratio 30
Apprenticeships Are sufficiently implemented 4.44 Survey [0..10] 36
Employee Training Is a high priority in companies 6.69 Survey [0..10] 14
Female Labor Force Percentage of total labor force 48.46 % 6
Health Infrastructure Meets the needs of society 7.92 Survey [0..10] 11
Criteria Value 2016 Rank
Cost-of-Living Index Index of a basket of goods & services 77.50 index 34
Attracting and Retaining Talents Is a priority in companies 7.06 Survey [0..10] 25
Worker Motivation Is high 6.51 Survey [0..10] 20
Brain Drain Does not hinder competitiveness in your economy 6.54 Survey [0..10] 10
Quality of Life Is high 8.82 Survey [0..10] 15
Foreign High-Skilled People Are attracted to your country's business environment 3.85 Survey [0..10] 47
Remuneration in Services Professions Gross annual income including supplements such as bonuses 36,759 US$ 21
Remuneration of Management Total base salary plus bonuses and long-term incentives 172,200 US$ 24
Effective Personal Income Tax Rate Percentage of an income equal to GDP per capita 28.54 % 57
Personal Security and Private Property Rights Are adequately protected 9.05 Survey 4
Criteria Value 2016 Rank
Labor Force Growth Percentage change 0.37 % 43
Skilled Labor Is readily available 7.53 Survey [0..10] 2
Finance Skills Are readily available 7.32 Survey [0..10] 15
International Experience Of senior managers is generally significant 5.28 Survey [0..10] 34
Competent Senior Managers Are readily available 6.00 Survey [0..10] 22
Educational System Meets the needs of a competitive economy 8.70 Survey [0..10] 2
Science in Schools Is sufficiently emphasized 7.87 Survey [0..10] 3
University Education Meets the needs of a competitive economy 8.00 Survey [0..10] 4
Management Education Meets the needs of the business community 7.03 Survey [0..10] 18
Language Skills Are meeting the needs of enterprises 8.15 Survey [0..10] 9
Student Mobility Inbound Foreign tertiary-level students per 1000 inhabitants 4.01 number 14
Educational Assessment - PISA PISA survey of 15-year olds 532.00 Value 7
65
23
OverallInvestment & Development
Appeal
8
Factor 1 : Investment and Development
Factor 2 : Appeal
Factor 3 : Readiness
Readiness
6
10
7
5 5
3
6
11
21
23
15
13
2
4
8
4 4 4
6 6
2012 2013 2014 2015 2016
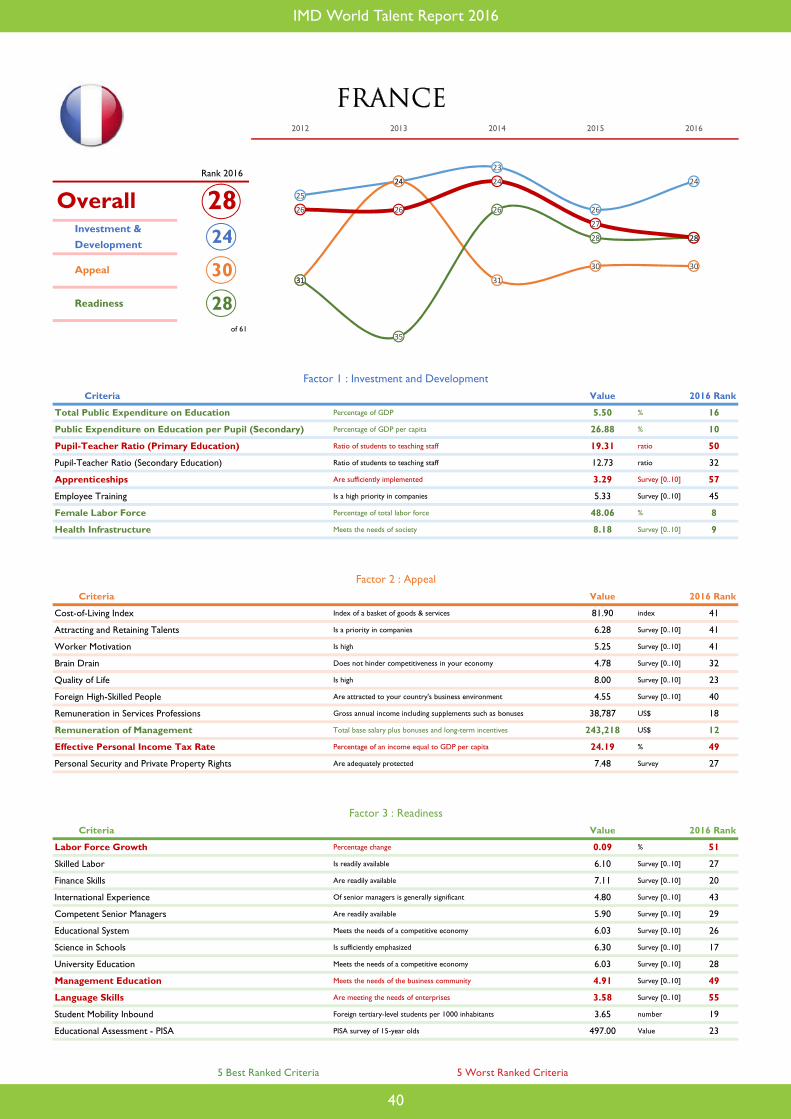
IMD World Talent Report 2016
40
5 Best Ranked Criteria 5 Worst Ranked Criteria
FRANCE
Rank 2016
of 61
Criteria Value 2016 Rank
Total Public Expenditure on Education Percentage of GDP 5.50 % 16
Public Expenditure on Education per Pupil (Secondary) Percentage of GDP per capita 26.88 % 10
Pupil-Teacher Ratio (Primary Education) Ratio of students to teaching staff 19.31 ratio 50
Pupil-Teacher Ratio (Secondary Education) Ratio of students to teaching staff 12.73 ratio 32
Apprenticeships Are sufficiently implemented 3.29 Survey [0..10] 57
Employee Training Is a high priority in companies 5.33 Survey [0..10] 45
Female Labor Force Percentage of total labor force 48.06 % 8
Health Infrastructure Meets the needs of society 8.18 Survey [0..10] 9
Criteria Value 2016 Rank
Cost-of-Living Index Index of a basket of goods & services 81.90 index 41
Attracting and Retaining Talents Is a priority in companies 6.28 Survey [0..10] 41
Worker Motivation Is high 5.25 Survey [0..10] 41
Brain Drain Does not hinder competitiveness in your economy 4.78 Survey [0..10] 32
Quality of Life Is high 8.00 Survey [0..10] 23
Foreign High-Skilled People Are attracted to your country's business environment 4.55 Survey [0..10] 40
Remuneration in Services Professions Gross annual income including supplements such as bonuses 38,787 US$ 18
Remuneration of Management Total base salary plus bonuses and long-term incentives 243,218 US$ 12
Effective Personal Income Tax Rate Percentage of an income equal to GDP per capita 24.19 % 49
Personal Security and Private Property Rights Are adequately protected 7.48 Survey 27
Criteria Value 2016 Rank
Labor Force Growth Percentage change 0.09 % 51
Skilled Labor Is readily available 6.10 Survey [0..10] 27
Finance Skills Are readily available 7.11 Survey [0..10] 20
International Experience Of senior managers is generally significant 4.80 Survey [0..10] 43
Competent Senior Managers Are readily available 5.90 Survey [0..10] 29
Educational System Meets the needs of a competitive economy 6.03 Survey [0..10] 26
Science in Schools Is sufficiently emphasized 6.30 Survey [0..10] 17
University Education Meets the needs of a competitive economy 6.03 Survey [0..10] 28
Management Education Meets the needs of the business community 4.91 Survey [0..10] 49
Language Skills Are meeting the needs of enterprises 3.58 Survey [0..10] 55
Student Mobility Inbound Foreign tertiary-level students per 1000 inhabitants 3.65 number 19
Educational Assessment - PISA PISA survey of 15-year olds 497.00 Value 23
2824
30
OverallInvestment & Development
Appeal
28
Factor 1 : Investment and Development
Factor 2 : Appeal
Factor 3 : Readiness
Readiness
25
24
23
26
24
31
24
31
30 30
31
35
26
28 28
26 26
24
27
28
2012 2013 2014 2015 2016

IMD World Talent Report 2015
41
IMD World Talent Report 2016
5 Best Ranked Criteria 5 Worst Ranked Criteria
GERMANY
Rank 2016
of 61
Criteria Value 2016 Rank
Total Public Expenditure on Education Percentage of GDP 4.20 % 38
Public Expenditure on Education per Pupil (Secondary) Percentage of GDP per capita 23.23 % 21
Pupil-Teacher Ratio (Primary Education) Ratio of students to teaching staff 16.00 ratio 30
Pupil-Teacher Ratio (Secondary Education) Ratio of students to teaching staff 13.49 ratio 39
Apprenticeships Are sufficiently implemented 8.54 Survey [0..10] 2
Employee Training Is a high priority in companies 7.71 Survey [0..10] 2
Female Labor Force Percentage of total labor force 46.67 % 21
Health Infrastructure Meets the needs of society 8.22 Survey [0..10] 0
Criteria Value 2016 Rank
Cost-of-Living Index Index of a basket of goods & services 75.20 index 29
Attracting and Retaining Talents Is a priority in companies 7.60 Survey [0..10] 10
Worker Motivation Is high 7.59 Survey [0..10] 5
Brain Drain Does not hinder competitiveness in your economy 6.36 Survey [0..10] 13
Quality of Life Is high 9.21 Survey [0..10] 9
Foreign High-Skilled People Are attracted to your country's business environment 6.63 Survey [0..10] 16
Remuneration in Services Professions Gross annual income including supplements such as bonuses 42,280 US$ 17
Remuneration of Management Total base salary plus bonuses and long-term incentives 281,992 US$ 3
Effective Personal Income Tax Rate Percentage of an income equal to GDP per capita 26.48 % 54
Personal Security and Private Property Rights Are adequately protected 8.25 Survey 16
Criteria Value 2016 Rank
Labor Force Growth Percentage change 0.31 % 44
Skilled Labor Is readily available 5.59 Survey [0..10] 36
Finance Skills Are readily available 7.14 Survey [0..10] 18
International Experience Of senior managers is generally significant 6.54 Survey [0..10] 14
Competent Senior Managers Are readily available 5.91 Survey [0..10] 28
Educational System Meets the needs of a competitive economy 7.63 Survey [0..10] 10
Science in Schools Is sufficiently emphasized 6.45 Survey [0..10] 12
University Education Meets the needs of a competitive economy 7.59 Survey [0..10] 8
Management Education Meets the needs of the business community 7.03 Survey [0..10] 17
Language Skills Are meeting the needs of enterprises 7.05 Survey [0..10] 22
Student Mobility Inbound Foreign tertiary-level students per 1000 inhabitants 2.42 number 25
Educational Assessment - PISA PISA survey of 15-year olds 519.00 Value 13
1111
8
OverallInvestment & Development
Appeal
19
Factor 1 : Investment and Development
Factor 2 : Appeal
Factor 3 : Readiness
Readiness
13
54
7
11
15
17
2
5
8
3
5
11
17
19
10
6
3
7
11
2012 2013 2014 2015 2016

IMD World Talent Report 2016
42
5 Best Ranked Criteria 5 Worst Ranked Criteria
GREECE
Rank 2016
of 61
Criteria Value 2016 Rank
Total Public Expenditure on Education Percentage of GDP 4.54 % 34
Public Expenditure on Education per Pupil (Secondary) Percentage of GDP per capita - % -
Pupil-Teacher Ratio (Primary Education) Ratio of students to teaching staff 9.49 ratio 2
Pupil-Teacher Ratio (Secondary Education) Ratio of students to teaching staff 7.72 ratio 1
Apprenticeships Are sufficiently implemented 4.31 Survey [0..10] 42
Employee Training Is a high priority in companies 4.94 Survey [0..10] 52
Female Labor Force Percentage of total labor force 44.57 % 39
Health Infrastructure Meets the needs of society 4.56 Survey [0..10] 40
Criteria Value 2016 Rank
Cost-of-Living Index Index of a basket of goods & services 68.60 index 16
Attracting and Retaining Talents Is a priority in companies 5.12 Survey [0..10] 57
Worker Motivation Is high 4.78 Survey [0..10] 52
Brain Drain Does not hinder competitiveness in your economy 3.32 Survey [0..10] 51
Quality of Life Is high 5.73 Survey [0..10] 37
Foreign High-Skilled People Are attracted to your country's business environment 2.33 Survey [0..10] 59
Remuneration in Services Professions Gross annual income including supplements such as bonuses 19,055 US$ 32
Remuneration of Management Total base salary plus bonuses and long-term incentives 166,645 US$ 26
Effective Personal Income Tax Rate Percentage of an income equal to GDP per capita 21.91 % 44
Personal Security and Private Property Rights Are adequately protected 5.64 Survey 43
Criteria Value 2016 Rank
Labor Force Growth Percentage change -0.08 % 54
Skilled Labor Is readily available 6.85 Survey [0..10] 9
Finance Skills Are readily available 6.25 Survey [0..10] 35
International Experience Of senior managers is generally significant 5.39 Survey [0..10] 33
Competent Senior Managers Are readily available 5.53 Survey [0..10] 35
Educational System Meets the needs of a competitive economy 4.55 Survey [0..10] 40
Science in Schools Is sufficiently emphasized 4.88 Survey [0..10] 40
University Education Meets the needs of a competitive economy 4.93 Survey [0..10] 41
Management Education Meets the needs of the business community 5.01 Survey [0..10] 48
Language Skills Are meeting the needs of enterprises 7.75 Survey [0..10] 15
Student Mobility Inbound Foreign tertiary-level students per 1000 inhabitants 2.49 number 23
Educational Assessment - PISA PISA survey of 15-year olds 460.00 Value 39
3625
50
OverallInvestment & Development
Appeal
35
Factor 1 : Investment and Development
Factor 2 : Appeal
Factor 3 : Readiness
Readiness
37
29
3937
25
33
27
54
50 50
53
50
31
24
35
46
33
42
3536
2012 2013 2014 2015 2016

IMD World Talent Report 2015
43
IMD World Talent Report 2016
5 Best Ranked Criteria 5 Worst Ranked Criteria
HUNGARY
Rank 2016
of 61
Criteria Value 2016 Rank
Total Public Expenditure on Education Percentage of GDP 4.68 % 33
Public Expenditure on Education per Pupil (Secondary) Percentage of GDP per capita 19.73 % 32
Pupil-Teacher Ratio (Primary Education) Ratio of students to teaching staff 10.40 ratio 5
Pupil-Teacher Ratio (Secondary Education) Ratio of students to teaching staff 11.26 ratio 21
Apprenticeships Are sufficiently implemented 3.45 Survey [0..10] 55
Employee Training Is a high priority in companies 4.75 Survey [0..10] 56
Female Labor Force Percentage of total labor force 45.88 % 32
Health Infrastructure Meets the needs of society 2.55 Survey [0..10] 55
Criteria Value 2016 Rank
Cost-of-Living Index Index of a basket of goods & services 62.70 index 7
Attracting and Retaining Talents Is a priority in companies 5.78 Survey [0..10] 47
Worker Motivation Is high 4.07 Survey [0..10] 58
Brain Drain Does not hinder competitiveness in your economy 1.56 Survey [0..10] 60
Quality of Life Is high 3.69 Survey [0..10] 57
Foreign High-Skilled People Are attracted to your country's business environment 3.42 Survey [0..10] 54
Remuneration in Services Professions Gross annual income including supplements such as bonuses 12,168 US$ 49
Remuneration of Management Total base salary plus bonuses and long-term incentives 80,286 US$ 49
Effective Personal Income Tax Rate Percentage of an income equal to GDP per capita 29.06 % 58
Personal Security and Private Property Rights Are adequately protected 5.50 Survey 44
Criteria Value 2016 Rank
Labor Force Growth Percentage change 1.30 % 22
Skilled Labor Is readily available 3.56 Survey [0..10] 59
Finance Skills Are readily available 4.69 Survey [0..10] 58
International Experience Of senior managers is generally significant 5.07 Survey [0..10] 35
Competent Senior Managers Are readily available 3.12 Survey [0..10] 61
Educational System Meets the needs of a competitive economy 3.65 Survey [0..10] 53
Science in Schools Is sufficiently emphasized 4.11 Survey [0..10] 48
University Education Meets the needs of a competitive economy 4.73 Survey [0..10] 44
Management Education Meets the needs of the business community 4.79 Survey [0..10] 51
Language Skills Are meeting the needs of enterprises 3.13 Survey [0..10] 58
Student Mobility Inbound Foreign tertiary-level students per 1000 inhabitants 2.09 number 26
Educational Assessment - PISA PISA survey of 15-year olds 485.50 Value 32
5037
60
OverallInvestment & Development
Appeal
53
Factor 1 : Investment and Development
Factor 2 : Appeal
Factor 3 : Readiness
Readiness
19
2826
42
37
40
52
56
59 60
5052 52 53 53
39
4951
56
50
2012 2013 2014 2015 2016

IMD World Talent Report 2016
44
5 Best Ranked Criteria 5 Worst Ranked Criteria
ICELAND
Rank 2016
of 61
Criteria Value 2016 Rank
Total Public Expenditure on Education Percentage of GDP 7.65 % 1
Public Expenditure on Education per Pupil (Secondary) Percentage of GDP per capita 20.24 % 31
Pupil-Teacher Ratio (Primary Education) Ratio of students to teaching staff 10.43 ratio 6
Pupil-Teacher Ratio (Secondary Education) Ratio of students to teaching staff 11.10 ratio 19
Apprenticeships Are sufficiently implemented 4.40 Survey [0..10] 38
Employee Training Is a high priority in companies 5.38 Survey [0..10] 43
Female Labor Force Percentage of total labor force 47.71 % 10
Health Infrastructure Meets the needs of society 6.16 Survey [0..10] 30
Criteria Value 2016 Rank
Cost-of-Living Index Index of a basket of goods & services - index -
Attracting and Retaining Talents Is a priority in companies 7.06 Survey [0..10] 25
Worker Motivation Is high 6.76 Survey [0..10] 16
Brain Drain Does not hinder competitiveness in your economy 5.92 Survey [0..10] 17
Quality of Life Is high 9.17 Survey [0..10] 11
Foreign High-Skilled People Are attracted to your country's business environment 3.64 Survey [0..10] 49
Remuneration in Services Professions Gross annual income including supplements such as bonuses 47,368 US$ 8
Remuneration of Management Total base salary plus bonuses and long-term incentives 78,806 US$ 46
Effective Personal Income Tax Rate Percentage of an income equal to GDP per capita 15.54 % 26
Personal Security and Private Property Rights Are adequately protected 8.24 Survey 17
Criteria Value 2016 Rank
Labor Force Growth Percentage change 2.33 % 7
Skilled Labor Is readily available 6.21 Survey [0..10] 24
Finance Skills Are readily available 6.89 Survey [0..10] 24
International Experience Of senior managers is generally significant 4.96 Survey [0..10] 39
Competent Senior Managers Are readily available 5.68 Survey [0..10] 33
Educational System Meets the needs of a competitive economy 7.38 Survey [0..10] 14
Science in Schools Is sufficiently emphasized 6.00 Survey [0..10] 20
University Education Meets the needs of a competitive economy 7.40 Survey [0..10] 13
Management Education Meets the needs of the business community 7.24 Survey [0..10] 11
Language Skills Are meeting the needs of enterprises 8.49 Survey [0..10] 6
Student Mobility Inbound Foreign tertiary-level students per 1000 inhabitants 3.68 number 18
Educational Assessment - PISA PISA survey of 15-year olds 485.50 Value 33
1612
20
OverallInvestment & Development
Appeal
17
Factor 1 : Investment and Development
Factor 2 : Appeal
Factor 3 : Readiness
Readiness
3
6
8
14
1212
2221
23
20
25
23
14
1817
12
18
14
1716
2012 2013 2014 2015 2016

IMD World Talent Report 2015
45
IMD World Talent Report 2016
5 Best Ranked Criteria 5 Worst Ranked Criteria
INDIA
Rank 2016
of 61
Criteria Value 2016 Rank
Total Public Expenditure on Education Percentage of GDP 3.10 % 55
Public Expenditure on Education per Pupil (Secondary) Percentage of GDP per capita 15.19 % 49
Pupil-Teacher Ratio (Primary Education) Ratio of students to teaching staff 41.00 ratio 61
Pupil-Teacher Ratio (Secondary Education) Ratio of students to teaching staff 32.00 ratio 60
Apprenticeships Are sufficiently implemented 4.84 Survey [0..10] 26
Employee Training Is a high priority in companies 5.26 Survey [0..10] 46
Female Labor Force Percentage of total labor force 23.19 % 56
Health Infrastructure Meets the needs of society 3.85 Survey [0..10] 48
Criteria Value 2016 Rank
Cost-of-Living Index Index of a basket of goods & services 76.50 index 31
Attracting and Retaining Talents Is a priority in companies 6.75 Survey [0..10] 31
Worker Motivation Is high 5.78 Survey [0..10] 36
Brain Drain Does not hinder competitiveness in your economy 4.91 Survey [0..10] 30
Quality of Life Is high 4.58 Survey [0..10] 51
Foreign High-Skilled People Are attracted to your country's business environment 5.07 Survey [0..10] 29
Remuneration in Services Professions Gross annual income including supplements such as bonuses 7,063 US$ 57
Remuneration of Management Total base salary plus bonuses and long-term incentives 94,535 US$ 45
Effective Personal Income Tax Rate Percentage of an income equal to GDP per capita 11.38 % 16
Personal Security and Private Property Rights Are adequately protected 6.19 Survey 36
Criteria Value 2016 Rank
Labor Force Growth Percentage change 1.82 % 13
Skilled Labor Is readily available 5.89 Survey [0..10] 32
Finance Skills Are readily available 6.63 Survey [0..10] 28
International Experience Of senior managers is generally significant 5.06 Survey [0..10] 37
Competent Senior Managers Are readily available 5.98 Survey [0..10] 24
Educational System Meets the needs of a competitive economy 5.46 Survey [0..10] 34
Science in Schools Is sufficiently emphasized 6.22 Survey [0..10] 18
University Education Meets the needs of a competitive economy 5.77 Survey [0..10] 30
Management Education Meets the needs of the business community 6.62 Survey [0..10] 22
Language Skills Are meeting the needs of enterprises 6.92 Survey [0..10] 24
Student Mobility Inbound Foreign tertiary-level students per 1000 inhabitants 0.03 number 58
Educational Assessment - PISA PISA survey of 15-year olds - Value -
6061
41
OverallInvestment & Development
Appeal
27
Factor 1 : Investment and Development
Factor 2 : Appeal
Factor 3 : Readiness
Readiness
59 60 60 61 61
22
26
29
40 41
22
28 27
36
27
34
42
48
52
60
2012 2013 2014 2015 2016

IMD World Talent Report 2016
46
5 Best Ranked Criteria 5 Worst Ranked Criteria
INDONESIA
Rank 2016
of 61
Criteria Value 2016 Rank
Total Public Expenditure on Education Percentage of GDP 3.55 % 48
Public Expenditure on Education per Pupil (Secondary) Percentage of GDP per capita 9.81 % 57
Pupil-Teacher Ratio (Primary Education) Ratio of students to teaching staff 16.09 ratio 33
Pupil-Teacher Ratio (Secondary Education) Ratio of students to teaching staff 15.38 ratio 46
Apprenticeships Are sufficiently implemented 4.05 Survey [0..10] 45
Employee Training Is a high priority in companies 4.78 Survey [0..10] 55
Female Labor Force Percentage of total labor force 37.24 % 54
Health Infrastructure Meets the needs of society 4.56 Survey [0..10] 39
Criteria Value 2016 Rank
Cost-of-Living Index Index of a basket of goods & services 73.40 index 24
Attracting and Retaining Talents Is a priority in companies 6.96 Survey [0..10] 27
Worker Motivation Is high 6.03 Survey [0..10] 33
Brain Drain Does not hinder competitiveness in your economy 6.24 Survey [0..10] 14
Quality of Life Is high 5.45 Survey [0..10] 40
Foreign High-Skilled People Are attracted to your country's business environment 4.89 Survey [0..10] 31
Remuneration in Services Professions Gross annual income including supplements such as bonuses 4,993 US$ 59
Remuneration of Management Total base salary plus bonuses and long-term incentives 76,522 US$ 53
Effective Personal Income Tax Rate Percentage of an income equal to GDP per capita 3.04 % 3
Personal Security and Private Property Rights Are adequately protected 6.00 Survey 38
Criteria Value 2016 Rank
Labor Force Growth Percentage change 0.42 % 39
Skilled Labor Is readily available 5.54 Survey [0..10] 38
Finance Skills Are readily available 6.45 Survey [0..10] 32
International Experience Of senior managers is generally significant 4.49 Survey [0..10] 51
Competent Senior Managers Are readily available 5.04 Survey [0..10] 45
Educational System Meets the needs of a competitive economy 5.17 Survey [0..10] 36
Science in Schools Is sufficiently emphasized 5.57 Survey [0..10] 28
University Education Meets the needs of a competitive economy 6.21 Survey [0..10] 25
Management Education Meets the needs of the business community 6.13 Survey [0..10] 31
Language Skills Are meeting the needs of enterprises 5.81 Survey [0..10] 35
Student Mobility Inbound Foreign tertiary-level students per 1000 inhabitants 0.03 number 57
Educational Assessment - PISA PISA survey of 15-year olds 378.50 Value 54
4452
31
OverallInvestment & Development
Appeal
47
Factor 1 : Investment and Development
Factor 2 : Appeal
Factor 3 : Readiness
Readiness47
4647
49
52
42
33
2628
31
36
33
19
42
47
42
32
25
41
44
2012 2013 2014 2015 2016
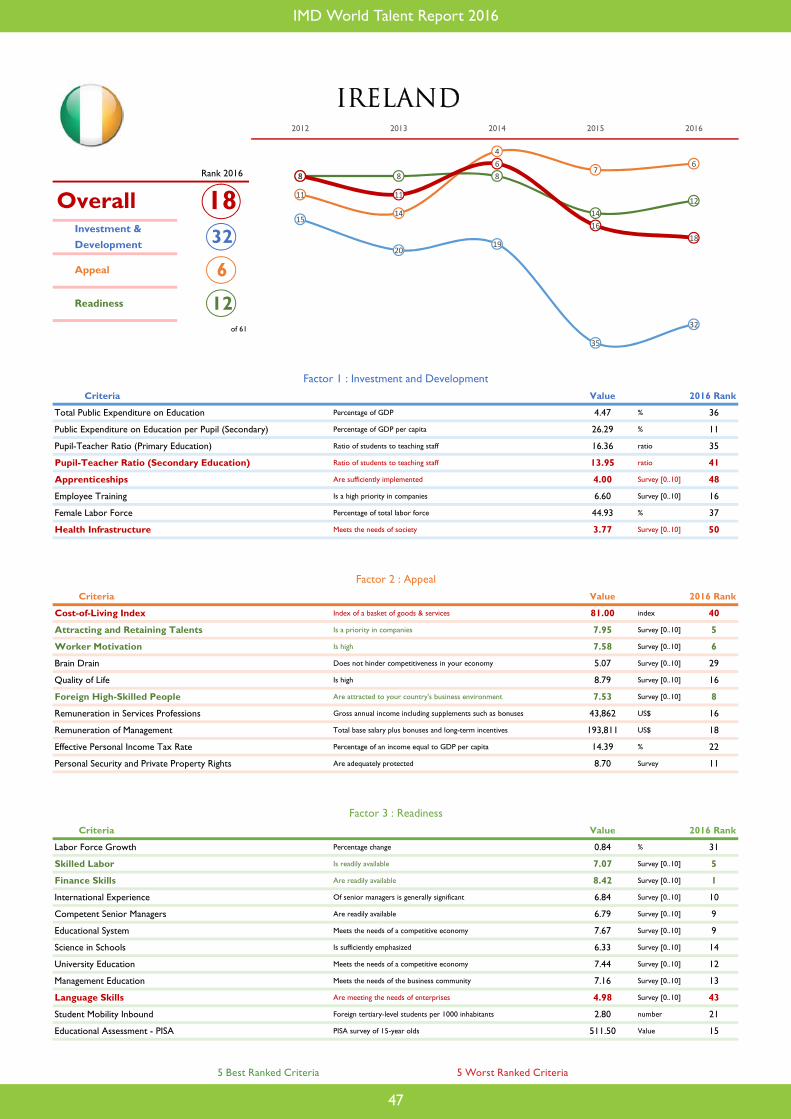
IMD World Talent Report 2015
47
IMD World Talent Report 2016
5 Best Ranked Criteria 5 Worst Ranked Criteria
IRELAND
Rank 2016
of 61
Criteria Value 2016 Rank
Total Public Expenditure on Education Percentage of GDP 4.47 % 36
Public Expenditure on Education per Pupil (Secondary) Percentage of GDP per capita 26.29 % 11
Pupil-Teacher Ratio (Primary Education) Ratio of students to teaching staff 16.36 ratio 35
Pupil-Teacher Ratio (Secondary Education) Ratio of students to teaching staff 13.95 ratio 41
Apprenticeships Are sufficiently implemented 4.00 Survey [0..10] 48
Employee Training Is a high priority in companies 6.60 Survey [0..10] 16
Female Labor Force Percentage of total labor force 44.93 % 37
Health Infrastructure Meets the needs of society 3.77 Survey [0..10] 50
Criteria Value 2016 Rank
Cost-of-Living Index Index of a basket of goods & services 81.00 index 40
Attracting and Retaining Talents Is a priority in companies 7.95 Survey [0..10] 5
Worker Motivation Is high 7.58 Survey [0..10] 6
Brain Drain Does not hinder competitiveness in your economy 5.07 Survey [0..10] 29
Quality of Life Is high 8.79 Survey [0..10] 16
Foreign High-Skilled People Are attracted to your country's business environment 7.53 Survey [0..10] 8
Remuneration in Services Professions Gross annual income including supplements such as bonuses 43,862 US$ 16
Remuneration of Management Total base salary plus bonuses and long-term incentives 193,811 US$ 18
Effective Personal Income Tax Rate Percentage of an income equal to GDP per capita 14.39 % 22
Personal Security and Private Property Rights Are adequately protected 8.70 Survey 11
Criteria Value 2016 Rank
Labor Force Growth Percentage change 0.84 % 31
Skilled Labor Is readily available 7.07 Survey [0..10] 5
Finance Skills Are readily available 8.42 Survey [0..10] 1
International Experience Of senior managers is generally significant 6.84 Survey [0..10] 10
Competent Senior Managers Are readily available 6.79 Survey [0..10] 9
Educational System Meets the needs of a competitive economy 7.67 Survey [0..10] 9
Science in Schools Is sufficiently emphasized 6.33 Survey [0..10] 14
University Education Meets the needs of a competitive economy 7.44 Survey [0..10] 12
Management Education Meets the needs of the business community 7.16 Survey [0..10] 13
Language Skills Are meeting the needs of enterprises 4.98 Survey [0..10] 43
Student Mobility Inbound Foreign tertiary-level students per 1000 inhabitants 2.80 number 21
Educational Assessment - PISA PISA survey of 15-year olds 511.50 Value 15
1832
6
OverallInvestment & Development
Appeal
12
Factor 1 : Investment and Development
Factor 2 : Appeal
Factor 3 : Readiness
Readiness
15
2019
35
32
11
14
4
76
8 8 8
1412
8
11
6
1618
2012 2013 2014 2015 2016

IMD World Talent Report 2016
48
5 Best Ranked Criteria 5 Worst Ranked Criteria
ISRAEL
Rank 2016
of 61
Criteria Value 2016 Rank
Total Public Expenditure on Education Percentage of GDP 6.28 % 10
Public Expenditure on Education per Pupil (Secondary) Percentage of GDP per capita 15.46 % 47
Pupil-Teacher Ratio (Primary Education) Ratio of students to teaching staff 15.27 ratio 27
Pupil-Teacher Ratio (Secondary Education) Ratio of students to teaching staff 12.00 ratio 26
Apprenticeships Are sufficiently implemented 4.81 Survey [0..10] 27
Employee Training Is a high priority in companies 5.83 Survey [0..10] 30
Female Labor Force Percentage of total labor force 47.15 % 15
Health Infrastructure Meets the needs of society 7.03 Survey [0..10] 23
Criteria Value 2016 Rank
Cost-of-Living Index Index of a basket of goods & services 93.80 index 50
Attracting and Retaining Talents Is a priority in companies 7.08 Survey [0..10] 23
Worker Motivation Is high 6.65 Survey [0..10] 19
Brain Drain Does not hinder competitiveness in your economy 5.83 Survey [0..10] 18
Quality of Life Is high 7.56 Survey [0..10] 26
Foreign High-Skilled People Are attracted to your country's business environment 5.28 Survey [0..10] 27
Remuneration in Services Professions Gross annual income including supplements such as bonuses 35,176 US$ 22
Remuneration of Management Total base salary plus bonuses and long-term incentives 152,518 US$ 28
Effective Personal Income Tax Rate Percentage of an income equal to GDP per capita 15.88 % 27
Personal Security and Private Property Rights Are adequately protected 7.94 Survey 23
Criteria Value 2016 Rank
Labor Force Growth Percentage change 1.78 % 14
Skilled Labor Is readily available 6.56 Survey [0..10] 14
Finance Skills Are readily available 7.14 Survey [0..10] 19
International Experience Of senior managers is generally significant 6.06 Survey [0..10] 17
Competent Senior Managers Are readily available 6.27 Survey [0..10] 19
Educational System Meets the needs of a competitive economy 6.43 Survey [0..10] 20
Science in Schools Is sufficiently emphasized 6.06 Survey [0..10] 19
University Education Meets the needs of a competitive economy 7.61 Survey [0..10] 7
Management Education Meets the needs of the business community 7.19 Survey [0..10] 12
Language Skills Are meeting the needs of enterprises 7.84 Survey [0..10] 14
Student Mobility Inbound Foreign tertiary-level students per 1000 inhabitants 0.57 number 47
Educational Assessment - PISA PISA survey of 15-year olds 468.00 Value 38
2123
25
OverallInvestment & Development
Appeal
22
Factor 1 : Investment and Development
Factor 2 : Appeal
Factor 3 : Readiness
Readiness
12
17
2122
23
7 7
22
2425
27
24
13 13
22
17
15
18
2221
2012 2013 2014 2015 2016

IMD World Talent Report 2015
49
IMD World Talent Report 2016
5 Best Ranked Criteria 5 Worst Ranked Criteria
ITALY
Rank 2016
of 61
Criteria Value 2016 Rank
Total Public Expenditure on Education Percentage of GDP 4.09 % 40
Public Expenditure on Education per Pupil (Secondary) Percentage of GDP per capita 22.82 % 24
Pupil-Teacher Ratio (Primary Education) Ratio of students to teaching staff 12.35 ratio 13
Pupil-Teacher Ratio (Secondary Education) Ratio of students to teaching staff 12.19 ratio 28
Apprenticeships Are sufficiently implemented 4.80 Survey [0..10] 28
Employee Training Is a high priority in companies 4.57 Survey [0..10] 57
Female Labor Force Percentage of total labor force 42.14 % 47
Health Infrastructure Meets the needs of society 6.70 Survey [0..10] 27
Criteria Value 2016 Rank
Cost-of-Living Index Index of a basket of goods & services 80.10 index 38
Attracting and Retaining Talents Is a priority in companies 5.61 Survey [0..10] 49
Worker Motivation Is high 5.47 Survey [0..10] 39
Brain Drain Does not hinder competitiveness in your economy 4.86 Survey [0..10] 31
Quality of Life Is high 7.21 Survey [0..10] 28
Foreign High-Skilled People Are attracted to your country's business environment 3.64 Survey [0..10] 50
Remuneration in Services Professions Gross annual income including supplements such as bonuses 32,479 US$ 26
Remuneration of Management Total base salary plus bonuses and long-term incentives 236,768 US$ 11
Effective Personal Income Tax Rate Percentage of an income equal to GDP per capita 23.61 % 48
Personal Security and Private Property Rights Are adequately protected 5.85 Survey 41
Criteria Value 2016 Rank
Labor Force Growth Percentage change -0.07 % 52
Skilled Labor Is readily available 6.64 Survey [0..10] 12
Finance Skills Are readily available 6.11 Survey [0..10] 37
International Experience Of senior managers is generally significant 4.88 Survey [0..10] 41
Competent Senior Managers Are readily available 5.99 Survey [0..10] 23
Educational System Meets the needs of a competitive economy 5.85 Survey [0..10] 28
Science in Schools Is sufficiently emphasized 5.52 Survey [0..10] 30
University Education Meets the needs of a competitive economy 6.07 Survey [0..10] 27
Management Education Meets the needs of the business community 5.61 Survey [0..10] 38
Language Skills Are meeting the needs of enterprises 4.43 Survey [0..10] 49
Student Mobility Inbound Foreign tertiary-level students per 1000 inhabitants 1.38 number 33
Educational Assessment - PISA PISA survey of 15-year olds 489.50 Value 28
3433
37
OverallInvestment & Development
Appeal
32
Factor 1 : Investment and Development
Factor 2 : Appeal
Factor 3 : Readiness
Readiness
27
38 3839
3334
41
51
47
37
49 49
44
40
32
37
43
47
42
34
2012 2013 2014 2015 2016

IMD World Talent Report 2016
50
5 Best Ranked Criteria 5 Worst Ranked Criteria
JAPAN
Rank 2016
of 61
Criteria Value 2016 Rank
Total Public Expenditure on Education Percentage of GDP 3.53 % 49
Public Expenditure on Education per Pupil (Secondary) Percentage of GDP per capita 25.67 % 15
Pupil-Teacher Ratio (Primary Education) Ratio of students to teaching staff 17.40 ratio 44
Pupil-Teacher Ratio (Secondary Education) Ratio of students to teaching staff 12.72 ratio 31
Apprenticeships Are sufficiently implemented 6.94 Survey [0..10] 4
Employee Training Is a high priority in companies 7.25 Survey [0..10] 5
Female Labor Force Percentage of total labor force 43.07 % 43
Health Infrastructure Meets the needs of society 7.45 Survey [0..10] 18
Criteria Value 2016 Rank
Cost-of-Living Index Index of a basket of goods & services 103.20 index 54
Attracting and Retaining Talents Is a priority in companies 7.79 Survey [0..10] 8
Worker Motivation Is high 7.08 Survey [0..10] 10
Brain Drain Does not hinder competitiveness in your economy 4.42 Survey [0..10] 35
Quality of Life Is high 8.11 Survey [0..10] 20
Foreign High-Skilled People Are attracted to your country's business environment 3.56 Survey [0..10] 52
Remuneration in Services Professions Gross annual income including supplements such as bonuses 48,176 US$ 7
Remuneration of Management Total base salary plus bonuses and long-term incentives 232,629 US$ 10
Effective Personal Income Tax Rate Percentage of an income equal to GDP per capita 17.47 % 29
Personal Security and Private Property Rights Are adequately protected 8.04 Survey 21
Criteria Value 2016 Rank
Labor Force Growth Percentage change 0.17 % 49
Skilled Labor Is readily available 4.73 Survey [0..10] 50
Finance Skills Are readily available 6.06 Survey [0..10] 39
International Experience Of senior managers is generally significant 2.77 Survey [0..10] 61
Competent Senior Managers Are readily available 3.31 Survey [0..10] 60
Educational System Meets the needs of a competitive economy 5.70 Survey [0..10] 29
Science in Schools Is sufficiently emphasized 5.87 Survey [0..10] 22
University Education Meets the needs of a competitive economy 4.43 Survey [0..10] 50
Management Education Meets the needs of the business community 4.32 Survey [0..10] 57
Language Skills Are meeting the needs of enterprises 2.90 Survey [0..10] 61
Student Mobility Inbound Foreign tertiary-level students per 1000 inhabitants 1.07 number 41
Educational Assessment - PISA PISA survey of 15-year olds 541.50 Value 5
3019
21
OverallInvestment & Development
Appeal
52
Factor 1 : Investment and Development
Factor 2 : Appeal
Factor 3 : Readiness
Readiness
29
21
18 1719
49 48
24
15
21
37
34
45
49
52
41
35
2826
30
2012 2013 2014 2015 2016
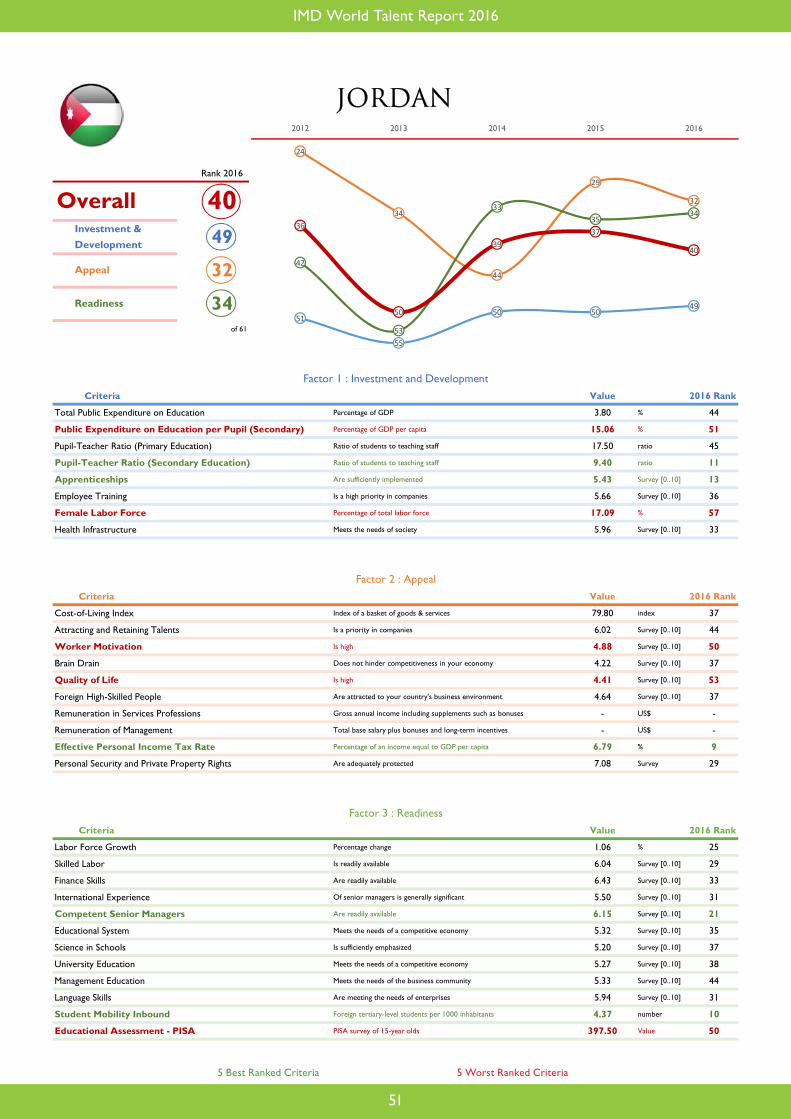
IMD World Talent Report 2015
51
IMD World Talent Report 2016
5 Best Ranked Criteria 5 Worst Ranked Criteria
JORDAN
Rank 2016
of 61
Criteria Value 2016 Rank
Total Public Expenditure on Education Percentage of GDP 3.80 % 44
Public Expenditure on Education per Pupil (Secondary) Percentage of GDP per capita 15.06 % 51
Pupil-Teacher Ratio (Primary Education) Ratio of students to teaching staff 17.50 ratio 45
Pupil-Teacher Ratio (Secondary Education) Ratio of students to teaching staff 9.40 ratio 11
Apprenticeships Are sufficiently implemented 5.43 Survey [0..10] 13
Employee Training Is a high priority in companies 5.66 Survey [0..10] 36
Female Labor Force Percentage of total labor force 17.09 % 57
Health Infrastructure Meets the needs of society 5.96 Survey [0..10] 33
Criteria Value 2016 Rank
Cost-of-Living Index Index of a basket of goods & services 79.80 index 37
Attracting and Retaining Talents Is a priority in companies 6.02 Survey [0..10] 44
Worker Motivation Is high 4.88 Survey [0..10] 50
Brain Drain Does not hinder competitiveness in your economy 4.22 Survey [0..10] 37
Quality of Life Is high 4.41 Survey [0..10] 53
Foreign High-Skilled People Are attracted to your country's business environment 4.64 Survey [0..10] 37
Remuneration in Services Professions Gross annual income including supplements such as bonuses - US$ -
Remuneration of Management Total base salary plus bonuses and long-term incentives - US$ -
Effective Personal Income Tax Rate Percentage of an income equal to GDP per capita 6.79 % 9
Personal Security and Private Property Rights Are adequately protected 7.08 Survey 29
Criteria Value 2016 Rank
Labor Force Growth Percentage change 1.06 % 25
Skilled Labor Is readily available 6.04 Survey [0..10] 29
Finance Skills Are readily available 6.43 Survey [0..10] 33
International Experience Of senior managers is generally significant 5.50 Survey [0..10] 31
Competent Senior Managers Are readily available 6.15 Survey [0..10] 21
Educational System Meets the needs of a competitive economy 5.32 Survey [0..10] 35
Science in Schools Is sufficiently emphasized 5.20 Survey [0..10] 37
University Education Meets the needs of a competitive economy 5.27 Survey [0..10] 38
Management Education Meets the needs of the business community 5.33 Survey [0..10] 44
Language Skills Are meeting the needs of enterprises 5.94 Survey [0..10] 31
Student Mobility Inbound Foreign tertiary-level students per 1000 inhabitants 4.37 number 10
Educational Assessment - PISA PISA survey of 15-year olds 397.50 Value 50
4049
32
OverallInvestment & Development
Appeal
34
Factor 1 : Investment and Development
Factor 2 : Appeal
Factor 3 : Readiness
Readiness51
55
50 5049
24
34
44
29
32
42
53
3335
3436
50
3937
40
2012 2013 2014 2015 2016

IMD World Talent Report 2016
52
5 Best Ranked Criteria 5 Worst Ranked Criteria
KAZAKHSTAN
Rank 2016
of 61
Criteria Value 2016 Rank
Total Public Expenditure on Education Percentage of GDP 3.42 % 50
Public Expenditure on Education per Pupil (Secondary) Percentage of GDP per capita 11.17 % 54
Pupil-Teacher Ratio (Primary Education) Ratio of students to teaching staff 16.48 ratio 37
Pupil-Teacher Ratio (Secondary Education) Ratio of students to teaching staff 8.73 ratio 6
Apprenticeships Are sufficiently implemented 4.80 Survey [0..10] 29
Employee Training Is a high priority in companies 5.69 Survey [0..10] 34
Female Labor Force Percentage of total labor force 48.09 % 7
Health Infrastructure Meets the needs of society 4.16 Survey [0..10] 44
Criteria Value 2016 Rank
Cost-of-Living Index Index of a basket of goods & services 74.00 index 27
Attracting and Retaining Talents Is a priority in companies 5.38 Survey [0..10] 53
Worker Motivation Is high 4.90 Survey [0..10] 49
Brain Drain Does not hinder competitiveness in your economy 2.95 Survey [0..10] 54
Quality of Life Is high 4.46 Survey [0..10] 52
Foreign High-Skilled People Are attracted to your country's business environment 6.61 Survey [0..10] 17
Remuneration in Services Professions Gross annual income including supplements such as bonuses 13,820 US$ 44
Remuneration of Management Total base salary plus bonuses and long-term incentives 20,904 US$ 57
Effective Personal Income Tax Rate Percentage of an income equal to GDP per capita 18.00 % 30
Personal Security and Private Property Rights Are adequately protected 5.30 Survey 45
Criteria Value 2016 Rank
Labor Force Growth Percentage change 0.67 % 36
Skilled Labor Is readily available 5.56 Survey [0..10] 37
Finance Skills Are readily available 6.33 Survey [0..10] 34
International Experience Of senior managers is generally significant 4.80 Survey [0..10] 44
Competent Senior Managers Are readily available 5.69 Survey [0..10] 32
Educational System Meets the needs of a competitive economy 4.34 Survey [0..10] 43
Science in Schools Is sufficiently emphasized 4.78 Survey [0..10] 41
University Education Meets the needs of a competitive economy 4.37 Survey [0..10] 52
Management Education Meets the needs of the business community 4.45 Survey [0..10] 56
Language Skills Are meeting the needs of enterprises 4.70 Survey [0..10] 47
Student Mobility Inbound Foreign tertiary-level students per 1000 inhabitants 0.51 number 49
Educational Assessment - PISA PISA survey of 15-year olds 428.50 Value 46
4843
55
OverallInvestment & Development
Appeal
51
Factor 1 : Investment and Development
Factor 2 : Appeal
Factor 3 : Readiness
Readiness
39
35
30
34
43
27
36
39
43
55
3941
3234
51
28
38
32
36
48
2012 2013 2014 2015 2016

IMD World Talent Report 2015
53
IMD World Talent Report 2016
5 Best Ranked Criteria 5 Worst Ranked Criteria
KOREA REP.
Rank 2016
of 61
Criteria Value 2016 Rank
Total Public Expenditure on Education Percentage of GDP 4.93 % 30
Public Expenditure on Education per Pupil (Secondary) Percentage of GDP per capita 23.37 % 20
Pupil-Teacher Ratio (Primary Education) Ratio of students to teaching staff 17.31 ratio 43
Pupil-Teacher Ratio (Secondary Education) Ratio of students to teaching staff 16.18 ratio 48
Apprenticeships Are sufficiently implemented 4.17 Survey [0..10] 44
Employee Training Is a high priority in companies 5.47 Survey [0..10] 42
Female Labor Force Percentage of total labor force 42.25 % 45
Health Infrastructure Meets the needs of society 7.02 Survey [0..10] 24
Criteria Value 2016 Rank
Cost-of-Living Index Index of a basket of goods & services 107.00 index 55
Attracting and Retaining Talents Is a priority in companies 7.22 Survey [0..10] 21
Worker Motivation Is high 3.91 Survey [0..10] 59
Brain Drain Does not hinder competitiveness in your economy 3.60 Survey [0..10] 46
Quality of Life Is high 4.95 Survey [0..10] 47
Foreign High-Skilled People Are attracted to your country's business environment 3.94 Survey [0..10] 46
Remuneration in Services Professions Gross annual income including supplements such as bonuses 32,849 US$ 23
Remuneration of Management Total base salary plus bonuses and long-term incentives 215,886 US$ 16
Effective Personal Income Tax Rate Percentage of an income equal to GDP per capita 9.59 % 12
Personal Security and Private Property Rights Are adequately protected 6.10 Survey 37
Criteria Value 2016 Rank
Labor Force Growth Percentage change 1.42 % 19
Skilled Labor Is readily available 5.01 Survey [0..10] 48
Finance Skills Are readily available 5.67 Survey [0..10] 45
International Experience Of senior managers is generally significant 4.44 Survey [0..10] 52
Competent Senior Managers Are readily available 4.02 Survey [0..10] 52
Educational System Meets the needs of a competitive economy 4.99 Survey [0..10] 38
Science in Schools Is sufficiently emphasized 5.35 Survey [0..10] 33
University Education Meets the needs of a competitive economy 4.21 Survey [0..10] 55
Management Education Meets the needs of the business community 4.74 Survey [0..10] 52
Language Skills Are meeting the needs of enterprises 5.88 Survey [0..10] 33
Student Mobility Inbound Foreign tertiary-level students per 1000 inhabitants 1.18 number 38
Educational Assessment - PISA PISA survey of 15-year olds 546.00 Value 4
3835
43
OverallInvestment & Development
Appeal
42
Factor 1 : Investment and Development
Factor 2 : Appeal
Factor 3 : Readiness
Readiness
35
41
43
32
35
38 38
50
32
43
33
3837
31
42
33
3940
31
38
2012 2013 2014 2015 2016

IMD World Talent Report 2016
54
5 Best Ranked Criteria 5 Worst Ranked Criteria
LATVIA
Rank 2016
of 61
Criteria Value 2016 Rank
Total Public Expenditure on Education Percentage of GDP 5.55 % 15
Public Expenditure on Education per Pupil (Secondary) Percentage of GDP per capita 17.24 % 41
Pupil-Teacher Ratio (Primary Education) Ratio of students to teaching staff 11.16 ratio 8
Pupil-Teacher Ratio (Secondary Education) Ratio of students to teaching staff 8.33 ratio 4
Apprenticeships Are sufficiently implemented 5.37 Survey [0..10] 15
Employee Training Is a high priority in companies 6.05 Survey [0..10] 24
Female Labor Force Percentage of total labor force 49.78 % 2
Health Infrastructure Meets the needs of society 3.68 Survey [0..10] 51
Criteria Value 2016 Rank
Cost-of-Living Index Index of a basket of goods & services 72.00 index 21
Attracting and Retaining Talents Is a priority in companies 6.47 Survey [0..10] 35
Worker Motivation Is high 5.21 Survey [0..10] 43
Brain Drain Does not hinder competitiveness in your economy 3.42 Survey [0..10] 48
Quality of Life Is high 5.37 Survey [0..10] 42
Foreign High-Skilled People Are attracted to your country's business environment 4.84 Survey [0..10] 33
Remuneration in Services Professions Gross annual income including supplements such as bonuses 12,789 US$ 47
Remuneration of Management Total base salary plus bonuses and long-term incentives - US$ -
Effective Personal Income Tax Rate Percentage of an income equal to GDP per capita 21.54 % 42
Personal Security and Private Property Rights Are adequately protected 6.00 Survey 38
Criteria Value 2016 Rank
Labor Force Growth Percentage change 0.19 % 48
Skilled Labor Is readily available 5.16 Survey [0..10] 45
Finance Skills Are readily available 6.00 Survey [0..10] 41
International Experience Of senior managers is generally significant 5.58 Survey [0..10] 30
Competent Senior Managers Are readily available 5.00 Survey [0..10] 46
Educational System Meets the needs of a competitive economy 4.21 Survey [0..10] 46
Science in Schools Is sufficiently emphasized 3.58 Survey [0..10] 53
University Education Meets the needs of a competitive economy 4.86 Survey [0..10] 43
Management Education Meets the needs of the business community 5.53 Survey [0..10] 39
Language Skills Are meeting the needs of enterprises 7.32 Survey [0..10] 20
Student Mobility Inbound Foreign tertiary-level students per 1000 inhabitants 1.73 number 29
Educational Assessment - PISA PISA survey of 15-year olds 496.50 Value 24
3317
45
OverallInvestment & Development
Appeal
41
Factor 1 : Investment and Development
Factor 2 : Appeal
Factor 3 : Readiness
Readiness
1614 15
17
31
36
41
45
3230
32
41
31
23
28
33
2012 2013 2014 2015 2016

IMD World Talent Report 2015
55
IMD World Talent Report 2016
5 Best Ranked Criteria 5 Worst Ranked Criteria
LITHUANIA
Rank 2016
of 61
Criteria Value 2016 Rank
Total Public Expenditure on Education Percentage of GDP 5.41 % 19
Public Expenditure on Education per Pupil (Secondary) Percentage of GDP per capita 19.47 % 34
Pupil-Teacher Ratio (Primary Education) Ratio of students to teaching staff 12.62 ratio 14
Pupil-Teacher Ratio (Secondary Education) Ratio of students to teaching staff 8.10 ratio 3
Apprenticeships Are sufficiently implemented 6.40 Survey [0..10] 7
Employee Training Is a high priority in companies 6.77 Survey [0..10] 13
Female Labor Force Percentage of total labor force 50.46 % 1
Health Infrastructure Meets the needs of society 5.77 Survey [0..10] 35
Criteria Value 2016 Rank
Cost-of-Living Index Index of a basket of goods & services 62.40 index 6
Attracting and Retaining Talents Is a priority in companies 7.37 Survey [0..10] 17
Worker Motivation Is high 6.43 Survey [0..10] 21
Brain Drain Does not hinder competitiveness in your economy 4.03 Survey [0..10] 40
Quality of Life Is high 6.61 Survey [0..10] 33
Foreign High-Skilled People Are attracted to your country's business environment 4.27 Survey [0..10] 43
Remuneration in Services Professions Gross annual income including supplements such as bonuses 12,372 US$ 50
Remuneration of Management Total base salary plus bonuses and long-term incentives 99,035 US$ 47
Effective Personal Income Tax Rate Percentage of an income equal to GDP per capita 22.25 % 46
Personal Security and Private Property Rights Are adequately protected 7.50 Survey 26
Criteria Value 2016 Rank
Labor Force Growth Percentage change -0.54 % 56
Skilled Labor Is readily available 6.10 Survey [0..10] 27
Finance Skills Are readily available 5.67 Survey [0..10] 45
International Experience Of senior managers is generally significant 5.70 Survey [0..10] 28
Competent Senior Managers Are readily available 5.30 Survey [0..10] 40
Educational System Meets the needs of a competitive economy 5.57 Survey [0..10] 32
Science in Schools Is sufficiently emphasized 4.73 Survey [0..10] 42
University Education Meets the needs of a competitive economy 5.73 Survey [0..10] 32
Management Education Meets the needs of the business community 6.00 Survey [0..10] 32
Language Skills Are meeting the needs of enterprises 7.87 Survey [0..10] 13
Student Mobility Inbound Foreign tertiary-level students per 1000 inhabitants 1.32 number 35
Educational Assessment - PISA PISA survey of 15-year olds 487.50 Value 31
2510
38
OverallInvestment & Development
Appeal
33
Factor 1 : Investment and Development
Factor 2 : Appeal
Factor 3 : Readiness
Readiness
1412
910 10
39 39
35
3938
43 4342
26
3331
22
29
2425
2012 2013 2014 2015 2016

IMD World Talent Report 2016
56
5 Best Ranked Criteria 5 Worst Ranked Criteria
LUXEMBOURG
Rank 2016
of 61
Criteria Value 2016 Rank
Total Public Expenditure on Education Percentage of GDP 5.57 % 14
Public Expenditure on Education per Pupil (Secondary) Percentage of GDP per capita 18.02 % 40
Pupil-Teacher Ratio (Primary Education) Ratio of students to teaching staff 8.82 ratio 1
Pupil-Teacher Ratio (Secondary Education) Ratio of students to teaching staff 8.60 ratio 5
Apprenticeships Are sufficiently implemented 5.69 Survey [0..10] 12
Employee Training Is a high priority in companies 7.11 Survey [0..10] 6
Female Labor Force Percentage of total labor force 38.50 % 52
Health Infrastructure Meets the needs of society 7.77 Survey [0..10] 12
Criteria Value 2016 Rank
Cost-of-Living Index Index of a basket of goods & services 74.00 index 27
Attracting and Retaining Talents Is a priority in companies 7.53 Survey [0..10] 13
Worker Motivation Is high 6.83 Survey [0..10] 14
Brain Drain Does not hinder competitiveness in your economy 6.65 Survey [0..10] 8
Quality of Life Is high 8.99 Survey [0..10] 13
Foreign High-Skilled People Are attracted to your country's business environment 7.90 Survey [0..10] 7
Remuneration in Services Professions Gross annual income including supplements such as bonuses 58,425 US$ 4
Remuneration of Management Total base salary plus bonuses and long-term incentives 239,810 US$ 7
Effective Personal Income Tax Rate Percentage of an income equal to GDP per capita 24.32 % 50
Personal Security and Private Property Rights Are adequately protected 8.08 Survey 19
Criteria Value 2016 Rank
Labor Force Growth Percentage change 2.28 % 8
Skilled Labor Is readily available 5.53 Survey [0..10] 40
Finance Skills Are readily available 7.19 Survey [0..10] 17
International Experience Of senior managers is generally significant 7.38 Survey [0..10] 5
Competent Senior Managers Are readily available 5.97 Survey [0..10] 25
Educational System Meets the needs of a competitive economy 6.44 Survey [0..10] 19
Science in Schools Is sufficiently emphasized 5.47 Survey [0..10] 31
University Education Meets the needs of a competitive economy 6.00 Survey [0..10] 29
Management Education Meets the needs of the business community 5.95 Survey [0..10] 34
Language Skills Are meeting the needs of enterprises 8.59 Survey [0..10] 5
Student Mobility Inbound Foreign tertiary-level students per 1000 inhabitants 5.36 number 8
Educational Assessment - PISA PISA survey of 15-year olds 490.50 Value 26
913
3
OverallInvestment & Development
Appeal
16
Factor 1 : Investment and Development
Factor 2 : Appeal
Factor 3 : Readiness
Readiness16
7
12
9
13
19 19
10
3 3
7
14
22
12
1615
16
13
3
9
2012 2013 2014 2015 2016

IMD World Talent Report 2015
57
IMD World Talent Report 2016
5 Best Ranked Criteria 5 Worst Ranked Criteria
MALAYSIA
Rank 2016
of 61
Criteria Value 2016 Rank
Total Public Expenditure on Education Percentage of GDP 5.12 % 27
Public Expenditure on Education per Pupil (Secondary) Percentage of GDP per capita 23.20 % 22
Pupil-Teacher Ratio (Primary Education) Ratio of students to teaching staff 12.00 ratio 11
Pupil-Teacher Ratio (Secondary Education) Ratio of students to teaching staff 13.00 ratio 35
Apprenticeships Are sufficiently implemented 6.32 Survey [0..10] 8
Employee Training Is a high priority in companies 7.08 Survey [0..10] 7
Female Labor Force Percentage of total labor force 38.60 % 51
Health Infrastructure Meets the needs of society 7.50 Survey [0..10] 17
Criteria Value 2016 Rank
Cost-of-Living Index Index of a basket of goods & services 71.90 index 20
Attracting and Retaining Talents Is a priority in companies 7.56 Survey [0..10] 12
Worker Motivation Is high 6.94 Survey [0..10] 11
Brain Drain Does not hinder competitiveness in your economy 5.72 Survey [0..10] 20
Quality of Life Is high 6.81 Survey [0..10] 31
Foreign High-Skilled People Are attracted to your country's business environment 6.64 Survey [0..10] 15
Remuneration in Services Professions Gross annual income including supplements such as bonuses 11,436 US$ 51
Remuneration of Management Total base salary plus bonuses and long-term incentives 97,042 US$ 43
Effective Personal Income Tax Rate Percentage of an income equal to GDP per capita 10.41 % 14
Personal Security and Private Property Rights Are adequately protected 6.72 Survey 34
Criteria Value 2016 Rank
Labor Force Growth Percentage change 1.74 % 15
Skilled Labor Is readily available 6.80 Survey [0..10] 10
Finance Skills Are readily available 7.22 Survey [0..10] 16
International Experience Of senior managers is generally significant 6.59 Survey [0..10] 13
Competent Senior Managers Are readily available 6.74 Survey [0..10] 13
Educational System Meets the needs of a competitive economy 6.32 Survey [0..10] 22
Science in Schools Is sufficiently emphasized 6.47 Survey [0..10] 11
University Education Meets the needs of a competitive economy 6.22 Survey [0..10] 24
Management Education Meets the needs of the business community 6.40 Survey [0..10] 27
Language Skills Are meeting the needs of enterprises 6.58 Survey [0..10] 26
Student Mobility Inbound Foreign tertiary-level students per 1000 inhabitants 1.34 number 34
Educational Assessment - PISA PISA survey of 15-year olds 420.50 Value 47
1916
22
OverallInvestment & Development
Appeal
25
Factor 1 : Investment and Development
Factor 2 : Appeal
Factor 3 : Readiness
Readiness 2019
11
13
16
8
10
5
19
22
1112
7
16
25
11
9
5
15
19
2012 2013 2014 2015 2016

IMD World Talent Report 2016
58
5 Best Ranked Criteria 5 Worst Ranked Criteria
MEXICO
Rank 2016
of 61
Criteria Value 2016 Rank
Total Public Expenditure on Education Percentage of GDP 3.62 % 47
Public Expenditure on Education per Pupil (Secondary) Percentage of GDP per capita 15.91 % 46
Pupil-Teacher Ratio (Primary Education) Ratio of students to teaching staff 27.69 ratio 58
Pupil-Teacher Ratio (Secondary Education) Ratio of students to teaching staff 30.30 ratio 59
Apprenticeships Are sufficiently implemented 4.87 Survey [0..10] 25
Employee Training Is a high priority in companies 5.33 Survey [0..10] 44
Female Labor Force Percentage of total labor force 38.48 % 53
Health Infrastructure Meets the needs of society 4.13 Survey [0..10] 45
Criteria Value 2016 Rank
Cost-of-Living Index Index of a basket of goods & services 68.40 index 14
Attracting and Retaining Talents Is a priority in companies 5.93 Survey [0..10] 46
Worker Motivation Is high 5.93 Survey [0..10] 35
Brain Drain Does not hinder competitiveness in your economy 4.77 Survey [0..10] 33
Quality of Life Is high 5.04 Survey [0..10] 46
Foreign High-Skilled People Are attracted to your country's business environment 5.33 Survey [0..10] 26
Remuneration in Services Professions Gross annual income including supplements such as bonuses 11,901 US$ 53
Remuneration of Management Total base salary plus bonuses and long-term incentives 183,831 US$ 25
Effective Personal Income Tax Rate Percentage of an income equal to GDP per capita 13.81 % 20
Personal Security and Private Property Rights Are adequately protected 4.43 Survey 52
Criteria Value 2016 Rank
Labor Force Growth Percentage change 3.26 % 4
Skilled Labor Is readily available 5.37 Survey [0..10] 42
Finance Skills Are readily available 5.74 Survey [0..10] 44
International Experience Of senior managers is generally significant 5.83 Survey [0..10] 25
Competent Senior Managers Are readily available 5.11 Survey [0..10] 42
Educational System Meets the needs of a competitive economy 4.00 Survey [0..10] 50
Science in Schools Is sufficiently emphasized 3.69 Survey [0..10] 51
University Education Meets the needs of a competitive economy 5.26 Survey [0..10] 39
Management Education Meets the needs of the business community 5.45 Survey [0..10] 41
Language Skills Are meeting the needs of enterprises 4.70 Survey [0..10] 46
Student Mobility Inbound Foreign tertiary-level students per 1000 inhabitants 0.07 number 56
Educational Assessment - PISA PISA survey of 15-year olds 414.00 Value 48
5659
33
OverallInvestment & Development
Appeal
46
Factor 1 : Investment and Development
Factor 2 : Appeal
Factor 3 : Readiness
Readiness53
54
5758
59
43
40
33
36
33
30
25
48
51
46
49
40
5049
56
2012 2013 2014 2015 2016

IMD World Talent Report 2015
59
IMD World Talent Report 2016
5 Best Ranked Criteria 5 Worst Ranked Criteria
MONGOLIA
Rank 2016
of 61
Criteria Value 2016 Rank
Total Public Expenditure on Education Percentage of GDP 5.35 % 22
Public Expenditure on Education per Pupil (Secondary) Percentage of GDP per capita 15.37 % 48
Pupil-Teacher Ratio (Primary Education) Ratio of students to teaching staff 27.59 ratio 57
Pupil-Teacher Ratio (Secondary Education) Ratio of students to teaching staff 18.30 ratio 51
Apprenticeships Are sufficiently implemented 4.03 Survey [0..10] 47
Employee Training Is a high priority in companies 5.67 Survey [0..10] 35
Female Labor Force Percentage of total labor force 46.35 % 25
Health Infrastructure Meets the needs of society 2.52 Survey [0..10] 57
Criteria Value 2016 Rank
Cost-of-Living Index Index of a basket of goods & services - index -
Attracting and Retaining Talents Is a priority in companies 6.42 Survey [0..10] 38
Worker Motivation Is high 4.63 Survey [0..10] 54
Brain Drain Does not hinder competitiveness in your economy 4.17 Survey [0..10] 38
Quality of Life Is high 3.26 Survey [0..10] 58
Foreign High-Skilled People Are attracted to your country's business environment 3.67 Survey [0..10] 48
Remuneration in Services Professions Gross annual income including supplements such as bonuses 5,117 US$ 58
Remuneration of Management Total base salary plus bonuses and long-term incentives - US$ -
Effective Personal Income Tax Rate Percentage of an income equal to GDP per capita 19.27 % 34
Personal Security and Private Property Rights Are adequately protected 5.12 Survey 47
Criteria Value 2016 Rank
Labor Force Growth Percentage change 3.22 % 5
Skilled Labor Is readily available 3.26 Survey [0..10] 60
Finance Skills Are readily available 4.36 Survey [0..10] 60
International Experience Of senior managers is generally significant 4.38 Survey [0..10] 53
Competent Senior Managers Are readily available 3.92 Survey [0..10] 54
Educational System Meets the needs of a competitive economy 3.56 Survey [0..10] 54
Science in Schools Is sufficiently emphasized 4.25 Survey [0..10] 46
University Education Meets the needs of a competitive economy 3.12 Survey [0..10] 60
Management Education Meets the needs of the business community 3.59 Survey [0..10] 61
Language Skills Are meeting the needs of enterprises 5.34 Survey [0..10] 41
Student Mobility Inbound Foreign tertiary-level students per 1000 inhabitants 0.37 number 50
Educational Assessment - PISA PISA survey of 15-year olds - Value -
5848
56
OverallInvestment & Development
Appeal
56
Factor 1 : Investment and Development
Factor 2 : Appeal
Factor 3 : Readiness
Readiness 44
4851
5659
5654
58
2012 2013 2014 2015 2016
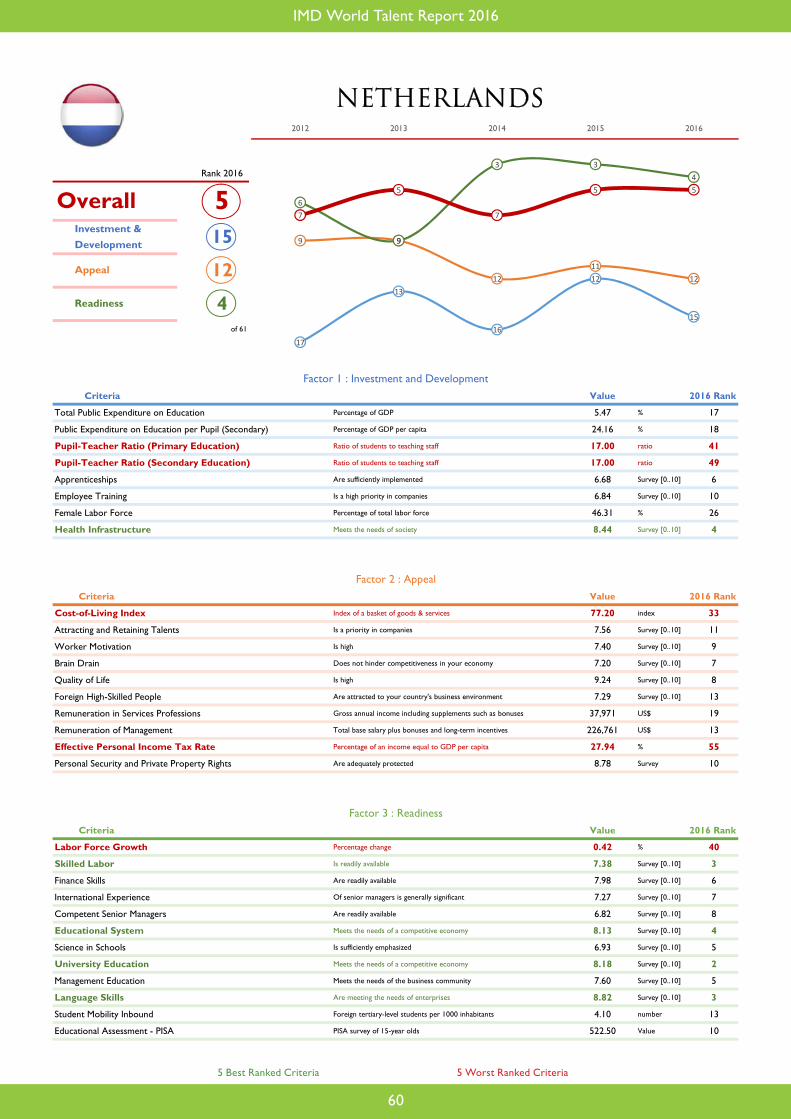
IMD World Talent Report 2016
60
5 Best Ranked Criteria 5 Worst Ranked Criteria
NETHERLANDS
Rank 2016
of 61
Criteria Value 2016 Rank
Total Public Expenditure on Education Percentage of GDP 5.47 % 17
Public Expenditure on Education per Pupil (Secondary) Percentage of GDP per capita 24.16 % 18
Pupil-Teacher Ratio (Primary Education) Ratio of students to teaching staff 17.00 ratio 41
Pupil-Teacher Ratio (Secondary Education) Ratio of students to teaching staff 17.00 ratio 49
Apprenticeships Are sufficiently implemented 6.68 Survey [0..10] 6
Employee Training Is a high priority in companies 6.84 Survey [0..10] 10
Female Labor Force Percentage of total labor force 46.31 % 26
Health Infrastructure Meets the needs of society 8.44 Survey [0..10] 4
Criteria Value 2016 Rank
Cost-of-Living Index Index of a basket of goods & services 77.20 index 33
Attracting and Retaining Talents Is a priority in companies 7.56 Survey [0..10] 11
Worker Motivation Is high 7.40 Survey [0..10] 9
Brain Drain Does not hinder competitiveness in your economy 7.20 Survey [0..10] 7
Quality of Life Is high 9.24 Survey [0..10] 8
Foreign High-Skilled People Are attracted to your country's business environment 7.29 Survey [0..10] 13
Remuneration in Services Professions Gross annual income including supplements such as bonuses 37,971 US$ 19
Remuneration of Management Total base salary plus bonuses and long-term incentives 226,761 US$ 13
Effective Personal Income Tax Rate Percentage of an income equal to GDP per capita 27.94 % 55
Personal Security and Private Property Rights Are adequately protected 8.78 Survey 10
Criteria Value 2016 Rank
Labor Force Growth Percentage change 0.42 % 40
Skilled Labor Is readily available 7.38 Survey [0..10] 3
Finance Skills Are readily available 7.98 Survey [0..10] 6
International Experience Of senior managers is generally significant 7.27 Survey [0..10] 7
Competent Senior Managers Are readily available 6.82 Survey [0..10] 8
Educational System Meets the needs of a competitive economy 8.13 Survey [0..10] 4
Science in Schools Is sufficiently emphasized 6.93 Survey [0..10] 5
University Education Meets the needs of a competitive economy 8.18 Survey [0..10] 2
Management Education Meets the needs of the business community 7.60 Survey [0..10] 5
Language Skills Are meeting the needs of enterprises 8.82 Survey [0..10] 3
Student Mobility Inbound Foreign tertiary-level students per 1000 inhabitants 4.10 number 13
Educational Assessment - PISA PISA survey of 15-year olds 522.50 Value 10
515
12
OverallInvestment & Development
Appeal
4
Factor 1 : Investment and Development
Factor 2 : Appeal
Factor 3 : Readiness
Readiness
17
13
16
12
15
9 9
1211
12
6
9
3 34
7
5
7
5 5
2012 2013 2014 2015 2016

IMD World Talent Report 2015
61
IMD World Talent Report 2016
5 Best Ranked Criteria 5 Worst Ranked Criteria
NEW ZEALAND
Rank 2016
of 61
Criteria Value 2016 Rank
Total Public Expenditure on Education Percentage of GDP 5.38 % 21
Public Expenditure on Education per Pupil (Secondary) Percentage of GDP per capita 24.70 % 17
Pupil-Teacher Ratio (Primary Education) Ratio of students to teaching staff 16.39 ratio 36
Pupil-Teacher Ratio (Secondary Education) Ratio of students to teaching staff 14.78 ratio 42
Apprenticeships Are sufficiently implemented 4.59 Survey [0..10] 34
Employee Training Is a high priority in companies 6.07 Survey [0..10] 22
Female Labor Force Percentage of total labor force 47.50 % 12
Health Infrastructure Meets the needs of society 7.19 Survey [0..10] 21
Criteria Value 2016 Rank
Cost-of-Living Index Index of a basket of goods & services 78.80 index 35
Attracting and Retaining Talents Is a priority in companies 8.00 Survey [0..10] 3
Worker Motivation Is high 6.89 Survey [0..10] 12
Brain Drain Does not hinder competitiveness in your economy 5.70 Survey [0..10] 21
Quality of Life Is high 9.56 Survey [0..10] 4
Foreign High-Skilled People Are attracted to your country's business environment 7.48 Survey [0..10] 10
Remuneration in Services Professions Gross annual income including supplements such as bonuses 44,174 US$ 10
Remuneration of Management Total base salary plus bonuses and long-term incentives 161,168 US$ 32
Effective Personal Income Tax Rate Percentage of an income equal to GDP per capita 20.68 % 39
Personal Security and Private Property Rights Are adequately protected 8.89 Survey 7
Criteria Value 2016 Rank
Labor Force Growth Percentage change 2.25 % 10
Skilled Labor Is readily available 6.00 Survey [0..10] 30
Finance Skills Are readily available 7.08 Survey [0..10] 22
International Experience Of senior managers is generally significant 5.85 Survey [0..10] 22
Competent Senior Managers Are readily available 6.22 Survey [0..10] 20
Educational System Meets the needs of a competitive economy 7.85 Survey [0..10] 7
Science in Schools Is sufficiently emphasized 6.31 Survey [0..10] 15
University Education Meets the needs of a competitive economy 7.19 Survey [0..10] 15
Management Education Meets the needs of the business community 7.04 Survey [0..10] 16
Language Skills Are meeting the needs of enterprises 5.78 Survey [0..10] 36
Student Mobility Inbound Foreign tertiary-level students per 1000 inhabitants 9.29 number 2
Educational Assessment - PISA PISA survey of 15-year olds 508.00 Value 17
1321
13
OverallInvestment & Development
Appeal
7
Factor 1 : Investment and Development
Factor 2 : Appeal
Factor 3 : Readiness
Readiness
2627
34
2021
32
30
23
16
13
26
22
29
19
7
25 2526
18
13
2012 2013 2014 2015 2016
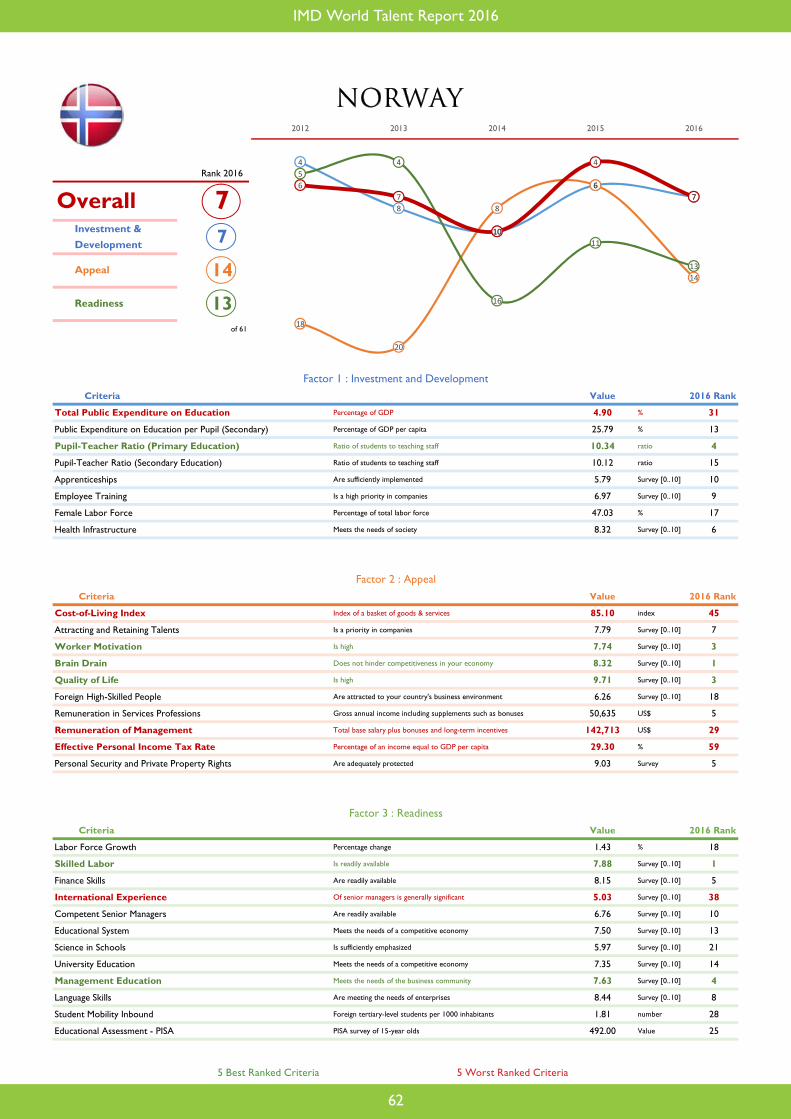
IMD World Talent Report 2016
62
5 Best Ranked Criteria 5 Worst Ranked Criteria
NORWAY
Rank 2016
of 61
Criteria Value 2016 Rank
Total Public Expenditure on Education Percentage of GDP 4.90 % 31
Public Expenditure on Education per Pupil (Secondary) Percentage of GDP per capita 25.79 % 13
Pupil-Teacher Ratio (Primary Education) Ratio of students to teaching staff 10.34 ratio 4
Pupil-Teacher Ratio (Secondary Education) Ratio of students to teaching staff 10.12 ratio 15
Apprenticeships Are sufficiently implemented 5.79 Survey [0..10] 10
Employee Training Is a high priority in companies 6.97 Survey [0..10] 9
Female Labor Force Percentage of total labor force 47.03 % 17
Health Infrastructure Meets the needs of society 8.32 Survey [0..10] 6
Criteria Value 2016 Rank
Cost-of-Living Index Index of a basket of goods & services 85.10 index 45
Attracting and Retaining Talents Is a priority in companies 7.79 Survey [0..10] 7
Worker Motivation Is high 7.74 Survey [0..10] 3
Brain Drain Does not hinder competitiveness in your economy 8.32 Survey [0..10] 1
Quality of Life Is high 9.71 Survey [0..10] 3
Foreign High-Skilled People Are attracted to your country's business environment 6.26 Survey [0..10] 18
Remuneration in Services Professions Gross annual income including supplements such as bonuses 50,635 US$ 5
Remuneration of Management Total base salary plus bonuses and long-term incentives 142,713 US$ 29
Effective Personal Income Tax Rate Percentage of an income equal to GDP per capita 29.30 % 59
Personal Security and Private Property Rights Are adequately protected 9.03 Survey 5
Criteria Value 2016 Rank
Labor Force Growth Percentage change 1.43 % 18
Skilled Labor Is readily available 7.88 Survey [0..10] 1
Finance Skills Are readily available 8.15 Survey [0..10] 5
International Experience Of senior managers is generally significant 5.03 Survey [0..10] 38
Competent Senior Managers Are readily available 6.76 Survey [0..10] 10
Educational System Meets the needs of a competitive economy 7.50 Survey [0..10] 13
Science in Schools Is sufficiently emphasized 5.97 Survey [0..10] 21
University Education Meets the needs of a competitive economy 7.35 Survey [0..10] 14
Management Education Meets the needs of the business community 7.63 Survey [0..10] 4
Language Skills Are meeting the needs of enterprises 8.44 Survey [0..10] 8
Student Mobility Inbound Foreign tertiary-level students per 1000 inhabitants 1.81 number 28
Educational Assessment - PISA PISA survey of 15-year olds 492.00 Value 25
77
14
OverallInvestment & Development
Appeal
13
Factor 1 : Investment and Development
Factor 2 : Appeal
Factor 3 : Readiness
Readiness
4
8
10
67
18
20
8
6
14
54
16
11
13
67
10
4
7
2012 2013 2014 2015 2016

IMD World Talent Report 2015
63
IMD World Talent Report 2016
5 Best Ranked Criteria 5 Worst Ranked Criteria
PERU
Rank 2016
of 61
Criteria Value 2016 Rank
Total Public Expenditure on Education Percentage of GDP 3.22 % 54
Public Expenditure on Education per Pupil (Secondary) Percentage of GDP per capita 10.38 % 55
Pupil-Teacher Ratio (Primary Education) Ratio of students to teaching staff 18.08 ratio 48
Pupil-Teacher Ratio (Secondary Education) Ratio of students to teaching staff 15.46 ratio 47
Apprenticeships Are sufficiently implemented 3.68 Survey [0..10] 53
Employee Training Is a high priority in companies 4.43 Survey [0..10] 58
Female Labor Force Percentage of total labor force 42.19 % 46
Health Infrastructure Meets the needs of society 2.54 Survey [0..10] 56
Criteria Value 2016 Rank
Cost-of-Living Index Index of a basket of goods & services 70.70 index 17
Attracting and Retaining Talents Is a priority in companies 5.16 Survey [0..10] 56
Worker Motivation Is high 5.11 Survey [0..10] 45
Brain Drain Does not hinder competitiveness in your economy 4.02 Survey [0..10] 41
Quality of Life Is high 4.72 Survey [0..10] 49
Foreign High-Skilled People Are attracted to your country's business environment 6.08 Survey [0..10] 19
Remuneration in Services Professions Gross annual income including supplements such as bonuses 12,539 US$ 48
Remuneration of Management Total base salary plus bonuses and long-term incentives 168,040 US$ 23
Effective Personal Income Tax Rate Percentage of an income equal to GDP per capita 12.37 % 18
Personal Security and Private Property Rights Are adequately protected 3.48 Survey 58
Criteria Value 2016 Rank
Labor Force Growth Percentage change 0.41 % 41
Skilled Labor Is readily available 3.70 Survey [0..10] 57
Finance Skills Are readily available 5.26 Survey [0..10] 53
International Experience Of senior managers is generally significant 5.06 Survey [0..10] 36
Competent Senior Managers Are readily available 3.88 Survey [0..10] 55
Educational System Meets the needs of a competitive economy 2.91 Survey [0..10] 56
Science in Schools Is sufficiently emphasized 2.84 Survey [0..10] 56
University Education Meets the needs of a competitive economy 3.68 Survey [0..10] 58
Management Education Meets the needs of the business community 4.54 Survey [0..10] 55
Language Skills Are meeting the needs of enterprises 3.68 Survey [0..10] 53
Student Mobility Inbound Foreign tertiary-level students per 1000 inhabitants - number -
Educational Assessment - PISA PISA survey of 15-year olds 370.50 Value 55
5957
42
OverallInvestment & Development
Appeal
59
Factor 1 : Investment and Development
Factor 2 : Appeal
Factor 3 : Readiness
Readiness54
56
5859
57
55
57
42
49
42
3837
57 57
59
53
55
57
59 59
2012 2013 2014 2015 2016

IMD World Talent Report 2016
64
5 Best Ranked Criteria 5 Worst Ranked Criteria
PHILIPPINES
Rank 2016
of 61
Criteria Value 2016 Rank
Total Public Expenditure on Education Percentage of GDP 2.47 % 58
Public Expenditure on Education per Pupil (Secondary) Percentage of GDP per capita - % -
Pupil-Teacher Ratio (Primary Education) Ratio of students to teaching staff 36.00 ratio 60
Pupil-Teacher Ratio (Secondary Education) Ratio of students to teaching staff 35.00 ratio 61
Apprenticeships Are sufficiently implemented 4.92 Survey [0..10] 23
Employee Training Is a high priority in companies 6.04 Survey [0..10] 25
Female Labor Force Percentage of total labor force 39.39 % 49
Health Infrastructure Meets the needs of society 4.29 Survey [0..10] 43
Criteria Value 2016 Rank
Cost-of-Living Index Index of a basket of goods & services 76.40 index 30
Attracting and Retaining Talents Is a priority in companies 6.83 Survey [0..10] 30
Worker Motivation Is high 6.23 Survey [0..10] 27
Brain Drain Does not hinder competitiveness in your economy 3.77 Survey [0..10] 44
Quality of Life Is high 5.31 Survey [0..10] 44
Foreign High-Skilled People Are attracted to your country's business environment 5.48 Survey [0..10] 25
Remuneration in Services Professions Gross annual income including supplements such as bonuses 10,815 US$ 54
Remuneration of Management Total base salary plus bonuses and long-term incentives 138,101 US$ 35
Effective Personal Income Tax Rate Percentage of an income equal to GDP per capita 9.59 % 13
Personal Security and Private Property Rights Are adequately protected 4.80 Survey 49
Criteria Value 2016 Rank
Labor Force Growth Percentage change 1.13 % 24
Skilled Labor Is readily available 7.16 Survey [0..10] 4
Finance Skills Are readily available 6.81 Survey [0..10] 25
International Experience Of senior managers is generally significant 5.90 Survey [0..10] 21
Competent Senior Managers Are readily available 6.60 Survey [0..10] 14
Educational System Meets the needs of a competitive economy 5.59 Survey [0..10] 31
Science in Schools Is sufficiently emphasized 5.24 Survey [0..10] 35
University Education Meets the needs of a competitive economy 6.15 Survey [0..10] 26
Management Education Meets the needs of the business community 6.41 Survey [0..10] 25
Language Skills Are meeting the needs of enterprises 7.46 Survey [0..10] 18
Student Mobility Inbound Foreign tertiary-level students per 1000 inhabitants - number -
Educational Assessment - PISA PISA survey of 15-year olds - Value -
5160
35
OverallInvestment & Development
Appeal
23
Factor 1 : Investment and Development
Factor 2 : Appeal
Factor 3 : Readiness
Readiness
58 59 59 60 60
14 15
34 35 3532
27
21 22 23
35
29
4144
51
2012 2013 2014 2015 2016

IMD World Talent Report 2015
65
IMD World Talent Report 2016
5 Best Ranked Criteria 5 Worst Ranked Criteria
POLAND
Rank 2016
of 61
Criteria Value 2016 Rank
Total Public Expenditure on Education Percentage of GDP 5.28 % 24
Public Expenditure on Education per Pupil (Secondary) Percentage of GDP per capita 23.51 % 19
Pupil-Teacher Ratio (Primary Education) Ratio of students to teaching staff 11.09 ratio 7
Pupil-Teacher Ratio (Secondary Education) Ratio of students to teaching staff 10.48 ratio 16
Apprenticeships Are sufficiently implemented 4.87 Survey [0..10] 24
Employee Training Is a high priority in companies 5.83 Survey [0..10] 31
Female Labor Force Percentage of total labor force 44.75 % 38
Health Infrastructure Meets the needs of society 4.11 Survey [0..10] 46
Criteria Value 2016 Rank
Cost-of-Living Index Index of a basket of goods & services 61.80 index 5
Attracting and Retaining Talents Is a priority in companies 4.19 Survey [0..10] 61
Worker Motivation Is high 6.43 Survey [0..10] 22
Brain Drain Does not hinder competitiveness in your economy 3.42 Survey [0..10] 49
Quality of Life Is high 5.36 Survey [0..10] 43
Foreign High-Skilled People Are attracted to your country's business environment 5.94 Survey [0..10] 20
Remuneration in Services Professions Gross annual income including supplements such as bonuses 14,303 US$ 41
Remuneration of Management Total base salary plus bonuses and long-term incentives 138,889 US$ 38
Effective Personal Income Tax Rate Percentage of an income equal to GDP per capita 24.61 % 51
Personal Security and Private Property Rights Are adequately protected 6.33 Survey 35
Criteria Value 2016 Rank
Labor Force Growth Percentage change 0.26 % 46
Skilled Labor Is readily available 6.61 Survey [0..10] 13
Finance Skills Are readily available 7.36 Survey [0..10] 14
International Experience Of senior managers is generally significant 6.69 Survey [0..10] 12
Competent Senior Managers Are readily available 6.76 Survey [0..10] 11
Educational System Meets the needs of a competitive economy 5.61 Survey [0..10] 30
Science in Schools Is sufficiently emphasized 5.81 Survey [0..10] 23
University Education Meets the needs of a competitive economy 5.47 Survey [0..10] 34
Management Education Meets the needs of the business community 5.78 Survey [0..10] 36
Language Skills Are meeting the needs of enterprises 7.39 Survey [0..10] 19
Student Mobility Inbound Foreign tertiary-level students per 1000 inhabitants 0.72 number 45
Educational Assessment - PISA PISA survey of 15-year olds 522.00 Value 11
2918
46
OverallInvestment & Development
Appeal
24
Factor 1 : Investment and Development
Factor 2 : Appeal
Factor 3 : Readiness
Readiness
31
34
22
30
18
35
13
53 52
4648
55
28
21
24
38
30
36
32
29
2012 2013 2014 2015 2016

IMD World Talent Report 2016
66
5 Best Ranked Criteria 5 Worst Ranked Criteria
PORTUGAL
Rank 2016
of 61
Criteria Value 2016 Rank
Total Public Expenditure on Education Percentage of GDP 6.81 % 5
Public Expenditure on Education per Pupil (Secondary) Percentage of GDP per capita 32.56 % 3
Pupil-Teacher Ratio (Primary Education) Ratio of students to teaching staff 13.20 ratio 20
Pupil-Teacher Ratio (Secondary Education) Ratio of students to teaching staff 9.39 ratio 10
Apprenticeships Are sufficiently implemented 4.52 Survey [0..10] 35
Employee Training Is a high priority in companies 4.34 Survey [0..10] 60
Female Labor Force Percentage of total labor force 48.85 % 4
Health Infrastructure Meets the needs of society 6.82 Survey [0..10] 25
Criteria Value 2016 Rank
Cost-of-Living Index Index of a basket of goods & services 67.50 index 12
Attracting and Retaining Talents Is a priority in companies 5.46 Survey [0..10] 51
Worker Motivation Is high 4.92 Survey [0..10] 47
Brain Drain Does not hinder competitiveness in your economy 3.39 Survey [0..10] 50
Quality of Life Is high 6.94 Survey [0..10] 30
Foreign High-Skilled People Are attracted to your country's business environment 4.43 Survey [0..10] 41
Remuneration in Services Professions Gross annual income including supplements such as bonuses 19,069 US$ 31
Remuneration of Management Total base salary plus bonuses and long-term incentives 149,946 US$ 33
Effective Personal Income Tax Rate Percentage of an income equal to GDP per capita 19.27 % 35
Personal Security and Private Property Rights Are adequately protected 7.59 Survey 25
Criteria Value 2016 Rank
Labor Force Growth Percentage change 0.11 % 50
Skilled Labor Is readily available 6.25 Survey [0..10] 22
Finance Skills Are readily available 5.41 Survey [0..10] 51
International Experience Of senior managers is generally significant 4.20 Survey [0..10] 57
Competent Senior Managers Are readily available 4.44 Survey [0..10] 51
Educational System Meets the needs of a competitive economy 6.15 Survey [0..10] 24
Science in Schools Is sufficiently emphasized 5.66 Survey [0..10] 24
University Education Meets the needs of a competitive economy 6.96 Survey [0..10] 19
Management Education Meets the needs of the business community 7.08 Survey [0..10] 15
Language Skills Are meeting the needs of enterprises 7.89 Survey [0..10] 12
Student Mobility Inbound Foreign tertiary-level students per 1000 inhabitants 1.39 number 32
Educational Assessment - PISA PISA survey of 15-year olds 488.00 Value 30
228
40
OverallInvestment & Development
Appeal
30
Factor 1 : Investment and Development
Factor 2 : Appeal
Factor 3 : Readiness
Readiness
10
14
20
11
8
25
35
49
3840
45
51
3533
30
24
34 33
25
22
2012 2013 2014 2015 2016

IMD World Talent Report 2015
67
IMD World Talent Report 2016
5 Best Ranked Criteria 5 Worst Ranked Criteria
QATAR
Rank 2016
of 61
Criteria Value 2016 Rank
Total Public Expenditure on Education Percentage of GDP 3.27 % 52
Public Expenditure on Education per Pupil (Secondary) Percentage of GDP per capita 10.27 % 56
Pupil-Teacher Ratio (Primary Education) Ratio of students to teaching staff 10.00 ratio 3
Pupil-Teacher Ratio (Secondary Education) Ratio of students to teaching staff 9.67 ratio 13
Apprenticeships Are sufficiently implemented 5.11 Survey [0..10] 20
Employee Training Is a high priority in companies 5.85 Survey [0..10] 28
Female Labor Force Percentage of total labor force 13.43 % 58
Health Infrastructure Meets the needs of society 6.75 Survey [0..10] 26
Criteria Value 2016 Rank
Cost-of-Living Index Index of a basket of goods & services 73.40 index 24
Attracting and Retaining Talents Is a priority in companies 6.44 Survey [0..10] 37
Worker Motivation Is high 6.08 Survey [0..10] 31
Brain Drain Does not hinder competitiveness in your economy 5.59 Survey [0..10] 24
Quality of Life Is high 8.03 Survey [0..10] 22
Foreign High-Skilled People Are attracted to your country's business environment 7.52 Survey [0..10] 9
Remuneration in Services Professions Gross annual income including supplements such as bonuses 31,462 US$ 27
Remuneration of Management Total base salary plus bonuses and long-term incentives 159,341 US$ 22
Effective Personal Income Tax Rate Percentage of an income equal to GDP per capita 0.00 % 1
Personal Security and Private Property Rights Are adequately protected 8.06 Survey 20
Criteria Value 2016 Rank
Labor Force Growth Percentage change 15.80 % 1
Skilled Labor Is readily available 5.25 Survey [0..10] 44
Finance Skills Are readily available 6.14 Survey [0..10] 36
International Experience Of senior managers is generally significant 6.87 Survey [0..10] 9
Competent Senior Managers Are readily available 5.92 Survey [0..10] 27
Educational System Meets the needs of a competitive economy 7.00 Survey [0..10] 15
Science in Schools Is sufficiently emphasized 6.77 Survey [0..10] 7
University Education Meets the needs of a competitive economy 6.75 Survey [0..10] 21
Management Education Meets the needs of the business community 6.59 Survey [0..10] 23
Language Skills Are meeting the needs of enterprises 6.84 Survey [0..10] 25
Student Mobility Inbound Foreign tertiary-level students per 1000 inhabitants 4.25 number 12
Educational Assessment - PISA PISA survey of 15-year olds 380.00 Value 53
2751
9
OverallInvestment & Development
Appeal
15
Factor 1 : Investment and Development
Factor 2 : Appeal
Factor 3 : Readiness
Readiness
50 5153
48
51
17 16 17 17
9
18 18 18
27
15
2224
22
2927
2012 2013 2014 2015 2016
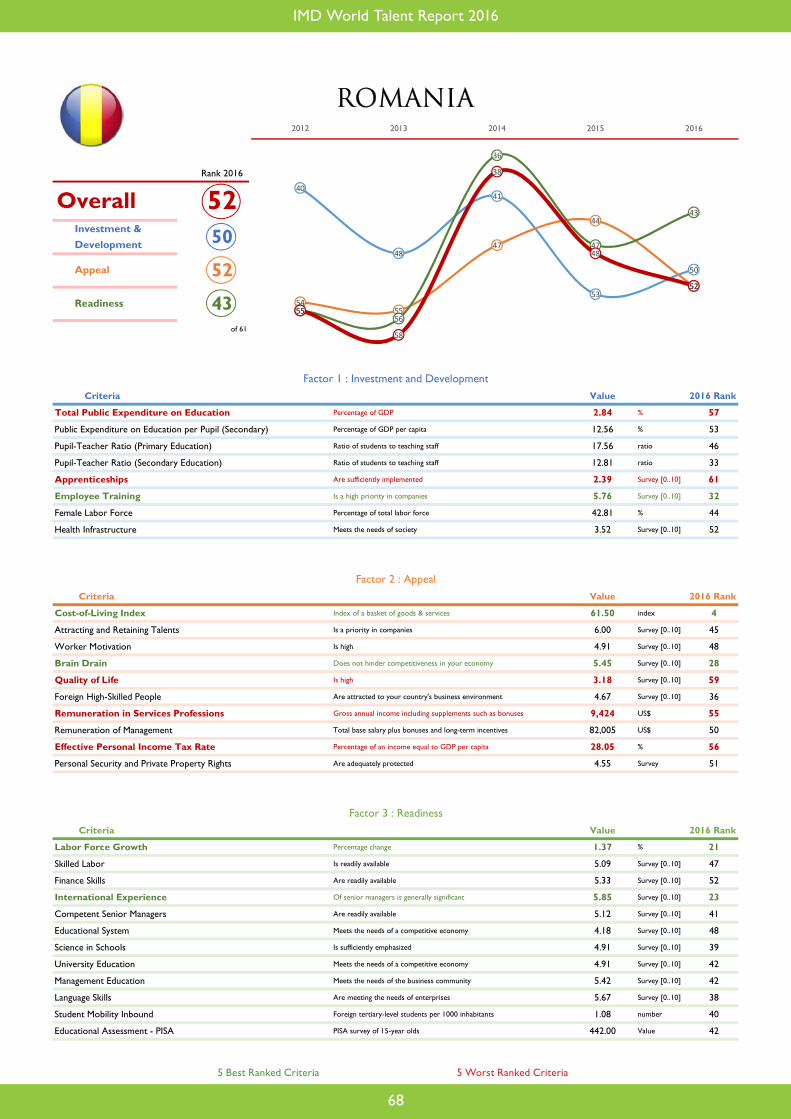
IMD World Talent Report 2016
68
5 Best Ranked Criteria 5 Worst Ranked Criteria
ROMANIA
Rank 2016
of 61
Criteria Value 2016 Rank
Total Public Expenditure on Education Percentage of GDP 2.84 % 57
Public Expenditure on Education per Pupil (Secondary) Percentage of GDP per capita 12.56 % 53
Pupil-Teacher Ratio (Primary Education) Ratio of students to teaching staff 17.56 ratio 46
Pupil-Teacher Ratio (Secondary Education) Ratio of students to teaching staff 12.81 ratio 33
Apprenticeships Are sufficiently implemented 2.39 Survey [0..10] 61
Employee Training Is a high priority in companies 5.76 Survey [0..10] 32
Female Labor Force Percentage of total labor force 42.81 % 44
Health Infrastructure Meets the needs of society 3.52 Survey [0..10] 52
Criteria Value 2016 Rank
Cost-of-Living Index Index of a basket of goods & services 61.50 index 4
Attracting and Retaining Talents Is a priority in companies 6.00 Survey [0..10] 45
Worker Motivation Is high 4.91 Survey [0..10] 48
Brain Drain Does not hinder competitiveness in your economy 5.45 Survey [0..10] 28
Quality of Life Is high 3.18 Survey [0..10] 59
Foreign High-Skilled People Are attracted to your country's business environment 4.67 Survey [0..10] 36
Remuneration in Services Professions Gross annual income including supplements such as bonuses 9,424 US$ 55
Remuneration of Management Total base salary plus bonuses and long-term incentives 82,005 US$ 50
Effective Personal Income Tax Rate Percentage of an income equal to GDP per capita 28.05 % 56
Personal Security and Private Property Rights Are adequately protected 4.55 Survey 51
Criteria Value 2016 Rank
Labor Force Growth Percentage change 1.37 % 21
Skilled Labor Is readily available 5.09 Survey [0..10] 47
Finance Skills Are readily available 5.33 Survey [0..10] 52
International Experience Of senior managers is generally significant 5.85 Survey [0..10] 23
Competent Senior Managers Are readily available 5.12 Survey [0..10] 41
Educational System Meets the needs of a competitive economy 4.18 Survey [0..10] 48
Science in Schools Is sufficiently emphasized 4.91 Survey [0..10] 39
University Education Meets the needs of a competitive economy 4.91 Survey [0..10] 42
Management Education Meets the needs of the business community 5.42 Survey [0..10] 42
Language Skills Are meeting the needs of enterprises 5.67 Survey [0..10] 38
Student Mobility Inbound Foreign tertiary-level students per 1000 inhabitants 1.08 number 40
Educational Assessment - PISA PISA survey of 15-year olds 442.00 Value 42
5250
52
OverallInvestment & Development
Appeal
43
Factor 1 : Investment and Development
Factor 2 : Appeal
Factor 3 : Readiness
Readiness
40
48
41
53
50
5455
47
44
52
5556
36
47
43
55
58
38
48
52
2012 2013 2014 2015 2016
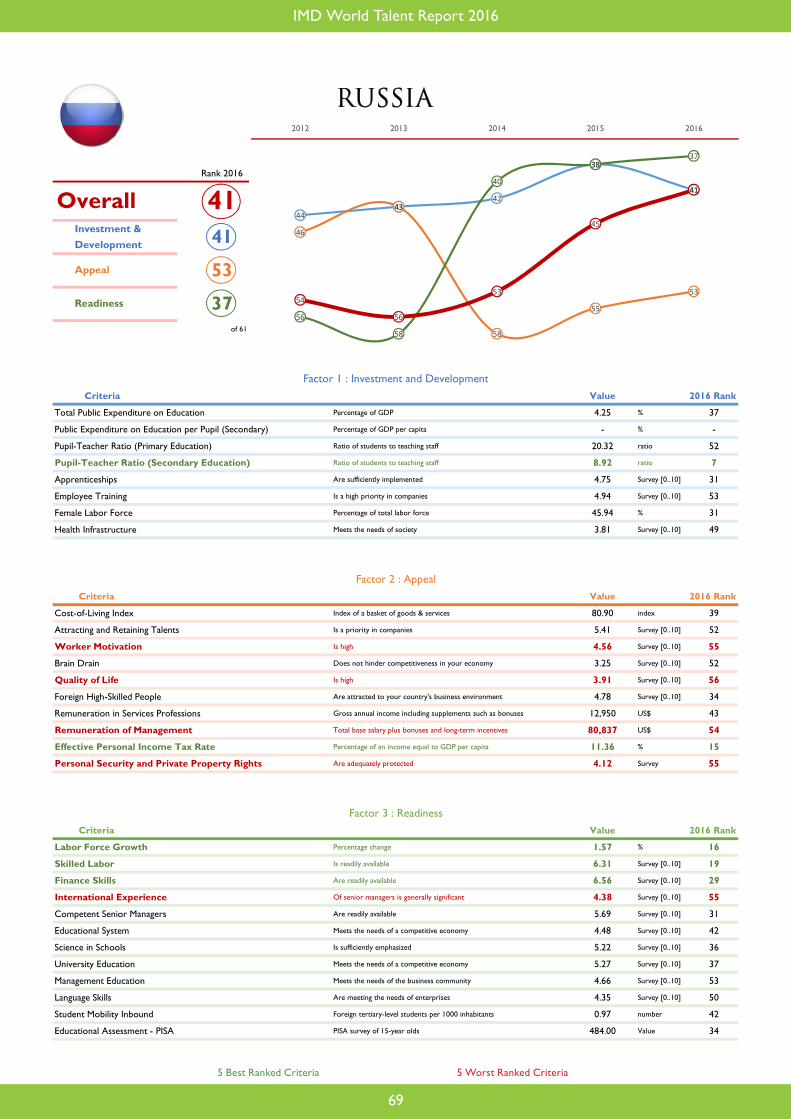
IMD World Talent Report 2015
69
IMD World Talent Report 2016
5 Best Ranked Criteria 5 Worst Ranked Criteria
RUSSIA
Rank 2016
of 61
Criteria Value 2016 Rank
Total Public Expenditure on Education Percentage of GDP 4.25 % 37
Public Expenditure on Education per Pupil (Secondary) Percentage of GDP per capita - % -
Pupil-Teacher Ratio (Primary Education) Ratio of students to teaching staff 20.32 ratio 52
Pupil-Teacher Ratio (Secondary Education) Ratio of students to teaching staff 8.92 ratio 7
Apprenticeships Are sufficiently implemented 4.75 Survey [0..10] 31
Employee Training Is a high priority in companies 4.94 Survey [0..10] 53
Female Labor Force Percentage of total labor force 45.94 % 31
Health Infrastructure Meets the needs of society 3.81 Survey [0..10] 49
Criteria Value 2016 Rank
Cost-of-Living Index Index of a basket of goods & services 80.90 index 39
Attracting and Retaining Talents Is a priority in companies 5.41 Survey [0..10] 52
Worker Motivation Is high 4.56 Survey [0..10] 55
Brain Drain Does not hinder competitiveness in your economy 3.25 Survey [0..10] 52
Quality of Life Is high 3.91 Survey [0..10] 56
Foreign High-Skilled People Are attracted to your country's business environment 4.78 Survey [0..10] 34
Remuneration in Services Professions Gross annual income including supplements such as bonuses 12,950 US$ 43
Remuneration of Management Total base salary plus bonuses and long-term incentives 80,837 US$ 54
Effective Personal Income Tax Rate Percentage of an income equal to GDP per capita 11.36 % 15
Personal Security and Private Property Rights Are adequately protected 4.12 Survey 55
Criteria Value 2016 Rank
Labor Force Growth Percentage change 1.57 % 16
Skilled Labor Is readily available 6.31 Survey [0..10] 19
Finance Skills Are readily available 6.56 Survey [0..10] 29
International Experience Of senior managers is generally significant 4.38 Survey [0..10] 55
Competent Senior Managers Are readily available 5.69 Survey [0..10] 31
Educational System Meets the needs of a competitive economy 4.48 Survey [0..10] 42
Science in Schools Is sufficiently emphasized 5.22 Survey [0..10] 36
University Education Meets the needs of a competitive economy 5.27 Survey [0..10] 37
Management Education Meets the needs of the business community 4.66 Survey [0..10] 53
Language Skills Are meeting the needs of enterprises 4.35 Survey [0..10] 50
Student Mobility Inbound Foreign tertiary-level students per 1000 inhabitants 0.97 number 42
Educational Assessment - PISA PISA survey of 15-year olds 484.00 Value 34
4141
53
OverallInvestment & Development
Appeal
37
Factor 1 : Investment and Development
Factor 2 : Appeal
Factor 3 : Readiness
Readiness
4443
42
38
41
46
43
58
55
53
56
58
40
3837
54
56
53
45
41
2012 2013 2014 2015 2016

IMD World Talent Report 2016
70
5 Best Ranked Criteria 5 Worst Ranked Criteria
SINGAPORE
Rank 2016
of 61
Criteria Value 2016 Rank
Total Public Expenditure on Education Percentage of GDP 2.99 % 56
Public Expenditure on Education per Pupil (Secondary) Percentage of GDP per capita 16.68 % 43
Pupil-Teacher Ratio (Primary Education) Ratio of students to teaching staff 17.00 ratio 41
Pupil-Teacher Ratio (Secondary Education) Ratio of students to teaching staff 13.00 ratio 35
Apprenticeships Are sufficiently implemented 5.12 Survey [0..10] 19
Employee Training Is a high priority in companies 6.24 Survey [0..10] 19
Female Labor Force Percentage of total labor force 45.52 % 34
Health Infrastructure Meets the needs of society 8.33 Survey [0..10] 5
Criteria Value 2016 Rank
Cost-of-Living Index Index of a basket of goods & services 112.00 index 57
Attracting and Retaining Talents Is a priority in companies 7.48 Survey [0..10] 14
Worker Motivation Is high 6.42 Survey [0..10] 23
Brain Drain Does not hinder competitiveness in your economy 6.49 Survey [0..10] 11
Quality of Life Is high 8.58 Survey [0..10] 17
Foreign High-Skilled People Are attracted to your country's business environment 8.58 Survey [0..10] 3
Remuneration in Services Professions Gross annual income including supplements such as bonuses 39,280 US$ 20
Remuneration of Management Total base salary plus bonuses and long-term incentives 250,629 US$ 8
Effective Personal Income Tax Rate Percentage of an income equal to GDP per capita 18.45 % 32
Personal Security and Private Property Rights Are adequately protected 8.85 Survey 8
Criteria Value 2016 Rank
Labor Force Growth Percentage change 2.26 % 9
Skilled Labor Is readily available 6.24 Survey [0..10] 23
Finance Skills Are readily available 7.57 Survey [0..10] 13
International Experience Of senior managers is generally significant 7.33 Survey [0..10] 6
Competent Senior Managers Are readily available 6.76 Survey [0..10] 12
Educational System Meets the needs of a competitive economy 8.18 Survey [0..10] 3
Science in Schools Is sufficiently emphasized 8.48 Survey [0..10] 1
University Education Meets the needs of a competitive economy 8.18 Survey [0..10] 2
Management Education Meets the needs of the business community 7.42 Survey [0..10] 7
Language Skills Are meeting the needs of enterprises 8.12 Survey [0..10] 10
Student Mobility Inbound Foreign tertiary-level students per 1000 inhabitants 9.06 number 3
Educational Assessment - PISA PISA survey of 15-year olds 562.00 Value 2
1538
19
OverallInvestment & Development
Appeal
1
Factor 1 : Investment and Development
Factor 2 : Appeal
Factor 3 : Readiness
Readiness
41
3331
29
38
2 2
19 18 19
14
20
6
2 1
9
17 16
10
15
2012 2013 2014 2015 2016

IMD World Talent Report 2015
71
IMD World Talent Report 2016
5 Best Ranked Criteria 5 Worst Ranked Criteria
SLOVAK REPUBLIC
Rank 2016
of 61
Criteria Value 2016 Rank
Total Public Expenditure on Education Percentage of GDP 3.78 % 45
Public Expenditure on Education per Pupil (Secondary) Percentage of GDP per capita 18.43 % 36
Pupil-Teacher Ratio (Primary Education) Ratio of students to teaching staff 16.94 ratio 40
Pupil-Teacher Ratio (Secondary Education) Ratio of students to teaching staff 12.96 ratio 34
Apprenticeships Are sufficiently implemented 5.17 Survey [0..10] 18
Employee Training Is a high priority in companies 6.20 Survey [0..10] 20
Female Labor Force Percentage of total labor force 45.06 % 36
Health Infrastructure Meets the needs of society 4.37 Survey [0..10] 42
Criteria Value 2016 Rank
Cost-of-Living Index Index of a basket of goods & services 68.40 index 14
Attracting and Retaining Talents Is a priority in companies 4.97 Survey [0..10] 59
Worker Motivation Is high 5.29 Survey [0..10] 40
Brain Drain Does not hinder competitiveness in your economy 2.87 Survey [0..10] 55
Quality of Life Is high 6.68 Survey [0..10] 32
Foreign High-Skilled People Are attracted to your country's business environment 3.12 Survey [0..10] 55
Remuneration in Services Professions Gross annual income including supplements such as bonuses 21,256 US$ 30
Remuneration of Management Total base salary plus bonuses and long-term incentives 137,382 US$ 36
Effective Personal Income Tax Rate Percentage of an income equal to GDP per capita 18.66 % 33
Personal Security and Private Property Rights Are adequately protected 4.40 Survey 53
Criteria Value 2016 Rank
Labor Force Growth Percentage change 0.88 % 29
Skilled Labor Is readily available 6.14 Survey [0..10] 26
Finance Skills Are readily available 6.07 Survey [0..10] 38
International Experience Of senior managers is generally significant 4.73 Survey [0..10] 47
Competent Senior Managers Are readily available 5.37 Survey [0..10] 38
Educational System Meets the needs of a competitive economy 4.27 Survey [0..10] 45
Science in Schools Is sufficiently emphasized 4.60 Survey [0..10] 44
University Education Meets the needs of a competitive economy 4.20 Survey [0..10] 56
Management Education Meets the needs of the business community 5.47 Survey [0..10] 40
Language Skills Are meeting the needs of enterprises 6.40 Survey [0..10] 28
Student Mobility Inbound Foreign tertiary-level students per 1000 inhabitants 1.88 number 27
Educational Assessment - PISA PISA survey of 15-year olds 476.50 Value 37
3940
49
OverallInvestment & Development
Appeal
40
Factor 1 : Investment and Development
Factor 2 : Appeal
Factor 3 : Readiness
Readiness
42
44
37
43
40
51 51
48
53
49
47 47 47
45
40
5152
4647
39
2012 2013 2014 2015 2016

IMD World Talent Report 2016
72
5 Best Ranked Criteria 5 Worst Ranked Criteria
SLOVENIA
Rank 2016
of 61
Criteria Value 2016 Rank
Total Public Expenditure on Education Percentage of GDP 5.34 % 23
Public Expenditure on Education per Pupil (Secondary) Percentage of GDP per capita 30.82 % 5
Pupil-Teacher Ratio (Primary Education) Ratio of students to teaching staff 16.00 ratio 30
Pupil-Teacher Ratio (Secondary Education) Ratio of students to teaching staff 10.80 ratio 18
Apprenticeships Are sufficiently implemented 2.66 Survey [0..10] 60
Employee Training Is a high priority in companies 5.75 Survey [0..10] 33
Female Labor Force Percentage of total labor force 45.96 % 30
Health Infrastructure Meets the needs of society 5.21 Survey [0..10] 36
Criteria Value 2016 Rank
Cost-of-Living Index Index of a basket of goods & services 64.30 index 9
Attracting and Retaining Talents Is a priority in companies 5.52 Survey [0..10] 50
Worker Motivation Is high 5.18 Survey [0..10] 44
Brain Drain Does not hinder competitiveness in your economy 3.15 Survey [0..10] 53
Quality of Life Is high 7.40 Survey [0..10] 27
Foreign High-Skilled People Are attracted to your country's business environment 2.39 Survey [0..10] 58
Remuneration in Services Professions Gross annual income including supplements such as bonuses 23,308 US$ 29
Remuneration of Management Total base salary plus bonuses and long-term incentives 117,022 US$ 39
Effective Personal Income Tax Rate Percentage of an income equal to GDP per capita 26.43 % 53
Personal Security and Private Property Rights Are adequately protected 6.91 Survey 32
Criteria Value 2016 Rank
Labor Force Growth Percentage change -0.69 % 57
Skilled Labor Is readily available 5.95 Survey [0..10] 31
Finance Skills Are readily available 5.82 Survey [0..10] 42
International Experience Of senior managers is generally significant 4.38 Survey [0..10] 54
Competent Senior Managers Are readily available 4.71 Survey [0..10] 49
Educational System Meets the needs of a competitive economy 5.15 Survey [0..10] 37
Science in Schools Is sufficiently emphasized 5.27 Survey [0..10] 34
University Education Meets the needs of a competitive economy 4.73 Survey [0..10] 45
Management Education Meets the needs of the business community 5.85 Survey [0..10] 35
Language Skills Are meeting the needs of enterprises 7.66 Survey [0..10] 16
Student Mobility Inbound Foreign tertiary-level students per 1000 inhabitants 1.24 number 36
Educational Assessment - PISA PISA survey of 15-year olds 507.50 Value 18
3520
47
OverallInvestment & Development
Appeal
39
Factor 1 : Investment and Development
Factor 2 : Appeal
Factor 3 : Readiness
Readiness
21
3028
24
20
4142
5554
47
51
54
4139 39
43
4749
38
35
2012 2013 2014 2015 2016
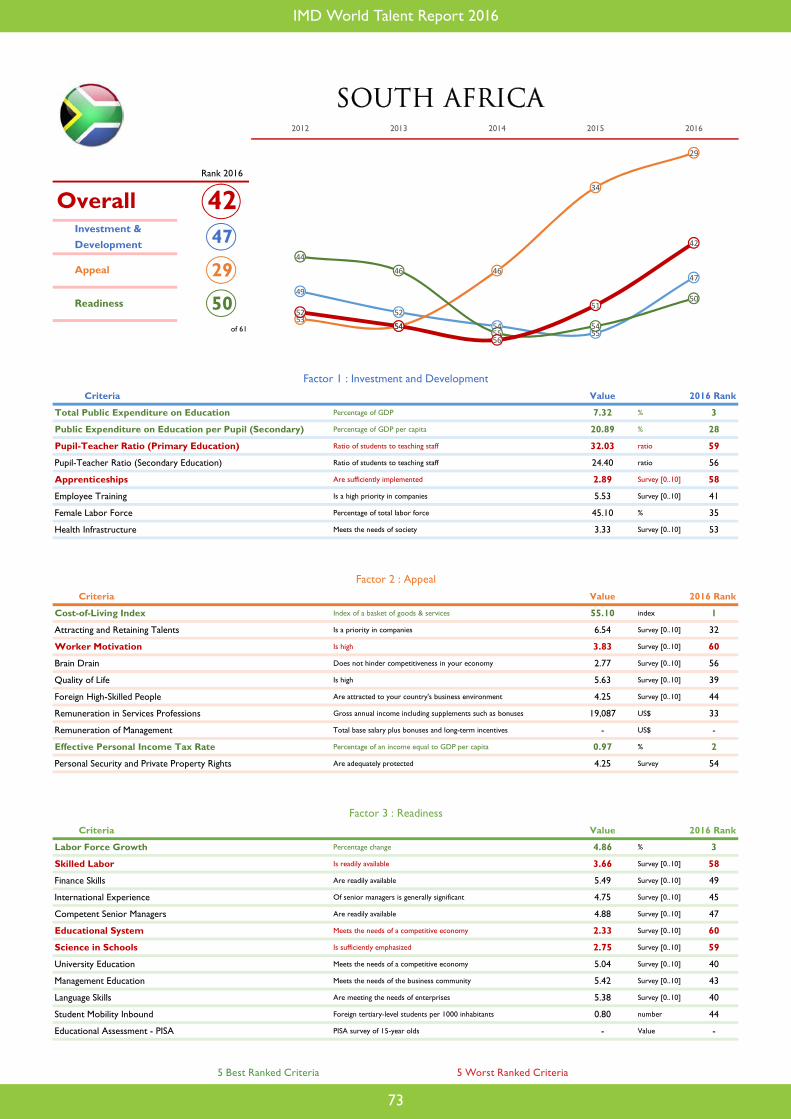
IMD World Talent Report 2015
73
IMD World Talent Report 2016
5 Best Ranked Criteria 5 Worst Ranked Criteria
SOUTH AFRICA
Rank 2016
of 61
Criteria Value 2016 Rank
Total Public Expenditure on Education Percentage of GDP 7.32 % 3
Public Expenditure on Education per Pupil (Secondary) Percentage of GDP per capita 20.89 % 28
Pupil-Teacher Ratio (Primary Education) Ratio of students to teaching staff 32.03 ratio 59
Pupil-Teacher Ratio (Secondary Education) Ratio of students to teaching staff 24.40 ratio 56
Apprenticeships Are sufficiently implemented 2.89 Survey [0..10] 58
Employee Training Is a high priority in companies 5.53 Survey [0..10] 41
Female Labor Force Percentage of total labor force 45.10 % 35
Health Infrastructure Meets the needs of society 3.33 Survey [0..10] 53
Criteria Value 2016 Rank
Cost-of-Living Index Index of a basket of goods & services 55.10 index 1
Attracting and Retaining Talents Is a priority in companies 6.54 Survey [0..10] 32
Worker Motivation Is high 3.83 Survey [0..10] 60
Brain Drain Does not hinder competitiveness in your economy 2.77 Survey [0..10] 56
Quality of Life Is high 5.63 Survey [0..10] 39
Foreign High-Skilled People Are attracted to your country's business environment 4.25 Survey [0..10] 44
Remuneration in Services Professions Gross annual income including supplements such as bonuses 19,087 US$ 33
Remuneration of Management Total base salary plus bonuses and long-term incentives - US$ -
Effective Personal Income Tax Rate Percentage of an income equal to GDP per capita 0.97 % 2
Personal Security and Private Property Rights Are adequately protected 4.25 Survey 54
Criteria Value 2016 Rank
Labor Force Growth Percentage change 4.86 % 3
Skilled Labor Is readily available 3.66 Survey [0..10] 58
Finance Skills Are readily available 5.49 Survey [0..10] 49
International Experience Of senior managers is generally significant 4.75 Survey [0..10] 45
Competent Senior Managers Are readily available 4.88 Survey [0..10] 47
Educational System Meets the needs of a competitive economy 2.33 Survey [0..10] 60
Science in Schools Is sufficiently emphasized 2.75 Survey [0..10] 59
University Education Meets the needs of a competitive economy 5.04 Survey [0..10] 40
Management Education Meets the needs of the business community 5.42 Survey [0..10] 43
Language Skills Are meeting the needs of enterprises 5.38 Survey [0..10] 40
Student Mobility Inbound Foreign tertiary-level students per 1000 inhabitants 0.80 number 44
Educational Assessment - PISA PISA survey of 15-year olds - Value -
4247
29
OverallInvestment & Development
Appeal
50
Factor 1 : Investment and Development
Factor 2 : Appeal
Factor 3 : Readiness
Readiness49
52
5455
47
5354
46
34
29
44
46
5554
50
52
54
56
51
42
2012 2013 2014 2015 2016

IMD World Talent Report 2016
74
5 Best Ranked Criteria 5 Worst Ranked Criteria
SPAIN
Rank 2016
of 61
Criteria Value 2016 Rank
Total Public Expenditure on Education Percentage of GDP 4.49 % 35
Public Expenditure on Education per Pupil (Secondary) Percentage of GDP per capita 25.78 % 14
Pupil-Teacher Ratio (Primary Education) Ratio of students to teaching staff 14.00 ratio 23
Pupil-Teacher Ratio (Secondary Education) Ratio of students to teaching staff 11.30 ratio 22
Apprenticeships Are sufficiently implemented 3.79 Survey [0..10] 51
Employee Training Is a high priority in companies 4.30 Survey [0..10] 61
Female Labor Force Percentage of total labor force 46.25 % 28
Health Infrastructure Meets the needs of society 7.98 Survey [0..10] 10
Criteria Value 2016 Rank
Cost-of-Living Index Index of a basket of goods & services 71.60 index 19
Attracting and Retaining Talents Is a priority in companies 5.04 Survey [0..10] 58
Worker Motivation Is high 4.82 Survey [0..10] 51
Brain Drain Does not hinder competitiveness in your economy 4.51 Survey [0..10] 34
Quality of Life Is high 8.10 Survey [0..10] 21
Foreign High-Skilled People Are attracted to your country's business environment 4.75 Survey [0..10] 35
Remuneration in Services Professions Gross annual income including supplements such as bonuses 32,662 US$ 24
Remuneration of Management Total base salary plus bonuses and long-term incentives 188,937 US$ 21
Effective Personal Income Tax Rate Percentage of an income equal to GDP per capita 13.62 % 19
Personal Security and Private Property Rights Are adequately protected 7.44 Survey 28
Criteria Value 2016 Rank
Labor Force Growth Percentage change -0.14 % 55
Skilled Labor Is readily available 6.29 Survey [0..10] 20
Finance Skills Are readily available 5.66 Survey [0..10] 47
International Experience Of senior managers is generally significant 4.50 Survey [0..10] 50
Competent Senior Managers Are readily available 5.10 Survey [0..10] 43
Educational System Meets the needs of a competitive economy 4.57 Survey [0..10] 39
Science in Schools Is sufficiently emphasized 4.13 Survey [0..10] 47
University Education Meets the needs of a competitive economy 4.40 Survey [0..10] 51
Management Education Meets the needs of the business community 5.74 Survey [0..10] 37
Language Skills Are meeting the needs of enterprises 3.67 Survey [0..10] 54
Student Mobility Inbound Foreign tertiary-level students per 1000 inhabitants 1.21 number 37
Educational Assessment - PISA PISA survey of 15-year olds 490.00 Value 27
3229
28
OverallInvestment & Development
Appeal
45
Factor 1 : Investment and Development
Factor 2 : Appeal
Factor 3 : Readiness
Readiness
30
3940
36
29
48
46
43
33
28
46
4849
4645
48
4645
39
32
2012 2013 2014 2015 2016

IMD World Talent Report 2015
75
IMD World Talent Report 2016
5 Best Ranked Criteria 5 Worst Ranked Criteria
SWEDEN
Rank 2016
of 61
Criteria Value 2016 Rank
Total Public Expenditure on Education Percentage of GDP 6.63 % 6
Public Expenditure on Education per Pupil (Secondary) Percentage of GDP per capita 31.09 % 4
Pupil-Teacher Ratio (Primary Education) Ratio of students to teaching staff 12.67 ratio 16
Pupil-Teacher Ratio (Secondary Education) Ratio of students to teaching staff 12.43 ratio 29
Apprenticeships Are sufficiently implemented 4.39 Survey [0..10] 39
Employee Training Is a high priority in companies 7.00 Survey [0..10] 8
Female Labor Force Percentage of total labor force 47.62 % 11
Health Infrastructure Meets the needs of society 7.54 Survey [0..10] 16
Criteria Value 2016 Rank
Cost-of-Living Index Index of a basket of goods & services 72.50 index 22
Attracting and Retaining Talents Is a priority in companies 7.76 Survey [0..10] 9
Worker Motivation Is high 7.42 Survey [0..10] 7
Brain Drain Does not hinder competitiveness in your economy 7.30 Survey [0..10] 4
Quality of Life Is high 9.17 Survey [0..10] 10
Foreign High-Skilled People Are attracted to your country's business environment 5.76 Survey [0..10] 23
Remuneration in Services Professions Gross annual income including supplements such as bonuses 47,831 US$ 9
Remuneration of Management Total base salary plus bonuses and long-term incentives 213,846 US$ 14
Effective Personal Income Tax Rate Percentage of an income equal to GDP per capita 23.16 % 47
Personal Security and Private Property Rights Are adequately protected 8.36 Survey 15
Criteria Value 2016 Rank
Labor Force Growth Percentage change 0.78 % 33
Skilled Labor Is readily available 6.39 Survey [0..10] 17
Finance Skills Are readily available 7.82 Survey [0..10] 9
International Experience Of senior managers is generally significant 7.02 Survey [0..10] 8
Competent Senior Managers Are readily available 7.03 Survey [0..10] 4
Educational System Meets the needs of a competitive economy 6.12 Survey [0..10] 25
Science in Schools Is sufficiently emphasized 5.64 Survey [0..10] 25
University Education Meets the needs of a competitive economy 7.09 Survey [0..10] 18
Management Education Meets the needs of the business community 7.41 Survey [0..10] 8
Language Skills Are meeting the needs of enterprises 8.76 Survey [0..10] 4
Student Mobility Inbound Foreign tertiary-level students per 1000 inhabitants 2.64 number 22
Educational Assessment - PISA PISA survey of 15-year olds 481.50 Value 35
46
4
OverallInvestment & Development
Appeal
14
Factor 1 : Investment and Development
Factor 2 : Appeal
Factor 3 : Readiness
Readiness
2
45
8
66
4
13 13
4
9
6
12
1514
3 3
9
11
4
2012 2013 2014 2015 2016

IMD World Talent Report 2016
76
5 Best Ranked Criteria 5 Worst Ranked Criteria
SWITZERLAND
Rank 2016
of 61
Criteria Value 2016 Rank
Total Public Expenditure on Education Percentage of GDP 5.97 % 12
Public Expenditure on Education per Pupil (Secondary) Percentage of GDP per capita 26.05 % 12
Pupil-Teacher Ratio (Primary Education) Ratio of students to teaching staff 15.00 ratio 26
Pupil-Teacher Ratio (Secondary Education) Ratio of students to teaching staff 11.40 ratio 23
Apprenticeships Are sufficiently implemented 8.94 Survey [0..10] 1
Employee Training Is a high priority in companies 7.73 Survey [0..10] 1
Female Labor Force Percentage of total labor force 46.64 % 22
Health Infrastructure Meets the needs of society 9.25 Survey [0..10] 1
Criteria Value 2016 Rank
Cost-of-Living Index Index of a basket of goods & services 114.60 index 58
Attracting and Retaining Talents Is a priority in companies 7.83 Survey [0..10] 6
Worker Motivation Is high 8.06 Survey [0..10] 2
Brain Drain Does not hinder competitiveness in your economy 7.97 Survey [0..10] 2
Quality of Life Is high 9.83 Survey [0..10] 1
Foreign High-Skilled People Are attracted to your country's business environment 9.16 Survey [0..10] 1
Remuneration in Services Professions Gross annual income including supplements such as bonuses 92,625 US$ 1
Remuneration of Management Total base salary plus bonuses and long-term incentives 424,018 US$ 1
Effective Personal Income Tax Rate Percentage of an income equal to GDP per capita 11.78 % 17
Personal Security and Private Property Rights Are adequately protected 9.11 Survey 3
Criteria Value 2016 Rank
Labor Force Growth Percentage change 1.46 % 17
Skilled Labor Is readily available 6.91 Survey [0..10] 8
Finance Skills Are readily available 8.30 Survey [0..10] 3
International Experience Of senior managers is generally significant 8.03 Survey [0..10] 1
Competent Senior Managers Are readily available 7.01 Survey [0..10] 5
Educational System Meets the needs of a competitive economy 9.11 Survey [0..10] 1
Science in Schools Is sufficiently emphasized 8.16 Survey [0..10] 2
University Education Meets the needs of a competitive economy 8.80 Survey [0..10] 1
Management Education Meets the needs of the business community 8.69 Survey [0..10] 1
Language Skills Are meeting the needs of enterprises 8.90 Survey [0..10] 2
Student Mobility Inbound Foreign tertiary-level students per 1000 inhabitants 5.86 number 7
Educational Assessment - PISA PISA survey of 15-year olds 523.00 Value 9
13
1
OverallInvestment & Development
Appeal
2
Factor 1 : Investment and Development
Factor 2 : Appeal
Factor 3 : Readiness
Readiness
7
3
2 2
3
1 1 1 1 11
3
1 1
2
1 1 1 1 1
2012 2013 2014 2015 2016

IMD World Talent Report 2015
77
IMD World Talent Report 2016
5 Best Ranked Criteria 5 Worst Ranked Criteria
TAIWAN
Rank 2016
of 61
Criteria Value 2016 Rank
Total Public Expenditure on Education Percentage of GDP 4.02 % 42
Public Expenditure on Education per Pupil (Secondary) Percentage of GDP per capita 22.92 % 23
Pupil-Teacher Ratio (Primary Education) Ratio of students to teaching staff 13.30 ratio 21
Pupil-Teacher Ratio (Secondary Education) Ratio of students to teaching staff 15.10 ratio 43
Apprenticeships Are sufficiently implemented 5.23 Survey [0..10] 17
Employee Training Is a high priority in companies 6.37 Survey [0..10] 17
Female Labor Force Percentage of total labor force 44.17 % 40
Health Infrastructure Meets the needs of society 7.73 Survey [0..10] 13
Criteria Value 2016 Rank
Cost-of-Living Index Index of a basket of goods & services 84.10 index 43
Attracting and Retaining Talents Is a priority in companies 6.45 Survey [0..10] 36
Worker Motivation Is high 6.79 Survey [0..10] 15
Brain Drain Does not hinder competitiveness in your economy 3.69 Survey [0..10] 45
Quality of Life Is high 7.07 Survey [0..10] 29
Foreign High-Skilled People Are attracted to your country's business environment 3.62 Survey [0..10] 51
Remuneration in Services Professions Gross annual income including supplements such as bonuses 26,313 US$ 28
Remuneration of Management Total base salary plus bonuses and long-term incentives 148,920 US$ 30
Effective Personal Income Tax Rate Percentage of an income equal to GDP per capita 6.46 % 8
Personal Security and Private Property Rights Are adequately protected 7.86 Survey 24
Criteria Value 2016 Rank
Labor Force Growth Percentage change 0.89 % 28
Skilled Labor Is readily available 5.54 Survey [0..10] 39
Finance Skills Are readily available 6.71 Survey [0..10] 27
International Experience Of senior managers is generally significant 4.83 Survey [0..10] 42
Competent Senior Managers Are readily available 5.60 Survey [0..10] 34
Educational System Meets the needs of a competitive economy 6.34 Survey [0..10] 21
Science in Schools Is sufficiently emphasized 6.31 Survey [0..10] 15
University Education Meets the needs of a competitive economy 5.47 Survey [0..10] 35
Management Education Meets the needs of the business community 5.98 Survey [0..10] 33
Language Skills Are meeting the needs of enterprises 5.52 Survey [0..10] 39
Student Mobility Inbound Foreign tertiary-level students per 1000 inhabitants 3.41 number 20
Educational Assessment - PISA PISA survey of 15-year olds 541.50 Value 6
2428
26
OverallInvestment & Development
Appeal
26
Factor 1 : Investment and Development
Factor 2 : Appeal
Factor 3 : Readiness
Readiness
28
2627
18
28
13
21
30
26 26
20
2625 25
26
19
23
27
2324
2012 2013 2014 2015 2016

IMD World Talent Report 2016
78
5 Best Ranked Criteria 5 Worst Ranked Criteria
THAILAND
Rank 2016
of 61
Criteria Value 2016 Rank
Total Public Expenditure on Education Percentage of GDP 3.95 % 43
Public Expenditure on Education per Pupil (Secondary) Percentage of GDP per capita 19.69 % 33
Pupil-Teacher Ratio (Primary Education) Ratio of students to teaching staff 16.28 ratio 34
Pupil-Teacher Ratio (Secondary Education) Ratio of students to teaching staff 19.91 ratio 54
Apprenticeships Are sufficiently implemented 5.43 Survey [0..10] 14
Employee Training Is a high priority in companies 6.27 Survey [0..10] 18
Female Labor Force Percentage of total labor force 45.56 % 33
Health Infrastructure Meets the needs of society 6.09 Survey [0..10] 31
Criteria Value 2016 Rank
Cost-of-Living Index Index of a basket of goods & services 82.00 index 42
Attracting and Retaining Talents Is a priority in companies 6.89 Survey [0..10] 29
Worker Motivation Is high 6.34 Survey [0..10] 26
Brain Drain Does not hinder competitiveness in your economy 5.59 Survey [0..10] 25
Quality of Life Is high 6.39 Survey [0..10] 35
Foreign High-Skilled People Are attracted to your country's business environment 5.86 Survey [0..10] 22
Remuneration in Services Professions Gross annual income including supplements such as bonuses 12,901 US$ 46
Remuneration of Management Total base salary plus bonuses and long-term incentives 151,246 US$ 34
Effective Personal Income Tax Rate Percentage of an income equal to GDP per capita 4.33 % 5
Personal Security and Private Property Rights Are adequately protected 7.04 Survey 30
Criteria Value 2016 Rank
Labor Force Growth Percentage change -0.07 % 53
Skilled Labor Is readily available 5.71 Survey [0..10] 35
Finance Skills Are readily available 6.04 Survey [0..10] 40
International Experience Of senior managers is generally significant 6.02 Survey [0..10] 18
Competent Senior Managers Are readily available 5.93 Survey [0..10] 26
Educational System Meets the needs of a competitive economy 4.30 Survey [0..10] 44
Science in Schools Is sufficiently emphasized 4.09 Survey [0..10] 49
University Education Meets the needs of a competitive economy 4.62 Survey [0..10] 47
Management Education Meets the needs of the business community 5.26 Survey [0..10] 45
Language Skills Are meeting the needs of enterprises 3.86 Survey [0..10] 52
Student Mobility Inbound Foreign tertiary-level students per 1000 inhabitants 0.32 number 51
Educational Assessment - PISA PISA survey of 15-year olds 435.50 Value 44
3742
24
OverallInvestment & Development
Appeal
49
Factor 1 : Investment and Development
Factor 2 : Appeal
Factor 3 : Readiness
Readiness45
36
44
19
42
3637
20
2524
19
16
43
5049
27 27
34 34
37
2012 2013 2014 2015 2016

IMD World Talent Report 2015
79
IMD World Talent Report 2016
5 Best Ranked Criteria 5 Worst Ranked Criteria
TURKEY
Rank 2016
of 61
Criteria Value 2016 Rank
Total Public Expenditure on Education Percentage of GDP 4.18 % 39
Public Expenditure on Education per Pupil (Secondary) Percentage of GDP per capita 14.65 % 52
Pupil-Teacher Ratio (Primary Education) Ratio of students to teaching staff 19.83 ratio 51
Pupil-Teacher Ratio (Secondary Education) Ratio of students to teaching staff 19.28 ratio 53
Apprenticeships Are sufficiently implemented 4.31 Survey [0..10] 41
Employee Training Is a high priority in companies 5.02 Survey [0..10] 49
Female Labor Force Percentage of total labor force 31.08 % 55
Health Infrastructure Meets the needs of society 6.58 Survey [0..10] 28
Criteria Value 2016 Rank
Cost-of-Living Index Index of a basket of goods & services 73.40 index 24
Attracting and Retaining Talents Is a priority in companies 6.42 Survey [0..10] 39
Worker Motivation Is high 6.11 Survey [0..10] 29
Brain Drain Does not hinder competitiveness in your economy 5.51 Survey [0..10] 27
Quality of Life Is high 4.94 Survey [0..10] 48
Foreign High-Skilled People Are attracted to your country's business environment 4.62 Survey [0..10] 38
Remuneration in Services Professions Gross annual income including supplements such as bonuses 14,324 US$ 40
Remuneration of Management Total base salary plus bonuses and long-term incentives 141,292 US$ 40
Effective Personal Income Tax Rate Percentage of an income equal to GDP per capita 21.40 % 41
Personal Security and Private Property Rights Are adequately protected 5.66 Survey 42
Criteria Value 2016 Rank
Labor Force Growth Percentage change 3.10 % 6
Skilled Labor Is readily available 6.15 Survey [0..10] 25
Finance Skills Are readily available 6.75 Survey [0..10] 26
International Experience Of senior managers is generally significant 5.73 Survey [0..10] 27
Competent Senior Managers Are readily available 6.42 Survey [0..10] 16
Educational System Meets the needs of a competitive economy 3.85 Survey [0..10] 51
Science in Schools Is sufficiently emphasized 3.69 Survey [0..10] 52
University Education Meets the needs of a competitive economy 4.23 Survey [0..10] 54
Management Education Meets the needs of the business community 5.04 Survey [0..10] 47
Language Skills Are meeting the needs of enterprises 4.53 Survey [0..10] 48
Student Mobility Inbound Foreign tertiary-level students per 1000 inhabitants 0.71 number 46
Educational Assessment - PISA PISA survey of 15-year olds 455.50 Value 40
4654
44
OverallInvestment & Development
Appeal
38
Factor 1 : Investment and Development
Factor 2 : Appeal
Factor 3 : Readiness
Readiness
5758
49
57
54
29 2928
4644
34
30
34
41
3840
3635
46 46
2012 2013 2014 2015 2016

IMD World Talent Report 2016
80
5 Best Ranked Criteria 5 Worst Ranked Criteria
UAE
Rank 2016
of 61
Criteria Value 2016 Rank
Total Public Expenditure on Education Percentage of GDP 1.10 % 60
Public Expenditure on Education per Pupil (Secondary) Percentage of GDP per capita 18.32 % 38
Pupil-Teacher Ratio (Primary Education) Ratio of students to teaching staff 16.07 ratio 32
Pupil-Teacher Ratio (Secondary Education) Ratio of students to teaching staff 11.50 ratio 24
Apprenticeships Are sufficiently implemented 5.74 Survey [0..10] 11
Employee Training Is a high priority in companies 6.78 Survey [0..10] 12
Female Labor Force Percentage of total labor force 12.37 % 59
Health Infrastructure Meets the needs of society 7.71 Survey [0..10] 14
Criteria Value 2016 Rank
Cost-of-Living Index Index of a basket of goods & services 90.10 index 48
Attracting and Retaining Talents Is a priority in companies 7.24 Survey [0..10] 20
Worker Motivation Is high 6.88 Survey [0..10] 13
Brain Drain Does not hinder competitiveness in your economy 6.62 Survey [0..10] 9
Quality of Life Is high 8.86 Survey [0..10] 14
Foreign High-Skilled People Are attracted to your country's business environment 8.24 Survey [0..10] 5
Remuneration in Services Professions Gross annual income including supplements such as bonuses 35,346 US$ 25
Remuneration of Management Total base salary plus bonuses and long-term incentives 192,350 US$ 19
Effective Personal Income Tax Rate Percentage of an income equal to GDP per capita 5.87 % 7
Personal Security and Private Property Rights Are adequately protected 8.03 Survey 22
Criteria Value 2016 Rank
Labor Force Growth Percentage change 0.78 % 34
Skilled Labor Is readily available 6.28 Survey [0..10] 21
Finance Skills Are readily available 6.97 Survey [0..10] 23
International Experience Of senior managers is generally significant 7.52 Survey [0..10] 3
Competent Senior Managers Are readily available 6.93 Survey [0..10] 6
Educational System Meets the needs of a competitive economy 7.55 Survey [0..10] 12
Science in Schools Is sufficiently emphasized 7.03 Survey [0..10] 4
University Education Meets the needs of a competitive economy 7.13 Survey [0..10] 17
Management Education Meets the needs of the business community 7.15 Survey [0..10] 14
Language Skills Are meeting the needs of enterprises 8.07 Survey [0..10] 11
Student Mobility Inbound Foreign tertiary-level students per 1000 inhabitants 6.55 number 5
Educational Assessment - PISA PISA survey of 15-year olds 441.00 Value 43
2656
10
OverallInvestment & Development
Appeal
10
Factor 1 : Investment and Development
Factor 2 : Appeal
Factor 3 : Readiness
Readiness
55
4952 51
56
16
5 68
10
16
25
710
23
14 15
20
26
2012 2013 2014 2015 2016
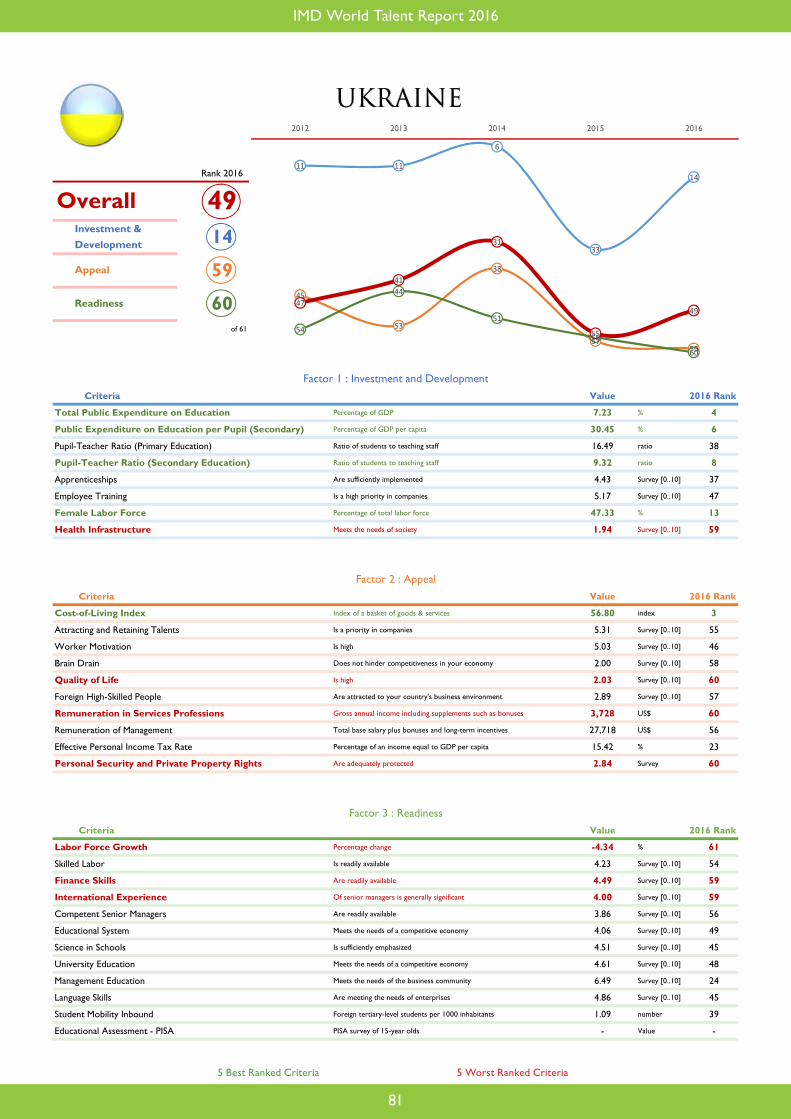
IMD World Talent Report 2015
81
IMD World Talent Report 2016
5 Best Ranked Criteria 5 Worst Ranked Criteria
UKRAINE
Rank 2016
of 61
Criteria Value 2016 Rank
Total Public Expenditure on Education Percentage of GDP 7.23 % 4
Public Expenditure on Education per Pupil (Secondary) Percentage of GDP per capita 30.45 % 6
Pupil-Teacher Ratio (Primary Education) Ratio of students to teaching staff 16.49 ratio 38
Pupil-Teacher Ratio (Secondary Education) Ratio of students to teaching staff 9.32 ratio 8
Apprenticeships Are sufficiently implemented 4.43 Survey [0..10] 37
Employee Training Is a high priority in companies 5.17 Survey [0..10] 47
Female Labor Force Percentage of total labor force 47.33 % 13
Health Infrastructure Meets the needs of society 1.94 Survey [0..10] 59
Criteria Value 2016 Rank
Cost-of-Living Index Index of a basket of goods & services 56.80 index 3
Attracting and Retaining Talents Is a priority in companies 5.31 Survey [0..10] 55
Worker Motivation Is high 5.03 Survey [0..10] 46
Brain Drain Does not hinder competitiveness in your economy 2.00 Survey [0..10] 58
Quality of Life Is high 2.03 Survey [0..10] 60
Foreign High-Skilled People Are attracted to your country's business environment 2.89 Survey [0..10] 57
Remuneration in Services Professions Gross annual income including supplements such as bonuses 3,728 US$ 60
Remuneration of Management Total base salary plus bonuses and long-term incentives 27,718 US$ 56
Effective Personal Income Tax Rate Percentage of an income equal to GDP per capita 15.42 % 23
Personal Security and Private Property Rights Are adequately protected 2.84 Survey 60
Criteria Value 2016 Rank
Labor Force Growth Percentage change -4.34 % 61
Skilled Labor Is readily available 4.23 Survey [0..10] 54
Finance Skills Are readily available 4.49 Survey [0..10] 59
International Experience Of senior managers is generally significant 4.00 Survey [0..10] 59
Competent Senior Managers Are readily available 3.86 Survey [0..10] 56
Educational System Meets the needs of a competitive economy 4.06 Survey [0..10] 49
Science in Schools Is sufficiently emphasized 4.51 Survey [0..10] 45
University Education Meets the needs of a competitive economy 4.61 Survey [0..10] 48
Management Education Meets the needs of the business community 6.49 Survey [0..10] 24
Language Skills Are meeting the needs of enterprises 4.86 Survey [0..10] 45
Student Mobility Inbound Foreign tertiary-level students per 1000 inhabitants 1.09 number 39
Educational Assessment - PISA PISA survey of 15-year olds - Value -
4914
59
OverallInvestment & Development
Appeal
60
Factor 1 : Investment and Development
Factor 2 : Appeal
Factor 3 : Readiness
Readiness
11 11
6
33
14
45
53
38
5759
54
44
51
56
60
47
41
31
55
49
2012 2013 2014 2015 2016

IMD World Talent Report 2016
82
5 Best Ranked Criteria 5 Worst Ranked Criteria
UNITED KINGDOM
Rank 2016
of 61
Criteria Value 2016 Rank
Total Public Expenditure on Education Percentage of GDP 5.39 % 20
Public Expenditure on Education per Pupil (Secondary) Percentage of GDP per capita 22.51 % 27
Pupil-Teacher Ratio (Primary Education) Ratio of students to teaching staff 20.67 ratio 53
Pupil-Teacher Ratio (Secondary Education) Ratio of students to teaching staff 18.50 ratio 52
Apprenticeships Are sufficiently implemented 4.74 Survey [0..10] 32
Employee Training Is a high priority in companies 5.62 Survey [0..10] 38
Female Labor Force Percentage of total labor force 46.63 % 23
Health Infrastructure Meets the needs of society 6.44 Survey [0..10] 29
Criteria Value 2016 Rank
Cost-of-Living Index Index of a basket of goods & services 102.40 index 52
Attracting and Retaining Talents Is a priority in companies 7.42 Survey [0..10] 16
Worker Motivation Is high 6.34 Survey [0..10] 25
Brain Drain Does not hinder competitiveness in your economy 6.42 Survey [0..10] 12
Quality of Life Is high 7.92 Survey [0..10] 24
Foreign High-Skilled People Are attracted to your country's business environment 8.32 Survey [0..10] 4
Remuneration in Services Professions Gross annual income including supplements such as bonuses 45,691 US$ 13
Remuneration of Management Total base salary plus bonuses and long-term incentives 278,414 US$ 6
Effective Personal Income Tax Rate Percentage of an income equal to GDP per capita 20.59 % 37
Personal Security and Private Property Rights Are adequately protected 8.50 Survey 13
Criteria Value 2016 Rank
Labor Force Growth Percentage change 0.64 % 37
Skilled Labor Is readily available 5.84 Survey [0..10] 33
Finance Skills Are readily available 7.78 Survey [0..10] 11
International Experience Of senior managers is generally significant 6.14 Survey [0..10] 15
Competent Senior Managers Are readily available 6.38 Survey [0..10] 18
Educational System Meets the needs of a competitive economy 6.51 Survey [0..10] 18
Science in Schools Is sufficiently emphasized 5.53 Survey [0..10] 29
University Education Meets the needs of a competitive economy 6.63 Survey [0..10] 22
Management Education Meets the needs of the business community 6.63 Survey [0..10] 21
Language Skills Are meeting the needs of enterprises 4.02 Survey [0..10] 51
Student Mobility Inbound Foreign tertiary-level students per 1000 inhabitants 6.52 number 6
Educational Assessment - PISA PISA survey of 15-year olds 504.00 Value 20
2036
16
OverallInvestment & Development
Appeal
20
Factor 1 : Investment and Development
Factor 2 : Appeal
Factor 3 : Readiness
Readiness
23
25
29
27
36
28
25
15
12
16
23
15
23
20 2021 21
2021
20
2012 2013 2014 2015 2016
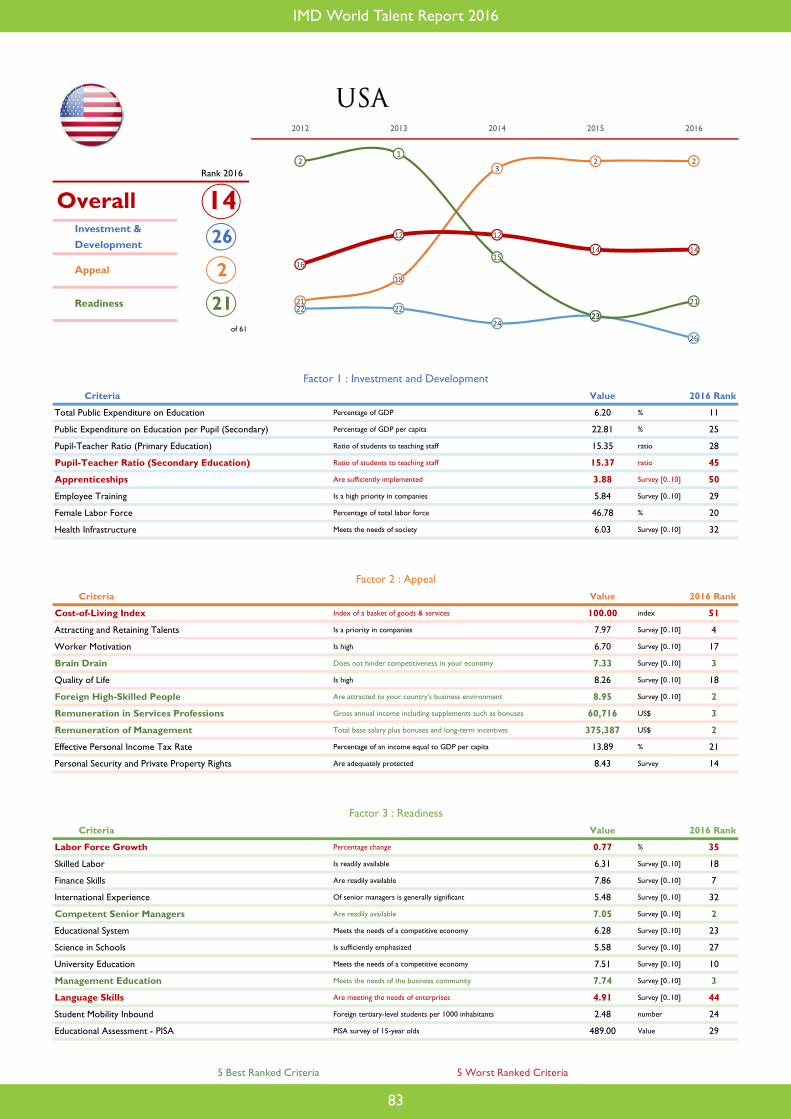
IMD World Talent Report 2015
83
IMD World Talent Report 2016
5 Best Ranked Criteria 5 Worst Ranked Criteria
USA
Rank 2016
of 61
Criteria Value 2016 Rank
Total Public Expenditure on Education Percentage of GDP 6.20 % 11
Public Expenditure on Education per Pupil (Secondary) Percentage of GDP per capita 22.81 % 25
Pupil-Teacher Ratio (Primary Education) Ratio of students to teaching staff 15.35 ratio 28
Pupil-Teacher Ratio (Secondary Education) Ratio of students to teaching staff 15.37 ratio 45
Apprenticeships Are sufficiently implemented 3.88 Survey [0..10] 50
Employee Training Is a high priority in companies 5.84 Survey [0..10] 29
Female Labor Force Percentage of total labor force 46.78 % 20
Health Infrastructure Meets the needs of society 6.03 Survey [0..10] 32
Criteria Value 2016 Rank
Cost-of-Living Index Index of a basket of goods & services 100.00 index 51
Attracting and Retaining Talents Is a priority in companies 7.97 Survey [0..10] 4
Worker Motivation Is high 6.70 Survey [0..10] 17
Brain Drain Does not hinder competitiveness in your economy 7.33 Survey [0..10] 3
Quality of Life Is high 8.26 Survey [0..10] 18
Foreign High-Skilled People Are attracted to your country's business environment 8.95 Survey [0..10] 2
Remuneration in Services Professions Gross annual income including supplements such as bonuses 60,716 US$ 3
Remuneration of Management Total base salary plus bonuses and long-term incentives 375,387 US$ 2
Effective Personal Income Tax Rate Percentage of an income equal to GDP per capita 13.89 % 21
Personal Security and Private Property Rights Are adequately protected 8.43 Survey 14
Criteria Value 2016 Rank
Labor Force Growth Percentage change 0.77 % 35
Skilled Labor Is readily available 6.31 Survey [0..10] 18
Finance Skills Are readily available 7.86 Survey [0..10] 7
International Experience Of senior managers is generally significant 5.48 Survey [0..10] 32
Competent Senior Managers Are readily available 7.05 Survey [0..10] 2
Educational System Meets the needs of a competitive economy 6.28 Survey [0..10] 23
Science in Schools Is sufficiently emphasized 5.58 Survey [0..10] 27
University Education Meets the needs of a competitive economy 7.51 Survey [0..10] 10
Management Education Meets the needs of the business community 7.74 Survey [0..10] 3
Language Skills Are meeting the needs of enterprises 4.91 Survey [0..10] 44
Student Mobility Inbound Foreign tertiary-level students per 1000 inhabitants 2.48 number 24
Educational Assessment - PISA PISA survey of 15-year olds 489.00 Value 29
1426
2
OverallInvestment & Development
Appeal
21
Factor 1 : Investment and Development
Factor 2 : Appeal
Factor 3 : Readiness
Readiness 22 22
2423
26
21
18
32 22
1
15
23
21
16
12 12
14 14
2012 2013 2014 2015 2016

IMD World Talent Report 2016
84
5 Best Ranked Criteria 5 Worst Ranked Criteria
VENEZUELA
Rank 2016
of 61
Criteria Value 2016 Rank
Total Public Expenditure on Education Percentage of GDP - % -
Public Expenditure on Education per Pupil (Secondary) Percentage of GDP per capita 16.61 % 44
Pupil-Teacher Ratio (Primary Education) Ratio of students to teaching staff 14.51 ratio 25
Pupil-Teacher Ratio (Secondary Education) Ratio of students to teaching staff 7.90 ratio 2
Apprenticeships Are sufficiently implemented 3.72 Survey [0..10] 52
Employee Training Is a high priority in companies 4.92 Survey [0..10] 54
Female Labor Force Percentage of total labor force 38.85 % 50
Health Infrastructure Meets the needs of society 0.84 Survey [0..10] 61
Criteria Value 2016 Rank
Cost-of-Living Index Index of a basket of goods & services 102.50 index 53
Attracting and Retaining Talents Is a priority in companies 6.08 Survey [0..10] 43
Worker Motivation Is high 2.80 Survey [0..10] 61
Brain Drain Does not hinder competitiveness in your economy 1.56 Survey [0..10] 61
Quality of Life Is high 0.96 Survey [0..10] 61
Foreign High-Skilled People Are attracted to your country's business environment 0.92 Survey [0..10] 61
Remuneration in Services Professions Gross annual income including supplements such as bonuses 14,400 US$ 42
Remuneration of Management Total base salary plus bonuses and long-term incentives 87,039 US$ 52
Effective Personal Income Tax Rate Percentage of an income equal to GDP per capita 3.10 % 4
Personal Security and Private Property Rights Are adequately protected 0.45 Survey 61
Criteria Value 2016 Rank
Labor Force Growth Percentage change -2.76 % 60
Skilled Labor Is readily available 4.16 Survey [0..10] 56
Finance Skills Are readily available 4.98 Survey [0..10] 55
International Experience Of senior managers is generally significant 4.71 Survey [0..10] 48
Competent Senior Managers Are readily available 4.00 Survey [0..10] 53
Educational System Meets the needs of a competitive economy 2.00 Survey [0..10] 61
Science in Schools Is sufficiently emphasized 2.52 Survey [0..10] 61
University Education Meets the needs of a competitive economy 4.08 Survey [0..10] 57
Management Education Meets the needs of the business community 4.28 Survey [0..10] 58
Language Skills Are meeting the needs of enterprises 3.04 Survey [0..10] 60
Student Mobility Inbound Foreign tertiary-level students per 1000 inhabitants - number -
Educational Assessment - PISA PISA survey of 15-year olds - Value -
6145
61
OverallInvestment & Development
Appeal
61
Factor 1 : Investment and Development
Factor 2 : Appeal
Factor 3 : Readiness
Readiness
38
42
36
4645
57
5960
61 61
5960
5655
61
5859 59
6061
2012 2013 2014 2015 2016

IMD World Talent Report 2015
85
IMD World Talent Report 2016
5 Best Ranked Criteria 5 Worst Ranked Criteria
Criter
ia

IMD World Talent Report 2016
86
1 Denmark - 96.9
2 Belgium +2 92.6
3 Switzerland -1 91.4
4 Austria -1 90.0
5 Finland - 88.1
6 Sweden +2 86.4
7 Norway -1 83.2
8 Portugal +3 83.0
9 Estonia +7 80.8
10 Lithuania - 79.6
11 Germany -4 78.5
12 Iceland +2 78.2
13 Luxembourg -4 76.3
14 Ukraine +19 75.7
15 Netherlands -3 74.0
16 Malaysia -3 73.5
17 Latvia -2 72.4
18 Poland +12 70.6
19 Japan -2 70.2
20 Slovenia +4 69.9
21 New Zealand -1 69.5
22 Canada -1 68.4
23 Israel -1 67.9
24 France +2 67.8
25 Greece +12 67.6
26 USA -3 67.4
27 China Hong Kong -2 66.5
28 Taiwan -10 66.3
29 Spain +7 65.7
30 Australia -2 65.0
31 Czech Republic - 64.8
32 Ireland +3 63.1
33 Italy +6 61.3
34 Croatia +6 59.9
35 Korea Rep. -3 59.2
36 United Kingdom -9 58.9
37 Hungary +5 58.6
38 Singapore -9 57.6
39 Brazil +6 57.1
40 Slovak Republic +3 56.8
41 Russia -3 56.4
42 Thailand -23 56.2
43 Kazakhstan -9 53.2
44 China Mainland -3 50.7
45 Venezuela +1 49.3
46 Bulgaria +8 47.9
47 South Africa +8 42.0
48 Mongolia -4 41.9
49 Jordan +1 40.8
50 Romania +3 39.6
51 Qatar -3 39.6
52 Indonesia -3 37.4
53 Colombia -1 37.1
54 Turkey +3 36.9
55 Argentina -8 36.7
56 UAE -5 36.3
57 Peru +2 33.9
58 Chile -2 32.6
59 Mexico -1 24.2
60 Philippines - 10.5
61 India - -
Factor 1: Investment and Development 2016

IMD World Talent Report 2015
87
IMD World Talent Report 2016
%
1 BELGIUM 38.6 2012
2 FINLAND 34.7 2011
3 PORTUGAL 32.6 2011
4 SWEDEN 31.1 2012
5 SLOVENIA 30.8 2011
6 UKRAINE 30.4
7 DENMARK 29.4 2011
8 ESTONIA 27.1 2012
9 AUSTRIA 27.0 2012
10 FRANCE 26.9 2012
11 IRELAND 26.3 2012
12 SWITZERLAND 26.1 2012
13 NORWAY 25.8 2011
14 SPAIN 25.8 2011
15 JAPAN 25.7
16 CZECH REPUBLIC 25.4 2012
17 NEW ZEALAND 24.7 2012
18 NETHERLANDS 24.2 2012
19 POLAND 23.5 2011
20 KOREA REP. 23.4
21 GERMANY 23.2 2012
22 MALAYSIA 23.2
23 TAIWAN 22.9
24 ITALY 22.8 2012
25 USA 22.8 2012
26 BRAZIL 22.7 2012
27 UNITED KINGDOM 22.5
28 SOUTH AFRICA 20.9 2012
29 ARGENTINA 20.9
30 BULGARIA 20.4 2012
31 ICELAND 20.2 2011
32 HUNGARY 19.7 2012
33 THAILAND 19.7 2012
34 LITHUANIA 19.5 2011
35 CHINA HONG KONG 18.7
36 SLOVAK REPUBLIC 18.4 2012
37 CANADA 18.3 2011
38 UAE 18.3 2012
39 CROATIA 18.0 2011
40 LUXEMBOURG 18.0 2011
41 LATVIA 17.2 2012
42 COLOMBIA 17.0
43 SINGAPORE 16.7 2010
44 VENEZUELA 16.6 2009
45 AUSTRALIA 16.5 2012
46 MEXICO 15.9 2011
47 ISRAEL 15.5 2011
48 MONGOLIA 15.4 2010
49 INDIA 15.2 2012
50 CHILE 15.2
51 JORDAN 15.1 2011
52 TURKEY 14.7
53 ROMANIA 12.6 2012
54 KAZAKHSTAN 11.2
55 PERU 10.4
56 QATAR 10.3 2009
57 INDONESIA 9.8
- CHINA MAINLAND -- GREECE -- PHILIPPINES -- RUSSIA -
Education 4.5.03
PUBLIC EXPENDITURE ON EDUCATION PER PUPIL 2013Percentage of GDP per capita (secondary)
Ranking
Notes & Sources: see Appendix IV
%
1 ICELAND 7.6 2012
2 DENMARK 7.6 2012
3 SOUTH AFRICA 7.3
4 UKRAINE 7.2 2012
5 PORTUGAL 6.8 2013
6 SWEDEN 6.6 2013
7 BELGIUM 6.4 2013
8 FINLAND 6.4 2013
9 BRAZIL 6.4
10 ISRAEL 6.3
11 USA 6.2 2012
12 SWITZERLAND 6.0 2013
13 ESTONIA 5.9 2013
14 LUXEMBOURG 5.6 2013
15 LATVIA 5.5 2012
16 FRANCE 5.5 2013
17 NETHERLANDS 5.5 2013
18 CANADA 5.4 2012
19 LITHUANIA 5.4
20 UNITED KINGDOM 5.4 2013
21 NEW ZEALAND 5.4 2012
22 MONGOLIA 5.4
23 SLOVENIA 5.3
24 POLAND 5.3 2013
25 AUSTRALIA 5.3 2012
26 CZECH REPUBLIC 5.2 2013
27 MALAYSIA 5.1
28 CROATIA 5.0 2012
29 AUSTRIA 5.0 2013
30 KOREA REP. 4.9 2012
31 NORWAY 4.9 2013
32 COLOMBIA 4.7
33 HUNGARY 4.7 2013
34 GREECE 4.5 2013
35 SPAIN 4.5 2012
36 IRELAND 4.5
37 RUSSIA 4.3
38 GERMANY 4.2 2012
39 TURKEY 4.2
40 ITALY 4.1 2013
41 CHILE 4.1 2012
42 TAIWAN 4.0 2013
43 THAILAND 3.9
44 JORDAN 3.8 2012
45 SLOVAK REPUBLIC 3.8 2012
46 CHINA MAINLAND 3.6
47 MEXICO 3.6
48 INDONESIA 3.6
49 JAPAN 3.5 2012
50 KAZAKHSTAN 3.4
51 BULGARIA 3.4 2012
52 QATAR 3.3
53 CHINA HONG KONG 3.3
54 PERU 3.2 2012
55 INDIA 3.1
56 SINGAPORE 3.0
57 ROMANIA 2.8 2013
58 PHILIPPINES 2.5
59 ARGENTINA 1.6
60 UAE 1.1
- VENEZUELA -
Education 4.5.01
TOTAL PUBLIC EXPENDITURE ON EDUCATION 2014Percentage of GDP
Ranking
Notes & Sources: see Appendix IV

IMD World Talent Report 2016
88
ratio
1 GREECE 7.72
2 VENEZUELA 7.90
3 LITHUANIA 8.10
4 LATVIA 8.33
5 LUXEMBOURG 8.60
6 KAZAKHSTAN 8.73
7 RUSSIA 8.92
8 UKRAINE 9.32
9 AUSTRIA 9.35
10 PORTUGAL 9.39
11 JORDAN 9.40
12 BELGIUM 9.67
13 QATAR 9.67
14 CROATIA 10.00
15 NORWAY 10.12
16 POLAND 10.48
17 ESTONIA 10.57
18 SLOVENIA 10.80
19 ICELAND 11.10 2012
20 CZECH REPUBLIC 11.14
21 HUNGARY 11.26
22 SPAIN 11.30
23 SWITZERLAND 11.40 2010
24 UAE 11.50
25 DENMARK 11.55 2010
26 ISRAEL 12.00
27 AUSTRALIA 12.02
28 ITALY 12.19
29 SWEDEN 12.43
30 FINLAND 12.71
31 JAPAN 12.72
32 FRANCE 12.73
33 ROMANIA 12.81
34 SLOVAK REPUBLIC 12.96
35 MALAYSIA 13.00
35 SINGAPORE 13.00
37 BULGARIA 13.04
38 CHINA HONG KONG 13.10
39 GERMANY 13.49
40 CANADA 13.85
41 IRELAND 13.95
42 NEW ZEALAND 14.78
43 TAIWAN 15.10
44 CHINA MAINLAND 15.14
45 USA 15.37
46 INDONESIA 15.38
47 PERU 15.46
48 KOREA REP. 16.18
49 NETHERLANDS 17.00
50 BRAZIL 17.26
51 MONGOLIA 18.30
52 UNITED KINGDOM 18.50
53 TURKEY 19.28
54 THAILAND 19.91 2011
55 ARGENTINA 23.82
56 SOUTH AFRICA 24.40 2010
57 CHILE 24.80
58 COLOMBIA 25.50
59 MEXICO 30.30
60 INDIA 32.00 2011
61 PHILIPPINES 35.00
Education 4.5.05
PUPIL-TEACHER RATIO (SECONDARY EDUCATION) 2013Ratio of students to teaching staff
Ranking
Notes & Sources: see Appendix IV
ratio
1 LUXEMBOURG 8.82
2 GREECE 9.49
3 QATAR 10.00
4 NORWAY 10.34
5 HUNGARY 10.40
6 ICELAND 10.43
7 POLAND 11.09
8 LATVIA 11.16
9 DENMARK 11.80 2011
10 AUSTRIA 11.92
11 MALAYSIA 12.00
12 CROATIA 12.10
13 ITALY 12.35
14 LITHUANIA 12.62
15 ARGENTINA 12.66
16 BELGIUM 12.67
16 SWEDEN 12.67
18 ESTONIA 13.04
19 FINLAND 13.20
20 PORTUGAL 13.20
21 TAIWAN 13.30
22 CHINA HONG KONG 13.80
23 SPAIN 14.00
24 CANADA 14.03
25 VENEZUELA 14.51 2009
26 SWITZERLAND 15.00
27 ISRAEL 15.27
28 USA 15.35
29 AUSTRALIA 15.61
30 GERMANY 16.00
30 SLOVENIA 16.00
32 UAE 16.07
33 INDONESIA 16.09
34 THAILAND 16.28 2012
35 IRELAND 16.36
36 NEW ZEALAND 16.39
37 KAZAKHSTAN 16.48
38 UKRAINE 16.49
39 CHINA MAINLAND 16.85
40 SLOVAK REPUBLIC 16.94
41 NETHERLANDS 17.00
41 SINGAPORE 17.00
43 KOREA REP. 17.31
44 JAPAN 17.40
45 JORDAN 17.50
46 ROMANIA 17.56 2012
47 BULGARIA 17.63
48 PERU 18.08
49 CZECH REPUBLIC 18.79
50 FRANCE 19.31
51 TURKEY 19.83
52 RUSSIA 20.32
53 UNITED KINGDOM 20.67
54 BRAZIL 22.40
55 CHILE 22.53
56 COLOMBIA 24.98
57 MONGOLIA 27.59
58 MEXICO 27.69
59 SOUTH AFRICA 32.03
60 PHILIPPINES 36.00
61 INDIA 41.00 2011
Ranking
Notes & Sources: see Appendix IV
Education 4.5.04
PUPIL-TEACHER RATIO (PRIMARY EDUCATION) 2013Ratio of students to teaching staff

IMD World Talent Report 2015
89
IMD World Talent Report 2016
<PICT>!\\nestor\Appl$\WCC\Prod\App\Survey.png
Survey [0..10]
1 SWITZERLAND 7.73
2 GERMANY 7.71
3 DENMARK 7.60
4 AUSTRIA 7.59
5 JAPAN 7.25
6 LUXEMBOURG 7.11
7 MALAYSIA 7.08
8 SWEDEN 7.00
9 NORWAY 6.97
10 NETHERLANDS 6.84
11 ESTONIA 6.78
12 UAE 6.78
13 LITHUANIA 6.77
14 CHINA HONG KONG 6.69
14 FINLAND 6.69
16 IRELAND 6.60
17 TAIWAN 6.37
18 THAILAND 6.27
19 SINGAPORE 6.24
20 SLOVAK REPUBLIC 6.20
21 CANADA 6.10
22 NEW ZEALAND 6.07
23 BELGIUM 6.07
24 LATVIA 6.05
25 PHILIPPINES 6.04
26 AUSTRALIA 5.98
27 CHINA MAINLAND 5.89
28 QATAR 5.85
29 USA 5.84
30 ISRAEL 5.83
31 POLAND 5.83
32 ROMANIA 5.76
33 SLOVENIA 5.75
34 KAZAKHSTAN 5.69
35 MONGOLIA 5.67
36 JORDAN 5.66
37 CZECH REPUBLIC 5.64
38 UNITED KINGDOM 5.62
39 BRAZIL 5.57
40 COLOMBIA 5.57
41 SOUTH AFRICA 5.53
42 KOREA REP. 5.47
43 ICELAND 5.38
44 MEXICO 5.33
45 FRANCE 5.33
46 INDIA 5.26
47 UKRAINE 5.17
48 BULGARIA 5.02
49 TURKEY 5.02
50 CHILE 5.02
51 ARGENTINA 5.00
52 GREECE 4.94
53 RUSSIA 4.94
54 VENEZUELA 4.92
55 INDONESIA 4.78
56 HUNGARY 4.75
57 ITALY 4.57
58 PERU 4.43
59 CROATIA 4.41
60 PORTUGAL 4.34
61 SPAIN 4.30
Labor Market - Relations 3.2.11
EMPLOYEE TRAINING
2016Employee training
is not a high priority in
companies
is a high priority in
companies
Ranking
<PICT>!\\nestor\Appl$\WCC\Prod\App\Survey.png
Survey [0..10]
1 SWITZERLAND 8.94
2 GERMANY 8.54
3 AUSTRIA 8.06
4 JAPAN 6.94
5 DENMARK 6.83
6 NETHERLANDS 6.68
7 LITHUANIA 6.40
8 MALAYSIA 6.32
9 CHINA HONG KONG 5.86
10 NORWAY 5.79
11 UAE 5.74
12 LUXEMBOURG 5.69
13 JORDAN 5.43
14 THAILAND 5.43
15 LATVIA 5.37
16 COLOMBIA 5.33
17 TAIWAN 5.23
18 SLOVAK REPUBLIC 5.17
19 SINGAPORE 5.12
20 QATAR 5.11
21 CANADA 5.10
22 AUSTRALIA 4.94
23 PHILIPPINES 4.92
24 POLAND 4.87
25 MEXICO 4.87
26 INDIA 4.84
27 ISRAEL 4.81
28 ITALY 4.80
29 KAZAKHSTAN 4.80
30 ESTONIA 4.76
31 RUSSIA 4.75
32 UNITED KINGDOM 4.74
33 BRAZIL 4.62
34 NEW ZEALAND 4.59
35 PORTUGAL 4.52
36 FINLAND 4.44
37 UKRAINE 4.43
38 ICELAND 4.40
39 SWEDEN 4.39
40 BELGIUM 4.35
41 TURKEY 4.31
42 GREECE 4.31
43 CHINA MAINLAND 4.30
44 KOREA REP. 4.17
45 INDONESIA 4.05
46 ARGENTINA 4.05
47 MONGOLIA 4.03
48 IRELAND 4.00
49 CHILE 3.97
50 USA 3.88
51 SPAIN 3.79
52 VENEZUELA 3.72
53 PERU 3.68
54 CZECH REPUBLIC 3.48
55 HUNGARY 3.45
56 CROATIA 3.37
57 FRANCE 3.29
58 SOUTH AFRICA 2.89
59 BULGARIA 2.83
60 SLOVENIA 2.66
61 ROMANIA 2.39
are not sufficiently implemented are sufficiently
implemented
Ranking
Labor Market - Relations 3.2.10
APPRENTICESHIPS
2016Apprenticeships
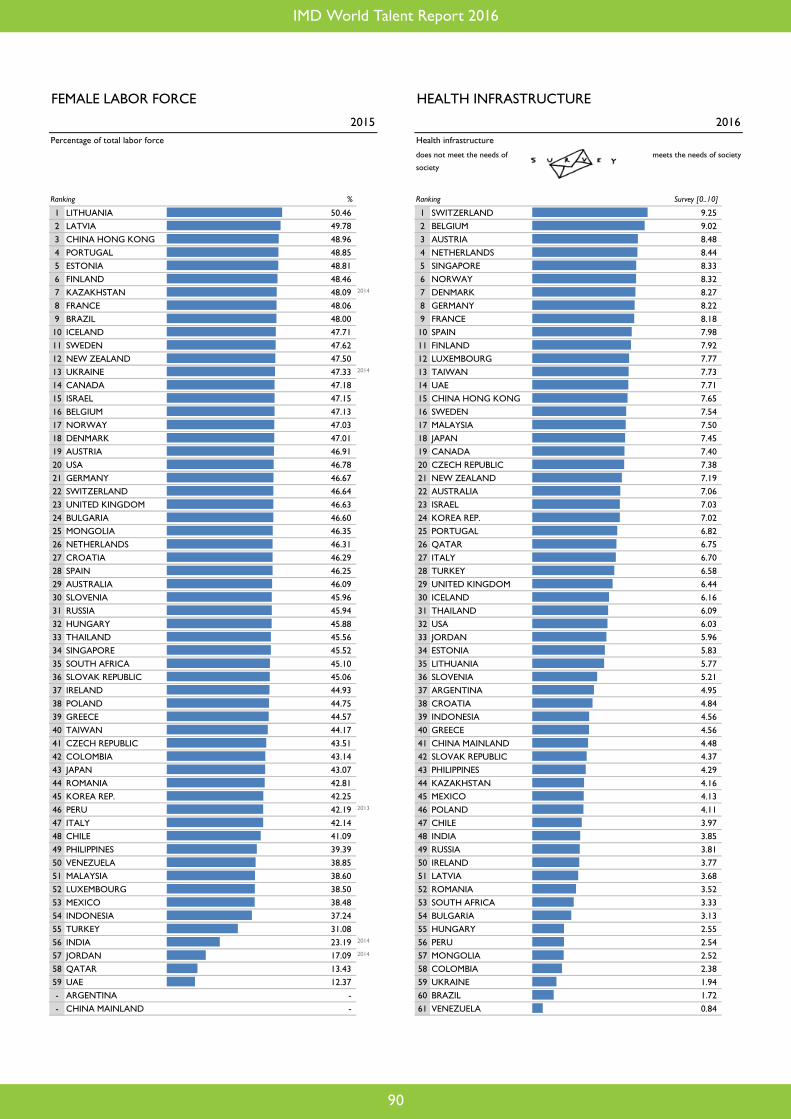
IMD World Talent Report 2016
90
<PICT>!\\nestor\Appl$\WCC\Prod\App\Survey.png
Survey [0..10]
1 SWITZERLAND 9.25
2 BELGIUM 9.02
3 AUSTRIA 8.48
4 NETHERLANDS 8.44
5 SINGAPORE 8.33
6 NORWAY 8.32
7 DENMARK 8.27
8 GERMANY 8.22
9 FRANCE 8.18
10 SPAIN 7.98
11 FINLAND 7.92
12 LUXEMBOURG 7.77
13 TAIWAN 7.73
14 UAE 7.71
15 CHINA HONG KONG 7.65
16 SWEDEN 7.54
17 MALAYSIA 7.50
18 JAPAN 7.45
19 CANADA 7.40
20 CZECH REPUBLIC 7.38
21 NEW ZEALAND 7.19
22 AUSTRALIA 7.06
23 ISRAEL 7.03
24 KOREA REP. 7.02
25 PORTUGAL 6.82
26 QATAR 6.75
27 ITALY 6.70
28 TURKEY 6.58
29 UNITED KINGDOM 6.44
30 ICELAND 6.16
31 THAILAND 6.09
32 USA 6.03
33 JORDAN 5.96
34 ESTONIA 5.83
35 LITHUANIA 5.77
36 SLOVENIA 5.21
37 ARGENTINA 4.95
38 CROATIA 4.84
39 INDONESIA 4.56
40 GREECE 4.56
41 CHINA MAINLAND 4.48
42 SLOVAK REPUBLIC 4.37
43 PHILIPPINES 4.29
44 KAZAKHSTAN 4.16
45 MEXICO 4.13
46 POLAND 4.11
47 CHILE 3.97
48 INDIA 3.85
49 RUSSIA 3.81
50 IRELAND 3.77
51 LATVIA 3.68
52 ROMANIA 3.52
53 SOUTH AFRICA 3.33
54 BULGARIA 3.13
55 HUNGARY 2.55
56 PERU 2.54
57 MONGOLIA 2.52
58 COLOMBIA 2.38
59 UKRAINE 1.94
60 BRAZIL 1.72
61 VENEZUELA 0.84
Health and Environment 4.4.04
HEALTH INFRASTRUCTURE
2016Health infrastructure
does not meet the needs of
society
meets the needs of society
Ranking
%
1 LITHUANIA 50.46
2 LATVIA 49.78
3 CHINA HONG KONG 48.96
4 PORTUGAL 48.85
5 ESTONIA 48.81
6 FINLAND 48.46
7 KAZAKHSTAN 48.09 2014
8 FRANCE 48.06
9 BRAZIL 48.00
10 ICELAND 47.71
11 SWEDEN 47.62
12 NEW ZEALAND 47.50
13 UKRAINE 47.33 2014
14 CANADA 47.18
15 ISRAEL 47.15
16 BELGIUM 47.13
17 NORWAY 47.03
18 DENMARK 47.01
19 AUSTRIA 46.91
20 USA 46.78
21 GERMANY 46.67
22 SWITZERLAND 46.64
23 UNITED KINGDOM 46.63
24 BULGARIA 46.60
25 MONGOLIA 46.35
26 NETHERLANDS 46.31
27 CROATIA 46.29
28 SPAIN 46.25
29 AUSTRALIA 46.09
30 SLOVENIA 45.96
31 RUSSIA 45.94
32 HUNGARY 45.88
33 THAILAND 45.56
34 SINGAPORE 45.52
35 SOUTH AFRICA 45.10
36 SLOVAK REPUBLIC 45.06
37 IRELAND 44.93
38 POLAND 44.75
39 GREECE 44.57
40 TAIWAN 44.17
41 CZECH REPUBLIC 43.51
42 COLOMBIA 43.14
43 JAPAN 43.07
44 ROMANIA 42.81
45 KOREA REP. 42.25
46 PERU 42.19 2013
47 ITALY 42.14
48 CHILE 41.09
49 PHILIPPINES 39.39
50 VENEZUELA 38.85
51 MALAYSIA 38.60
52 LUXEMBOURG 38.50
53 MEXICO 38.48
54 INDONESIA 37.24
55 TURKEY 31.08
56 INDIA 23.19 2014
57 JORDAN 17.09 2014
58 QATAR 13.43
59 UAE 12.37
- ARGENTINA -- CHINA MAINLAND -
Notes & Sources: see Appendix IV
Ranking
Labor Market - Availability of Skills 3.2.16
FEMALE LABOR FORCE
2015Percentage of total labor force

IMD World Talent Report 2015
91
IMD World Talent Report 2016
1 Switzerland - 100.0
2 USA - 86.8
3 Luxembourg - 81.2
4 Sweden +9 79.2
5 China Hong Kong +5 78.9
6 Ireland +1 78.8
7 Canada -3 78.1
8 Germany -3 78.1
9 Qatar +8 78.0
10 UAE -2 77.6
11 Denmark -2 76.2
12 Netherlands -1 75.4
13 New Zealand +3 74.7
14 Norway -8 74.0
15 Belgium +5 73.5
16 United Kingdom -4 71.3
17 Austria +5 71.3
18 Australia -4 70.7
19 Singapore -1 70.0
20 Iceland +3 68.5
21 Japan -6 67.4
22 Malaysia -3 65.3
23 Finland -2 65.1
24 Thailand +1 64.9
25 Israel -1 64.2
26 Taiwan - 62.8
27 Chile - 62.6
28 Spain +5 62.2
29 South Africa +5 61.9
30 France - 61.5
31 Indonesia -3 59.9
32 Jordan -3 59.1
33 Mexico +3 57.0
34 Czech Republic -3 57.0
35 Philippines - 56.8
36 Estonia +1 56.7
37 Italy +10 56.6
38 Lithuania +1 56.0
39 Colombia +3 56.0
40 Portugal -2 54.4
41 India -1 53.4
42 Peru +7 53.3
43 Korea Rep. -11 53.2
44 Turkey +2 52.4
45 Latvia -4 50.4
46 Poland +6 50.4
47 Slovenia +7 49.9
48 Brazil - 49.0
49 Slovak Republic +4 48.6
50 Greece - 47.1
51 Argentina +5 43.3
52 Romania -8 43.2
53 Russia +2 42.8
54 China Mainland -9 42.7
55 Kazakhstan -12 42.5
56 Mongolia -5 41.0
57 Bulgaria +3 40.2
58 Croatia - 38.7
59 Ukraine -2 36.7
60 Hungary -1 36.7
61 Venezuela - 27.5
Factor 2: Appeal 2016

IMD World Talent Report 2016
92
<PICT>!\\nestor\Appl$\WCC\Prod\App\Survey.png
Survey [0..10]
1 DENMARK 8.21
2 CHINA HONG KONG 8.10
3 NEW ZEALAND 8.00
4 USA 7.97
5 IRELAND 7.95
6 SWITZERLAND 7.83
7 NORWAY 7.79
8 JAPAN 7.79
9 SWEDEN 7.76
10 GERMANY 7.60
11 NETHERLANDS 7.56
12 MALAYSIA 7.56
13 LUXEMBOURG 7.53
14 SINGAPORE 7.48
15 BELGIUM 7.46
16 UNITED KINGDOM 7.42
17 LITHUANIA 7.37
18 AUSTRIA 7.33
19 AUSTRALIA 7.32
20 UAE 7.24
21 KOREA REP. 7.22
22 ESTONIA 7.14
23 ISRAEL 7.08
24 CANADA 7.08
25 FINLAND 7.06
25 ICELAND 7.06
27 CHINA MAINLAND 6.96
27 INDONESIA 6.96
29 THAILAND 6.89
30 PHILIPPINES 6.83
31 INDIA 6.75
32 SOUTH AFRICA 6.54
33 CZECH REPUBLIC 6.53
34 BULGARIA 6.53
35 LATVIA 6.47
36 TAIWAN 6.45
37 QATAR 6.44
38 MONGOLIA 6.42
39 TURKEY 6.42
40 CHILE 6.29
41 FRANCE 6.28
42 BRAZIL 6.27
43 VENEZUELA 6.08
44 JORDAN 6.02
45 ROMANIA 6.00
46 MEXICO 5.93
47 HUNGARY 5.78
48 ARGENTINA 5.76
49 ITALY 5.61
50 SLOVENIA 5.52
51 PORTUGAL 5.46
52 RUSSIA 5.41
53 KAZAKHSTAN 5.38
54 COLOMBIA 5.32
55 UKRAINE 5.31
56 PERU 5.16
57 GREECE 5.12
58 SPAIN 5.04
59 SLOVAK REPUBLIC 4.97
60 CROATIA 4.66
61 POLAND 4.19
is not a priority in companies is a priority in companies
Ranking
Labor Market - Availability of Skills 3.2.20
ATTRACTING AND RETAINING TALENTS 2016Attracting and retaining talents
index
1 SOUTH AFRICA 55.10
2 BULGARIA 56.30
3 UKRAINE 56.80
4 ROMANIA 61.50
5 POLAND 61.80
6 LITHUANIA 62.40
7 HUNGARY 62.70
8 CROATIA 63.40
9 SLOVENIA 64.30
10 ESTONIA 65.40
11 COLOMBIA 67.20
12 PORTUGAL 67.50
13 CZECH REPUBLIC 67.90
14 MEXICO 68.40
14 SLOVAK REPUBLIC 68.40
16 GREECE 68.60
17 PERU 70.70
18 CANADA 71.30
19 SPAIN 71.60
20 MALAYSIA 71.90
21 LATVIA 72.00
22 SWEDEN 72.50
23 BELGIUM 73.10
24 INDONESIA 73.40
24 QATAR 73.40
24 TURKEY 73.40
27 KAZAKHSTAN 74.00
27 LUXEMBOURG 74.00
29 GERMANY 75.20
30 PHILIPPINES 76.40
31 INDIA 76.50
32 CHILE 76.80
33 NETHERLANDS 77.20
34 FINLAND 77.50
35 NEW ZEALAND 78.80
36 AUSTRIA 79.40
37 JORDAN 79.80
38 ITALY 80.10
39 RUSSIA 80.90
40 IRELAND 81.00
41 FRANCE 81.90
42 THAILAND 82.00
43 TAIWAN 84.10
44 BRAZIL 84.40
45 NORWAY 85.10
46 AUSTRALIA 87.00
47 DENMARK 90.00
48 UAE 90.10
49 ARGENTINA 92.10
50 ISRAEL 93.80
51 USA 100.00
52 UNITED KINGDOM 102.40
53 VENEZUELA 102.50 2013
54 JAPAN 103.20
55 KOREA REP. 107.00
56 CHINA MAINLAND 110.60
57 SINGAPORE 112.00
58 SWITZERLAND 114.60
59 CHINA HONG KONG 122.00
- ICELAND -- MONGOLIA -
Prices 1.5.03
COST-OF-LIVING INDEX
2015Index of a basket of goods & services in the main city, including housing (New York City = 100)
Ranking
Notes & Sources: see Appendix IV

IMD World Talent Report 2015
93
IMD World Talent Report 2016
<PICT>!\\nestor\Appl$\WCC\Prod\App\Survey.png
Survey [0..10]
1 NORWAY 8.32
2 SWITZERLAND 7.97
3 USA 7.33
4 SWEDEN 7.30
5 DENMARK 7.25
6 CHINA HONG KONG 7.22
7 NETHERLANDS 7.20
8 LUXEMBOURG 6.65
9 UAE 6.62
10 FINLAND 6.54
11 SINGAPORE 6.49
12 UNITED KINGDOM 6.42
13 GERMANY 6.36
14 INDONESIA 6.24
15 BELGIUM 6.11
16 CHILE 6.06
17 ICELAND 5.92
18 ISRAEL 5.83
19 CANADA 5.80
20 MALAYSIA 5.72
21 NEW ZEALAND 5.70
22 AUSTRALIA 5.69
23 AUSTRIA 5.65
24 QATAR 5.59
25 THAILAND 5.59
26 CZECH REPUBLIC 5.54
27 TURKEY 5.51
28 ROMANIA 5.45
29 IRELAND 5.07
30 INDIA 4.91
31 ITALY 4.86
32 FRANCE 4.78
33 MEXICO 4.77
34 SPAIN 4.51
35 JAPAN 4.42
36 BRAZIL 4.27
37 JORDAN 4.22
38 MONGOLIA 4.17
39 ARGENTINA 4.10
40 LITHUANIA 4.03
41 PERU 4.02
42 CHINA MAINLAND 3.95
43 COLOMBIA 3.93
44 PHILIPPINES 3.77
45 TAIWAN 3.69
46 KOREA REP. 3.60
47 ESTONIA 3.49
48 LATVIA 3.42
49 POLAND 3.42
50 PORTUGAL 3.39
51 GREECE 3.32
52 RUSSIA 3.25
53 SLOVENIA 3.15
54 KAZAKHSTAN 2.95
55 SLOVAK REPUBLIC 2.87
56 SOUTH AFRICA 2.77
57 CROATIA 2.16
58 UKRAINE 2.00
59 BULGARIA 1.96
60 HUNGARY 1.56
61 VENEZUELA 1.56
Labor Market - Availability of Skills 3.2.21
BRAIN DRAIN
2016Brain drain (well-educated and skilled people)
hinders competitiveness in your
economy
does not hinder
competitiveness in your
economy
Ranking
<PICT>!\\nestor\Appl$\WCC\Prod\App\Survey.png
Survey [0..10]
1 DENMARK 8.06
2 SWITZERLAND 8.06
3 NORWAY 7.74
4 AUSTRIA 7.62
5 GERMANY 7.59
6 IRELAND 7.58
7 SWEDEN 7.42
8 CHINA HONG KONG 7.41
9 NETHERLANDS 7.40
10 JAPAN 7.08
11 MALAYSIA 6.94
12 NEW ZEALAND 6.89
13 UAE 6.88
14 LUXEMBOURG 6.83
15 TAIWAN 6.79
16 ICELAND 6.76
17 USA 6.70
18 CANADA 6.65
19 ISRAEL 6.65
20 FINLAND 6.51
21 LITHUANIA 6.43
22 POLAND 6.43
23 SINGAPORE 6.42
24 BELGIUM 6.42
25 UNITED KINGDOM 6.34
26 THAILAND 6.34
27 PHILIPPINES 6.23
28 AUSTRALIA 6.18
29 TURKEY 6.11
30 ESTONIA 6.10
31 QATAR 6.08
32 CZECH REPUBLIC 6.03
33 INDONESIA 6.03
34 CHILE 5.97
35 MEXICO 5.93
36 INDIA 5.78
37 CHINA MAINLAND 5.76
38 COLOMBIA 5.59
39 ITALY 5.47
40 SLOVAK REPUBLIC 5.29
41 BRAZIL 5.25
41 FRANCE 5.25
43 LATVIA 5.21
44 SLOVENIA 5.18
45 PERU 5.11
46 UKRAINE 5.03
47 PORTUGAL 4.92
48 ROMANIA 4.91
49 KAZAKHSTAN 4.90
50 JORDAN 4.88
51 SPAIN 4.82
52 GREECE 4.78
53 ARGENTINA 4.71
54 MONGOLIA 4.63
55 RUSSIA 4.56
56 BULGARIA 4.53
57 CROATIA 4.16
58 HUNGARY 4.07
59 KOREA REP. 3.91
60 SOUTH AFRICA 3.83
61 VENEZUELA 2.80
low high
Ranking
Labor Market - Relations 3.2.08
WORKER MOTIVATION
2016Worker motivation in companies is
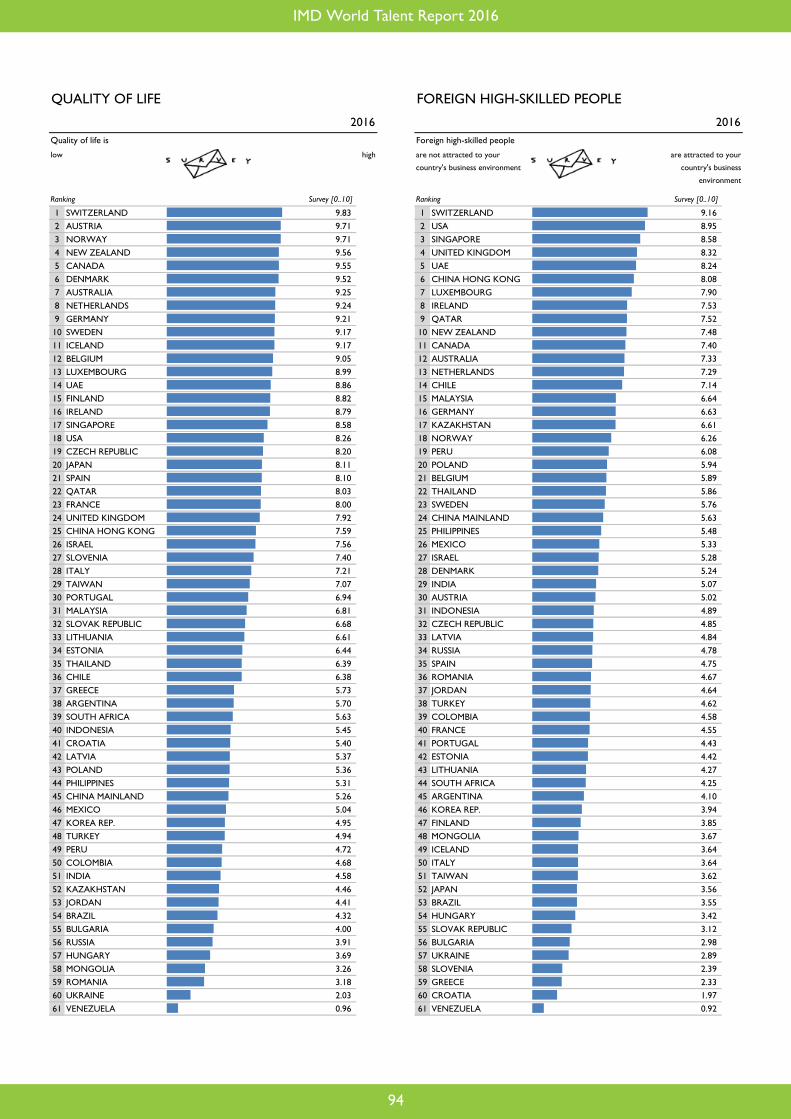
IMD World Talent Report 2016
94
<PICT>!\\nestor\Appl$\WCC\Prod\App\Survey.png
Survey [0..10]
1 SWITZERLAND 9.16
2 USA 8.95
3 SINGAPORE 8.58
4 UNITED KINGDOM 8.32
5 UAE 8.24
6 CHINA HONG KONG 8.08
7 LUXEMBOURG 7.90
8 IRELAND 7.53
9 QATAR 7.52
10 NEW ZEALAND 7.48
11 CANADA 7.40
12 AUSTRALIA 7.33
13 NETHERLANDS 7.29
14 CHILE 7.14
15 MALAYSIA 6.64
16 GERMANY 6.63
17 KAZAKHSTAN 6.61
18 NORWAY 6.26
19 PERU 6.08
20 POLAND 5.94
21 BELGIUM 5.89
22 THAILAND 5.86
23 SWEDEN 5.76
24 CHINA MAINLAND 5.63
25 PHILIPPINES 5.48
26 MEXICO 5.33
27 ISRAEL 5.28
28 DENMARK 5.24
29 INDIA 5.07
30 AUSTRIA 5.02
31 INDONESIA 4.89
32 CZECH REPUBLIC 4.85
33 LATVIA 4.84
34 RUSSIA 4.78
35 SPAIN 4.75
36 ROMANIA 4.67
37 JORDAN 4.64
38 TURKEY 4.62
39 COLOMBIA 4.58
40 FRANCE 4.55
41 PORTUGAL 4.43
42 ESTONIA 4.42
43 LITHUANIA 4.27
44 SOUTH AFRICA 4.25
45 ARGENTINA 4.10
46 KOREA REP. 3.94
47 FINLAND 3.85
48 MONGOLIA 3.67
49 ICELAND 3.64
50 ITALY 3.64
51 TAIWAN 3.62
52 JAPAN 3.56
53 BRAZIL 3.55
54 HUNGARY 3.42
55 SLOVAK REPUBLIC 3.12
56 BULGARIA 2.98
57 UKRAINE 2.89
58 SLOVENIA 2.39
59 GREECE 2.33
60 CROATIA 1.97
61 VENEZUELA 0.92
are not attracted to your
country's business environment
are attracted to your
country's business
environment
Ranking
Labor Market - Availability of Skills 3.2.22
FOREIGN HIGH-SKILLED PEOPLE
2016Foreign high-skilled people
<PICT>!\\nestor\Appl$\WCC\Prod\App\Survey.png
Survey [0..10]
1 SWITZERLAND 9.83
2 AUSTRIA 9.71
3 NORWAY 9.71
4 NEW ZEALAND 9.56
5 CANADA 9.55
6 DENMARK 9.52
7 AUSTRALIA 9.25
8 NETHERLANDS 9.24
9 GERMANY 9.21
10 SWEDEN 9.17
11 ICELAND 9.17
12 BELGIUM 9.05
13 LUXEMBOURG 8.99
14 UAE 8.86
15 FINLAND 8.82
16 IRELAND 8.79
17 SINGAPORE 8.58
18 USA 8.26
19 CZECH REPUBLIC 8.20
20 JAPAN 8.11
21 SPAIN 8.10
22 QATAR 8.03
23 FRANCE 8.00
24 UNITED KINGDOM 7.92
25 CHINA HONG KONG 7.59
26 ISRAEL 7.56
27 SLOVENIA 7.40
28 ITALY 7.21
29 TAIWAN 7.07
30 PORTUGAL 6.94
31 MALAYSIA 6.81
32 SLOVAK REPUBLIC 6.68
33 LITHUANIA 6.61
34 ESTONIA 6.44
35 THAILAND 6.39
36 CHILE 6.38
37 GREECE 5.73
38 ARGENTINA 5.70
39 SOUTH AFRICA 5.63
40 INDONESIA 5.45
41 CROATIA 5.40
42 LATVIA 5.37
43 POLAND 5.36
44 PHILIPPINES 5.31
45 CHINA MAINLAND 5.26
46 MEXICO 5.04
47 KOREA REP. 4.95
48 TURKEY 4.94
49 PERU 4.72
50 COLOMBIA 4.68
51 INDIA 4.58
52 KAZAKHSTAN 4.46
53 JORDAN 4.41
54 BRAZIL 4.32
55 BULGARIA 4.00
56 RUSSIA 3.91
57 HUNGARY 3.69
58 MONGOLIA 3.26
59 ROMANIA 3.18
60 UKRAINE 2.03
61 VENEZUELA 0.96
low high
Ranking
Health and Environment 4.4.26
QUALITY OF LIFE
2016Quality of life is

IMD World Talent Report 2015
95
IMD World Talent Report 2016
2015
1 SWITZERLAND 114,404 123,313 99,869 72,551 52,990
2 DENMARK 66,462 82,992 52,860 50,736 42,413
3 USA 55,131 108,311 67,028 41,069 32,043
4 LUXEMBOURG 75,698 50,826 94,229 38,930 32,442
5 NORWAY 50,720 67,627 46,493 43,957 44,380
6 AUSTRALIA 41,227 86,318 60,294 37,001 32,646
7 JAPAN 52,281 55,418 62,917 36,806 33,460
8 ICELAND 47,719 76,599 34,564 42,976 34,984 2012
9 SWEDEN 46,278 80,878 39,205 35,707 37,086
10 NEW ZEALAND 34,468 62,593 47,182 46,660 29,969
11 CANADA 41,475 70,693 55,449 35,168 25,721
12 CHINA HONG KONG 61,151 52,378 56,764 30,446 24,512
13 UNITED KINGDOM 29,588 106,077 38,197 28,606 25,986
14 BELGIUM 44,632 50,943 41,293 36,060 32,739
15 AUSTRIA 42,771 54,483 34,125 40,791 31,430
16 IRELAND 37,840 82,186 44,835 28,837 25,610
17 GERMANY 47,560 59,093 50,545 31,988 22,212
18 FRANCE 52,502 56,945 31,060 27,193 26,237
19 NETHERLANDS 37,748 49,641 43,487 31,019 27,960
20 SINGAPORE 27,800 77,600 41,200 28,200 21,600 2012
21 FINLAND 32,888 53,785 39,787 32,706 24,630
22 ISRAEL 30,753 70,942 25,220 24,736 24,230
23 KOREA REP. 58,408 33,131 37,180 17,118 18,406
24 SPAIN 35,484 54,521 32,160 21,805 19,341
25 UAE 24,171 89,826 30,759 18,691 13,283
26 ITALY 40,201 52,295 29,099 21,615 19,186
27 QATAR 40,656 49,080 29,668 23,624 14,284
28 TAIWAN 20,074 56,768 24,911 14,480 15,330
29 SLOVENIA 24,967 28,990 22,755 19,180 20,646
30 SLOVAK REPUBLIC 23,935 34,305 12,247 12,869 22,922
31 PORTUGAL 26,494 16,149 26,848 15,291 10,562
32 GREECE 20,219 33,848 18,546 12,135 10,528
33 SOUTH AFRICA 12,774 47,117 13,174 15,581 6,791
34 COLOMBIA 10,331 67,629 8,682 10,970 5,078
35 CROATIA 21,300 22,400 18,000 10,400 11,200 2013
36 BRAZIL 13,288 42,632 11,850 13,544 4,269
37 CHILE 17,594 32,731 13,307 10,015 8,058
38 ARGENTINA 16,432 22,410 10,192 14,253 10,212
39 ESTONIA 14,491 18,816 12,371 12,025 10,573
40 TURKEY 15,823 24,156 12,725 12,265 6,649
41 POLAND 11,393 28,966 12,887 10,470 7,798
42 VENEZUELA 15,800 30,600 10,500 8,400 6,700 2012
43 RUSSIA 13,986 19,505 11,378 11,189 8,694
44 KAZAKHSTAN 19,881 28,099 5,909 8,807 6,403 2013
45 CZECH REPUBLIC 13,881 18,472 10,427 10,581 9,674
46 THAILAND 22,815 17,951 7,425 11,287 5,025
47 LATVIA 11,696 27,109 6,666 9,735 8,737
48 PERU 13,432 23,273 8,837 10,154 6,998
49 HUNGARY 11,472 21,736 9,149 9,364 9,117
50 LITHUANIA 18,771 19,517 9,660 7,408 6,505
51 MALAYSIA 7,570 19,182 12,218 9,591 8,617
52 CHINA MAINLAND 10,764 29,210 9,651 7,553 4,599
53 MEXICO 6,240 30,327 6,782 12,815 3,342
54 PHILIPPINES 5,783 35,295 5,192 3,475 4,330
55 ROMANIA 8,711 20,236 5,431 5,779 6,965
56 BULGARIA 6,889 12,748 4,476 6,630 8,714
57 INDIA 5,180 14,854 5,728 6,307 3,244
58 MONGOLIA 6,504 5,664 4,764 3,960 4,692
59 INDONESIA 2,432 11,580 2,501 5,906 2,548
60 UKRAINE 3,923 6,567 1,714 3,452 2,983
- JORDAN - - - - -
REMUNERATION IN SERVICES PROFESSIONS
Gross annual income including supplements such as bonuses, US$
Bank credit officer Product Manager Primary school teacher Personal assistant Call center agent

IMD World Talent Report 2016
96
2015
1 SWITZERLAND 826,948 190,780 347,612 330,732
2 USA 780,162 115,469 330,467 275,448
3 GERMANY 517,629 141,802 236,117 232,419
4 AUSTRIA 490,045 123,960 230,114 197,455
5 CHINA HONG KONG 474,190 103,747 242,431 220,186
6 UNITED KINGDOM 610,777 104,621 197,716 200,543
7 LUXEMBOURG 393,143 131,211 243,953 190,931
8 SINGAPORE 442,076 93,543 239,497 227,398
9 BELGIUM 439,301 124,129 206,827 199,026
10 JAPAN 407,509 125,556 186,270 211,180
11 ITALY 451,866 106,712 200,566 187,926
12 FRANCE 492,593 102,227 200,475 177,578
13 NETHERLANDS 416,402 122,174 187,567 180,899
14 SWEDEN 309,637 105,675 286,045 154,027
15 DENMARK 340,028 126,439 165,492 184,639
16 KOREA REP. 420,131 100,062 173,306 170,043
17 CHILE 326,399 116,777 160,053 183,581
18 IRELAND 310,570 105,266 194,706 164,701
19 UAE 318,087 94,615 157,346 199,352
20 CANADA 342,978 92,874 172,893 172,529
21 SPAIN 343,325 78,534 185,463 148,427
22 QATAR 182,418 109,890 175,275 169,780
23 PERU 248,213 107,860 153,189 162,898
24 FINLAND 295,450 108,654 145,590 139,107
25 MEXICO 318,203 60,217 192,838 164,065
26 GREECE 308,775 84,764 149,363 123,676
27 AUSTRALIA 299,108 75,736 154,796 124,525
28 ISRAEL 251,642 92,780 147,227 118,424
29 NORWAY 220,617 98,202 126,628 125,403
30 TAIWAN 261,018 72,162 135,877 126,621
31 COLOMBIA 250,373 76,460 116,026 139,943
32 NEW ZEALAND 331,726 47,992 101,283 163,671
33 PORTUGAL 282,265 79,857 127,711 109,952
34 THAILAND 278,611 55,406 132,636 138,330
35 PHILIPPINES 197,312 58,191 168,173 128,729
36 SLOVAK REPUBLIC 234,899 60,063 137,806 116,759
37 CHINA MAINLAND 196,228 67,499 113,962 139,808
38 POLAND 253,655 58,030 115,826 128,043
39 SLOVENIA 161,310 105,239 122,827 78,712
40 TURKEY 314,044 39,426 94,046 117,650
41 BRAZIL 232,687 53,887 101,963 92,865
42 ARGENTINA 211,771 53,059 100,201 96,483
43 MALAYSIA 159,407 42,380 96,518 89,862
44 CZECH REPUBLIC 190,366 37,233 83,009 84,733
45 INDIA 179,776 44,749 77,510 76,104
46 ICELAND 115,483 64,459 65,216 70,065
47 LITHUANIA 240,556 24,100 54,087 77,395
48 ESTONIA 169,873 30,031 91,114 64,066
49 HUNGARY 140,514 42,570 64,378 73,681
50 ROMANIA 148,497 31,060 71,629 76,835
51 CROATIA 121,652 24,465 79,226 87,635
52 VENEZUELA 194,154 29,742 48,650 75,609
53 INDONESIA 138,443 32,000 73,730 61,915
54 RUSSIA 177,015 29,704 55,035 61,592
55 BULGARIA 76,665 19,802 33,571 45,137
56 UKRAINE 45,571 8,433 26,467 30,402
57 KAZAKHSTAN 33,520 6,314 10,261 33,520
- JORDAN - - - -
- LATVIA - - - -
- MONGOLIA - - - -
- SOUTH AFRICA - - - -
Engineer Director manufacturing
Human resources
director
REMUNERATION OF MANAGEMENT
Total base salary plus bonuses and long-term incentives, US$
CEO

IMD World Talent Report 2015
97
IMD World Talent Report 2016
<PICT>!\\nestor\Appl$\WCC\Prod\App\Survey.png
Survey [0..10]
1 CHINA HONG KONG 9.27
2 DENMARK 9.23
3 SWITZERLAND 9.11
4 FINLAND 9.05
5 NORWAY 9.03
6 CANADA 9.00
7 NEW ZEALAND 8.89
8 SINGAPORE 8.85
9 AUSTRALIA 8.81
10 NETHERLANDS 8.78
11 IRELAND 8.70
12 AUSTRIA 8.54
13 UNITED KINGDOM 8.50
14 USA 8.43
15 SWEDEN 8.36
16 GERMANY 8.25
17 ICELAND 8.24
18 BELGIUM 8.18
19 LUXEMBOURG 8.08
20 QATAR 8.06
21 JAPAN 8.04
22 UAE 8.03
23 ISRAEL 7.94
24 TAIWAN 7.86
25 PORTUGAL 7.59
26 LITHUANIA 7.50
27 FRANCE 7.48
28 SPAIN 7.44
29 JORDAN 7.08
30 THAILAND 7.04
31 ESTONIA 6.93
32 SLOVENIA 6.91
33 CZECH REPUBLIC 6.89
34 MALAYSIA 6.72
35 POLAND 6.33
36 INDIA 6.19
37 KOREA REP. 6.10
38 INDONESIA 6.00
38 LATVIA 6.00
40 CHILE 5.87
41 ITALY 5.85
42 TURKEY 5.66
43 GREECE 5.64
44 HUNGARY 5.50
45 KAZAKHSTAN 5.30
46 CHINA MAINLAND 5.24
47 MONGOLIA 5.12
48 CROATIA 5.02
49 PHILIPPINES 4.80
50 COLOMBIA 4.61
51 ROMANIA 4.55
52 MEXICO 4.43
53 SLOVAK REPUBLIC 4.40
54 SOUTH AFRICA 4.25
55 RUSSIA 4.12
56 ARGENTINA 4.05
57 BRAZIL 3.81
58 PERU 3.48
59 BULGARIA 3.27
60 UKRAINE 2.84
61 VENEZUELA 0.45
Societal Framework 2.5.02
PERSONAL SECURITY AND PRIVATE PROPERTY RIGHTS 2016Personal security and private property rights
are not adequately protected are adequately protected
Ranking
%
1 QATAR 0.00
2 SOUTH AFRICA 0.97
3 INDONESIA 3.04
4 VENEZUELA 3.10
5 THAILAND 4.33
6 CHINA HONG KONG 4.72
7 UAE 5.87
8 TAIWAN 6.46
9 JORDAN 6.79
10 BRAZIL 8.54
11 COLOMBIA 8.59
12 KOREA REP. 9.59
13 PHILIPPINES 9.59
14 MALAYSIA 10.41
15 RUSSIA 11.36
16 INDIA 11.38
17 SWITZERLAND 11.78
18 PERU 12.37
19 SPAIN 13.62
20 MEXICO 13.81
21 USA 13.89
22 IRELAND 14.39
23 UKRAINE 15.42
24 ARGENTINA 15.50
25 ESTONIA 15.50
26 ICELAND 15.54
27 ISRAEL 15.88
28 CHILE 17.02
29 JAPAN 17.47
30 KAZAKHSTAN 18.00
31 CANADA 18.11
32 SINGAPORE 18.45
33 SLOVAK REPUBLIC 18.66
34 MONGOLIA 19.27
35 PORTUGAL 19.27
36 BULGARIA 20.30
37 UNITED KINGDOM 20.59
38 CZECH REPUBLIC 20.63
39 NEW ZEALAND 20.68
40 CHINA MAINLAND 21.06
41 TURKEY 21.40
42 LATVIA 21.54
43 AUSTRALIA 21.81
44 GREECE 21.91
45 CROATIA 22.24
46 LITHUANIA 22.25 2014
47 SWEDEN 23.16
48 ITALY 23.61
49 FRANCE 24.19
50 LUXEMBOURG 24.32
51 POLAND 24.61
52 BELGIUM 25.97
53 SLOVENIA 26.43
54 GERMANY 26.48
55 NETHERLANDS 27.94
56 ROMANIA 28.05
57 FINLAND 28.54
58 HUNGARY 29.06
59 NORWAY 29.30
60 DENMARK 29.67
61 AUSTRIA 31.01
Ranking
Notes & Sources: see Appendix IV
Fiscal Policy 2.2.07
EFFECTIVE PERSONAL INCOME TAX RATE 2015Percentage of an income equal to GDP per capita

IMD World Talent Report 2016
98
1 Singapore +1 95.4
2 Switzerland -1 95.1
3 Denmark +3 85.6
4 Netherlands -1 85.5
5 China Hong Kong +3 85.4
6 Australia +3 83.7
7 New Zealand +12 81.5
8 Finland -4 81.0
9 Canada -4 79.6
10 UAE -3 78.4
11 Belgium -1 77.9
12 Ireland +2 77.1
13 Norway -2 76.7
14 Sweden +1 74.8
15 Qatar +12 74.3
16 Luxembourg -4 74.1
17 Iceland +1 73.1
18 Austria +11 72.6
19 Germany -2 72.3
20 United Kingdom - 72.0
21 USA +2 70.2
22 Israel -9 69.5
23 Philippines -1 69.4
24 Poland -3 67.2
25 Malaysia -9 65.9
26 Taiwan -1 65.4
27 India +9 61.6
28 France - 60.6
29 Czech Republic +1 59.7
30 Portugal +3 59.2
31 Estonia +12 57.7
32 Italy +8 57.3
33 Lithuania -7 57.0
34 Jordan +1 57.0
35 Greece -11 56.4
36 China Mainland +1 54.5
37 Russia +1 53.9
38 Turkey +3 53.8
39 Slovenia - 53.8
40 Slovak Republic +5 53.5
41 Latvia -9 53.1
42 Korea Rep. -11 53.0
43 Romania +4 49.9
44 Argentina +4 49.7
45 Spain +1 48.6
46 Mexico +5 48.0
47 Indonesia -5 47.7
48 Chile -4 47.1
49 Thailand +1 46.7
50 South Africa +4 46.2
51 Kazakhstan -17 45.9
52 Japan -3 45.5
53 Hungary - 41.4
54 Colombia -2 39.2
55 Brazil +6 38.8
56 Mongolia +3 37.2
57 Croatia +1 33.9
58 Bulgaria +2 33.4
59 Peru -2 29.9
60 Ukraine -4 24.6
61 Venezuela -6 24.4
Factor 3: Readiness 2016

IMD World Talent Report 2015
99
IMD World Talent Report 2016
<PICT>!\\nestor\Appl$\WCC\Prod\App\Survey.png
Survey [0..10]
1 NORWAY 7.88
2 FINLAND 7.53
3 NETHERLANDS 7.38
4 PHILIPPINES 7.16
5 IRELAND 7.07
6 DENMARK 7.03
7 CANADA 7.00
8 SWITZERLAND 6.91
9 GREECE 6.85
10 MALAYSIA 6.80
11 CHINA HONG KONG 6.69
12 ITALY 6.64
13 POLAND 6.61
14 ISRAEL 6.56
15 AUSTRALIA 6.51
16 BELGIUM 6.42
17 SWEDEN 6.39
18 USA 6.31
19 RUSSIA 6.31
20 SPAIN 6.29
21 UAE 6.28
22 PORTUGAL 6.25
23 SINGAPORE 6.24
24 ICELAND 6.21
25 TURKEY 6.15
26 SLOVAK REPUBLIC 6.14
27 FRANCE 6.10
27 LITHUANIA 6.10
29 JORDAN 6.04
30 NEW ZEALAND 6.00
31 SLOVENIA 5.95
32 INDIA 5.89
33 UNITED KINGDOM 5.84
34 ARGENTINA 5.76
35 THAILAND 5.71
36 GERMANY 5.59
37 KAZAKHSTAN 5.56
38 INDONESIA 5.54
39 TAIWAN 5.54
40 LUXEMBOURG 5.53
41 AUSTRIA 5.39
42 MEXICO 5.37
43 CHINA MAINLAND 5.35
44 QATAR 5.25
45 LATVIA 5.16
46 COLOMBIA 5.13
47 ROMANIA 5.09
48 KOREA REP. 5.01
49 CHILE 4.76
50 JAPAN 4.73
51 BRAZIL 4.69
52 CZECH REPUBLIC 4.63
53 BULGARIA 4.42
54 UKRAINE 4.23
55 CROATIA 4.19
56 VENEZUELA 4.16
57 PERU 3.70
58 SOUTH AFRICA 3.66
59 HUNGARY 3.56
60 MONGOLIA 3.26
61 ESTONIA 3.22
is not readily available is readily available
Ranking
Labor Market - Availability of Skills 3.2.18
SKILLED LABOR
2016Skilled labor
%
1 QATAR 15.80
2 BRAZIL 6.45
3 SOUTH AFRICA 4.86
4 MEXICO 3.26
5 MONGOLIA 3.22
6 TURKEY 3.10
7 ICELAND 2.33
8 LUXEMBOURG 2.28
9 SINGAPORE 2.26
10 NEW ZEALAND 2.25
11 COLOMBIA 2.19
12 AUSTRALIA 1.84
13 INDIA 1.82 2014
14 ISRAEL 1.78
15 MALAYSIA 1.74
16 RUSSIA 1.57
17 SWITZERLAND 1.46
18 NORWAY 1.43
19 KOREA REP. 1.42
20 CHILE 1.39
21 ROMANIA 1.37
22 HUNGARY 1.30
23 ESTONIA 1.29
24 PHILIPPINES 1.13
25 JORDAN 1.06 2014
26 AUSTRIA 0.98
27 DENMARK 0.92
28 TAIWAN 0.89
29 SLOVAK REPUBLIC 0.88
30 CHINA HONG KONG 0.88
31 IRELAND 0.84
32 CANADA 0.80
33 SWEDEN 0.78
34 UAE 0.78
35 USA 0.77
36 KAZAKHSTAN 0.67 2014
37 UNITED KINGDOM 0.64
38 CROATIA 0.42
39 INDONESIA 0.42
40 NETHERLANDS 0.42
41 PERU 0.41 2014
42 CHINA MAINLAND 0.38 2014
43 FINLAND 0.37
44 GERMANY 0.31
45 ARGENTINA 0.29 2014
46 POLAND 0.26
47 CZECH REPUBLIC 0.23
48 LATVIA 0.19
49 JAPAN 0.17
50 PORTUGAL 0.11
51 FRANCE 0.09
52 ITALY -0.07
53 THAILAND -0.07
54 GREECE -0.08
55 SPAIN -0.14
56 LITHUANIA -0.54
57 SLOVENIA -0.69
58 BULGARIA -0.86
59 BELGIUM -1.66
60 VENEZUELA -2.76
61 UKRAINE -4.34 2014
Ranking
Notes & Sources: see Appendix IV
Labor Market - Availability of Skills 3.2.14
LABOR FORCE GROWTH
2015Percentage change

IMD World Talent Report 2016
100
<PICT>!\\nestor\Appl$\WCC\Prod\App\Survey.png
Survey [0..10]
1 SWITZERLAND 8.03
2 CHINA HONG KONG 8.00
3 UAE 7.52
4 BELGIUM 7.40
5 LUXEMBOURG 7.38
6 SINGAPORE 7.33
7 NETHERLANDS 7.27
8 SWEDEN 7.02
9 QATAR 6.87
10 IRELAND 6.84
11 DENMARK 6.72
12 POLAND 6.69
13 MALAYSIA 6.59
14 GERMANY 6.54
15 UNITED KINGDOM 6.14
16 AUSTRIA 6.06
17 ISRAEL 6.06
18 THAILAND 6.02
19 ARGENTINA 5.90
19 CHILE 5.90
21 PHILIPPINES 5.90
22 NEW ZEALAND 5.85
23 ROMANIA 5.85
24 CZECH REPUBLIC 5.84
25 MEXICO 5.83
26 CANADA 5.74
27 TURKEY 5.73
28 LITHUANIA 5.70
29 AUSTRALIA 5.60
30 LATVIA 5.58
31 JORDAN 5.50
32 USA 5.48
33 GREECE 5.39
34 FINLAND 5.28
35 HUNGARY 5.07
36 PERU 5.06
37 INDIA 5.06
38 NORWAY 5.03
39 ICELAND 4.96
40 COLOMBIA 4.89
41 ITALY 4.88
42 TAIWAN 4.83
43 FRANCE 4.80
44 KAZAKHSTAN 4.80
45 SOUTH AFRICA 4.75
46 ESTONIA 4.75
47 SLOVAK REPUBLIC 4.73
48 VENEZUELA 4.71
49 BULGARIA 4.58
50 SPAIN 4.50
51 INDONESIA 4.49
52 KOREA REP. 4.44
53 MONGOLIA 4.38
54 SLOVENIA 4.38
55 RUSSIA 4.38
56 BRAZIL 4.34
57 PORTUGAL 4.20
58 CHINA MAINLAND 4.02
59 UKRAINE 4.00
60 CROATIA 3.84
61 JAPAN 2.77
Labor Market - Availability of Skills 3.2.23
INTERNATIONAL EXPERIENCE
2016International experience of senior managers is generally
low significant
Ranking
<PICT>!\\nestor\Appl$\WCC\Prod\App\Survey.png
Survey [0..10]
1 IRELAND 8.42
2 CHINA HONG KONG 8.31
3 SWITZERLAND 8.30
4 DENMARK 8.17
5 NORWAY 8.15
6 NETHERLANDS 7.98
7 USA 7.86
8 BELGIUM 7.82
9 SWEDEN 7.82
10 CANADA 7.80
11 UNITED KINGDOM 7.78
12 AUSTRALIA 7.76
13 SINGAPORE 7.57
14 POLAND 7.36
15 FINLAND 7.32
16 MALAYSIA 7.22
17 LUXEMBOURG 7.19
18 GERMANY 7.14
19 ISRAEL 7.14
20 FRANCE 7.11
21 AUSTRIA 7.10
22 NEW ZEALAND 7.08
23 UAE 6.97
24 ICELAND 6.89
25 PHILIPPINES 6.81
26 TURKEY 6.75
27 TAIWAN 6.71
28 INDIA 6.63
29 RUSSIA 6.56
30 ARGENTINA 6.54
31 CHILE 6.48
32 INDONESIA 6.45
33 JORDAN 6.43
34 KAZAKHSTAN 6.33
35 GREECE 6.25
36 QATAR 6.14
37 ITALY 6.11
38 SLOVAK REPUBLIC 6.07
39 JAPAN 6.06
40 THAILAND 6.04
41 LATVIA 6.00
42 SLOVENIA 5.82
43 CZECH REPUBLIC 5.77
44 MEXICO 5.74
45 KOREA REP. 5.67
45 LITHUANIA 5.67
47 SPAIN 5.66
48 CHINA MAINLAND 5.59
49 SOUTH AFRICA 5.49
50 COLOMBIA 5.44
51 PORTUGAL 5.41
52 ROMANIA 5.33
53 PERU 5.26
54 BRAZIL 5.04
55 BULGARIA 4.98
55 VENEZUELA 4.98
57 ESTONIA 4.92
58 HUNGARY 4.69
59 UKRAINE 4.49
60 MONGOLIA 4.36
61 CROATIA 4.25
Labor Market - Availability of Skills 3.2.19
FINANCE SKILLS
2016Finance skills
are not readily available are readily available
Ranking

IMD World Talent Report 2015
101
IMD World Talent Report 2016
<PICT>!\\nestor\Appl$\WCC\Prod\App\Survey.png
Survey [0..10]
1 SWITZERLAND 9.11
2 FINLAND 8.70
3 SINGAPORE 8.18
4 NETHERLANDS 8.13
5 CANADA 8.05
6 DENMARK 7.90
7 NEW ZEALAND 7.85
8 BELGIUM 7.71
9 IRELAND 7.67
10 GERMANY 7.63
11 AUSTRALIA 7.57
12 UAE 7.55
13 NORWAY 7.50
14 ICELAND 7.38
15 QATAR 7.00
16 CHINA HONG KONG 6.88
17 ESTONIA 6.78
18 UNITED KINGDOM 6.51
19 LUXEMBOURG 6.44
20 ISRAEL 6.43
21 TAIWAN 6.34
22 MALAYSIA 6.32
23 USA 6.28
24 PORTUGAL 6.15
25 SWEDEN 6.12
26 FRANCE 6.03
27 AUSTRIA 5.87
28 ITALY 5.85
29 JAPAN 5.70
30 POLAND 5.61
31 PHILIPPINES 5.59
32 CZECH REPUBLIC 5.57
32 LITHUANIA 5.57
34 INDIA 5.46
35 JORDAN 5.32
36 INDONESIA 5.17
37 SLOVENIA 5.15
38 KOREA REP. 4.99
39 SPAIN 4.57
40 GREECE 4.55
41 ARGENTINA 4.52
42 RUSSIA 4.48
43 KAZAKHSTAN 4.34
44 THAILAND 4.30
45 SLOVAK REPUBLIC 4.27
46 LATVIA 4.21
47 CHINA MAINLAND 4.21
48 ROMANIA 4.18
49 UKRAINE 4.06
50 MEXICO 4.00
51 TURKEY 3.85
52 COLOMBIA 3.72
53 HUNGARY 3.65
54 MONGOLIA 3.56
55 CHILE 3.46
56 PERU 2.91
57 CROATIA 2.73
58 BULGARIA 2.69
59 BRAZIL 2.68
60 SOUTH AFRICA 2.33
61 VENEZUELA 2.00
does not meet the needs of a
competitive economy
meets the needs of a
competitive economy
Ranking
Education 4.5.13
EDUCATIONAL SYSTEM
2016The educational system
<PICT>!\\nestor\Appl$\WCC\Prod\App\Survey.png
Survey [0..10]
1 CHINA HONG KONG 7.35
2 USA 7.05
3 DENMARK 7.04
4 SWEDEN 7.03
5 SWITZERLAND 7.01
6 UAE 6.93
7 BELGIUM 6.93
8 NETHERLANDS 6.82
9 IRELAND 6.79
10 NORWAY 6.76
11 POLAND 6.76
12 SINGAPORE 6.76
13 MALAYSIA 6.74
14 PHILIPPINES 6.60
15 CANADA 6.55
16 TURKEY 6.42
17 AUSTRALIA 6.40
18 UNITED KINGDOM 6.38
19 ISRAEL 6.27
20 NEW ZEALAND 6.22
21 JORDAN 6.15
22 FINLAND 6.00
23 ITALY 5.99
24 INDIA 5.98
25 LUXEMBOURG 5.97
26 THAILAND 5.93
27 QATAR 5.92
28 GERMANY 5.91
29 FRANCE 5.90
30 CHILE 5.87
31 RUSSIA 5.69
32 KAZAKHSTAN 5.69
33 ICELAND 5.68
34 TAIWAN 5.60
35 GREECE 5.53
36 CHINA MAINLAND 5.46
37 ARGENTINA 5.43
38 SLOVAK REPUBLIC 5.37
39 AUSTRIA 5.37
40 LITHUANIA 5.30
41 ROMANIA 5.12
42 MEXICO 5.11
43 SPAIN 5.10
44 CZECH REPUBLIC 5.05
45 INDONESIA 5.04
46 LATVIA 5.00
47 SOUTH AFRICA 4.88
48 BRAZIL 4.84
49 SLOVENIA 4.71
50 COLOMBIA 4.67
51 PORTUGAL 4.44
52 KOREA REP. 4.02
53 VENEZUELA 4.00
54 MONGOLIA 3.92
55 PERU 3.88
56 UKRAINE 3.86
57 BULGARIA 3.84
58 ESTONIA 3.80
59 CROATIA 3.52
60 JAPAN 3.31
61 HUNGARY 3.12
are not readily available are readily available
Ranking
Labor Market - Availability of Skills 3.2.24
COMPETENT SENIOR MANAGERS
2016Competent senior managers

IMD World Talent Report 2016
102
<PICT>!\\nestor\Appl$\WCC\Prod\App\Survey.png
Survey [0..10]
1 SWITZERLAND 8.80
2 NETHERLANDS 8.18
2 SINGAPORE 8.18
4 FINLAND 8.00
5 DENMARK 7.98
6 BELGIUM 7.96
7 ISRAEL 7.61
8 GERMANY 7.59
9 CHINA HONG KONG 7.55
10 USA 7.51
11 CANADA 7.45
12 IRELAND 7.44
13 ICELAND 7.40
14 NORWAY 7.35
15 NEW ZEALAND 7.19
16 AUSTRALIA 7.14
17 UAE 7.13
18 SWEDEN 7.09
19 PORTUGAL 6.96
20 AUSTRIA 6.90
21 QATAR 6.75
22 UNITED KINGDOM 6.63
23 ESTONIA 6.51
24 MALAYSIA 6.22
25 INDONESIA 6.21
26 PHILIPPINES 6.15
27 ITALY 6.07
28 FRANCE 6.03
29 LUXEMBOURG 6.00
30 INDIA 5.77
31 CZECH REPUBLIC 5.77
32 LITHUANIA 5.73
33 ARGENTINA 5.52
34 POLAND 5.47
35 TAIWAN 5.47
36 CHILE 5.37
37 RUSSIA 5.27
38 JORDAN 5.27
39 MEXICO 5.26
40 SOUTH AFRICA 5.04
41 GREECE 4.93
42 ROMANIA 4.91
43 LATVIA 4.86
44 HUNGARY 4.73
45 SLOVENIA 4.73
46 COLOMBIA 4.63
47 THAILAND 4.62
48 UKRAINE 4.61
49 CHINA MAINLAND 4.50
50 JAPAN 4.43
51 SPAIN 4.40
52 KAZAKHSTAN 4.37
53 BRAZIL 4.31
54 TURKEY 4.23
55 KOREA REP. 4.21
56 SLOVAK REPUBLIC 4.20
57 VENEZUELA 4.08
58 PERU 3.68
59 CROATIA 3.22
60 MONGOLIA 3.12
61 BULGARIA 2.86
does not meet the needs of a
competitive economy
meets the needs of a
competitive economy
Ranking
Education 4.5.15
UNIVERSITY EDUCATION
2016University education
<PICT>!\\nestor\Appl$\WCC\Prod\App\Survey.png
Survey [0..10]
1 SINGAPORE 8.48
2 SWITZERLAND 8.16
3 FINLAND 7.87
4 UAE 7.03
5 NETHERLANDS 6.93
6 DENMARK 6.79
7 QATAR 6.77
8 CANADA 6.72
9 CHINA HONG KONG 6.69
10 BELGIUM 6.63
11 MALAYSIA 6.47
12 GERMANY 6.45
13 ESTONIA 6.44
14 IRELAND 6.33
15 NEW ZEALAND 6.31
15 TAIWAN 6.31
17 FRANCE 6.30
18 INDIA 6.22
19 ISRAEL 6.06
20 ICELAND 6.00
21 NORWAY 5.97
22 JAPAN 5.87
23 POLAND 5.81
24 PORTUGAL 5.66
25 SWEDEN 5.64
26 AUSTRALIA 5.62
27 USA 5.58
28 INDONESIA 5.57
29 UNITED KINGDOM 5.53
30 ITALY 5.52
31 LUXEMBOURG 5.47
32 CHINA MAINLAND 5.35
33 KOREA REP. 5.35
34 SLOVENIA 5.27
35 PHILIPPINES 5.24
36 RUSSIA 5.22
37 JORDAN 5.20
38 CZECH REPUBLIC 5.15
39 ROMANIA 4.91
40 GREECE 4.88
41 KAZAKHSTAN 4.78
42 LITHUANIA 4.73
43 AUSTRIA 4.62
44 SLOVAK REPUBLIC 4.60
45 UKRAINE 4.51
46 MONGOLIA 4.25
47 SPAIN 4.13
48 HUNGARY 4.11
49 THAILAND 4.09
50 ARGENTINA 3.76
51 MEXICO 3.69
52 TURKEY 3.69
53 LATVIA 3.58
54 BULGARIA 3.17
55 COLOMBIA 3.09
56 PERU 2.84
57 CROATIA 2.83
58 CHILE 2.79
59 SOUTH AFRICA 2.75
60 BRAZIL 2.65
61 VENEZUELA 2.52
Education 4.5.14
SCIENCE IN SCHOOLS
2016Science in schools
is not sufficiently emphasized is sufficiently emphasized
Ranking

IMD World Talent Report 2015
103
IMD World Talent Report 2016
<PICT>!\\nestor\Appl$\WCC\Prod\App\Survey.png
Survey [0..10]
1 DENMARK 8.98
2 SWITZERLAND 8.90
3 NETHERLANDS 8.82
4 SWEDEN 8.76
5 LUXEMBOURG 8.59
6 ICELAND 8.49
7 BELGIUM 8.46
8 NORWAY 8.44
9 FINLAND 8.15
10 SINGAPORE 8.12
11 UAE 8.07
12 PORTUGAL 7.89
13 LITHUANIA 7.87
14 ISRAEL 7.84
15 GREECE 7.75
16 SLOVENIA 7.66
17 CANADA 7.55
18 PHILIPPINES 7.46
19 POLAND 7.39
20 LATVIA 7.32
21 ESTONIA 7.25
22 GERMANY 7.05
23 CHINA HONG KONG 7.04
24 INDIA 6.92
25 QATAR 6.84
26 MALAYSIA 6.58
27 AUSTRIA 6.42
28 SLOVAK REPUBLIC 6.40
29 CZECH REPUBLIC 6.13
30 CROATIA 6.13
31 JORDAN 5.94
32 ARGENTINA 5.90
33 KOREA REP. 5.88
34 AUSTRALIA 5.82
35 INDONESIA 5.81
36 NEW ZEALAND 5.78
37 BULGARIA 5.71
38 ROMANIA 5.67
39 TAIWAN 5.52
40 SOUTH AFRICA 5.38
41 MONGOLIA 5.34
42 CHINA MAINLAND 5.07
43 IRELAND 4.98
44 USA 4.91
45 UKRAINE 4.86
46 MEXICO 4.70
47 KAZAKHSTAN 4.70
48 TURKEY 4.53
49 ITALY 4.43
50 RUSSIA 4.35
51 UNITED KINGDOM 4.02
52 THAILAND 3.86
53 PERU 3.68
54 SPAIN 3.67
55 FRANCE 3.58
56 COLOMBIA 3.48
57 CHILE 3.30
58 HUNGARY 3.13
59 BRAZIL 3.04
60 VENEZUELA 3.04
61 JAPAN 2.90
Ranking
Education 4.5.18
LANGUAGE SKILLS
2016Language skills
are not meeting the needs of
enterprises
are meeting the needs of
enterprises
<PICT>!\\nestor\Appl$\WCC\Prod\App\Survey.png
Survey [0..10]
1 SWITZERLAND 8.69
2 DENMARK 8.00
3 USA 7.74
4 NORWAY 7.63
5 NETHERLANDS 7.60
6 CHINA HONG KONG 7.59
7 SINGAPORE 7.42
8 SWEDEN 7.41
9 CANADA 7.40
10 BELGIUM 7.30
11 ICELAND 7.24
12 ISRAEL 7.19
13 IRELAND 7.16
14 UAE 7.15
15 PORTUGAL 7.08
16 NEW ZEALAND 7.04
17 GERMANY 7.03
18 FINLAND 7.03
19 AUSTRALIA 6.98
20 AUSTRIA 6.74
21 UNITED KINGDOM 6.63
22 INDIA 6.62
23 QATAR 6.59
24 UKRAINE 6.49
25 PHILIPPINES 6.41
26 ESTONIA 6.41
27 MALAYSIA 6.40
28 CZECH REPUBLIC 6.33
29 CHILE 6.29
30 ARGENTINA 6.24
31 INDONESIA 6.13
32 LITHUANIA 6.00
33 TAIWAN 5.98
34 LUXEMBOURG 5.95
35 SLOVENIA 5.85
36 POLAND 5.78
37 SPAIN 5.74
38 ITALY 5.61
39 LATVIA 5.53
40 SLOVAK REPUBLIC 5.47
41 MEXICO 5.45
42 ROMANIA 5.42
43 SOUTH AFRICA 5.42
44 JORDAN 5.33
45 THAILAND 5.26
46 CHINA MAINLAND 5.05
47 TURKEY 5.04
48 GREECE 5.01
49 FRANCE 4.91
50 COLOMBIA 4.89
51 HUNGARY 4.79
52 KOREA REP. 4.74
53 RUSSIA 4.66
54 BRAZIL 4.59
55 PERU 4.54
56 KAZAKHSTAN 4.45
57 JAPAN 4.32
58 VENEZUELA 4.28
59 CROATIA 3.84
60 BULGARIA 3.76
61 MONGOLIA 3.59
Education 4.5.16
MANAGEMENT EDUCATION
2016Management education
does not meet the needs of the
business community
meets the needs of the
business community
Ranking

IMD World Talent Report 2016
104
4.5.11
2012
1 CHINA MAINLAND 613 580
2 SINGAPORE 573 551
3 CHINA HONG KONG 561 555
4 KOREA REP. 554 538
5 JAPAN 536 547
6 TAIWAN 560 523
7 FINLAND 519 545
8 ESTONIA 521 541
9 SWITZERLAND 531 515
10 NETHERLANDS 523 522
11 POLAND 518 526
12 CANADA 518 525
13 GERMANY 514 524
14 AUSTRALIA 504 521
15 IRELAND 501 522
16 BELGIUM 515 505
17 NEW ZEALAND 500 516
18 SLOVENIA 501 514
19 AUSTRIA 506 506
20 UNITED KINGDOM 494 514
21 CZECH REPUBLIC 499 508
22 DENMARK 500 498
23 FRANCE 495 499
24 LATVIA 491 502
25 NORWAY 489 495
26 LUXEMBOURG 490 491
27 SPAIN 484 496
28 ITALY 485 494
29 USA 481 497
30 PORTUGAL 487 489
31 LITHUANIA 479 496
32 HUNGARY 477 494
33 ICELAND 493 478
34 RUSSIA 482 486
35 SWEDEN 478 485
36 CROATIA 471 491
37 SLOVAK REPUBLIC 482 471
38 ISRAEL 466 470
39 GREECE 453 467
40 TURKEY 448 463
41 BULGARIA 439 446
42 ROMANIA 445 439
43 UAE 434 448
44 THAILAND 427 444
45 CHILE 423 445
46 KAZAKHSTAN 432 425
47 MALAYSIA 421 420
48 MEXICO 413 415
49 BRAZIL 391 405
50 JORDAN 386 409
51 ARGENTINA 388 406
52 COLOMBIA 376 399
53 QATAR 376 384
54 INDONESIA 375 382
55 PERU 368 373
- INDIA - -- MONGOLIA - -- PHILIPPINES - -- SOUTH AFRICA - -- UKRAINE - -- VENEZUELA - -
Mathematics
Notes & Sources: see Appendix IV
Sciences
Education
EDUCATIONAL ASSESSMENT - PISA
PISA survey of 15-year olds
number
1 AUSTRALIA 10.73
2 NEW ZEALAND 9.29
3 SINGAPORE 9.06
4 AUSTRIA 8.36
5 UAE 6.55
6 UNITED KINGDOM 6.52
7 SWITZERLAND 5.86
8 LUXEMBOURG 5.36
9 DENMARK 5.26
10 JORDAN 4.37 2012
11 BELGIUM 4.37
12 QATAR 4.25
13 NETHERLANDS 4.10
14 FINLAND 4.01
15 CANADA 3.90 2012
16 CZECH REPUBLIC 3.82
17 CHINA HONG KONG 3.72
18 ICELAND 3.68 2012
19 FRANCE 3.65
20 TAIWAN 3.41
21 IRELAND 2.80
22 SWEDEN 2.64
23 GREECE 2.49
24 USA 2.48
25 GERMANY 2.42
26 HUNGARY 2.09
27 SLOVAK REPUBLIC 1.88
28 NORWAY 1.81
29 LATVIA 1.73
30 BULGARIA 1.60
31 ESTONIA 1.42
32 PORTUGAL 1.39
33 ITALY 1.38
34 MALAYSIA 1.34
35 LITHUANIA 1.32
36 SLOVENIA 1.24
37 SPAIN 1.21
38 KOREA REP. 1.18
39 UKRAINE 1.09
40 ROMANIA 1.08
41 JAPAN 1.07
42 RUSSIA 0.97
43 ARGENTINA 0.95
44 SOUTH AFRICA 0.80
45 POLAND 0.72
46 TURKEY 0.71
47 ISRAEL 0.57 2012
48 COLOMBIA 0.54
49 KAZAKHSTAN 0.51
50 MONGOLIA 0.37
51 THAILAND 0.32 2012
52 CROATIA 0.20 2012
53 CHILE 0.17
54 BRAZIL 0.08 2012
55 CHINA MAINLAND 0.07
56 MEXICO 0.07
57 INDONESIA 0.03 2012
58 INDIA 0.03
- PERU -- PHILIPPINES -- VENEZUELA -
Education 4.5.09
STUDENT MOBILITY INBOUND
2013Foreign tertiary-level students per 1000 inhabitants
Ranking
Notes & Sources: see Appendix IV

IMD World Talent Report 2015
105
IMD World Talent Report 2016
Meth
od
olo
gy

IMD World Talent Report 2016
106
Talent competitiveness methodology
I. The structure of the IMD World Talent Ranking
The ranking is structured according to three factors: 1) investment and development, 2) appeal and 3) readiness:
The first factor takes into account the investment in and development of home-grown talent. It traces the size of public investment on education by incorporating an indicator of public expenditure. It also looks at the quality of education through indicators related to pupil-teacher ratios. The development of talent is covered by variables related to the implementation of apprenticeship and the priority of employee training for companies. It also looks at the development of the female labor force. In addition, this factor takes into account the quality of the health infrastructure in terms of meeting the health needs of society.
The appeal factor goes beyond the focus on the local labor force to incorporate the ability of a country to tap into the overseas talent pool. It does so by including indicators such as the cost of living and quality of life in a particular economy. Specifically, it examines the ability of a country to attract highly skilled foreign labor. In addition, it assesses the way enterprises prioritize the attraction and retention of talent. Another component of this factor evaluates the impact of brain drain on the competitiveness of countries. It also takes into account the level of worker motivation. Salary and taxation levels are important for an economy to be able to maintain an effective flow of talent. The appeal factor thus considers remuneration at the management and services professions levels and personal income tax rates. This factor also incorporates measures of personal security and the protection of private property rights because they play a key role in increasing the attractiveness of a particular economy.
The success of the investment in and development of talent and the ability to attract and retain talent is reflected in the availability of skills and competencies to sustain an economy’s talent pool. The readiness factor looks at the context of the talent pool. It considers the growth of the labor force and the quality of the skills available. It also takes into consideration the experience and competencies of the existing senior managers’ pool. In addition, the readiness factor focuses, on the ability of the educational system to meet the talent needs of enterprises. It examines the way in which the educational system fulfils the talent demands of the economy, the ability of higher education to meet that demand and the languages skills available. Finally, it considers the mobility of students (inbound) and educational assessment (PISA).
Figure 1: Structure of the IMD World Talent Ranking
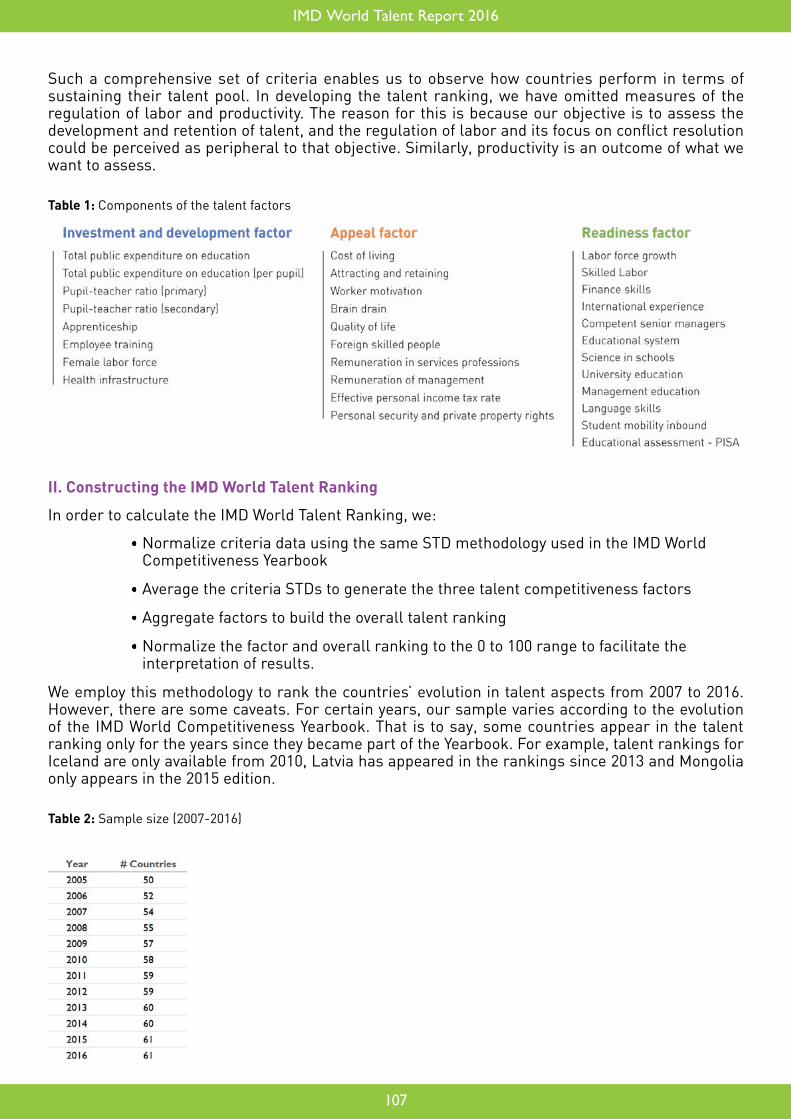
IMD World Talent Report 2016
107
Such a comprehensive set of criteria enables us to observe how countries perform in terms of sustaining their talent pool. In developing the talent ranking, we have omitted measures of the regulation of labor and productivity. The reason for this is because our objective is to assess the development and retention of talent, and the regulation of labor and its focus on conflict resolution could be perceived as peripheral to that objective. Similarly, productivity is an outcome of what we want to assess.
Table 1: Components of the talent factors
II. Constructing the IMD World Talent Ranking
In order to calculate the IMD World Talent Ranking, we:
Normalize criteria data using the same STD methodology used in the IMD World Competitiveness Yearbook
Average the criteria STDs to generate the three talent competitiveness factors
Aggregate factors to build the overall talent ranking
Normalize the factor and overall ranking to the 0 to 100 range to facilitate the interpretation of results.
We employ this methodology to rank the countries’ evolution in talent aspects from 2007 to 2016. However, there are some caveats. For certain years, our sample varies according to the evolution of the IMD World Competitiveness Yearbook. That is to say, some countries appear in the talent ranking only for the years since they became part of the Yearbook. For example, talent rankings for Iceland are only available from 2010, Latvia has appeared in the rankings since 2013 and Mongolia only appears in the 2015 edition.
Table 2: Sample size (2007-2016)
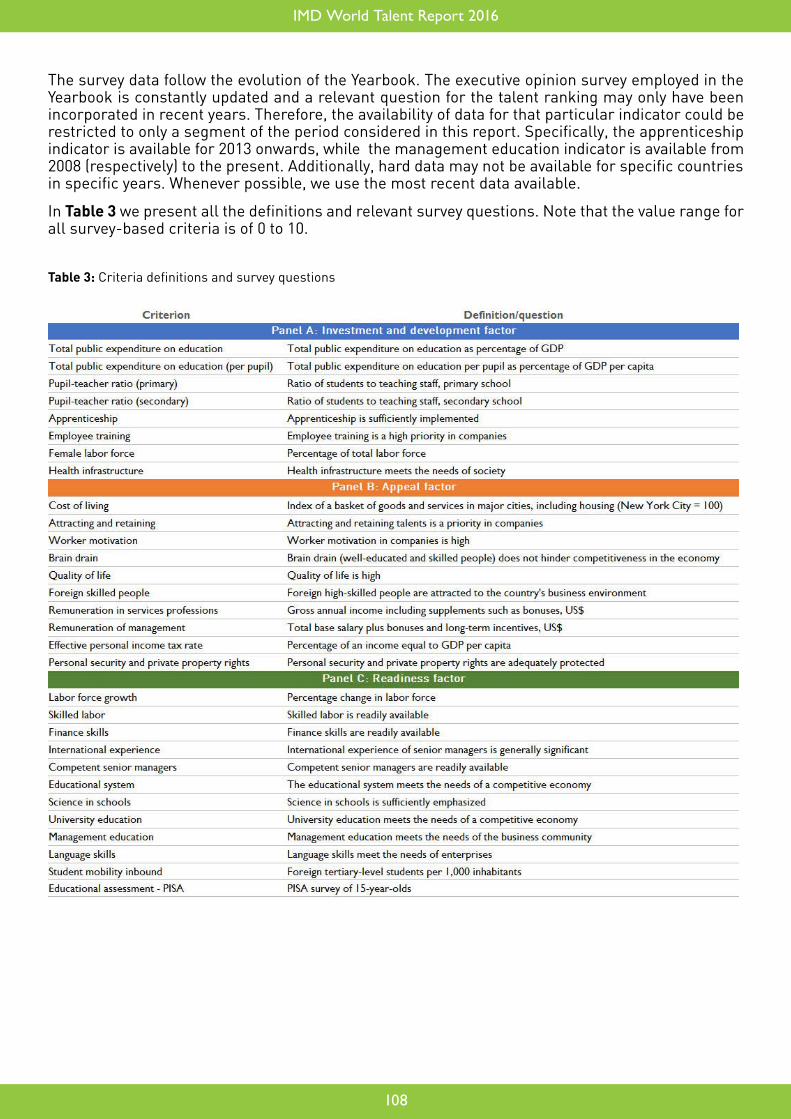
IMD World Talent Report 2016
108
The survey data follow the evolution of the Yearbook. The executive opinion survey employed in the Yearbook is constantly updated and a relevant question for the talent ranking may only have been incorporated in recent years. Therefore, the availability of data for that particular indicator could be restricted to only a segment of the period considered in this report. Specifically, the apprenticeship indicator is available for 2013 onwards, while the management education indicator is available from 2008 (respectively) to the present. Additionally, hard data may not be available for specific countries in specific years. Whenever possible, we use the most recent data available.
In Table 3 we present all the definitions and relevant survey questions. Note that the value range for all survey-based criteria is of 0 to 10.
Table 3: Criteria definitions and survey questions

IMD World Talent Report 2016
109
Appen
dix

Collaboration with 55 Partner Institutes worldwide helps us gather complete, up-to-date and reliable statistics.
The date shown in the criteria table is the reference year of the data. When statistical data is not available the name appears at the bottom of the statistical table and a dash is shown. When the data is older than the reference year, the year of the data is shown next to the criterion table.
Total public expenditure on education (%)
Government Finance Statistics YearbookEurostatNational sources
Jordan, Chile and Luxembourg: Budgetary central government.
Total public expenditure on education per pupil
Government Finance Statistics YearbookNational sources
Croatia: Sum of expenditure from central government and local governments. Jordan, Chile and Luxembourg: Budgetary central government.
Pupil-teacher ratio (primary education)
UNESCO http://stats.uis.unesco.orgOECD Education at a GlanceNational sources
For public and private institutions, based on full-time equivalent. Primary education (ISCED level 1): level of which the main function is to provide the basic elements of education at such establishments as elementary schools, primary schools. The ratio of students to teaching staff is calculated as the total number of full-time equivalent students divided by the total number of full-time equivalent educational personal. Teaching staff refers to professional personnel directly involved in teaching students. The classification includes classroom teachers; special education teacher; and other teachers who work with students as a whole class in a classroom, in small groups in a resource room, or in one-to-one teaching inside a regular classroom. Teaching staff also includes chairpersons of departments whose duties include some amount of teaching, but it does not include non-professional personnel who support teachers in providing instructions to students, such as teacher’s aides and other paraprofessional personnel. Data are UNESCO or OECD estimates and from national statistics. Australia, Israel, Italy, Norway, and Russia: public institutions only. Hong Kong: figures refer to the position as at mid-September of the respective years (i.e. the beginning of an academic year spanning two calendar years). Teaching staff includes teachers as well as principles; figures cover local schools, special and international schools.
IMD World Talent Report 2016
110
Notes and Sources

Pupil-teacher ratio (secondary education)
UNESCO http://stats.uis.unesco.orgOECD Education at a GlanceNational sources
For public and private institutions, based on full-time equivalent. Secondary education (ISCED levels 2 and 3): level providing general and/or specialized instruction at middle schools, secondary schools, high schools, teacher training schools and schools of a vocational or technical nature. The ratio of students to teaching staff is calculated as the total number of full-time equivalent students divided by the total number of full-time equivalent educational personal. Teaching staff refers to professional personnel directly involved in teaching students. The classification includes classroom teachers; special education teacher; and other teachers who work with students as a whole class in a classroom, in small groups in a resource room, or in one-to-one teaching inside a regular classroom. Teaching staff also includes chairpersons of departments whose duties include some amount of teaching, but it does not include non-professional personnel who support teachers in providing instructions to students, such as teacher’s aides and other paraprofessional personnel. Data are UNESCO or OECD estimates and from national statistics. Australia, Canada, Ireland, Israel, Italy, Jordan, Norway and Russia: public institutions only. Australia: includes only programs in upper secondary education. Belgium: excludes independent private institutions. Hong Kong: figures refer to the position as at mid-September of the respective years (i.e. the beginning of an academic year spanning two calendar years). Teaching staff includes teachers as well as principles; figures cover local schools, special and international schools.
Female labor force (%)
OECD Main Economic Indicators National sources
Estimate for latest year. Austria: break in series in 2008. Denmark: break in series in 2009. Indonesia: as of August for 2010. Malaysia: break in series in 2010. Portugal: methodological change in 2011. Romania: break in series in 2002, third quarter for 2013. Spain: break in series in 2005.
Cost-of-living index
MERCER Cost of Living surveywww.mercer.com
The Mercer survey covers 214 cities across five continents and measures the comparative cost of over 200 items in each location, including housing, transport, food, clothing, household goods and entertainment. It is the world’s most comprehensive cost of living survey and is used to help multinational companies and governments determine compensation allowance for their expatriate employees. New York is used as the base city (=100) for the index and all cities are compared against New York. Currency movements are measured against the US dollar. The cost of housing – often the biggest expense for expats - plays an important part in determining where cities are ranked.
Mercer data is shown for cities (sometimes several data per country). Therefore, the WCC team made an average for each WCY country. Data is not always comparable over years (money fluctuations in 2010 and 2011).
IMD World Talent Report 2016
111

Effective personal income tax rate
PricewaterhouseCoopers, Resource Tax Manager
This criterion is based on the latest GDP per capita figures. Amount of personal income tax (including social security paid by the employee) that an individual married + 1 child with this level of earnings would expect to pay. The taxes for Canada, Switzerland and the US are an average for the respective provinces, cantons and states. India: in case, where the number of employees in the establishment exceeds 20 and an employee’s monthly salary is less than INR 6,500.--, he would have to contribute to Provident Fund 12% of basic salary. The employer also contributes to an equal amount to Provident Fund. As a consequence, if we assume that the number of employees is less than 20, no social security contributions would be due. The differences against last year’s data can generally be explained by differences in base GDP/capita, and the changes in legislation for some countries.
Remuneration in services professions
UBS Prices and EarningsNational sources
Figures are estimates remuneration paid in major cities. Gross annual income including possible supplements such as profit sharing, performance bonuses, vacation pay, additional monthly salaries and family allowances. Bank Credit Officer: completed bank training and around 10 years’ experience in a bank; about 35 years old, married, two children. Product Manager: employed in the pharmaceuticals, chemicals or food industry, middle-management position, university or technical college graduate with at least 5 years’ experience in the field; about 35 years old, married, no children. Primary school teacher: teaching in the state school system (not private schools) for around 10 years; about 35 years old, married, two children. Personal Assistant: to a department head in an industrial or service company, around 5 years’ experience (PC skills, 1 foreign language); about 25 years old, single. Call center agent: trained agent at an inbound call/service center, e.g. in the telecommunications or technology sector; age about 25, single.
Remuneration of management
HCM Compensation Insights & Technology AG (CCT-ProSurvey)National sources
Total remuneration: including annual base salary, annual short-term incentive bonus and long term incentive. Based on companies having a minimal turnover of US$ 250 million. Engineer: co-ordinates the engineering/ technical aspects of production operations; typically manages functions such as process engineering, plant specifications and development; is responsible for planning, calculating and budgeting any item necessary to achieve a project; monitors the entire development of a project; holds an University degree. Estonia: break in series in 2011 (change of source, data for earlier years are not comparable). Slovenia: break in series in 2007, estimates, not entirely corresponding to definition.
Director manufacturing: directs the manufacturing side of the operations, including production, engineering, production and material control and quality assurance; manages the output process, production control and quality assurance; is responsible for manufacturing, engineering, maintenance purchasing, shipping and receiving as well as quality control; ensures the return on investment. Estonia: break in series in 2011 (change of source, data for earlier years are not comparable). Slovenia: break in series in 2007, estimates, not entirely corresponding to definition.
IMD World Talent Report 2016
112
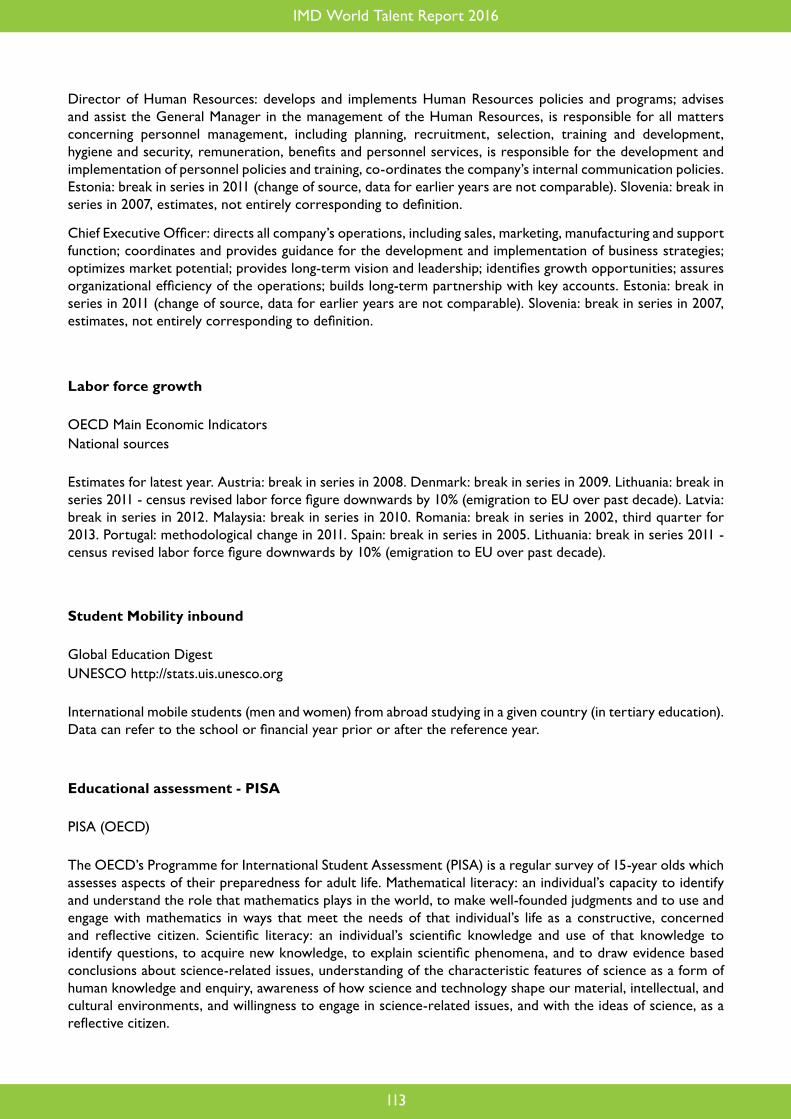
Director of Human Resources: develops and implements Human Resources policies and programs; advises and assist the General Manager in the management of the Human Resources, is responsible for all matters concerning personnel management, including planning, recruitment, selection, training and development, hygiene and security, remuneration, benefits and personnel services, is responsible for the development and implementation of personnel policies and training, co-ordinates the company’s internal communication policies. Estonia: break in series in 2011 (change of source, data for earlier years are not comparable). Slovenia: break in series in 2007, estimates, not entirely corresponding to definition.
Chief Executive Officer: directs all company’s operations, including sales, marketing, manufacturing and support function; coordinates and provides guidance for the development and implementation of business strategies; optimizes market potential; provides long-term vision and leadership; identifies growth opportunities; assures organizational efficiency of the operations; builds long-term partnership with key accounts. Estonia: break in series in 2011 (change of source, data for earlier years are not comparable). Slovenia: break in series in 2007, estimates, not entirely corresponding to definition.
Labor force growth
OECD Main Economic Indicators National sources
Estimates for latest year. Austria: break in series in 2008. Denmark: break in series in 2009. Lithuania: break in series 2011 - census revised labor force figure downwards by 10% (emigration to EU over past decade). Latvia: break in series in 2012. Malaysia: break in series in 2010. Romania: break in series in 2002, third quarter for 2013. Portugal: methodological change in 2011. Spain: break in series in 2005. Lithuania: break in series 2011 - census revised labor force figure downwards by 10% (emigration to EU over past decade).
Student Mobility inbound
Global Education Digest UNESCO http://stats.uis.unesco.org
International mobile students (men and women) from abroad studying in a given country (in tertiary education). Data can refer to the school or financial year prior or after the reference year.
Educational assessment - PISA
PISA (OECD)
The OECD’s Programme for International Student Assessment (PISA) is a regular survey of 15-year olds which assesses aspects of their preparedness for adult life. Mathematical literacy: an individual’s capacity to identify and understand the role that mathematics plays in the world, to make well-founded judgments and to use and engage with mathematics in ways that meet the needs of that individual’s life as a constructive, concerned and reflective citizen. Scientific literacy: an individual’s scientific knowledge and use of that knowledge to identify questions, to acquire new knowledge, to explain scientific phenomena, and to draw evidence based conclusions about science-related issues, understanding of the characteristic features of science as a form of human knowledge and enquiry, awareness of how science and technology shape our material, intellectual, and cultural environments, and willingness to engage in science-related issues, and with the ideas of science, as a reflective citizen.
IMD World Talent Report 2016
113

Executive Opinion Survey
Every year, for our flagship publication, The IMD World Competitiveness Yearbook, we conduct an Executive Opinion Survey in order to complement the statistics that we use from international, national and regional sources. Whereas the Hard Data shows how competitiveness is measured over a specific period of time, the Survey Data measures competitiveness as it is perceived. The survey was designed to quantify issues that are not easily measured, for example: management practices, labor relations, corruption, environmental concerns or quality of life. The survey responses reflect present and future perceptions of competitiveness by business executives who are dealing with international business situations. Their responses are more recent and closer to reality since there is no time lag, which is often a problem with Hard Data that shows a “picture of the past”.
The Executive Opinion Survey is sent to executives in top- and middle management in all of the economies covered by the WCY. In order to be statistically representative, we select a sample size which is proportional to the GDP of each economy. The sample of respondents are representative of the entire economy, covering a cross-section of the business community in each economic sector: primary, manufacturing and services, based on their contribution to the GDP of the economy. The survey respondents are nationals or expatriates, located in local and foreign enterprises in the economy and which, in general, have an international dimension. They are asked to evaluate the present and expected competitiveness conditions of the economy in which they work and have resided during the past year, drawing from the wealth of their international experience, thereby ensuring that the evaluations portray an in-depth knowledge of their particular environment. We try to contact most IMD alumni and all responses returned to IMD are treated as confidential. The surveys are sent in January and are returned in April; in 2015, we received 6,200 responses from the 61 economies worldwide. The respondents assess the competitiveness issues by answering the questions on a scale of 1 to 6. The average value for each economy is then calculated and converted into a 0 to 10 scale.
IMD World Talent Report 2016
114

IMD World Talent Report 2016
115
We would like to express our deep appreciation for the contribution of our Partner Institutes, enabling an extensive coverage of competitiveness in their home countries. The following Institutes and people supplied data from national sources and helped distribute the survey questionnaires:
Partner Institutes
Argentina Economic Development and Institutions Research Program Faculty of Economic SciencesCatholic University of Argentina, Buenos Aireshttp://www.uca.edu.ar
Australia CEDA - Committee for Economic Development of Australia, Melbournewww.ceda.com.au
Austria Federation of Austrian Industries, ViennaAustrian Institute of Economic Research, Viennahttp://www.iv-net.at
Belgium FEB - Federation of Enterprises in Belgium, Brusselswww.vbo-feb.be
Brazil Fundação Dom Cabralwww.fdc.org.br
Bulgaria Center for the Study of Democracy, Sofiawww.csd.bg
Canada Intifin Group, Torontowww.intifin.com/
Chile Universidad de Chile, Facultad de Economía y Negocioswww.fen.uchile.cl
China Hong Kong Hong Kong Trade Development Councilwww.hktdc.com
China Mainland China Institute for Development Planning, Tsinghua University
Dr. Alicia Caballero, DeanDr. Marcelo F. Resico, Senior EconomistMr. Facundo Ulivarri, Research Assistant
Professor the Hon. Stephen Martin, Chief Executive OfficerMs. Roxanne Punton, Director, External AffairsMs. Sarah-Jane Derby, Senior Economist
Dr. Christian Helmenstein, Chief EconomistMs. Helena ZwicklMr. Michael Oliver
Ms. Morgane Haid, Economist
Carlos Arruda, Professor and Director FDC Innovation and Entrepreneurship CenterAna Burcharth, Associate ProfessorFernanda Bedê, Research Assistant Mr. Ruslan Stefanov, Director, Economic ProgramMs. Daniela Mineva, Research Fellow, Economic ProgramMr. Martin Vladimirov, Analyst, Economic ProgramDr. Todor Galev, Senior Analyst Mr. Brett Berman, Managing Director
Dr. Enrique Manzur, Vice PresidentDr. Sergio Olavarrieta, Vice DeanMr. Pedro Hidalgo, Associate Professor Mr. Daniel Poon, Principal Economist (Global Research)Ms. Wenda Ma, Economist
Prof. Yongheng Yang, Associate Dean (School of Public Policy & Management)Prof. Youqiang Wang, Executive Director Dr. Fangtao Liu, Research FellowMs. Zi Ding, PhD CandidateMr. Pu Gong, PhD CandidateMr. Dong Guo, PhD Candidate

IMD World Talent Report 2016
116
Colombia National Planning Department, Bogotawww.dnp.gov.co
Croatia National Competitiveness Council, Zagreb
Czech Republic CERGE-EI, Praguewww.cerge-ei.cz
Denmark Confederation of Danish Industry (DI) http://di.dk/English/Pages/English.aspx
Estonia Estonian Institute of Economic Research, Tallinnwww.ki.ee
Enterprise Estonia, Tallinn
Finland ETLA, The Research Institute of the Finnish Economy, Helsinkiwww.etla.fi
France Invest in France Agency, Pariswww.invest-in-france.org
Greece Federation of Industries of Northern Greece, (FING), Thessaloniki
Foundation for Economic and Industrial Research (FEIR/IOBE), Athens
Hungary ICEG European Center, Budapestwww.icegec.org
National University of Public Service,Competitiveness and Fiscal Stability Research Group, Budapesthttp://en.uni-nke.hu/
Iceland Icelandic Chamber of Commerce, Reykjavikwww.chamber.is
India National Productivity Council, New Delhiwww.npcindia.gov.in
Indonesia Center for Strategic and International Studies, Jakartawww.csis.or.id
Andrés Trejos, Director of Enterprise DevelopmentSara Patricia Rivera, Research AnalystAdriana Quiñones, Project Manager Ms. Jadranka Gable, AdvisorMr. Kresimir Jurlin, PhD, Researcher Dr. Vilem SemerakDr. Lucia Štefánková
Mr. Allan Sorensen
Ms. Marje JosingMs. Ingrid NiklusMr. Koit Nilson, Researcher
Mr. Hanno Tomberg, Head of the Board
Mr. Petri Rouvinen, Research DirectorMr. Markku Kotilainen, Head of the Forecasting GroupMr. Ville Kaitila, Researcher
Ms. Sylvie Montout, Economist
Dr. Christos Georgiou, Director, Research and Documentation Department Mr. Constantinos Styliaras, Economist, Research and Documentation Department
Aggelos Tsakanikas, Assistant Professor National Technical University of Athens - Scientific Advisor
Ms. Renata Anna Jaksa, DirectorDr. Oliver Kovacs, Research Fellow
Prof. Dr. Magdolna Csath, Research professor
Mr. Björn Brynjulfur Björnsson
Dr. K.P. Sunny, Group Head (Economic Services), Project DirectorMr. Rajesh Sund, Deputy Director (Economic Services), Project Associate Dr. Yose Rizal Damuri, Head of Department of EconomicsMr. David Christian, Research Assistant

IMD World Talent Report 2016
117
Ireland IDA Ireland, Investment and Development Agency, Dublinwww.idaireland.com
Israel The Federation of Israeli Chambers of Commerce, Tel-Avivwww.chamber.org.il
Italy CONFINDUSTRIA, Economic Research Department, Rome
Japan Mitsubishi Research Institute, Inc., TokyoResearch Center for Policy and Economywww.mri.co.jp
Jordan Ministry of Planning and International CooperationJordan National Competitiveness Teamhttp://www.mop.gov.jo/
Kazakhstan Economic Research Institute, JSC of the Ministry of National Economy of the Republic of Kazakhstan, Astanawww.economy.kz
Korea Korea Institute for International Economic Policy (KIEP)http://www.kiep.go.kr/eng/
Latvia University of Latvia Centre for European and Transition Studies, LU CETS, Rigahttp://www.lu.lv/cets
Jean Monnet Centre of Excellence, Riga
Lithuania Enterprise Lithuania, Vilniuswww.enterpriselithuania.com
Luxembourg Chamber of Commerce of the Grand Duchy of Luxembourg www.cc.lu
Ms. Israela Many, Deputy Managing Director of Economy and TaxMr. Aviad Toub, Economist Dr. Luca Paolazzi, Director Research CentreDr. Pasquale Capretta, Senior Economist Mr. Hirotsugu Sakai, Research Director
Dr. Mukhallad OmariOrouba Al SabbaghMona Al KayedMais Khalaileh Mr. Aset Irgaliyev, Chairman of the Board Dr. Shakharbanu Zhakupova, Deputy Chairman of the Board Ms. Bahitful Khambar, Director of the Center for Strategic Development and Competitiveness ResearchMr. Arman Kalbayev, Deputy Director of the Center for Strategic Development and Competitiveness Research Mrs. Altyngul Utebayeva, Head of the Department for Competitiveness ResearchMrs. Madina Nurzhanova, Senior Expert of the Department for Competitiveness ResearchMrs. Ainur Seitova, Expert of the Department for Competitiveness ResearchMr. Daniyal Nugerbekov, Senior Expert of the Department for Competitiveness Research Dr. Heungchong Kim, Senior Research FellowMs. Nayoun Park, Researcher
Dr. Tatjana Muravska, DirectorMrs. Zane Zeibote
Dr. Tatjana Muravska, DirectorMrs. Zane Zeibote Mrs. Jurgita Butkeviciene, Export Department MangerMs. Rasa Narusaityte, Senior Project Manager
Mr. Marc Wagener, Member of the Managing Board Ms. Annabelle Dullin, Economist Ms. Lynn Zoenen, Economist
IMD World Talent Report 2016
118
Malaysia Malaysia Productivity Corporation (MPC), Petaling Jaya, Selangorwww.mpc.gov.my
Mexico Strategic Studies Center for Competitiveness, Saltillowww.ceec.edu.mx
Mongolia Economic Policy and Competitiveness Research Center, Ulaanbaatarwww.ecrc.mn
Netherlands Confederation of Netherlands Industry and Employers (VNO-NCW), The Haguewww.vno-ncw.nl
Norway Hovedorganisasjonen Virke - The Enterprise Federation of Norway
Peru CENTRUM Católica Graduate Business School, Limahttp://centrum.pucp.edu.pe
Philippines Asian Institute of ManagementRizalino S. Navarro Policy Center for Competitiveness, Makati Cityhttp://policy.aim.edu/
Poland Warsaw School of Economics, Warsaw
Portugal Porto Business School, University of Porto, Porto
Qatar Ministry of Development Planning and Statistics, Department of Environmental and Economic Development Planning. Dohawww.gsdp.gov.qa
Romania CIT-IRECSON Center of Technological Information, Bucharestwww.cit-irecson.ro
Russia Moscow Business Schoolhttp://mbschool.ru/
Dato’ Mohd Razali Hussain, Director General Dato’ Abdul Latif Abu Seman, Deputy Director GeneralDatin Zainon Bakar, Director Productivity & Competitiveness Development M.C. Carlos Maroto Cabrera, General Director M.S. Carlos Maroto Espinosa, Project & Relationship Manager
Mr.Boldbaatar Tserenpuntsag, FounderMr.Tsagaan Puntsag, FounderMs.Lakshmi Boojoo, Director GeneralMs.Odonchimeg Ikhbayar, Head of Research/Manager Mr.Ganbat Chuluun, Research Economist Ms.Tungalag Erdenebat, Research Economist Ms.Yesunchuluu Khuderchuluu, Research Economist Mr.Otgon-Erdene Khandaa, Research Economist Mr.Bilegsaikhan Tumursukh, Research Economist Mr. Paul van Kempen, Advisor Economic policy
Iman WinkelmanLinda Hauge
Mr. Fernando D’Alessio, General Director Mr. Luis Del Carpio, Studies Center of Competitiveness Director Jamil Paolo S. Francisco, PhD, Executive DirectorIvyrose S. Baysic, Assistant DirectorEmmanuel M. Garcia, EconomistJean Rebecca D. Labios, Program Coordinator
Dr. Bogdan A. Radomski, Associate Professor of FinanceDr. Marcin Nowakowski, Professor of International Business and Prorector Mr. Joao Dias da SilvaMr. Fernando Teixeira dos SantosMr. Ramon O’Callaghan Dr. Issa Ibrahim, Economic Expert (Project Manager)Ms. Hissa Al-Assiry, Economic Researcher
Mr. Bogdan Ciocanel, Ph.D, DirectorMrs. Ştefania Deák, PhD. Eng., Senior Researcher
Ms. Elina Pechonova

IMD World Talent Report 2016
119
Singapore Economics Division, Ministry of Trade and Industry, Singaporewww.mti.gov.
Singapore Business Federationwww.sbf.org.sg/
Slovak Republic The F.A Hayek Foundation, Bratislavawww.hayek.sk
Slovenia Institute for Economic Research, Ljubljana
University of Ljubljana, Faculty of Economics
South Africa Productivity SA, Midrandwww.productivitysa.co.za
Spain Spanish Confederation of Employers, Madridwww.ceoe.es
Taiwan National Development Council, Taipeiwww.ndc.gov.tw
Thailand Thailand Management Association (TMA), Bangkokwww.tma.or.th
Turkey Turkish Industrialists’ and Businessmen’s Association (TUSIAD), IstanbulEconomic Research Departmentwww.tusiad.us
United Arab Emirates Emirates Competitiveness Council, Dubai
Ukraine International Management Institute (MIM-Kyiv)www.mim.kiev.ua
Venezuela National Council to Investment Promotion (CONAPRI)www.conapri.org
Ms. Cheryl Kong, Assistant Executive Director
Mr. Martin Reguli, Senior AnalystMr. Martin Lindak, Analyst
Prof. Peter StanovnikMs. Sonja Uršič, M.A.
Ms. Kaja Rangus, PhDProf. Mateja DrnovšekProf. Aleš Vahčič Mr. Mothunye, Mothiba , CEO Mr. Sello Mosai, Executive Manager, Knowledge Management, Value Chain Competitiveness Department Ms. Juliet Mashabela, Economist, Value Chain Competitiveness Department Ms. Edita Pereira, Head of Economic Research UnitMs. Paloma Blanco, Economic Research Unit
Ms. Kao, Shienquey, Deputy Minister Ms. Wu, Ming Huei, Director of Economic Development Department Ms. Lee, Cho-Jin, Senior Economist Ms. Wanweera Rachdawong, Chief Executive Officer, TMAMs. Pornkanok Wipusanawan, Director, TMA Center for Competitiveness Zumrut Imamoglu, Chief Economist Elcin Tuzel, Junior Expert
Dr. Iryna Tykhomyrova, PresidentDr. Volodymyr Danko, ProfessorMs. Oksana Kukuruza, External Relations Director Mr. Eduardo Porcarelli, Executive DirectorMs. Litsay Guerrero A, Economic Affairs & Investor Services Manager

IMD, IMD INTERNATIONAL REAL WORLD. REAL LEARNING, IMD BUSINESS SCHOOL and IMD WORLD COMPETITIVENESS YEARBOOK are trademarks of IMD- International Institute for Management Development
IMD World Competitiveness Center
Chemin de Bellerive 23P.O. Box 915CH-1001 LausanneSwitzerland+41 21 618 02 [email protected]


