39
IAB/PwC mobile ad spend study Guy Phillipson – CEO, IAB Jon Mew - head of mobile, IAB Eva Berg Winters - PwC
| Date post: | 31-Dec-2015 |
| Category: |
Documents |
| Upload: | jana-bryant |
| View: | 26 times |
| Download: | 0 times |

IAB/PwC mobile ad spend studyGuy Phillipson – CEO, IAB
Jon Mew - head of mobile, IAB
Eva Berg Winters - PwC
In today’s presentation
1. Introduction
2. Methodology
3. Mobile in 2008
4. The figures
5. Outlook

1. Introduction

50% of the world’s population is on mobile

But how many in the UK are
actually using the mobile internet?

The UK economy is in reverse but
technology is in top gear
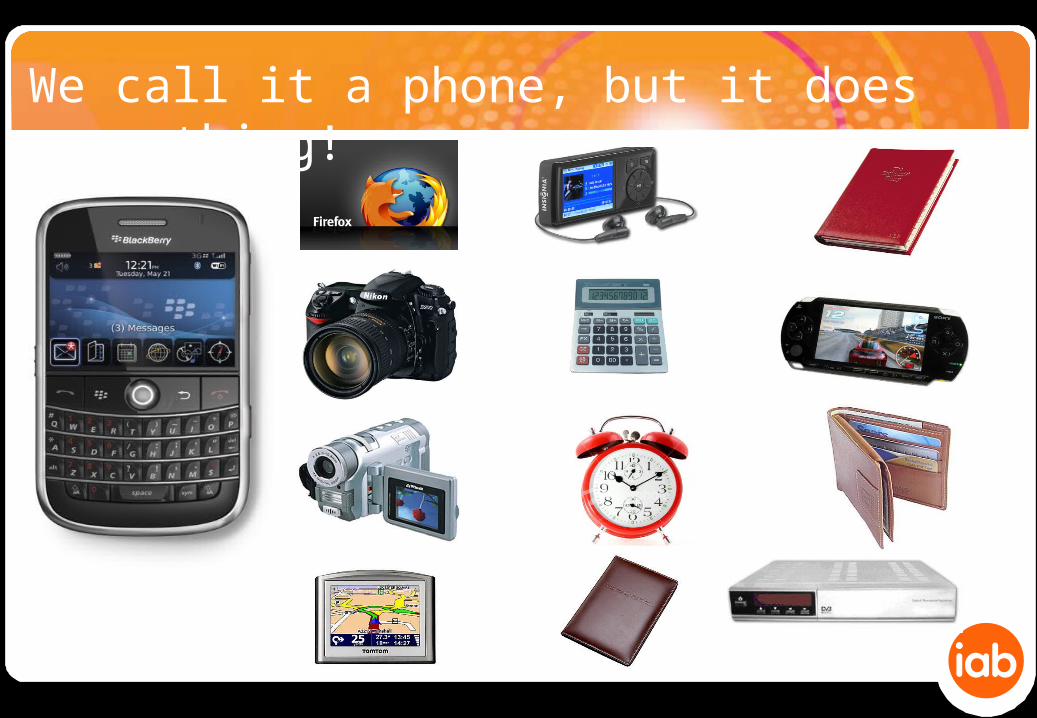
We call it a phone, but it does everything!

Marketers and media are obsessed!

IAB has successfully integrated mobile
Research
Workshops
PR + Comms Presentations
Guides
Events
Education
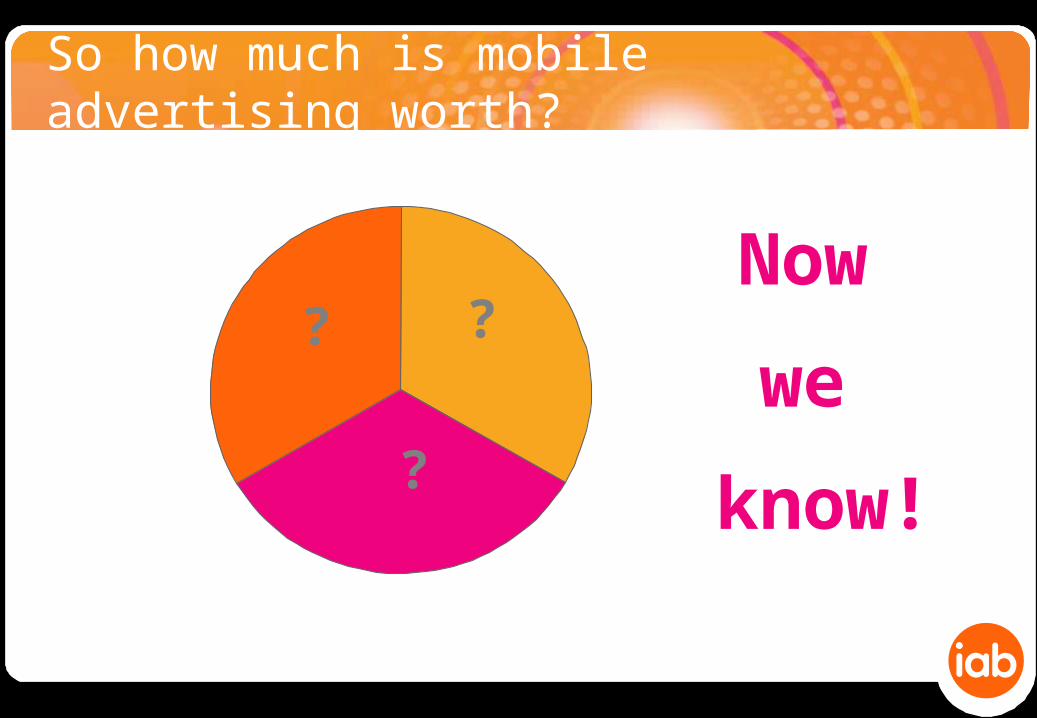
So how much is mobile advertising worth?
? ?
?
Now
we
know!

2. MethodologyEva Berg Winters - PwC
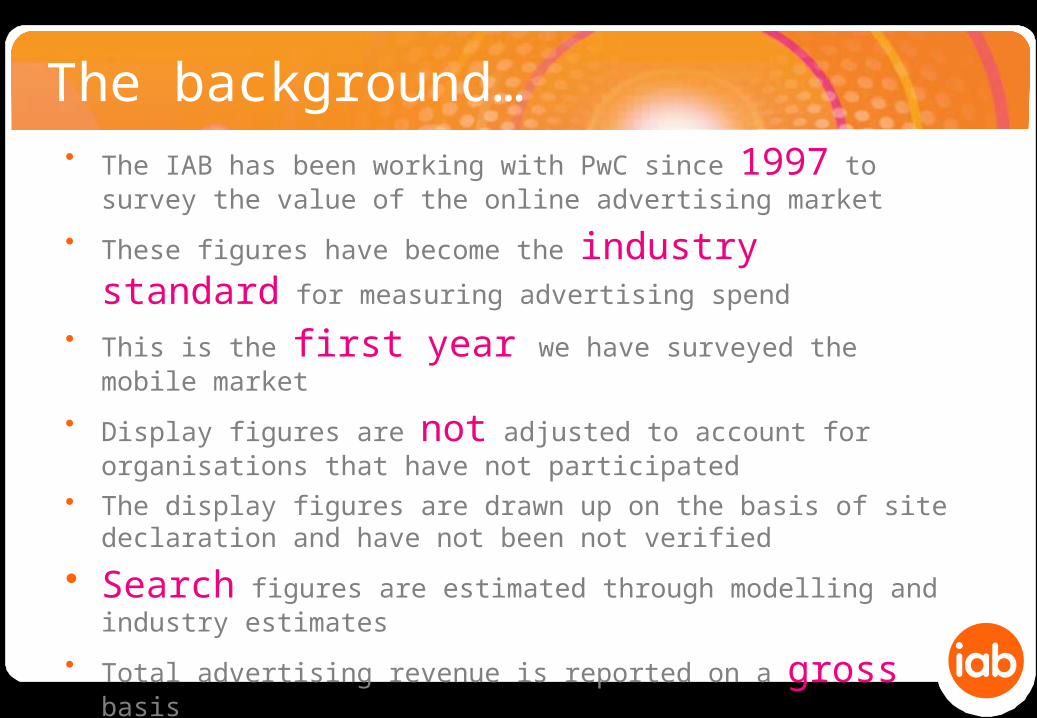
• The IAB has been working with PwC since 1997 to survey the value of the online advertising market
• These figures have become the industry standard for measuring advertising spend
• This is the first year we have surveyed the mobile market
• Display figures are not adjusted to account for organisations that have not participated
• The display figures are drawn up on the basis of site declaration and have not been not verified
• Search figures are estimated through modelling and industry estimates
• Total advertising revenue is reported on a gross basis
The background…
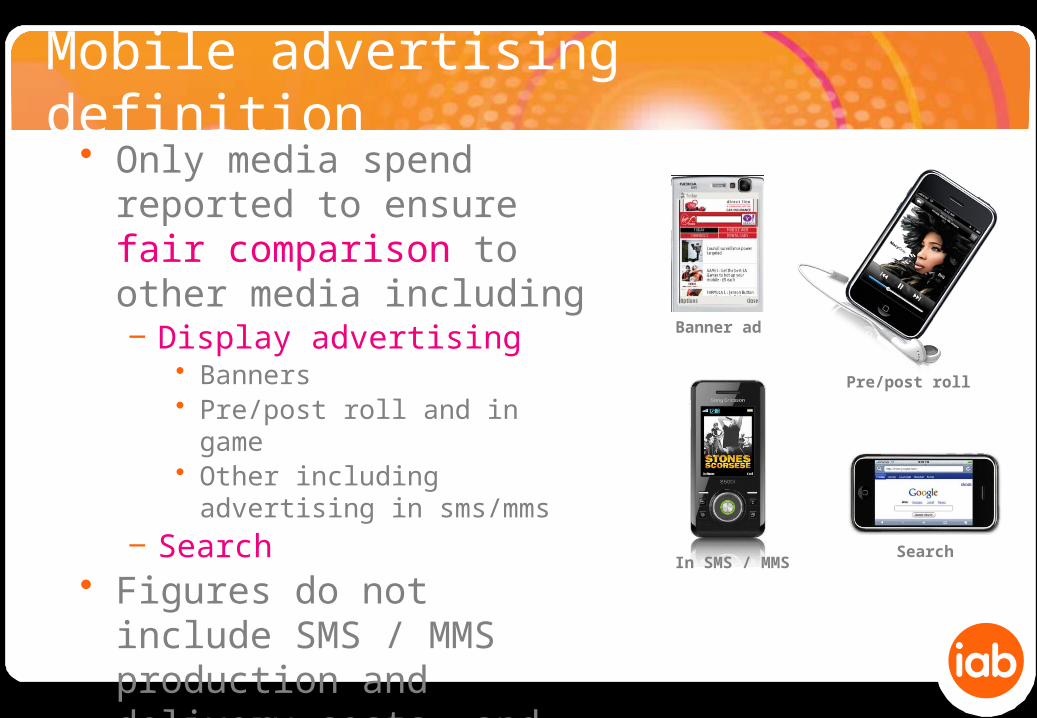
Mobile advertising definition• Only media spend reported
to ensure fair comparison to other media including‒ Display advertising
• Banners• Pre/post roll and in game• Other including advertising in
sms/mms
‒ Search• Figures do not include
SMS / MMS production and delivery costs, and other mobile marketing revenues
Banner ad
Pre/post roll
SearchIn SMS / MMS

Research participants

3. Mobile in 2008Jon Mew - head of mobile, IAB

Handsets
MobileContent
OperatorPricing
Measurement
Education
Proof
Big trends driving uptake
MobileAd
Uptake
Changing Consumer behaviour

Key trends – handsets improve
Source: Comscore 3 month average ending October 2008
Total 3G penetration
+36% yr on yr

Key trends - content
Source: Comscore 3 month average ending October 2008

total market unlimited data plan subscribers
4.6%
20.2%
% Accessing social networking sites daily
Key trends - pricing
Source: Comscore 3 month average Feb 2009
+ 109% growth in customers on
unlimited data plans in 2008
+ 340%

Mobile internet usage grows in 2008
6,000,000
7,000,000
8,000,000
9,000,000
10,000,000
11,000,000
12,000,000De
c-05
Jan-
06Fe
b-06
Mar
-06
Apr-
06M
ay-0
6Ju
n-06
Jul-0
6Au
g-06
Sep-
06O
ct-0
6N
ov-0
6De
c-06
Jan-
07Fe
b-07
Mar
-07
Apr-
07M
ay-0
7Ju
n-07
Jul-0
7Au
g-07
Sep-
07O
ct-0
7N
ov-0
7De
c-07
Jan-
08Fe
b-08
Mar
-08
Apr-
08M
ay-0
8Ju
n-08
Jul-0
8Au
g-08
Sep-
08O
ct-0
8N
ov-0
8De
c-08
Source: Comscore 3 month rolling average
+28% growth in 2008

4.The figures

Total mobile advertising revenue 2008
£28.6m
Source: IAB / PwC mobile display ad spend survey 2008; search spend figure derived from modelling and industry estimates
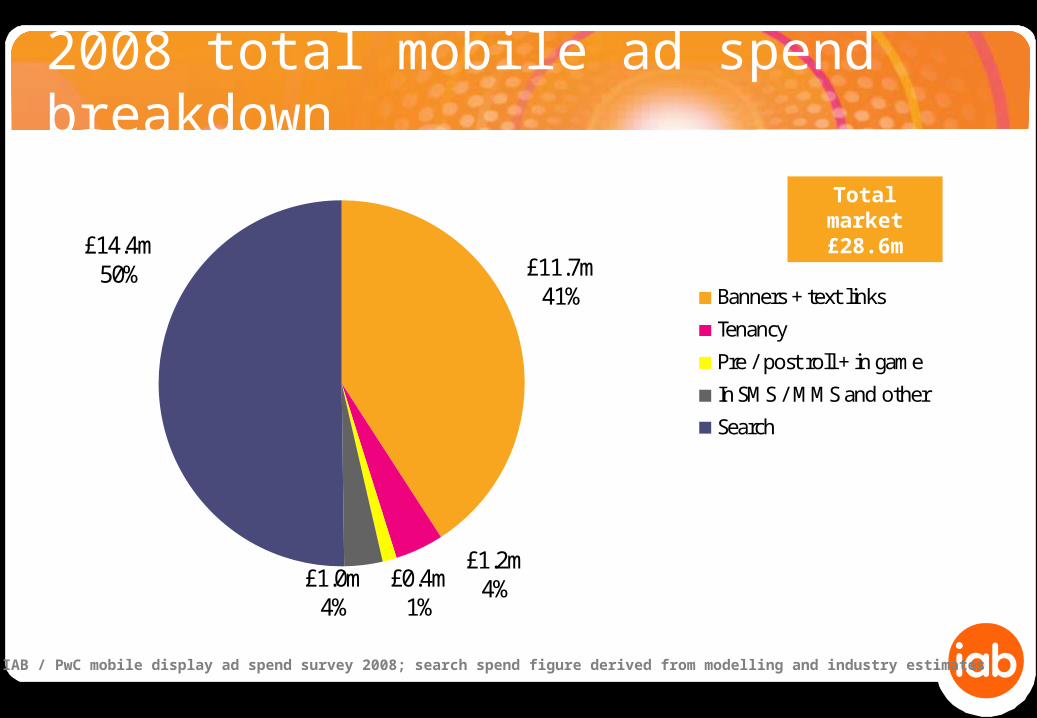
2008 total mobile ad spend breakdown
£11.7m41%
£1.2m4%£0.4m
1%£1.0m
4%
£14.4m50%
Banners + text links
Tenancy
Pre / post roll + in game
In SMS / MMS and other
Search
Total market £28.6m
Source: IAB / PwC mobile display ad spend survey 2008; search spend figure derived from modelling and industry estimates

2008 total display breakdown
£11.7m82%
£1.2m9%
£0.4m2%
£1.0m7%
Banners + text links
Tenancy
Pre / post roll + in game
In SMS / MMS, classified and other
Total market £14.2m
Source: IAB / PwC mobile display ad spend survey 2008; search spend figure derived from modelling and industry estimates
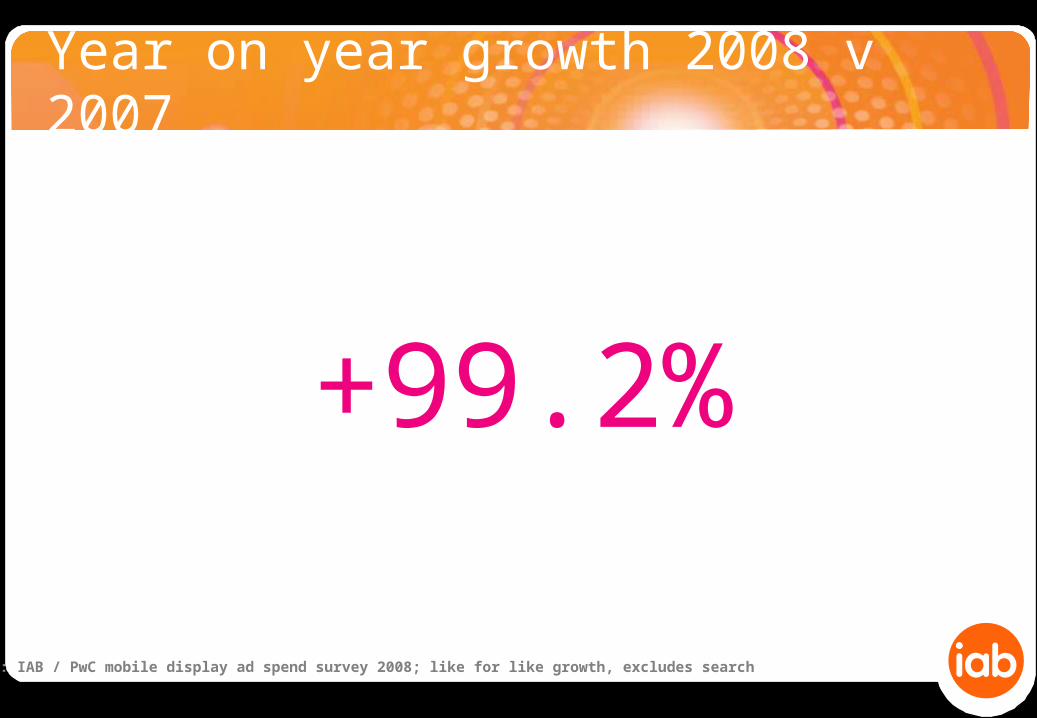
Year on year growth 2008 v 2007
+99.2%
Source: IAB / PwC mobile display ad spend survey 2008; like for like growth, excludes search

Consistent growth through 2008
+ 15.4%
+ 9.4%
+ 17.5%
Quarterly total display revenue 2008
Source: IAB / PwC mobile display ad spend survey 2008; search spend figure derived from modelling and industry estimates

H1 2008 v H2 2008
+27.4% growth from H1 to H2
Source: IAB / PwC mobile display ad spend 2008 – like for like growth, excludes search

Mobile shows similar trend to online
6.37.4 7.1
8.3
9.810.4 10.3
11.8
13.4
14.614
15.816.8
17.817.2
18.1
0
5
10
15
20
Q1 Q2 Q3 Q4 Q1 Q2 Q3 Q4 Q1 Q2 Q3 Q4 Q1 Q2 Q3 Q40
20
40
60
80
100
120
140
160
180
Onl
ine
ad s
pend
£ m
illio
ns
Source: PricewaterhouseCoopers / Internet Advertising Bureau / WARC
Onl
ine
audi
ence
(m
illio
ns)
£51m
£153.1m
£165.7m
1998 1999 2000 2001
9.4m* £28.6m
*Source: Comscore 12 month average 2008
£19.4m
Mobile audience
and spend 2008

5.Outlook

Carat/Aegis -7%
Group M -11%
Enders -13%
Average forecast -10%
Current forecasts for total 2009 advertising

In the toughest year for advertising,
mobile is forecast to grow
while traditional media declines

Outlook – continued growth expected
x

Initially we will run the study
annually and publish 2009 figures
in early 2010

Key headlines
• Total market beats expectations at £28.6m
• Impressive growth year on year at 99.2%
• Consistent growth throughout year despite market
conditions
• Close parallels to early online figures
• Hard to forecast accurately but we expect growth in
2009
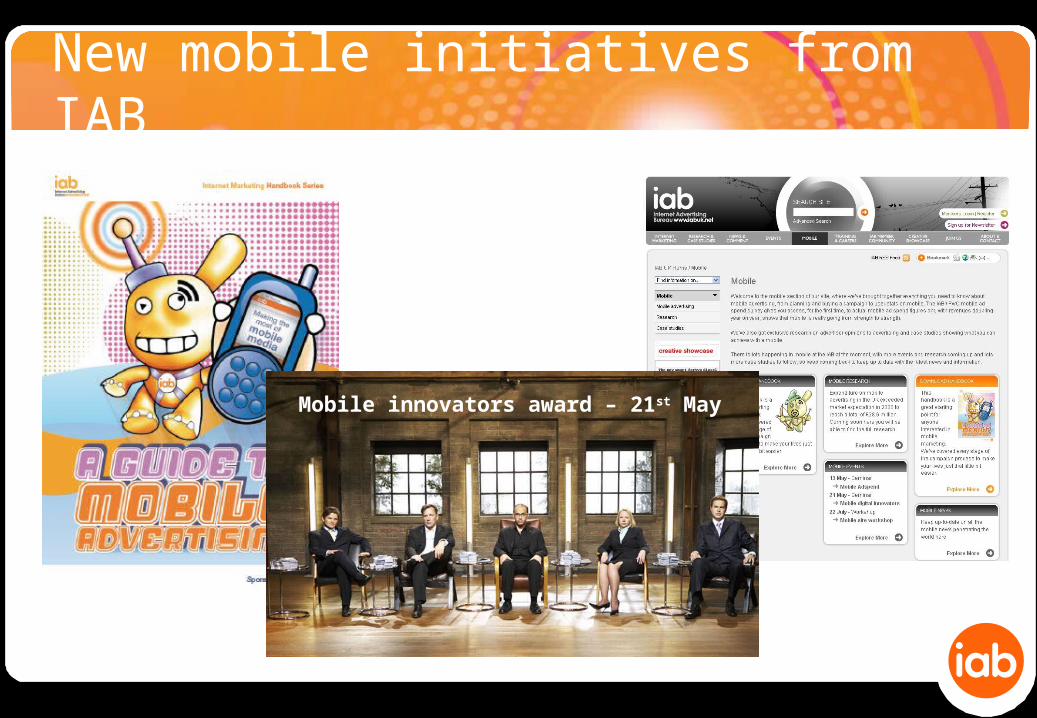
New mobile initiatives from IAB
Mobile innovators award – 21st May

ThanksFor more information email [email protected]

Questions?

ThanksFor more information email [email protected]

Disclaimer
The IAB retained PricewaterhouseCoopers LLP (the UK firm) (‘PwC’) to compile the mobile adspend figures collected by the IAB from its members in January through April 2009 and to deliver to the IAB the topline figures collated from this review; PwC has not verified the information which it received from the IAB, and provides no opinion or other form of assurance with respect to such information.
This publication has been prepared for general guidance on matters of interest only, and does not constitute professional advice. You should not act upon the information contained in this publication without obtaining specific professional advice. No representation or warranty (express or implied) is given as to the accuracy or completeness of the information contained in this publication, and, to the extent permitted by law, neither the Interactive Advertising Bureau UK (the ‘IAB’) nor any of the IAB’s
contributors/subcontractors accept or assume any liability, responsibility or duty of care for any consequences of you or anyone else acting, or refraining to act, in reliance on the information
contained in this publication or for any decision based on it.


