+ All Categories
Home > Documents > IADCHernandez2001

IADCHernandez2001

Date post: 13-Aug-2015
Category:
Upload: ana-maria-hernandez
View: 88 times
Download: 0 times
Share this document with a friend
Popular Tags:
25
Production Geology Approach as a tool to accelerate the implementation of advanced drilling technologies: Intelligent Well Evaluation Methodology Ana Maria Hernandez IADC World Drilling conference, Madrid, June, 2002
Transcript

Production Geology Approach as a tool to accelerate

the implementation of advanced drilling technologies:Intelligent Well Evaluation Methodology

Ana Maria Hernandez

IADC World Drilling conference, Madrid, June, 2002

Production Geology Approach

Knowledge Gaps:

Time&

Money

Knowledge Management

Geology

Production

AdvancedDrilling

& Completion

Technologies

Intelligent Well Evaluation Methodology

Technological Background

Initial screening criteria: production geology scenarios

Intelligent Well Systems: Geological Constraints Down hole Sensors Isolated Control flow Zones Surface Systems

Intelligent well technologies and new trends in Economics

Production Geology Approach: Case Study Multilateral technology

Why Intelligent Wells?Measurement - Control - Monitoring

Applications: To monitor gas \ water

coning problems in oil rims

To measure, control and monitor injection & production fluids in complex reservoirs

Reservoir drainage improvement

Remote control and monitoring in hostile environments

To avoid well interventions

>>>>>

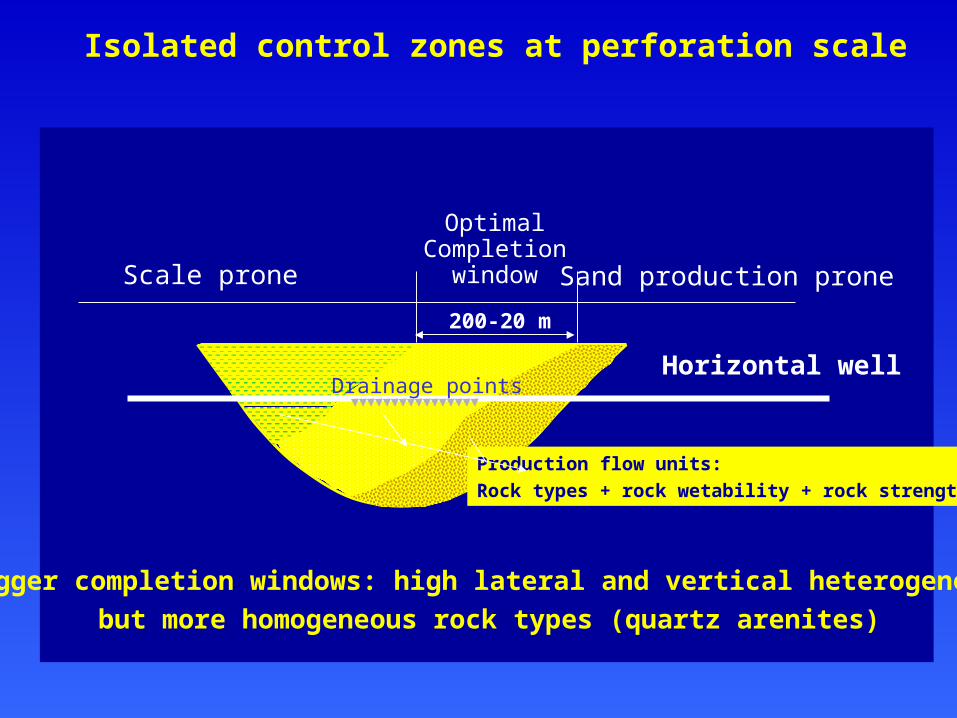
Isolate Control Zones

Down hole

Sensors

Surface

SystemsTelemetry

Well

Where to apply Intelligent well technology?

Initial screening criteria: reservoir candidates

Oil rims in heterogeneous reservoirs

IOR projects in complex reservoirs

Improvement of drainage strategies in reservoirs with technology maturity

Offshore projects with economic potential

Areas under environmental regulations

Intelligent Well technology vs. Reservoir types

Critical zones: partially connected sands in the middle part of the reservoir

ME-J1U/L

ME-S2,3

ME-M2

ME-T4,5<

ME-L

ME-M1

ME-S1

ME-JIU

ME-CME-J1U

ME-C

ME-S1

Type 1:Structural/faulted reservoirs with high

lateral & vertical heterogeneity Type 2: Heterogeneous reservoir associated

with salt domes

Type 3: Stratigraphic traps with

internal compartmentalization

Type 4: Bypassed oil zones in

stratigraphic reservoirs

Reservoir scale

Oil rims and complex IOR in mature heterogeneous reservoirs

GOC

WOC

Irregular

GOC

&

WOC

Water

coning

Water / Gas

Coning

Gas

Coning

Bypassed

Oil

Lower reservoir

Change in petrophysical

properties

Change in reservoir

architecture

Upper reservoir

Critical Zone: partially connected sands in the

middle part of the reservoir

More control and monitoring is needed to avoid production problems

Critical zone

Km

m

Borehole seismic::

Range ~ 2-100 m

High resolution

Geometry limitation

4C/4D seismic:•3D geometry•Reservoir coverage•Limited resolution

Resistivity sensors:•Range 0-10 m•Permanent monitoring

Data Gap vs. Technology

Source: The leading edge (april, may 1999)

Borehole seismic systems

More borehole seismic configurations are needed to

improve well to well visualization

Km-m

+/- 2-200 m

0-10 m

The dimensional Problem

Illustration by BP

Project EconomicsFlow Cash, NPV

ValvesChokesControl ZonesSensors

Identification of variables that produce economical impact

Variable 1

Variable 2

Variable n

Search of the probability distribution to model each variable

Determination of variables with high impact

Sensitivity analysis of each variable

Run the Simulation

Analysis of results

How to determine the impact of geological variables at inter-well scale? Decision support tool for technology assessment

NPV

1141.17

45

5.6

11.57

100.00

40.5

11.23

6.16

1895.83

16

14.0

8.52

150.00

43.5

9.55

13.84

-200.00 0.00 200.00 400.00 600.00

STOIIP

Wells to drill

Plateau rate

Discount factor

Facility size

Recovery

Well cost

Well rate

Geological variables at inter- well scale

Target Forecast: Reservoir variability

Reservoir continuity (km-m) .44

Vertical connectivity (m) .50

Kv/kh ratio .49

Flow units (m) .75

-1 -0.5 0 0.5 1

Measured by Rank Correlation

Sensitivity Chart

Flow unit is the geological variable

with more impact related with

Intelligent well technology

Reservoir architecture vs.

well architecture

+200 150 100 50 25 15 5 mReservoir Candidates

North Sea

Gulf of Mexico

Indonesia

West Africa

Venezuela

Reservoir flow units dimensions

The design of isolated control zones should take into account

the dimensions of the reservoir flow units to optimize production

and avoid production problems

Sand production proneScale prone

OptimalCompletion

window

200-20 m

Production flow units:

Rock types + rock wetability + rock strength

Drainage pointsHorizontal well

Isolated control zones at perforation scale

Bigger completion windows: high lateral and vertical heterogeneity

but more homogeneous rock types (quartz arenites)

Isolated control zones 200-20 m

Isolated control zones +/- 200 m

A.- Horizontal well

B.- Multi branch well

Isolated control zones: best geological options in

reservoirs with bigger completion windows

PRODUCTION BEHAVIOR HIGH ANGLE vs. CONVENTIONAL WELLS

0

500

1000

1500

2000

2500

3000

0 2000 4000 6000 8000 10000 12000 14000 16000 18000 20000

OIL RATE (BOPD)

WE

LL

HE

AD

PR

ES

SU

RE

(P

SI)

FUL-63 FUL-68 FUL-70 FUL-75

FUL-56 FUL-59 FUL-61 FUL-651/2"

1"

3/4"

1 1/2"

1 1/4"

C.- High angle wells perforated following the completion windows

Example El Furrial Field - VenezuelaEl Furrial Field - Venezuela

High

Angle

Wells

production

Typical wells

SPE 56430

Proposed Isolated control zones

Isolated control zones: North Sea Case

SensitiveScale

intervals

Sensitive Sand Production intervals

Scale proneCompletion

window Sand production prone

20-5 m

Horizontal well

• Red intervals will produce sand/scale since the beginning if they are perforated• If yellow intervals are perforated

any change in the flow regime will activate the production problems

Reservoirs with high lateral & vertical heterogeneity

and high internal heterogeneity (rock type: litarenites)

A.- Low/high angle wells

Isolated control zones + 200 m

Proposed Isolated control zones: North Sea Case

B.- Optimal completion windows in small-channel zones:

perforation optimization

Horizontal well

Completion window

How to determine the impact of geological variables at perforation scale?

ProducerSurprise

handling

InjectorWater

Breakout

Decision variables

Assumptions Variability

Uncertainty

Forecast

InjectorInjection pointsValves/chokesZonal flow sensors

ProducerDrainage pointValves/chokes producerPermanent resistivity sensors

Interwell dataDistance between wellsCompleted intervalPerforationrock typesrock wettabilityrock strenghtpore pressurebarrierslayersSurprise handlingWater Breakout

Monte Carlo Simulation

Target Forecast: Surprise handling

rock strength .54

rock types .52

rock wet ability .49

layers .05

internal barriers .01

-1 -0.5 0 0.5 1Measured by Rank Correlation

Sensitivity Chart

Drainage

points

Injection

points

Proposed Rock type Analysis

Reservoir Pressure

BottomHolePressure

Rock type window ?

Oriented rock type perforation

RockType

Rock Strength

Rock type vs. Rock Strength

Rock type window

IW project Brainstorming

Identify Technical Issues related with IW

Identify Economical Issues related with IW

Identify IW PotentialScenarios

Initial Options Screening

IW production Optimization Solutions

Prospective IW economic scenarios

Identify Critical Decision Issues

New trends in petroleum economics

Discounted Cash Flow Analysis

IW Case history selection

IW Reservoir Modeling

Intelligent well projects: screening criteria

- 6

- 4

- 2

0

2

4

6

1 2 3 4 5 6TIME [MONTHS]

CA

SH

F

LO

W [

MM

$]

Production

Initial Investment

Workover Costs

NPV | BASE CASE

CONVENTIONAL WELL MULT ILATERAL WELL

NPV |MLT<

Cash flow analysis

Life cycle cost analysis(2)

Intelligent wells goal is to capture everyday events

in the reservoir. Can we analyze them using

conventional petroleum economics?

Forecasting & risk analysis (1)

Economic threshold: Decision Tree (3)

(1) SPE 37932,63528; (2)SPE 35315;(3)63201

Advanced decision- making technical/economical tools to justify new technology

Technology A

Technology B

Technology C

High Risk0

5

10

15

20

25

30

35

40

scen

a.

1

scen

a.

2

scen

a.

3

var. 1

var. 2

var. 3

Technical/ Economical

ranking matrix

Reservoir Scenario 3Scenario 2

Scenario 1

Variables that impact

economically the reservoir

Multi-objective Decision Analysis (3)

Dynamic Complexity

Dynamic Complexity (1)

Multi-prospects Evaluation (2)

(1) SPE 52954;(2) SPE 69614; (3)SPE 68579

ActivityLevel

MutualHelp

Coalescence

IndividualEffort

Potential• Multidisciplinary

Team• Compilation of Information

Information Analysis• Business Plan • Reservoir Review • Technology Maturity• Opportunity identification

Unification ofEfforts

Maturity3 Technical Forum

• Drilling/completion• Geomechanics• Case Studies• Potential proposals

Results

Actions

Dispersion

Year 2000

Domestic development• Technical Proposals• Operational know-how

TechnologyKnowledge

How to accelerate the implementation of advance drilling technologies?

Knowledge management. Example MTL Technology; PDVSA, Venezuela

Production Geology Approach

Production Geology “ THE FRAME”Combination of:• Structural Styles• Reservoir Types• Rock types• Flow Units

•.... a techno-economic challenge

Technology- a solutionThe key: Right Technology in the right frame using

the optimal oil recovery process

Acceleration of technology implementation

Reduction of cost/ increase of value

Multidisciplinary approach: identification of best practices

Uncertainties reduction, production optimisation

MTLFailure

MTLsuccess

MTL Failure

MTLsuccess

Multi laterals 1995-1998

Multi laterals 2000 +

1998MTL technology

Abandoned

1999MTL

Corporative Effort

Evolution of the Multilateral Technology in Venezuela; PDVSA, Venezuela

5 Wells

20 Wells