+ All Categories
Home > Documents > IAEA EMRAS Biota Working Group

IAEA EMRAS Biota Working Group

Date post: 04-Apr-2022
Category:
Upload: others
View: 2 times
Download: 0 times
Share this document with a friend
28
IAEA EMRAS Biota Working IAEA EMRAS Biota Working Group Group Regular participants: Belgium - SCK·CEN; Canada – AECL; Czech Republic - SÚJB; France – IRSN; Japan – NIRS; Lithuania – IoP; Netherlands – NRG; Norway – NRPA; Russia – Spa- Typhoon; UK – CEH, EA, WSC; Ukraine – IRL; USA - ANL
Transcript

IAEA EMRAS Biota Working IAEA EMRAS Biota Working GroupGroup

Regular participants:Belgium - SCK·CEN; Canada – AECL; Czech Republic - SÚJB; France – IRSN; Japan – NIRS; Lithuania – IoP; Netherlands –NRG; Norway – NRPA; Russia – Spa-Typhoon; UK – CEH, EA, WSC; Ukraine –IRL; USA - ANL

Models and approaches participatingModels and approaches participating• RESRAD-BIOTA (USA) • Environment Agency ‘R&D 128’ (England & Wales)• ERICA (& FASSET) (European) • Atomic Energy Canada Limited approach • LIETDOS-BIOTA (Lithuania)• DosDiMEco (Belgium)• D-Max (UK)• EDEN-CENTEAUR (France)• LAKE(ECO) (Netherlands)• ECOMOD (Russia)• FASTer (European)• EPIC-DOSES3D (European) • SÚJB approach (Czech Republic)

ActivitiesActivities

• Two exercises to compare dosimetry and transfer components of models.

• Two case study scenarios (predictions v’s data): Perch Lake (Canada) and terrestrial ecosystems within Chernobyl 30 km exclusion zone.

Exercise 1 Exercise 1 -- dosimetrydosimetry comparisoncomparison• Assume 1 Bq per unit media or organism •Estimate unweighted internal and external dose rates for Cs-137, Am-241, Co-60, U-238, C-14, Sr-90, H-3 • Organisms selected from list of proposed ICRP Reference Animals & Plants• Equates to comparison of dose conversion coefficients (DCCs) used within models where:

)()/()/(

mediaororganismbodywholekgBqionconcentratActivityhGyratedoseabsorbedunweightedDCC

−=

µ

Internal dose ratesInternal dose rates• Internal dose estimates generally all within 20

% of mean (of predictions)– exception being for U-238: two approaches

including U-234 as daughter (resulting in 2x higher DCC)

External dose ratesExternal dose rates• Considerably more variability between models

– especially for β- emitters

e.g. Duck on soil surface e.g. Duck on soil surface predictions for Srpredictions for Sr--9090

1.E-11

1.E-10

1.E-09

1.E-08

1.E-07

1.E-06

1.E-05

1.E-04

1.E-03

AECL EA EDEN ERICA LIETDOS RESRAD SCK SUJB

DC

C

External dose ratesExternal dose rates• More variable between models – especially for β-

emitters– Especially H-3 & C-14 (e.g. external DCC for duck on

soil for H-3 ranged 0 to 5E-11)• Media assumptions (density and distribution of

contamination) can be seen to result in some variation

• Differences in approaches that do not matter:– use of specific geometries v’s nearest default– number of emissions assumed

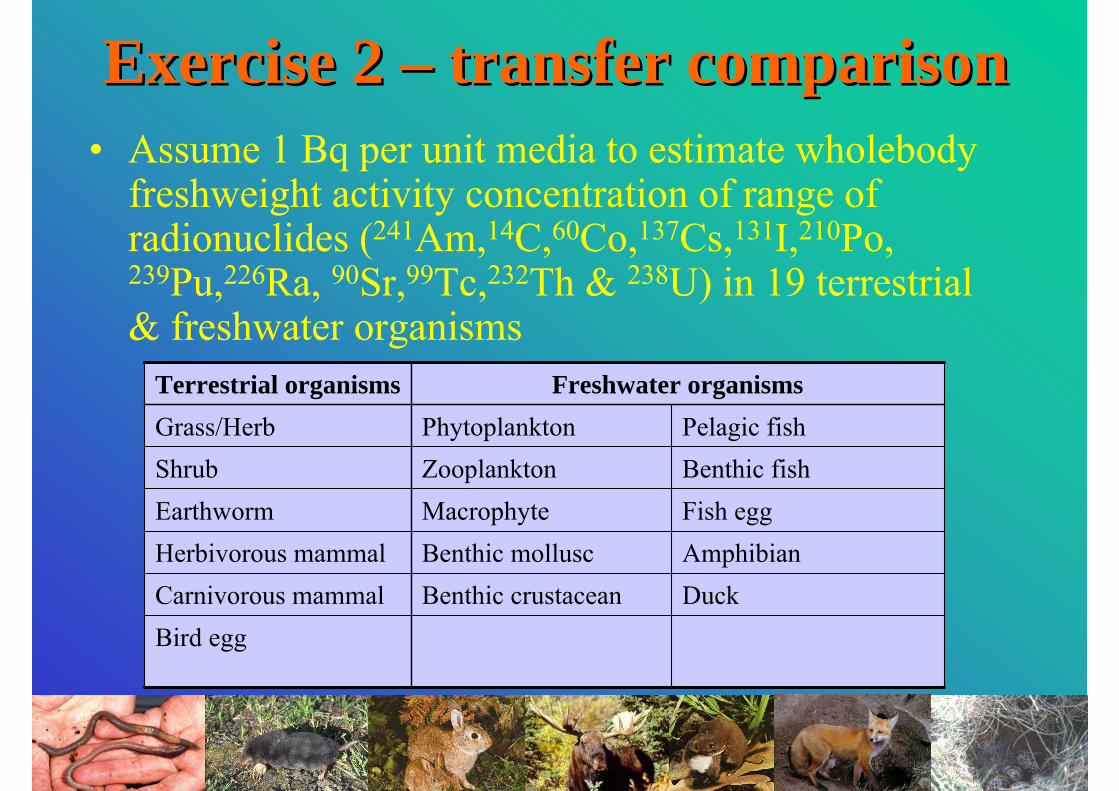
Exercise 2 Exercise 2 –– transfer comparisontransfer comparison• Assume 1 Bq per unit media to estimate wholebody

freshweight activity concentration of range of radionuclides (241Am,14C,60Co,137Cs,131I,210Po, 239Pu,226Ra, 90Sr,99Tc,232Th & 238U) in 19 terrestrial & freshwater organisms

Bird eggDuckBenthic crustaceanCarnivorous mammalAmphibianBenthic molluscHerbivorous mammalFish eggMacrophyteEarthwormBenthic fishZooplanktonShrubPelagic fishPhytoplanktonGrass/Herb

Freshwater organismsTerrestrial organisms

ApproachesApproaches• Many use concentration ratios (CR):

• But others using foodchain models, often incorporating allometric relationships for dietary intake and radionuclide biological half-lives– Y=a·(liveweight)b

• Some have ‘guidance’ derived values in the absence of defaults

)dry weight kg (Bq soilin ion concentratActivity ht)fresh weig kg (Bqbody wholebiotain ion concentratActivity CR 1-

-1

=

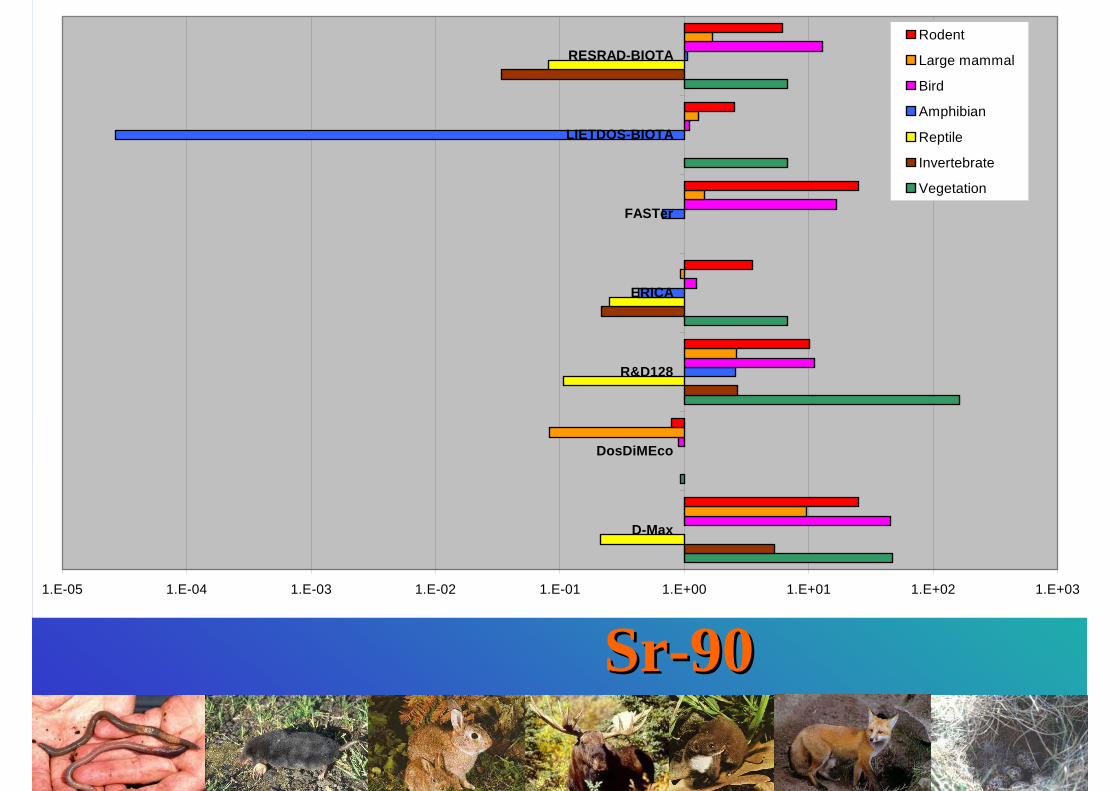
Predicted activity concentrationsPredicted activity concentrations• Considerable variation between predictions (3-

orders of magnitude being common)

Pu-239

Predicted activity concentrationsPredicted activity concentrations• Some variation can be understood, e.g.:

– Missing value guidance approach often give comparatively high estimates (often for little studied organisms)

– National (and single site) data– Some approaches (used to) include reindeer data in

derivation of CRs leading to high predictions for mammals (especially Po-210)

• Tc-99 predictions had least variation– Very few data and all using similar approach

Perch Lake Case StudyPerch Lake Case Study

• H-3, Cs-137, Co-60, Sr-90 data for wide range of freshwater biota

PerchLake

Ottawa River

Built-up Area

Chalk River Laboratories

Waste Management Area

Legend

Lake / River

Road

CRL Boundary

Stream0 1 2

kilometres

Sudbury

Ottawa

TorontoLake Ontario

Lake Erie

Lake Huron

CRL

CesiumCesium--137 in Aquatic 137 in Aquatic MacrophytesMacrophytes

Model

AECL

ERICA (CEH)

EA R&D128

CASTEAURDmax

ECOMODLakeCo

RESRAD-BIOTA (UK)Mod

eled

-to-M

easu

red

137 C

s C

once

ntra

tion

0.000001

0.00001

0.0001

0.001

0.01

0.1

1

10

100

Emergent MacrophytesFree-floating MacrophytesFloat-leafed MacrophytesSubmergent MacrophytesMinimum Measured (free-floating)Maximum Measured (free-floating)Minimum Measured (floating-leafed)Maximum Measured (free-floating)

Minimum Measured (submergent)Maximum Measured (submergent)

StrontiumStrontium--90 in Freshwater Fishes90 in Freshwater Fishes

Model

AECL

ERICA (CEH)

EA R&D128

ERICA (NRPA)Dmax

ECOMODLakeCo

RESRAD-BIOTA (UK)

RESRAD-BIOTA (NRPA)Mod

eled

-to-M

easu

red

90Sr

Con

cent

ratio

n

0.001

0.01

0.1

1

10

Brown BullheadCyprinidsPumpkinseedsMinimum Measured (bullhead)Maximum Measured (bullhead)Minimum Measured (cyprinids)Maximum Measured (cyprinids)

Minimum Measured (pumpkinseed)Maximum Measured (pumpkinseed)

CobaltCobalt--60 in Freshwater Mammals60 in Freshwater Mammals

Model

ERICA (CEH)

EA R&D128

ERICA (NRPA)Dmax

RESRAD-BIOTA (UK)

RESRAD-BIOTA (NRPA)Mod

eled

-to-M

easu

red

60C

o C

once

ntra

tion

0.1

1

10

100

1000

10000

100000Star-nosed MoleAmerican Water Shrew

Chernobyl Case StudyChernobyl Case Study•Available data for Cs-137, Sr-90 Am-241, Pu-isotopes data - bias towards mammals (some birds, amphibians, invertebrate, plant, reptile). •TLD measurements for small mammals.

Species Common name Number of predictions

(English) 90Sr 137Cs Pu 241Am Dose rates TLD

Aegithalos caudatus Long-tailed tit - - 1 - 1 -

Apodemus flavicollis Yellow necked mouse 5 5 1 - 2 2

Apodemus sylvaticus Wood mouse 1 1 - - 1 -

Canis lupus Wolf 2 2 - - 1 -

Capreolus capreolus Roe deer 7 7 - - 1 -

Clethrionomys glareolus Bank vole 7 6 2 1 2 2

Erithacus rubecula Robin 2 2 - - 1 -

Hirundo rustica Barn swallow 1 1 - - 1 -

Lactera agilis Sand Lizard 1 1 - - 1 -

Microtus arvalis Common vole 2 2 - - 1 -

Microtus oeconomus Root vole 2 3 - - 1 1

Microtus spp. Vole species 1 1 1 - 1 1

Parus major Great tit 2 2 1 - 1 -

Perdix perdix Partridge - 2 - - 1 -

Rana esculenta Edible frog - 2 - - 1 -

Rana terrestris Brown frog 2 4 - - 1 -

Sicista betulina Northern birch mouse 1 1 - - 1 -

Sorex araneus Common shrew 5 5 - - 1 -

Sturnus vulgaris Starling 1 1 - - 1 -

Sus scofa Wild boar 9 9 - - 1 -

Beetles 1 1 - - 1 -

Grassy vegetation 4 4 - - 1 -

1.E-03

1.E-02

1.E-01

1.E+00

1.E+01

1.E+02

1.E+03

Parus major Aegithaloscaudatus

Microtus spp. Clethrionomysglareolus

Apodemusflavicollis

Clethrionomysglareolus

Clethrionomysglareolus

(Am-241)

DataLIETDOS-BIOTARESRAD-BIOTAEA R&D128ERICADoSDiMEcoFASTerD-Max

PuPu and Amand Am--241 results241 results

1.E-03 1.E-02 1.E-01 1.E+00 1.E+01 1.E+02 1.E+03

D-Max

DosDiMEco

R&D128

ERICA

FASTer

LIETDOS-BIOTA

RESRAD-BIOTARodent

Large mammal

Bird

Amphibian

Reptile

Invertebrate

Vegetation

CsCs--137137

1.E-05 1.E-04 1.E-03 1.E-02 1.E-01 1.E+00 1.E+01 1.E+02 1.E+03

D-Max

DosDiMEco

R&D128

ERICA

FASTer

LIETDOS-BIOTA

RESRAD-BIOTARodent

Large mammal

Bird

Amphibian

Reptile

Invertebrate

Vegetation

SrSr--9090

RESRADR&D128

ERICALIETDOS

DosDIMEco

Internal

Total0

100

200

300

400

500

600

uGy/

h

AbsordedAbsorded dose rate dose rate --MicrotusMicrotus arvalisarvalis

Vole species (CT32a)

0.0E+00

5.0E-04

1.0E-03

1.5E-03

2.0E-03

2.5E-03

3.0E-03

3.5E-03

4.0E-03

4.5E-03

DoSDiMEco EA R&D 128 ERICA FASTer-EPIC Doses3D LIETDOS-BIOTA RESRAD-BIOTA

Am ExternalPu ExternalSr ExternalCs ExternalAm internalPu InternalSr InternalCs Internal

Contributions to total dose rateContributions to total dose rate

Great tit (CT36a)

0.0E+00

1.0E-03

2.0E-03

3.0E-03

4.0E-03

5.0E-03

6.0E-03

7.0E-03

8.0E-03

9.0E-03

1.0E-02

DoSDiMEco EA R&D 128 ERICA FASTer RESRAD-BIOTA

Am ExternalPu ExternalSr ExternalCs ExternalAm internalPu InternalSr InternalCs Internal

Contributions to total dose rateContributions to total dose rate

1.E-01

1.E+00

1.E+01

1.E+02

Microtus spp. Clethrionomysglareolus

Apodemusflavicollis

Clethrionomysglareolus

Apodemusflavicollis

Microtusoeconomus

µGy

h-1MeanLIETDOS-BIOTARESRAD-BIOTAEA R&D128ERICADoSDiMEcoFASTer-EPIC Doses3DD-Max

SummarySummary• Dosimetry – largely comparable

– External dose minor contributor (occupancy factor assumptions have little impact)

• Transfer – highly variable– Concentration ratio and foodchain model

approaches – broadly comparable

FutureFuture• Collaboration with ICRP C4 (+ PROTECT

project)– Discussion began yesterday

• Biota ‘TRS364’ Transfer sub-group• Effects data sub-group – quality &

interpretation (population modelling?)• Scenarios – focused to consider situations

regulators/industry having to consider– Waste repository/new build NPP’s/TeNORM

http://http://www.ceh.ac.ukwww.ceh.ac.uk/protect//protect/


Recommended