124
IAEA HUMAN HEALTH SERIES No. 23 Nuclear Cardiology: Guidance and Recommendations for Implementation in Developing Countries IAEA
INTERNATIONAL ATOMIC ENERGY AGENCYVIENNA
ISBN 978–92–0–131710–0ISSN 2075-3772
Coronary artery disease is the leading cause of death in adults in many parts of the western world, and increasingly so in low to middle income countries. Predictions for 2030 foresee a toll of more than 23 million deaths worldwide. Early diagnosis and treatment can mean the difference between life and death for many people. Over the past 20 years, advancements in cardiology have made use of nuclear techniques to help with the diagnosis and treatment of heart diseases. One such development is nuclear cardiology, which involves the use of specialized imaging processes and radioactive material to diagnose the health and functional ability of the heart. Myocardial perfusion imaging (MPI) is by far the most widely used nuclear cardiology technique in a variety of clinical conditions. Clinical scenarios where patients are most likely to benefi t from single photon emission computed tomography or positron emission tomography are also included in this publication. The aim of the publication is to help strengthen current nuclear cardiology practices.
IAEA HUMAN HEALTH SERIES
Nuclear C
ardiology: Guidance and R
ecomm
endations for Implem
entation in Developing C
ountriesIAEA HUM
AN HEALTH SERIES No. 23
IAEA HUMAN HEALTH SERIESNo. 23
Nuclear Cardiology:Guidance and
Recommendations for Implementation in Developing Countries
IAEA HUMAN HEALTH SERIES
IAEA HUMAN HEALTH SERIES PUBLICATIONS
The mandate of the IAEA human health programme originates from Article II of its Statute, which states that the “Agency shall seek to accelerate and enlarge the contribution of atomic energy to peace, health and prosperity throughout the world”. The main objective of the human health programme is to enhance the capabilities of IAEA Member States in addressing issues related to the prevention, diagnosis and treatment of health problems through the development and application of nuclear techniques, within a framework of quality assurance.
Publications in the IAEA Human Health Series provide information in the areas of: radiation medicine, including diagnostic radiology, diagnostic and therapeutic nuclear medicine, and radiation therapy; dosimetry and medical radiation physics; and stable isotope techniques and other nuclear applications in nutrition. The publications have a broad readership and are aimed at medical practitioners, researchers and other professionals. International experts assist the IAEA Secretariat in drafting and reviewing these publications. Some of the publications in this series may also be endorsed or co-sponsored by international organizations and professional societies active in the relevant fields. There are two categories of publications in this series:
IAEA HUMAN HEALTH SERIESPublications in this category present analyses or provide information of an
advisory nature, for example guidelines, codes and standards of practice, and quality assurance manuals. Monographs and high level educational material, such as graduate texts, are also published in this series.
IAEA HUMAN HEALTH REPORTSHuman Health Reports complement information published in the IAEA Human
Health Series in areas of radiation medicine, dosimetry and medical radiation physics, and nutrition. These publications include reports of technical meetings, the results of IAEA coordinated research projects, interim reports on IAEA projects, and educational material compiled for IAEA training courses dealing with human health related subjects. In some cases, these reports may provide supporting material relating to publications issued in the IAEA Human Health Series.
All of these publications can be downloaded cost free from the IAEA web site:http://www.iaea.org/Publications/index.html
Further information is available from:Marketing and Sales UnitInternational Atomic Energy AgencyVienna International CentrePO Box 1001400 Vienna, Austria
Readers are invited to provide their impressions on these publications. Information may be provided via the IAEA web site, by mail at the address given above, or by email to:
RELATED PUBLICATIONS
www.iaea.org/books
NUCLEAR CARDIOLOGY: ITS ROLE IN COST EFFECTIVE CAREIAEA Human Health Series No. 18STI/PUB/1516 (87 pp.; 2012)ISBN 978–92–0–117410–9 Price: €30.00

NUCLEAR CARDIOLOGY:GUIDANCE AND
RECOMMENDATIONS FORIMPLEMENTATION IN
DEVELOPING COUNTRIES

The following States are Members of the International Atomic Energy Agency:
AFGHANISTANALBANIAALGERIAANGOLAARGENTINAARMENIAAUSTRALIAAUSTRIAAZERBAIJANBAHRAINBANGLADESHBELARUSBELGIUMBELIZEBENINBOLIVIABOSNIA AND HERZEGOVINABOTSWANABRAZILBULGARIABURKINA FASOBURUNDICAMBODIACAMEROONCANADACENTRAL AFRICAN
REPUBLICCHADCHILECHINACOLOMBIACONGOCOSTA RICACÔTE D’IVOIRECROATIACUBACYPRUSCZECH REPUBLICDEMOCRATIC REPUBLIC
OF THE CONGODENMARKDOMINICADOMINICAN REPUBLICECUADOREGYPTEL SALVADORERITREAESTONIAETHIOPIAFINLANDFRANCEGABONGEORGIAGERMANY
GHANAGREECEGUATEMALAHAITIHOLY SEEHONDURASHUNGARYICELANDINDIAINDONESIAIRAN, ISLAMIC REPUBLIC OF IRAQIRELANDISRAELITALYJAMAICAJAPANJORDANKAZAKHSTANKENYAKOREA, REPUBLIC OFKUWAITKYRGYZSTANLAO PEOPLE’S DEMOCRATIC
REPUBLICLATVIALEBANONLESOTHOLIBERIALIBYALIECHTENSTEINLITHUANIALUXEMBOURGMADAGASCARMALAWIMALAYSIAMALIMALTAMARSHALL ISLANDSMAURITANIAMAURITIUSMEXICOMONACOMONGOLIAMONTENEGROMOROCCOMOZAMBIQUEMYANMARNAMIBIANEPAL NETHERLANDSNEW ZEALANDNICARAGUANIGER
NIGERIANORWAYOMANPAKISTANPALAUPANAMAPAPUA NEW GUINEAPARAGUAYPERUPHILIPPINESPOLANDPORTUGALQATARREPUBLIC OF MOLDOVAROMANIARUSSIAN FEDERATIONSAUDI ARABIASENEGALSERBIASEYCHELLESSIERRA LEONESINGAPORESLOVAKIASLOVENIASOUTH AFRICASPAINSRI LANKASUDANSWEDENSWITZERLANDSYRIAN ARAB REPUBLICTAJIKISTANTHAILANDTHE FORMER YUGOSLAV
REPUBLIC OF MACEDONIATUNISIATURKEYUGANDAUKRAINEUNITED ARAB EMIRATESUNITED KINGDOM OF
GREAT BRITAIN AND NORTHERN IRELAND
UNITED REPUBLIC OF TANZANIA
UNITED STATES OF AMERICAURUGUAYUZBEKISTANVENEZUELAVIETNAMYEMENZAMBIAZIMBABWE
The Agency’s Statute was approved on 23 October 1956 by the Conference on the Statute of thIAEA held at United Nations Headquarters, New York; it entered into force on 29 July 1957. ThHeadquarters of the Agency are situated in Vienna. Its principal objective is “to accelerate and enlarge thcontribution of atomic energy to peace, health and prosperity throughout the world’’.
e e e
IAEA HUMAN HEALTH SERIES No. 23
NUCLEAR CARDIOLOGY:GUIDANCE AND
RECOMMENDATIONS FORIMPLEMENTATION IN
DEVELOPING COUNTRIES
INTERNATIONAL ATOMIC ENERGY AGENCYVIENNA, 2012

IAEA Library Cataloguing in Publication Data
Nuclear cardiology : guidance and recommendations for implementation in developing countries. — Vienna : International Atomic Energy Agency, 2012.
p. ; 24 cm. — (IAEA human health series, ISSN 2075–3772 ; no. 23)STI/PUB/1566ISBN 978–92–0–131710–0Includes bibliographical references.
1. Medical care — Developing countries. 2. Cardiovascular diseases — Prevention and control. 3. Heart — Radionuclide imaging. I. International Atomic Energy Agency. II. Series.
IAEAL 12–00746
COPYRIGHT NOTICE
All IAEA scientific and technical publications are protected by the terms of the Universal Copyright Convention as adopted in 1952 (Berne) and as revised in 1972 (Paris). The copyright has since been extended by the World Intellectual Property Organization (Geneva) to include electronic and virtual intellectual property. Permission to use whole or parts of texts contained in IAEA publications in printed or electronic form must be obtained and is usually subject to royalty agreements. Proposals for non-commercial reproductions and translations are welcomed and considered on a case-by-case basis. Enquiries should be addressed to the IAEA Publishing Section at:
Marketing and Sales Unit, Publishing SectionInternational Atomic Energy AgencyVienna International CentrePO Box 1001400 Vienna, Austriafax: +43 1 2600 29302tel.: +43 1 2600 22417email: [email protected] http://www.iaea.org/books
© IAEA, 2012
Printed by the IAEA in AustriaJune 2012
STI/PUB/1566
FOREWORD
Nuclear cardiology represents one of the most widely used non-invasive techniques for the assessment of coronary artery disease and other cardiovascular conditions. It has been proven as a cost effective tool for the management of cardiac patients and usually has a decisive role in diagnosis, prognosis and risk stratification, as well as in evaluation of therapy. Clinical scenarios in which nuclear cardiology can be helpful are continuously expanding, with the identification of special subgroups of patients as potential beneficiaries of these methods and the emergence of technological developments in instrumentation and software that tend to enhance the cost–benefit ratio and the reliability of results.
Many developing countries have introduced nuclear cardiology, with increasing use of this technique in view of the epidemic of cardiovascular disease that is taking place in most low to middle income countries. Longer life expectancies, changes in lifestyle, diabetes, overweight and obesity are thought to be some of the factors underlying the rapidly growing incidence of this life threatening condition. Today, cardiovascular diseases are the most common cause of death in adults in most, if not all, countries of the world, although specific diseases show different relative weights according to local socioeconomic conditions. Thus, proper utilization of available resources such as nuclear cardiology and other imaging methods is essential to effectively combat these diseases.
The practice of nuclear cardiology, however, is not homogeneous worldwide, owing to differences in technological capabilities, availability of consumables, education and training of human resources, and access to evidence based medicine, among other factors. Evidence based medicine is the judicious use of current best evidence in making decisions about the care of individual patients. The practice of evidence based medicine means integrating individual clinical expertise with the best available external clinical evidence from systematic research. External clinical evidence is constructed by relevant research, especially patient centred clinical trials evaluating the accuracy and precision of diagnostic tests, the power of prognostic markers, and the efficacy and safety of therapeutic and preventive measures. External clinical evidence often results in the replacement of previously accepted diagnostic algorithms and treatments with new ones that are more accurate, more efficacious and safer.
With the aims of gathering updated information on the current role of nuclear cardiology in cardiovascular disorders, in particular coronary artery disease, and of preparing practical guidance on nuclear medicine practice focused on developing countries, the IAEA organized a technical meeting on evidence based nuclear cardiology in ischaemic heart disease, which took place in Vienna
on 21–25 February 2011. The meeting was attended by experts in the field from different countries, who participated in the discussions and contributed to drafting the present publication. This publication is mainly devoted to myocardial perfusion imaging and covers all aspects of this modality, from clinical indications to reporting. It is intended to inform the implementation, homogenization and enhancement of nuclear cardiology practice in Member States where the technique is under development, in order to facilitate a rapid upgrade to currently accepted standards and to provide good quality services to the population.
In this publication, ‘should’ statements are used to provide guidance based on expert judgement; they do not stem from a consensus of IAEA Member States.
The IAEA technical officers in responsible for this publication were M. Dondi and D. Paez of the Division of Human Health.
EDITORIAL NOTE
Although great care has been taken to maintain the accuracy of information contained in this publication, neither the IAEA nor its Member States assume any responsibility for consequences which may arise from its use.
In this publication, ‘should’ statements are used to provide guidance based on expert judgement; they do not stem from a consensus of IAEA Member States.
The use of particular designations of countries or territories does not imply any judgement by the publisher, the IAEA, as to the legal status of such countries or territories, of their authorities and institutions or of the delimitation of their boundaries.
The mention of names of specific companies or products (whether or not indicated as registered) does not imply any intention to infringe proprietary rights, nor should it be construed as an endorsement or recommendation on the part of the IAEA.
The IAEA has no responsibility for the persistence or accuracy of URLs for external or third party Internet web sites referred to in this book and does not guarantee that any content on such web sites is, or will remain, accurate or appropriate.
CONTENTS
1. INTRODUCTION . . . . . . . . . . . . . . . . . . . . . . . . . . . . . . . . . . . . . . . . 1
1.1. Background . . . . . . . . . . . . . . . . . . . . . . . . . . . . . . . . . . . . . . . . . 11.2. Objective . . . . . . . . . . . . . . . . . . . . . . . . . . . . . . . . . . . . . . . . . . . 11.3. Scope and structure . . . . . . . . . . . . . . . . . . . . . . . . . . . . . . . . . . . 2
2. INDICATIONS FOR MPI . . . . . . . . . . . . . . . . . . . . . . . . . . . . . . . . . . 3
2.1. Evaluation of patients with chest pain orischaemic equivalent . . . . . . . . . . . . . . . . . . . . . . . . . . . . . . . . . . 3
2.2. Clinical situations or symptoms otherthan ischaemic equivalent . . . . . . . . . . . . . . . . . . . . . . . . . . . . . . 3
2.3. Risk stratification and prognosis assessment . . . . . . . . . . . . . . . 42.4. Possible indications for asymptomatic patients . . . . . . . . . . . . . 42.5. Definitions. . . . . . . . . . . . . . . . . . . . . . . . . . . . . . . . . . . . . . . . . . 5
3. STRESS MODALITIES AND PROTOCOLS FOR MPI . . . . . . . . . . 9
3.1. Types of stress. . . . . . . . . . . . . . . . . . . . . . . . . . . . . . . . . . . . . . . 93.1.1. Physical exercise . . . . . . . . . . . . . . . . . . . . . . . . . . . . . . . 93.1.2. Pharmacological stimulation. . . . . . . . . . . . . . . . . . . . . . 93.1.3. Patient preparation . . . . . . . . . . . . . . . . . . . . . . . . . . . . . 10
3.2. Selection of ST . . . . . . . . . . . . . . . . . . . . . . . . . . . . . . . . . . . . . . 123.3. Stress protocols . . . . . . . . . . . . . . . . . . . . . . . . . . . . . . . . . . . . . . 13
3.3.1. Exercise . . . . . . . . . . . . . . . . . . . . . . . . . . . . . . . . . . . . . . 133.3.2. Dipyridamole . . . . . . . . . . . . . . . . . . . . . . . . . . . . . . . . . 133.3.3. Adenosine . . . . . . . . . . . . . . . . . . . . . . . . . . . . . . . . . . . . 143.3.4. Selective A2A receptor agonists . . . . . . . . . . . . . . . . . . . 143.3.5. Dobutamine. . . . . . . . . . . . . . . . . . . . . . . . . . . . . . . . . . . 143.3.6. Combination of vasodilators with
low workload physical exercise . . . . . . . . . . . . . . . . . . . 153.4. Contraindications . . . . . . . . . . . . . . . . . . . . . . . . . . . . . . . . . . . . 163.5. Optimization of STs in MPI . . . . . . . . . . . . . . . . . . . . . . . . . . . . 193.6. Radiopharmaceuticals and imaging protocols . . . . . . . . . . . . . . 19
3.6.1. 99mTc-MIBI and 99mTc-tetrofosmin . . . . . . . . . . . . . . . . . 193.6.2. Imaging protocols for 99mTc agents . . . . . . . . . . . . . . . . . 213.6.3. 201Tl . . . . . . . . . . . . . . . . . . . . . . . . . . . . . . . . . . . . . . . . . 22

3.6.4. Imaging protocols for 201Tl . . . . . . . . . . . . . . . . . . . . . . . 223.6.5. Dual isotope protocols . . . . . . . . . . . . . . . . . . . . . . . . . . 23
4. ACQUISITION AND PROCESSING OF MPI STUDIES . . . . . . . . . 27
4.1. Acquisition . . . . . . . . . . . . . . . . . . . . . . . . . . . . . . . . . . . . . . . . . 274.1.1. General recommendations. . . . . . . . . . . . . . . . . . . . . . . . 274.1.2. Patient positioning. . . . . . . . . . . . . . . . . . . . . . . . . . . . . . 274.1.3. Field of view . . . . . . . . . . . . . . . . . . . . . . . . . . . . . . . . . . 284.1.4. Orbit . . . . . . . . . . . . . . . . . . . . . . . . . . . . . . . . . . . . . . . . 284.1.5. Acquisition type . . . . . . . . . . . . . . . . . . . . . . . . . . . . . . . 284.1.6. Pixel and matrix size . . . . . . . . . . . . . . . . . . . . . . . . . . . . 294.1.7. Acquisition time . . . . . . . . . . . . . . . . . . . . . . . . . . . . . . . 294.1.8. Gated studies . . . . . . . . . . . . . . . . . . . . . . . . . . . . . . . . . . 304.1.9. Quality assurance (QA). . . . . . . . . . . . . . . . . . . . . . . . . . 31
4.2. Processing . . . . . . . . . . . . . . . . . . . . . . . . . . . . . . . . . . . . . . . . . . 314.2.1. Motion correction . . . . . . . . . . . . . . . . . . . . . . . . . . . . . . 314.2.2. Image reconstruction. . . . . . . . . . . . . . . . . . . . . . . . . . . . 314.2.3. Reorientation. . . . . . . . . . . . . . . . . . . . . . . . . . . . . . . . . . 334.2.4. Image display . . . . . . . . . . . . . . . . . . . . . . . . . . . . . . . . . 334.2.5. Quantification . . . . . . . . . . . . . . . . . . . . . . . . . . . . . . . . . 344.2.6. Perfusion defect size . . . . . . . . . . . . . . . . . . . . . . . . . . . . 344.2.7. Perfusion defect severity . . . . . . . . . . . . . . . . . . . . . . . . . 344.2.8. Summed scores . . . . . . . . . . . . . . . . . . . . . . . . . . . . . . . . 354.2.9. Polar maps. . . . . . . . . . . . . . . . . . . . . . . . . . . . . . . . . . . . 364.2.10. LVEF . . . . . . . . . . . . . . . . . . . . . . . . . . . . . . . . . . . . . . . . 364.2.11. Regional LV function . . . . . . . . . . . . . . . . . . . . . . . . . . . 374.2.12. LV volumes . . . . . . . . . . . . . . . . . . . . . . . . . . . . . . . . . . . 384.2.13. Transient ischaemic dilation (TID) . . . . . . . . . . . . . . . . . 384.2.14. Lung-to-heart ratio (LHR) . . . . . . . . . . . . . . . . . . . . . . . 384.2.15. Right ventricular (RV) uptake. . . . . . . . . . . . . . . . . . . . . 394.2.16. Overall image quality . . . . . . . . . . . . . . . . . . . . . . . . . . . 39
5. INTERPRETATION AND REPORTING OF MPI STUDIES . . . . . . 42
5.1. Introduction. . . . . . . . . . . . . . . . . . . . . . . . . . . . . . . . . . . . . . . . . 425.2. QC . . . . . . . . . . . . . . . . . . . . . . . . . . . . . . . . . . . . . . . . . . . . . . . . 425.3. Gating procedure. . . . . . . . . . . . . . . . . . . . . . . . . . . . . . . . . . . . . 43
5.3.1. Reconstructed images . . . . . . . . . . . . . . . . . . . . . . . . . . . 435.3.2. Polar maps. . . . . . . . . . . . . . . . . . . . . . . . . . . . . . . . . . . . 45

5.3.3. Gated images. . . . . . . . . . . . . . . . . . . . . . . . . . . . . . . . . . 465.3.4. Attenuation correction. . . . . . . . . . . . . . . . . . . . . . . . . . . 46
5.4. Image display . . . . . . . . . . . . . . . . . . . . . . . . . . . . . . . . . . . . . . . 475.4.1. Slice display . . . . . . . . . . . . . . . . . . . . . . . . . . . . . . . . . . 475.4.2. Polar map display . . . . . . . . . . . . . . . . . . . . . . . . . . . . . . 485.4.3. Gated display. . . . . . . . . . . . . . . . . . . . . . . . . . . . . . . . . . 485.4.4. 3-D images and quantitative analysis . . . . . . . . . . . . . . . 48
5.5. Artefact recognition . . . . . . . . . . . . . . . . . . . . . . . . . . . . . . . . . . 505.5.1. Motion artefacts . . . . . . . . . . . . . . . . . . . . . . . . . . . . . . . 505.5.2. Attenuation artefacts . . . . . . . . . . . . . . . . . . . . . . . . . . . . 505.5.3. Extracardiac activity . . . . . . . . . . . . . . . . . . . . . . . . . . . . 515.5.4. Extravasation of tracer . . . . . . . . . . . . . . . . . . . . . . . . . . 525.5.5. Polar plots . . . . . . . . . . . . . . . . . . . . . . . . . . . . . . . . . . . . 525.5.6. Gating errors . . . . . . . . . . . . . . . . . . . . . . . . . . . . . . . . . . 525.5.7. Hot spots . . . . . . . . . . . . . . . . . . . . . . . . . . . . . . . . . . . . . 52
5.6. Image interpretation . . . . . . . . . . . . . . . . . . . . . . . . . . . . . . . . . . 535.6.1. Perfusion defects . . . . . . . . . . . . . . . . . . . . . . . . . . . . . . . 535.6.2. High risk scan features . . . . . . . . . . . . . . . . . . . . . . . . . . 535.6.3. TID of the LV . . . . . . . . . . . . . . . . . . . . . . . . . . . . . . . . . 555.6.4. Lung uptake. . . . . . . . . . . . . . . . . . . . . . . . . . . . . . . . . . . 565.6.5. Stunning . . . . . . . . . . . . . . . . . . . . . . . . . . . . . . . . . . . . . 565.6.6. RV tracer uptake . . . . . . . . . . . . . . . . . . . . . . . . . . . . . . . 575.6.7. Multiple and extensive perfusion defects . . . . . . . . . . . . 57
5.7. Reporting and essential elements of a comprehensive report . . . 575.7.1. Introduction. . . . . . . . . . . . . . . . . . . . . . . . . . . . . . . . . . . 575.7.2. General information . . . . . . . . . . . . . . . . . . . . . . . . . . . . 595.7.3. Clinical background . . . . . . . . . . . . . . . . . . . . . . . . . . . . 595.7.4. Methods. . . . . . . . . . . . . . . . . . . . . . . . . . . . . . . . . . . . . . 605.7.5. Perfusion (rest and stress 99mTc perfusion imaging) . . . . 615.7.6. Ventricular function. . . . . . . . . . . . . . . . . . . . . . . . . . . . . 615.7.7. Ancillary findings . . . . . . . . . . . . . . . . . . . . . . . . . . . . . . 615.7.8. Conclusions. . . . . . . . . . . . . . . . . . . . . . . . . . . . . . . . . . . 62
APPENDIX I: PATIENT INFORMATION BROCHURE . . . . . . . . . . 63
APPENDIX II: CHECKLIST FOR MPI STUDIES . . . . . . . . . . . . . . . . 66
APPENDIX III: EXAMPLES OF MPI REPORTS. . . . . . . . . . . . . . . . . . 70
APPENDIX IV: STRATEGIES TO REDUCE THERADIATION DOSE IN MPI . . . . . . . . . . . . . . . . . . . . . 83

APPENDIX V: NUCLEAR CARDIOLOGY FORTHE REFERRING PHYSICIAN . . . . . . . . . . . . . . . . . . 86
APPENDIX VI: ROLE OF CARDIAC PET AND PET/CTIN DEVELOPING COUNTRIES. . . . . . . . . . . . . . . . . . 90
APPENDIX VII: GALLERY OF CASE STUDIES . . . . . . . . . . . . . . . . . . 93
APPENDIX VIII: FORMULAS. . . . . . . . . . . . . . . . . . . . . . . . . . . . . . . . . . 103
ABBREVIATIONS. . . . . . . . . . . . . . . . . . . . . . . . . . . . . . . . . . . . . . . . . . . . 105CONTRIBUTORS TO DRAFTING AND REVIEW . . . . . . . . . . . . . . . . . 107
1. INTRODUCTION
1.1. BACKGROUND
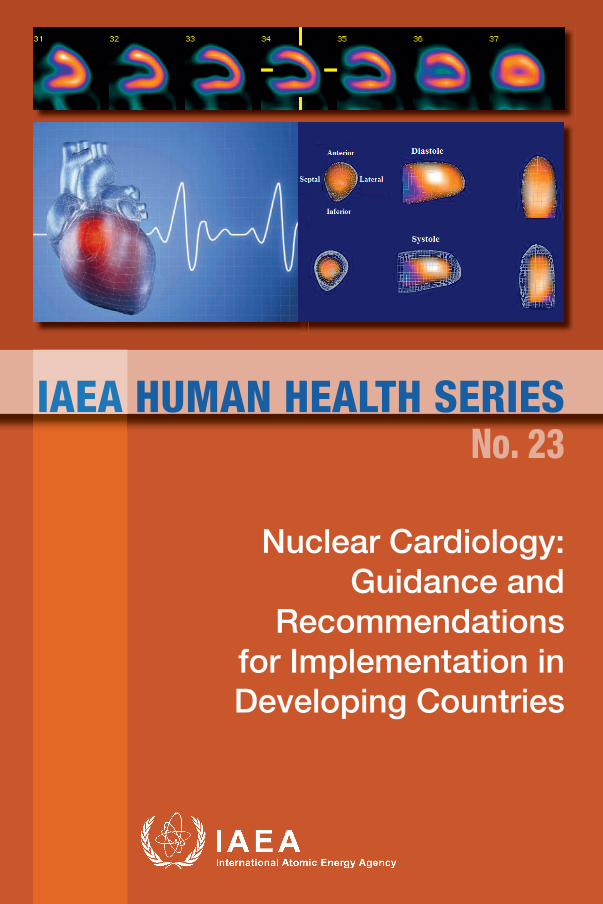
Coronary artery disease (CAD) is the leading cause of death in adults in many parts of the western world and increasingly so in low to middle income countries. In the United States of America, it accounts for more than 500 000 deaths each year and predictions for 2030 foresee a toll of more than 23 million deaths worldwide. Early diagnosis and treatment can mean the difference between life and death for many. Over the past 20 years, advancements in the field of cardiology have made use of nuclear techniques to help with the diagnosis and treatment of heart diseases. One of these developments is in the field of nuclear cardiology, which involves the use of specialized imaging processes and radioactive materials to diagnose the health and functional ability of the heart. Myocardial perfusion imaging (MPI) is by far the most widely used nuclear cardiology technique, and is employed in a variety of clinical conditions. Clinical scenarios where patients are most likely to benefit from single photon emission computed tomography (SPECT) or positron emission tomography (PET) MPI are clearly identified in Section 2. The list is not exclusive, since, based on clinical judgement, others can benefit from MPI as well.
1.2. OBJECTIVE
This publication is complementary to a previous publication (IAEA Human Health Series No.18, Nuclear Cardiology: Its Role in Cost Effective Care) in which the roles of other non-invasive imaging modalities are also discussed, along with MPI. The current publication is directed mainly at nuclear medicine physicians, cardiologists and cardiac surgeons, but also at all other clinical specialists involved in managing and treating CAD. It is intended to address the implementation, homogenization and enhancement of nuclear cardiology practice in those Member States where the technique is under development. The aim is also to help strengthen current nuclear cardiology practices where they already exist, in order to facilitate their upgrade to currently accepted standards, to provide better quality services to the population.
1

1.3. SCOPE AND STRUCTURE
The current publication is devoted to MPI. It starts with clinical indications and covers all aspects of this modality, including comprehensive instructions on the selection of stress tests (STs) and acquisition procedures. The reader is provided with guidelines on interpretation of studies and their reporting, as well as several images as examples of clinical cases.1
1 All images in this publication are courtesy of F. Mut.
2
2. INDICATIONS FOR MPI
Non-invasive cardiac imaging techniques, and in particular stress MPI, have a central role in the diagnostic workup [2.1] and risk assessment [2.2–2.4] of patients with known or suspected CAD, lowering the cost of managing these patients [2.5, 2.6].
Symptom evaluation is an important component of the decision making involved in referral for MPI. For the purpose of this publication, an ischaemic equivalent is defined as a chest pain syndrome, anginal equivalent, electrocardiogram (ECG) abnormalities consistent with ischaemia, or reduced activity in daily life.
The following sections list the situations where MPI has a role.
2.1. EVALUATION OF PATIENTS WITH CHEST PAINOR ISCHAEMIC EQUIVALENT
• Those with intermediate (≥20% to <50%) or high (≥50%) likelihood of CAD2;
• Those with low likelihood of CAD (<20%), with uninterpretable resting ECG or unable to exercise;
• Possible acute coronary syndrome or new or recent onset chest pain.
2.2. CLINICAL SITUATIONS OR SYMPTOMS OTHER THAN ISCHAEMIC EQUIVALENT
• Cardiac enzyme elevation in conjunction with chest pain and/or ECG abnormalities;
• Patients with abnormal, equivocal or discordant stress testing by ECG or other imaging modality, in which the diagnosis of CAD remains a concern;
• Evaluation of coronary stenosis of uncertain significance observed on invasive or non-invasive coronary angiography;
• Evaluation of new onset or newly diagnosed heart failure;
2 Algorithms are available to estimate the likelihood of CAD, including Table 2.1, from Gibbons et al., 1999 [2.1] and Table 2.2, from Diamond and Forrester, 1979 [2.7]. However, as the prevalence and age of onset of CAD vary from country to country, these algorithms are most applicable to the population on which they were based and not to all populations.
3

• Evaluation of ventricular tachycardia;• Syncope in patients with an intermediate (>10%) or high (>20%) absolute
10-year risk of a cardiac event, based on pre-test CAD risk factors3.
2.3. RISK STRATIFICATION AND PROGNOSIS ASSESSMENT
• Chest pain syndrome in a patient with high pre-test likelihood of CAD;• Following myocardial infarction or acute coronary syndrome;• Monitoring the effects of treatment of CAD, including revascularization
and medical therapy;• Patients with a previous abnormal coronary angiography or stress imaging
study, in whom MPI would be expected to alter clinical management;• Viability assessment in patients with left ventricular (LV) systolic
dysfunction, in whom this assessment would be expected to alter clinical management;
• Patients undergoing non-cardiac major surgery and with an intermediate (≥20% to <50%) or high (≥50%) likelihood of CAD.
2.4. POSSIBLE INDICATIONS FOR ASYMPTOMATIC PATIENTS
• Patients with an intermediate (≥10% to <20%) or high (≥20%) absolute 10-year risk of a cardiac event based on pre-test CAD risk factors;
• Patients with diabetes and evidence of a diabetic complication, prolonged duration of diabetes or an additional CAD risk factor, or female patients with diabetes;
• Patients with evidence of extracardiac atherosclerotic vascular disease;• Patients with a coronary calcium Agatston score of >400, or >100 in
patients with diabetes;• Chronic kidney disease (glomerular filtration rate <30 mL/min);• Troponin elevation without evidence of acute coronary syndrome;• Syncope with intermediate to high pre-test likelihood of CAD.
3 Algorithms are available to estimate the absolute 10-year risk of a cardiac event (references for the various scores, Framingham, Prospective Cardiovascular Münster Study, etc.). Analogous to the likelihood evaluation described above, differences in the prevalence and age of onset of CAD vary from country to country, making these algorithms most applicable to the population on which they were based.
4
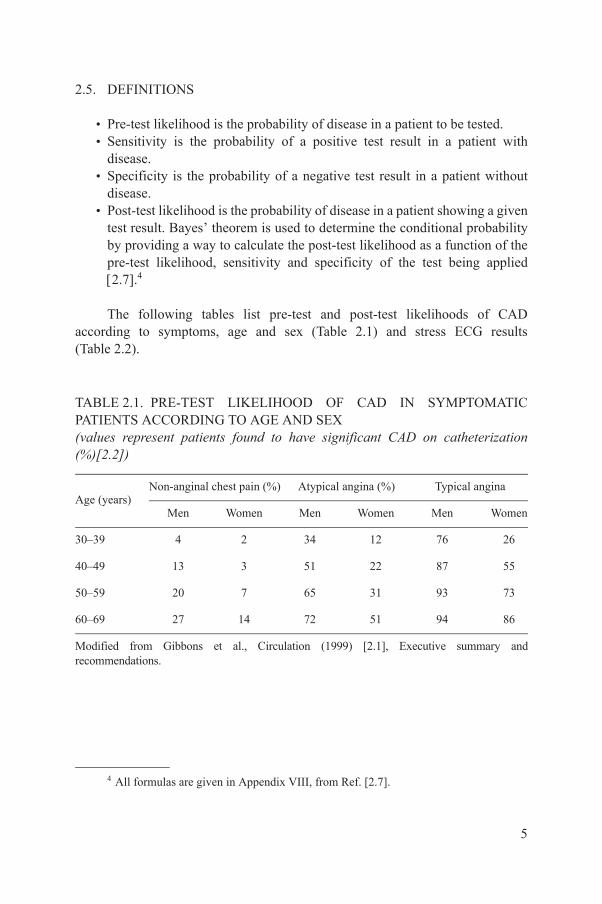
2.5. DEFINITIONS
• Pre-test likelihood is the probability of disease in a patient to be tested.• Sensitivity is the probability of a positive test result in a patient with
disease.• Specificity is the probability of a negative test result in a patient without
disease.• Post-test likelihood is the probability of disease in a patient showing a given
test result. Bayes’ theorem is used to determine the conditional probability by providing a way to calculate the post-test likelihood as a function of the pre-test likelihood, sensitivity and specificity of the test being applied 2.7.4
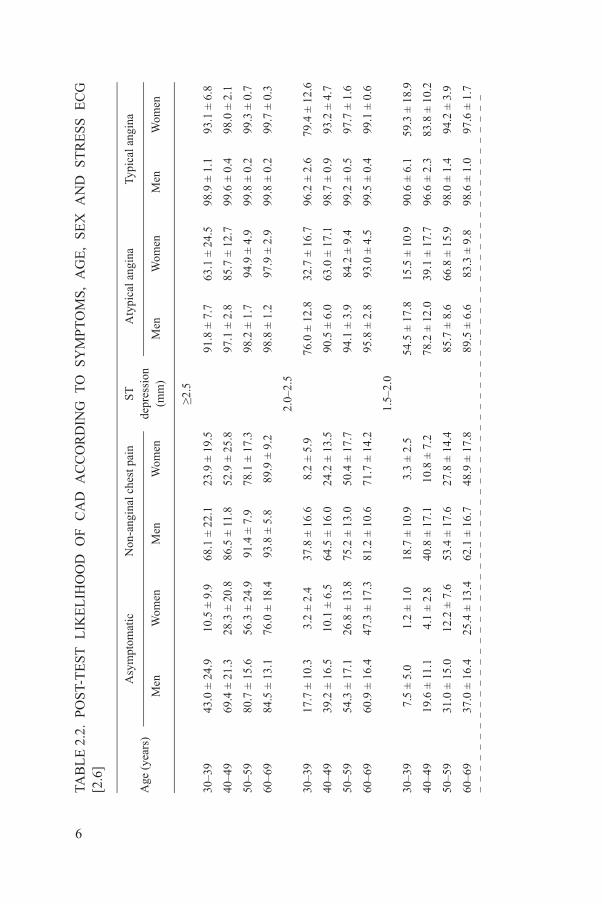
The following tables list pre-test and post-test likelihoods of CAD according to symptoms, age and sex (Table 2.1) and stress ECG results (Table 2.2).
4 All formulas are given in Appendix VIII, from Ref. [2.7].
TABLE 2.1. PRE-TEST LIKELIHOOD OF CAD IN SYMPTOMATIC PATIENTS ACCORDING TO AGE AND SEX(values represent patients found to have significant CAD on catheterization (%)[2.2])
Age (years)Non-anginal chest pain (%) Atypical angina (%) Typical angina
Men Women Men Women Men Women
30–39 4 2 34 12 76 26
40–49 13 3 51 22 87 55
50–59 20 7 65 31 93 73
60–69 27 14 72 51 94 86
Modified from Gibbons et al., Circulation (1999) [2.1], Executive summary and recommendations.
5
TAB
LE
2.2
. P
OS
T-T
ES
T L
IKE
LIH
OO
D O
F C
AD
AC
CO
RD
ING
TO
SY
MP
TO
MS
, A
GE
, S
EX
AN
D S
TR
ES
S E
CG
[2
.6]
Age
(ye
ars)
Asy
mpt
omat
icN
on-a
ngin
al c
hest
pai
nS
Tde
pres
sion
(mm
)
Aty
pica
l ang
ina
Typi
cal a
ngin
a
Men
Wom
enM
enW
omen
Men
Wom
enM
enW
omen
≥2.5
30–3
943
.0 ±
24.
910
.5 ±
9.9
68.1
± 2
2.1
23.9
± 1
9.5
91.8
± 7
.763
.1 ±
24.
598
.9 ±
1.1
93.1
± 6
.8
40–4
969
.4 ±
21.
328
.3 ±
20.
886
.5 ±
11.
852
.9 ±
25.
897
.1 ±
2.8
85.7
± 1
2.7
99.6
± 0
.498
.0 ±
2.1
50–5
980
.7 ±
15.
656
.3 ±
24.
991
.4 ±
7.9
78.1
± 1
7.3
98.2
± 1
.794
.9 ±
4.9
99.8
± 0
.299
.3 ±
0.7
60–6
984
.5 ±
13.
176
.0 ±
18.
493
.8 ±
5.8
89.9
± 9
.298
.8 ±
1.2
97.9
± 2
.999
.8 ±
0.2
99.7
± 0
.3
2.
0–2.
5
30–3
917
.7 ±
10.
33.
2 ±
2.4
37.8
± 1
6.6
8.2
± 5.
976
.0 ±
12.
832
.7 ±
16.
796
.2 ±
2.6
79.4
± 1
2.6
40–4
939
.2 ±
16.
510
.1 ±
6.5
64.5
± 1
6.0
24.2
± 1
3.5
90.5
± 6
.063
.0 ±
17.
198
.7 ±
0.9
93.2
± 4
.7
50–5
954
.3 ±
17.
126
.8 ±
13.
875
.2 ±
13.
050
.4 ±
17.
794
.1 ±
3.9
84.2
± 9
.499
.2 ±
0.5
97.7
± 1
.6
60–6
960
.9 ±
16.
447
.3 ±
17.
381
.2 ±
10.
671
.7 ±
14.
295
.8 ±
2.8
93.0
± 4
.599
.5 ±
0.4
99.1
± 0
.6
1.
5–2.
0
30–3
97.
5 ±
5.0
1.2
± 1.
018
.7 ±
10.
93.
3 ±
2.5
54.5
± 1
7.8
15.5
± 1
0.9
90.6
± 6
.159
.3 ±
18.
9
40–4
919
.6 ±
11.
14.
1 ±
2.8
40.8
± 1
7.1
10.8
± 7
.278
.2 ±
12.
039
.1 ±
17.
796
.6 ±
2.3
83.8
± 1
0.2
50–5
931
.0 ±
15.
012
.2 ±
7.6
53.4
± 1
7.6
27.8
± 1
4.4
85.7
± 8
.666
.8 ±
15.
998
.0 ±
1.4
94.2
± 3
.9
60–6
937
.0 ±
16.
425
.4 ±
13.
462
.1 ±
16.
748
.9 ±
17.
889
.5 ±
6.6
83.3
± 9
.898
.6 ±
1.0
97.6
± 1
.7
6

1.
0–1.
5
30–3
93.
9 ±
0.9
0.6
± 0.
210
.4 ±
2.2
1.7
± 0.
737
.7 ±
5.2
8.5
± 2.
883
.0 ±
3.2
42.4
± 9
.4
40–4
911
.0 ±
1.7
2.1
± 0.
525
.8 ±
3.8
5.8
± 1.
764
.4 ±
4.2
24.5
± 5
.693
.6 ±
1.1
72.3
± 6
.2
50–5
918
.5 ±
2.6
6.5
± 1.
336
.7 ±
4.5
16.3
± 3
.175
.2 ±
3.3
50.4
± 5
.496
.1 ±
0.7
89.1
± 2
.2
60–6
922
.9 ±
3.1
14.7
± 2
.345
.3 ±
4.7
32.6
± 4
.681
.2 ±
2.7
71.6
± 3
.997
.2 ±
0.5
95.3
± 0
.9
0.
5–1.
0
30–3
91.
7 ±
0.6
0.3
± 0.
14.
8 ±
1.6
0.7
± 0.
420
.7 ±
5.5
3.9
± 1.
667
.8 ±
7.4
24.2
± 8
.4
40–4
95.
1 ±
1.5
0.9
± 0.
313
.1 ±
3.7
2.6
± 1.
043
.9 ±
7.7
12.3
± 4
.386
.3 ±
3.7
53.0
± 1
0.0
50–5
99.
0 ±
2.5
2.9
± 0.
920
.1 ±
5.1
7.8
± 2.
456
.8 ±
7.6
30.5
± 7
.191
.3 ±
2.5
77.9
± 5
.8
60–6
911
.4 ±
3.1
6.9
± 2.
026
.4 ±
6.2
17.3
± 4
.765
.1 ±
7.0
52.2
± 7
.993
.8 ±
1.8
89.8
± 2
.9
0–
0.5
30–3
90.
4 ±
0.1
0.1
± 0.
01.
2 ±
0.4
0.2
± 0.
16.
1 ±
1.7
1.0
± 0.
424
.5 ±
6.6
7.4
± 2.
9
40–4
91.
3 ±
0.3
0.2
± 0.
13.
6 ±
0.9
0.7
± 0.
260
.4 ±
3.5
3.4
± 1.
261
.1 ±
6.3
22.0
± 6
.2
50–5
92.
4 ±
0.6
0.8
± 0.
25.
9 ±
1.5
2.1
± 0.
624
.7 ±
4.8
9.9
± 2.
572
.5 ±
5.2
46.9
± 7
.2
60–6
93.
1 ±
0.8
1.8
± 0.
68.
2 ±
2.0
5.0
± 1.
331
.8 ±
5.5
21.4
± 4
.579
.1 ±
4.3
68.8
± 5
.9
Mod
ifie
d fr
om D
iam
ond
and
For
rest
er, N
. Eng
l. J.
Med
(19
79)
[2.7
].
TAB
LE
2.2
. P
OS
T-T
ES
T L
IKE
LIH
OO
D O
F C
AD
AC
CO
RD
ING
TO
SY
MP
TO
MS
, A
GE
, S
EX
AN
D S
TR
ES
S E
CG
[2
.6]
(con
t.)
Age
(ye
ars)
Asy
mpt
omat
icN
on-a
ngin
al c
hest
pai
nS
Tde
pres
sion
(mm
)
Aty
pica
l ang
ina
Typi
cal a
ngin
a
Men
Wom
enM
enW
omen
Men
Wom
enM
enW
omen
7

REFERENCES
[2.1] GIBBONS, R.J., et al., ACC/AHA/ACP-ASIM guidelines for the management of patients with chronic stable angina: executive summary and recommendations, Circulation 99 (1999) 2829–2848.
[2.2] KANNEL, W.B., Some lessons in cardiovascular epidemiology from Framingham, Am. J. Cardiol. 37 (1976) 269–282.
[2.3] WILSON, P.W., et al., Prediction of coronary heart disease using risk factor categories, Circulation 97 (1998) 1837–1847.
[2.4] ASSMANN, G., SCHULTE, H., CULLEN, P., New and classical risk factors — the Münster heart study (PROCAM), Eur. J. Med. Res. 2 (1997) 237–242.
[2.5] STRAUSS, H.W., et al., Procedure guideline for myocardial perfusion imaging, J. Nucl. Med. 39 (1998) 918–923.
[2.6] HENDEL, R.C., et al., ACCF/ASNC/ACR/AHA/ASE/SCCT/SCMR/SNM 2009 Appropriate Use Criteria for Cardiac Radionuclide Imaging: a report of the American College of Cardiology Foundation Appropriate Use Criteria Task Force, the American Society of Nuclear Cardiology, the American College of Radiology, the American Heart Association, the American Society of Echocardiography, the Society of Cardiovascular Computed Tomography, the Society for Cardiovascular Magnetic Resonance, and the Society of Nuclear Medicine, J. Am. Coll. Cardiol. 119 (2009) 561–587.
[2.7] DIAMOND, G.A., FORRESTER, J.S., Analysis of probability as an aid in the clinical diagnosis of coronary-artery disease, N. Engl. J. Med. 300 (1979) 1350–1358.
8
3. STRESS MODALITIES AND PROTOCOLS FOR MPI
Several stress modalities can be applied in nuclear cardiology, including: exercise, vasodilators, exercise combined with vasodilators, and dobutamine. In all cases, the purpose of the ST (from the imaging point of view) is to produce coronary vasodilatation, so that when radiotracer is injected, its myocardial distribution will reflect flow heterogeneity if significant coronary stenosis is present [3.1]. It is clear that, for appropriate diagnosis using this modality, true ischaemia is not necessarily induced, in contrast to other modalities such as stress echocardiography, where transient abnormal wall motion due to myocardial ischaemia is the main factor for detecting CAD [3.2].
3.1. TYPES OF STRESS
3.1.1. Physical exercise
• Exercise is the most physiological test for myocardial ischaemia. Owing to catecholamine release and sympathetic stimulation, exercise increases determinants of myocardial oxygen consumption: heart rate, blood pressure (BP) and myocardial contractility.
• Exercise also produces coronary vasodilatation through biochemical mechanisms, in order to increase blood flow to the myocardium in response to the elevated oxygen demand.
• Haemodynamically significant coronary lesions with the potential to cause ischaemia are identified on MPI as areas of decreased myocardial tracer uptake [3.3].
• Under normal conditions, myocardial blood flow (MBF) increases approximately threefold at peak exercise compared with baseline. The difference between basal and maximum achieved MBF is called ‘coronary reserve’.
3.1.2. Pharmacological stimulation
• Dipyridamole inhibits the action of an enzyme called adenosine deaminase, responsible for the degradation of endogenously produced adenosine, and blocks the reuptake of adenosine by cells, inducing an elevation of extracellular adenosine, which causes vasodilatation [3.4, 3.5]. The biological half-time/life of dipyridamole is approximately 45 min. This, and other vasodilators described below (adenosine and regadenoson), are
9
generally safe but can occasionally produce ischaemia (sometimes severe) if severe coronary stenosis with some collateral circulation is present, provoking the so-called ‘steal phenomenon’, which results in deviation of blood flow from underperfused areas to normally perfused ones. Detailed description of this phenomenon is beyond the scope of this publication.
• Adenosine promotes vasodilatation by direct activation of vascular A2
receptors when injected intravenously. In myocardium supplied by normal arteries, MBF increases approximately three- to fourfold compared with baseline with dypiridamole and approximately four- to fivefold with adenosine, whereas MBF increases less in myocardium supplied by diseased arteries [3.6, 3.7]. Ischaemic or potentially ischaemic areas can be identified on MPI by heterogeneous tracer distribution, due to a differential capacity of vessels to dilate. The biological half-time/life of adenosine is about 10 s or less.
• Selective adenosine A2A receptor agonists are becoming available for utilization. Regadenoson was approved by the Food and Drug Administration of the USA in 2008, since it has been shown to have similar accuracy to adenosine for the detection of myocardial ischaemia, with fewer overall side effects [3.8, 3.9].
• Dobutamine is a beta adrenergic agonist that increases heart rate and myocardial contractility, promoting coronary hyperaemia through mechanisms similar to exercise [3.10]. It is a fast acting drug with the effect starting approximately 2 min into infusion. Haemodynamic effects are dose dependent; at low doses of 5–10 μg·kg-1·min-1, it increases myocardial contractility without significant change in heart rate. Doses above 10–20 μg·kg-1·min-1 increase both heart rate and myocardial contractility.
3.1.3. Patient preparation
• Instructions regarding fasting vary, but in general, heavy meals should be avoided before testing (Table 3.1).
• Interruption of medications will depend on the clinical question. If the reason for testing is diagnosis of ischaemia in patients with no known CAD, then medications that could reduce ischaemic burden should be withheld [3.11]; nevertheless, referring physicians may prefer to maintain medical therapy, to be able to monitor the efficacy of the treatment instituted.
• It is preferable to give additional instructions to prepare for vasodilator stress (such as caffeine restriction), in case the patient cannot exercise to the target heart rate and an alternative pharmacologic study should become necessary [3.12]. When dobutamine stress is planned, beta blockers should be discontinued for 2 days, similar to the preparation for exercise stress.
10

• All patients should be informed of the purpose of the test, procedure sequence, exam duration and potential risks. An informed consent form should be signed according to local regulations. Before starting the procedure, specific information must be obtained regarding potential pregnancy in women of child bearing age, or those who are breast feeding, and a pregnancy test should be performed if needed. It should be emphasized at this point that the local customs and traditions in the respective countries need to be taken into consideration, and a reflective approach regarding the cultural aspect is imperative when dealing with younger women, particularly with regard to pregnancy issues.
• A secure intravenous (IV) line should be established for the administration of radiotracer and medications when needed during or after the stress, as well as for the pharmacologic stressors when these are to be used.
TABLE 3.1. GENERAL RECOMMENDATIONS FOR PATIENTS SCHEDULED FOR ST
Item to be considered Recommendation
Medicationa to be withheld (minimum):
Nitrates 24 h
Beta blockers 2–5 d (gradually to prevent rebound)
Calcium channel blockers 24–48 h
Methyl xanthine compounds 72 h
Pentoxyphylline 72 h
Oral dipyridamole/persantine 48 h
Phosphodiesterase inhibitors 12 h
Food, beverages to be withheld (minimum):
Xanthine-containing drinks(coffee, tea, chocolate, soft drinks)
12 h
Fasting Avoid heavy meals; 24 h fasting recommended
Dress Comfortable clothing and shoes, no accessories, and avoid clothing with metallic elements
a Medication withdrawal according to clinical questions and physician indications.
11

• All stress procedures must be supervised by a qualified healthcare professional. The physician in charge should be experienced in selection of the appropriate ST for the individual patient and the clinical question being asked. All involved personnel should also have the clinical skills to be able to recognize patients who might be at increased risk of complications (and thereby exclude them from stress testing) and respond to potential medical emergencies.
• Life support instrumentation and emergency drugs must be available in the immediate vicinity of the stress laboratory; personnel trained in advanced cardiac life support or at the least basic life support should be available.
3.2. SELECTION OF ST
Physical exercise is the stress modality of choice for all patients able to exercise adequately and provides additional information (compared with pharmacological stress), such as: total exercise duration, ST segment changes, development of symptoms (chest pain), haemodynamic changes (BP and heart rate) and arrhythmias. In addition, the quality of myocardial perfusion images is often better with exercise compared with pharmacological stress, and this is related to less subdiaphragmatic uptake and fewer inferior wall artefacts. Details regarding the diagnostic criteria for the stress testing are included in specific guidelines [3.13, 3.14].
Accepted indications for vasodilator stress include:
• Inability to exercise.• Failure to achieve 85% of maximum predicted heart rate (MPHR, see
below) in the absence of typical angina or ischaemic ST segment depression.
• Concurrent beta blockade (or calcium antagonist) therapy (relative indication).
• The presence of left bundle branch block (LBBB) or a pacemaker; dobutamine stress is mainly indicated in patients with reactive airway disease (severe chronic obstructive pulmonary disease (COPD) or asthma) who are unable to exercise adequately and in whom vasodilators are contraindicated (adenosine and — indirectly — dipyridamole have the potential to induce bronchospasm in susceptible patients).
12
3.3. STRESS PROTOCOLS
3.3.1. Exercise
• The ECG, heart rate and BP should be carefully monitored and recorded during each stage of exercise as well as during ST segment abnormalities and chest pain. The patient should be continuously monitored for transient rhythm disturbances, ST segment changes and other electrocardiographic manifestations of myocardial ischaemia.
• Since monitoring of a single ECG lead is not sufficient for the detection and recognition of arrhythmias or ischaemic patterns, 12 leads are strongly recommended.
• The goal of exercise is to stress the patient to exhaustion and to the MPHR for their age (220 – age in years = maximum heart rate in beats/min). If the patient is unable to reach MPHR, then 85% of the MPHR is an acceptable target.
• If the increase in heart rate does not reach at least 85% of MPHR, in the absence of typical angina or clearly positive ECG by ST segment criteria, then the patient should be switched to a pharmacological stress protocol, since otherwise the sensitivity of the test would be compromised.
• The most popular methods to exercise patients are the treadmill test or the cycle ergometer. Several protocols can be used — all staged with incremental physical effort to progressively increase oxygen consumption. Modified protocols can be used to evaluate patients with limited exercise capacity, such as elderly individuals, or subjects with higher effort tolerance, such as athletes.
• Professionals conducting the test should judge when the ideal moment to inject the tracer is achieved, being aware that the patient should continue exercising for an additional 1–2 min after injection.
3.3.2. Dipyridamole
• Dipyridamole is commonly used at a dose of 0.56 mg/kg over 4 min, but protocols using an additional 0.28 mg/kg involving an additional 2 min can also be applied, to a maximum total dose of 60 mg.
• Radiopharmaceutical should be injected between 3 and 5 min after termination of dipyridamole (7–9 min from start) [3.15].
• Patients receiving dipyridamole may experience symptoms after completion of the infusion, when they have already left the laboratory. Administration of aminophylline prevents these occurrences in most patients; aminophylline is administered at slow IV push until symptoms
13
resolve, or, in some laboratories, this is done routinely regardless of the occurrence of any effect of the drug. The usual dose is 125 mg, with a maximum total dose up to 250 mg.
3.3.3. Adenosine
• Adenosine is infused IV with a pump at a rate of 140 μg·kg-1·min-1 over 4–6 min. BP, heart rate and ECG must be monitored every minute.
• The radiopharmaceutical is administered IV 2 min into the adenosine infusion when the 4 min protocol is used, or at 3 min into the infusion when the 6 min protocol is used.
• Adenosine has a very short half-life of less than 10 s; this does not necessarily mean that all side effects occurring with adenosine will resolve after cessation of infusion. Once the adenosine receptors have been activated, a cascade of events is triggered, and therefore side effects may last much longer than may be suggested by the drug’s very short half-life.
3.3.4. Selective A2A receptor agonists
• Regadenoson is given as a 10 s bolus, at a fixed dose of 400 μg, administered 30 s prior to tracer injection. Patient monitoring and other measures that apply are the same as for dipyridamole and adenosine, although fewer side effects are expected.5
3.3.5. Dobutamine
• The protocol most commonly used starts with an infusion rate of 10 μg·kg-1·min-1, increasing by an additional dose of 10 μg·kg-1·min-1 every 3 min, to a maximum dose of 40–50 μg·kg-1·min-1.
• The radiopharmaceutical is injected once the target heart rate is achieved, and the infusion of dobutamine is continued for another minute. ECG and BP are monitored at baseline and every 3 min thereafter.
5 The antidote to vasodilators is aminophylline, which blocks adenosine cell membrane receptors. It is given as a slow IV bolus until symptoms resolve, with a maximum dose of 250 mg. In view of the brief half-life of adenosine, termination of the infusion is often (but not always) adequate to manage adverse events. If possible, wait 2–3 min after radiopharmaceutical injection to terminate infusion and give aminophylline. In the case of very severe ischaemic symptoms or signs, administration of nitrates may be necessary, following aminophylline administration. Caution should be taken in patients who have recently used phosphodiesterase inhibitors (e.g. sildenafil).
14

• Atropine may be used to increase the heart rate, starting at the second stage [3.16]. Boluses of 0.5 mg of atropine can be given, with an interval of at least 1 min between boluses, to a maximum dose of 2 mg, in order to increase heart rate. Atropine use is contraindicated in the presence of glaucoma, obstructive uropathy including prostatic hypertrophy, atrial fibrillation with uncontrolled heart rate, and prior adverse reaction to the drug. Patients should also be informed of possible difficulties while driving in the 2 h following atropine administration, due to reduced ocular accommodation.
• The overall complication rate using dobutamine is higher than that for other stressors: one severe adverse reaction every 335 tests was reported in a meta-analysis of 26 438 patients. Moreover, significant supraventricular or ventricular arrhythmias occur in 8–10%.
3.3.6. Combination of vasodilators with low workload physical exercise
• Vasodilators induce dilatation of the splanchnic vasculature, resulting in a higher concentration of radiopharmaceuticals in the liver and intestinal tract. Protocols combining vasodilators (dipyridamole or adenosine) with exercise have been established in the past several years [3.17–3.19].
• Exercise promotes a redistribution of blood flow to the skeletal musculature and away from intra-abdominal organs such as the liver. These effects result in a higher heart-to-background activity ratio on images obtained after exercise, compared with those obtained after vasodilator infusion alone. In addition, reduction of side effects has been described with this strategy. Besides resulting in better image quality, the images can also be acquired earlier after administration of the radiopharmaceutical in patients undergoing a combined exercise/vasodilator protocol compared with the vasodilator alone.
• Indications for combining vasodilator and exercise stress include: (1) inability to exercise to 85% of MPHR, but able to at least walk, and (2) concurrent use of medications that may limit heart rate increase.
• It is important to note that patients with LBBB or a pacemaker should undergo vasodilator stress alone, to reduce the false-positive rate associated with exercise.
• Most patients for the combined protocol are exercised at low workload according to the patient’s abilities, and the tracer is injected at the same time as described for protocols for adenosine or dipyridamole.
15
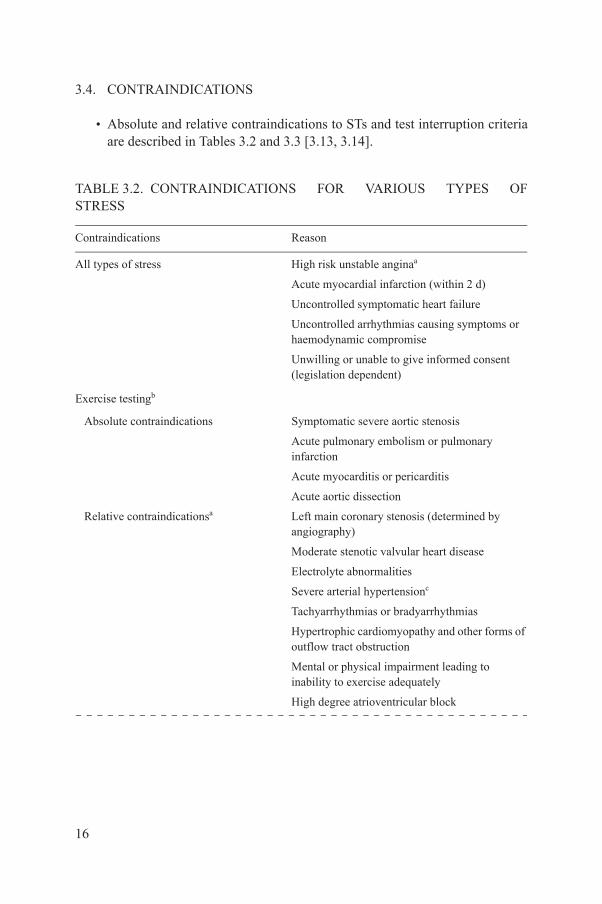
3.4. CONTRAINDICATIONS
• Absolute and relative contraindications to STs and test interruption criteria are described in Tables 3.2 and 3.3 [3.13, 3.14].
TABLE 3.2. CONTRAINDICATIONS FOR VARIOUS TYPES OF STRESS
Contraindications Reason
All types of stress High risk unstable anginaa
Acute myocardial infarction (within 2 d)
Uncontrolled symptomatic heart failure
Uncontrolled arrhythmias causing symptoms or haemodynamic compromise
Unwilling or unable to give informed consent (legislation dependent)
Exercise testingb
Absolute contraindications Symptomatic severe aortic stenosis
Acute pulmonary embolism or pulmonary infarction
Acute myocarditis or pericarditis
Acute aortic dissection
Relative contraindicationsa Left main coronary stenosis (determined by angiography)
Moderate stenotic valvular heart disease
Electrolyte abnormalities
Severe arterial hypertensionc
Tachyarrhythmias or bradyarrhythmias
Hypertrophic cardiomyopathy and other forms of outflow tract obstruction
Mental or physical impairment leading to inability to exercise adequately
High degree atrioventricular block
16
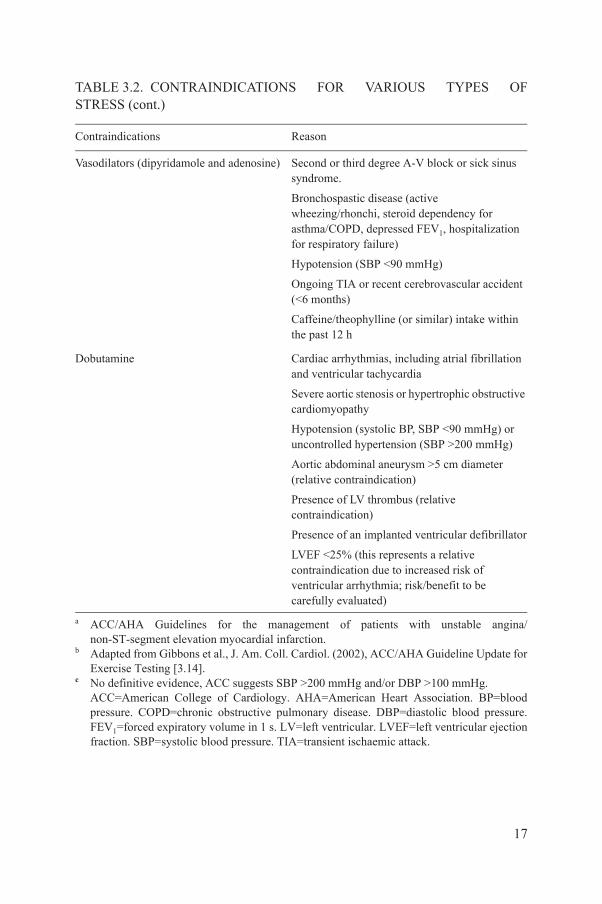
Vasodilators (dipyridamole and adenosine) Second or third degree A-V block or sick sinus syndrome.
Bronchospastic disease (active wheezing/rhonchi, steroid dependency for asthma/COPD, depressed FEV1, hospitalization for respiratory failure)
Hypotension (SBP <90 mmHg)
Ongoing TIA or recent cerebrovascular accident (<6 months)
Caffeine/theophylline (or similar) intake within the past 12 h
Dobutamine Cardiac arrhythmias, including atrial fibrillation and ventricular tachycardia
Severe aortic stenosis or hypertrophic obstructive cardiomyopathy
Hypotension (systolic BP, SBP <90 mmHg) or uncontrolled hypertension (SBP >200 mmHg)
Aortic abdominal aneurysm >5 cm diameter (relative contraindication)
Presence of LV thrombus (relative contraindication)
Presence of an implanted ventricular defibrillator
LVEF <25% (this represents a relative contraindication due to increased risk of ventricular arrhythmia; risk/benefit to be carefully evaluated)
a ACC/AHA Guidelines for the management of patients with unstable angina/ non-ST-segment elevation myocardial infarction.
b Adapted from Gibbons et al., J. Am. Coll. Cardiol. (2002), ACC/AHA Guideline Update for Exercise Testing [3.14].
c No definitive evidence, ACC suggests SBP >200 mmHg and/or DBP >100 mmHg.ACC=American College of Cardiology. AHA=American Heart Association. BP=blood pressure. COPD=chronic obstructive pulmonary disease. DBP=diastolic blood pressure. FEV1=forced expiratory volume in 1 s. LV=left ventricular. LVEF=left ventricular ejection fraction. SBP=systolic blood pressure. TIA=transient ischaemic attack.
TABLE 3.2. CONTRAINDICATIONS FOR VARIOUS TYPES OF STRESS (cont.)
Contraindications Reason
17

TABLE 3.3. CRITERIA FOR EARLY TERMINATION OF EXERCISE TESTING
Indications Reason
Absolute indications for interruption Drop in SBP >10 mmHg from baseline SBP despite an increase in workload, when accompanied by other evidence of ischaemia
Moderate to severe ischaemia in ECG(ST depression >3 mm)
Increasing nervous system symptoms(e.g. ataxia, dizziness, or near-syncope)
Signs of poor peripheral perfusion
Technical difficulties in monitoring ECG or SBP
Patient’s request to stop
Sustained ventricular tachycardia
ST segment elevation (1 mm) in leads without diagnostic Q-waves (other than V1 or aVR)
Relative indications for interruption ST or QRS changes such as excessive ST segment depression (>2 mm of horizontal or downslopingST segment depression) or marked axis shift
Arrhythmias other than sustained ventricular tachycardia, including multifocal PVCsa, triplets of PVCs, supraventricular tachycardia, heart block or bradyarrhythmias
Fatigue, shortness of breath, wheezing, leg cramps or claudication
Development of bundle branch block or IVCD that cannot be distinguished from ventricular tachycardia.
Increasing chest pain.
Hypertensive response (SBP >250 mmHg and/or DBP >115 mmHg).
ACC=American College of Cardiology. AHA=American Heart Association. DBP=diastolic blood pressure. ECG=electrocardiography. SBP=systolic blood pressure. ST=stress test.PVCs=premature ventricular contractions. IVCD=intraventricular conduction delay. Reproduced with permission (with modifications) from Gibbons et al., J. Am. Coll. Cardiol. (2002), ACC/AHA Guideline Update for Exercise Testing [3.14]. www.acc.org.
18

3.5. OPTIMIZATION OF STs IN MPI
In summary, there are two main options available available to suit the clinical condition of the patient and the available resources, in terms of stress agents and radiopharmaceuticals. A schematic suggested workflow for the optimization of STs with the use of MPI is presented in Fig. 3.1.
3.6. RADIOPHARMACEUTICALS AND IMAGING PROTOCOLS
3.6.1. 99mTc-MIBI and 99mTc-tetrofosmin
• The perfusion imaging agents now most commonly used clinically are 99mTc-MIBI (methoxyisobutylisonitrile) and 99mTc-tetrofosmin. The recommended administered activities for administration are shown in Figs 3.2–3.4 and expressed in mCi, with 10 mCi representing 370 MBq.
Pharmacological test
Complete test
Switch to pharmacological test
Exercise test
Contraindications tovasodilators
FIG. 3.1. Optimization of STs in MPI. CAD: coronary artery disease. ECG: electrocardiogram. HR: heart rate.
19
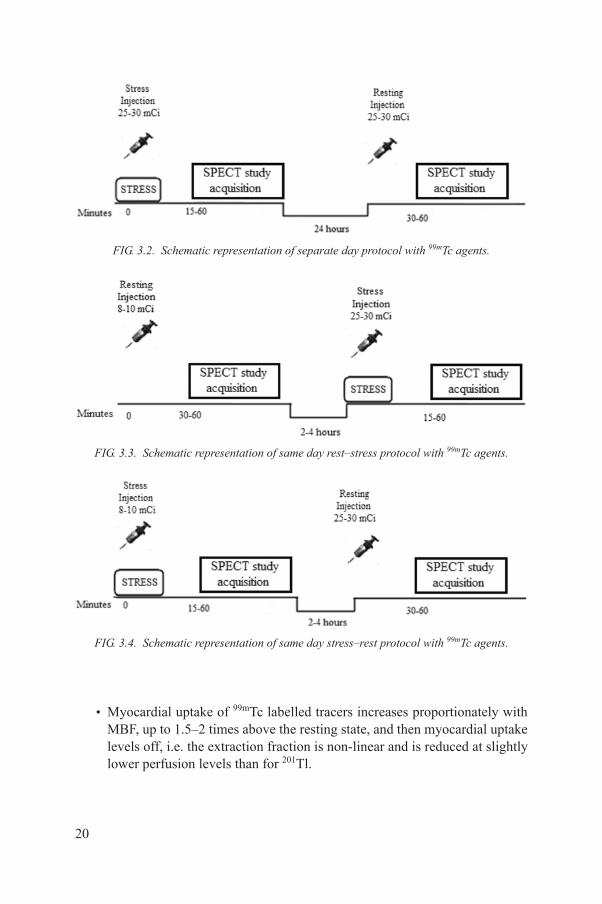
• Myocardial uptake of 99mTc labelled tracers increases proportionately with MBF, up to 1.5–2 times above the resting state, and then myocardial uptake levels off, i.e. the extraction fraction is non-linear and is reduced at slightly lower perfusion levels than for 201Tl.
FIG. 3.2. Schematic representation of separate day protocol with 99mTc agents.
FIG. 3.3. Schematic representation of same day rest–stress protocol with 99mTc agents.
FIG. 3.4. Schematic representation of same day stress–rest protocol with 99mTc agents.
20

• Unlike 201Tl, 99mTc-MIBI and tetrofosmin have no significant redistribution, and separate injections are given to assess stress and resting perfusion. The 6 h half-life of 99mTc means that the two studies should ideally be performed on separate days to allow for the decay of activity from the first injection.
3.6.2. Imaging protocols for 99mTc agents
• Two day protocol: This is theoretically the most preferable protocol because it provides the best quality images (Fig. 3.2). Studies are obtained using the same administered activity for each. This not only facilitates a comparison between both studies but also keeps the total radiation burden to the patient (and to the staff) at a lower level than that of the single day protocol.
• Single day protocol: The order of studies on a single day protocol depends to some extent on the indication for the investigation. If the indication is to detect viable myocardium and reversibility of a defect, in a patient with previous infarction, it may theoretically be preferable to perform the resting study first. Conversely, when the study is performed for the diagnosis of myocardial ischaemia, the stress study should be performed first, in order to avoid reducing the contrast of a stress-induced defect by a previous normal resting study, and if the stress image is totally normal, resting imaging might not be required. Single or same day protocols may also be used for the patient’s convenience (Figs 3.3 and 3.4).
• Acquisition: Image acquisition using 99mTc agents should begin 30–40 min after exercise injection, to allow for hepatobiliary clearance; longer delays are generally required both for resting images and for stress with vasodilators alone because of the higher subdiaphragmatic tracer activity.
• Nitrates: If the patient is referred for viability evaluation, or in a patient with a severe uptake defect on stress images, sublingual glyceryl trinitrate, usually at a dose of 400–800 μg (or isosorbide dinitrate 10 mg) can be administered at least 5 min before radiotracer injection, in order to maximize resting perfusion and to increase the correspondence of the resting images with myocardial viability. Nitrates are ideally given with the patient in the supine position, to avoid symptomatic hypotension. When SBP is ≤90 mmHg, nitrates are not recommended.
• Intake of fluid, such as plain water, can be used in an attempt to clear intestinal activity. Fatty meals were initially recommended with 99mTc tracers in order to accelerate hepatobiliary clearance of activity; however, today most laboratories try to avoid this since gallbladder contraction after a meal produces a large amount of activity to be excreted into the intestinal lumen, with unpredictable consequences on image quality.
21
• Medication such as beta blockers can modify parameters of LV function (volumes and ejection fraction (EF)). Therefore, patients should ideally be kept under the same medication between the two sets of images, or these differences should be taken into account during the study interpretation.
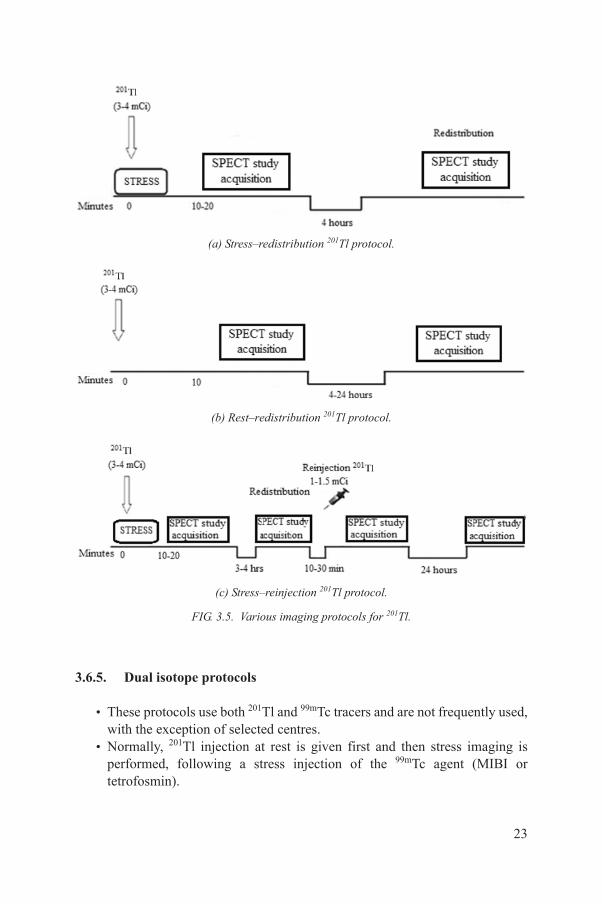
3.6.3. 201Tl
• After IV injection at stress, 201Tl is distributed in the myocardium according to myocardial perfusion and viability. Myocardial uptake of 201Tl increases proportionately with perfusion, up to 2–2.5 times above the rest levels, and then a plateau is reached.
• 201Tl subsequently redistributes from its initial distribution over several hours; thus, late images will reflect both rest perfusion and viability, to be acquired usually 3–4 h after injection.
• Comparison between the stress and redistribution images distinguishes between the reversible defect of inducible hypoperfusion and the fixed defect of myocardial necrosis.
• In some cases, redistribution may be incomplete at 4 h; a second injection of 201Tl can then be given and reinjection images acquired for a more accurate assessment of myocardial viability.
• Different imaging protocols can be followed, depending on clinical indication(s) and local practices: stress–redistribution, stress–reinjection, stress–redistribution–reinjection, stress–reinjection with delayed 24 h imaging, rest–redistribution.
3.6.4. Imaging protocols for 201Tl
• Stress imaging should begin within 5–10 min of tracer injection and should be finished within 30 min of injection.
• Redistribution imaging should be performed after 3–4 h delay.• Late imaging can also be performed 24 h after injection, using a longer
acquisition time for the assessment of myocardial viability.• Reinjection: In patients with severe perfusion defects in the stress images,
or if redistribution is thought to be incomplete at the time of redistribution imaging, a resting injection can be given (ideally after sublingual nitrates), with imaging after a further 60 min of redistribution.
The recommended protocols for imaging 201Tl are shown in Fig 3.5. The doses are expressed mCi, with 10 mCi representing 370 MBq.
22
3.6.5. Dual isotope protocols
• These protocols use both 201Tl and 99mTc tracers and are not frequently used, with the exception of selected centres.
• Normally, 201Tl injection at rest is given first and then stress imaging is performed, following a stress injection of the 99mTc agent (MIBI or tetrofosmin).
(a) Stress–redistribution 201Tl protocol.
(b) Rest–redistribution 201Tl protocol.
(c) Stress–reinjection 201Tl protocol.
FIG. 3.5. Various imaging protocols for 201Tl.
23
• Imaging can be performed simultaneously, taking advantage of the different energy windows used for each isotope; however, image quality can be compromised due to downscatter of 99mTc photons into the 201Tl window.
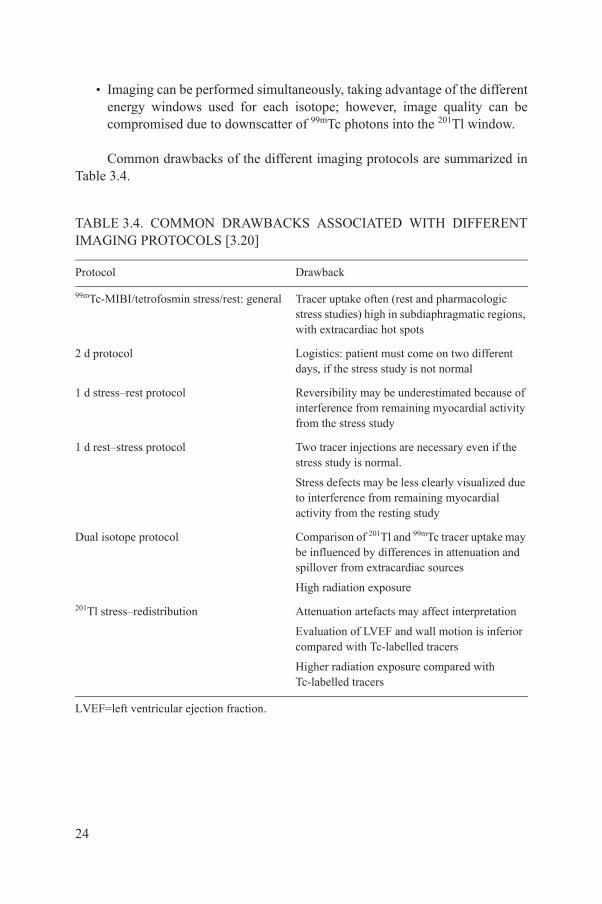
Common drawbacks of the different imaging protocols are summarized in Table 3.4.
TABLE 3.4. COMMON DRAWBACKS ASSOCIATED WITH DIFFERENT IMAGING PROTOCOLS [3.20]
Protocol Drawback
99mTc-MIBI/tetrofosmin stress/rest: general Tracer uptake often (rest and pharmacologic stress studies) high in subdiaphragmatic regions, with extracardiac hot spots
2 d protocol Logistics: patient must come on two different days, if the stress study is not normal
1 d stress–rest protocol Reversibility may be underestimated because of interference from remaining myocardial activity from the stress study
1 d rest–stress protocol Two tracer injections are necessary even if the stress study is normal.
Stress defects may be less clearly visualized due to interference from remaining myocardial activity from the resting study
Dual isotope protocol Comparison of 201Tl and 99mTc tracer uptake may be influenced by differences in attenuation and spillover from extracardiac sources
High radiation exposure
201Tl stress–redistribution Attenuation artefacts may affect interpretation
Evaluation of LVEF and wall motion is inferior compared with Tc-labelled tracers
Higher radiation exposure compared withTc-labelled tracers
LVEF=left ventricular ejection fraction.
24
REFERENCES
[3.1] KIM, C., KWOK, Y.S., HEAGRTY, P., REDBERG, R., Pharmacologic stress testing for coronary disease diagnosis: A meta-analysis, Am. Heart J. 142 (2001) 934–944.
[3.2] MARWICK, T., et al., Selection of the optimal nonexercise stress for the evaluation of ischemic regional myocardial dysfunction and malperfusion: Comparison of dobutamine and adenosine using echocardiography and 99mTc-MIBI single photon emission computed tomography, 87 (1993) 345–354.
[3.3] ISKANDRIAN, A.S., HEO, J., KONG, B., LYONS, E., Effect of exercise level on the ability of thallium-201 tomographic imaging in detecting coronary artery disease: Analysis of 461 patients, J. Am. Coll. Cardiol. 14 (1989) 1477–1486.
[3.4] STRATMANN, H.G., TAMESIS, B.R., YOUNIS, L.T., WITTREY, M.D., MILLER, D.D., Prognostic value of dipyridamole technetium-99m sestamibi myocardial tomography in patients with stable chest pain who are unable to exercise, Am. J. Cardiol. 73 (1994) 647–652.
[3.5] HELLER, G.V., et al., Independent prognostic value of intravenous dipyridamole with technetium-99m sestamibi tomographic imaging in predicting cardiac events and cardiac-related hospital admissions, J. Am. Coll. Cardiol. 26 (1995) 1202–1208.
[3.6] CRAMER, M.J., et al., Comparison of adenosine and high-dose dipyridamole both combined with low-level exercise stress for 99Tcm-MIBI SPECT myocardial perfusion imaging, Nucl. Med. Commun. 17 (1996) 97–104.
[3.7] LEE, T.H., BOUCHER, C.A., Clinical practice, Non-invasive tests in patients with stable coronary artery disease, N. Engl. J. Med. 344 (2001) 1840–1845.
[3.8] ISKANDRIAN, A.E., et al., Adenosine versus regadenoson comparative evaluation in myocardial perfusion imaging: Results of the ADVANCE phase 3 multicenter international trial, J. Nucl. Cardiol. 14 (2007) 645–658.
[3.9] THOMAS, G.S., TAMMELIN, B.B., SCHIFFMAN, G.L., et al., Safety of regadenoson, a selective adenosine A2A agonist, in patients with chronic obstructive pulmonary disease: A randomized, double-blind, placebo-controlled trial (RegCOPD trial), J. Nucl. Cardiol. 15 (2008) 319–328.
[3.10] GELEIJNSE, M.L., ELHENDY, A., FIORETTI, P.M., ROELANDT, J.R., Dobutamine stress myocardial perfusion imaging, J. Am. Coll. Cardiol. 36 (2000) 2017–2027.
[3.11] BØTTCHER, M., et al., Effect of antianginal medication on resting myocardial perfusion and pharmacologically induced hyperemia, J. Nucl. Cardiol. 10 (2003) 345–352.
[3.12] ZOGHBI, G.J., et al., Effect of caffeine on ischemia detection by adenosine single-photon emission computed tomography perfusion imaging, J. Am. Coll. Cardiol. 47 (2006) 2296–302.
[3.13] GIBBONS, R.J., et al., ACC/AHA guidelines for exercise testing, a report of the American College of Cardiology/American Heart Association Task Force on Practice Guidelines (Committee on Exercise Testing), J. Am. Coll. Cardiol. 30 (1997) 260–311.
[3.14] GIBBONS, R.J., et al., ACC/AHA 2002 Guideline Update for Exercise Testing: Summary article, a report of the American College of Cardiology/American Heart Association Task Force on Practice Guidelines (Committee to Update the 1997 Exercise Testing Guidelines), Circulation 106 (2002) 1883–1892.
25

[3.15] HENZLOVA, M.J., CERQUEIRA, M.D., HANSEN, C.L., TAILLEFER, R., YAO, S.S., ASNC imaging guidelines for nuclear cardiology procedures, J. Nucl. Cardiol. 16 (2009).
[3.16] GELEIJNSE, M.L., et al., Prognostic value of dobutamine-atropine stress technetium-99m sestamibi perfusion scintigraphy in patients with chest pain, J. Am. Coll. Cardiol. 28 (1996) 447–454.
[3.17] CASALE, P.N., GUINEY, T.E., STRAUSS, H.W., BOUCHER, C.A., Simultaneous low level treadmill exercise and intravenous dipyridamole stress thallium imaging, Am. J. Cardiol. 62 (1988) 799–802.
[3.18] THOMAS, G.S., et al., Treadmill exercise during adenosine infusion is safe, results in fewer adverse reactions, and improves myocardial perfusion image quality, J. Nucl. Cardiol. 7 (2000) 439–446.
[3.19] THOMAS, G.S., et al., The RegEx trial: A randomized, double-blind, placebo- and active-controlled pilot study combining regadenoson, a selective A(2A) adenosine agonist, with low-level exercise, in patients undergoing myocardial perfusion imaging, J. Nucl. Cardiol. 16 (2009) 63–72.
[3.20] HENZLOVA, M.J., et al., Quality Assurance Committee of the American Society of Nuclear Cardiology, Stress protocols and tracers, J. Nucl. Cardiol. 13 (2006) 80–90.
26

4. ACQUISITION AND PROCESSING OF MPI STUDIES
4.1. ACQUISITION
4.1.1. General recommendations
• The procedure should be explained to the patient before commencing.• Implanted radiopaque objects (pacemakers, silicone implants, etc.) should
be noted as potential attenuators.• Patients should be frequently observed until the acquisition is completed.• Female patients might be required to remove their brassiere.• SPECT is currently the standard technique for MPI studies; planar
acquisition is generally no longer accepted for this procedure.• A list of acquisition parameters is presented in Table 4.1.
4.1.2. Patient positioning
• The patient’s arms must be positioned away from the field of view (at least the left arm) and the position must be the same in both acquisitions (stress rest). If available, supporting devices appropriate for gamma cameras can be used for the patient’s comfort.
TABLE 4.1. ACQUISITION PARAMETERS FOR ACQUISITION IN MPI [4.1, 4.2]
Isotope 201Tl 99mTc
Energy window 25–30% symm, 72–75 KeV20% symm, 167 KeV
15–20% symm, 140 KeV
Collimators LEGP LEHR
Rotation (1 or 2 head) 180º (optional 360º for triple head) (45 RAO to 45 LPO)
Acquisition type Step and shoot
Number of projections (pr), 180º 32 or 64 60 or 64
Time per projection 40 s (32 pr)25 s (64 pr)
2 d protocol: 25 s1 d protocol: 1st (low dose),25 s; 2nd (high dose), 20 s
LEGP=low energy general purpose. LEHR=low energy high resolution. LPO=left posterior oblique. RAO=right anterior oblique. Symm=symmetric.
27

• The supine position is commonly used. The prone position is recommended when the patient demonstrates significant motion during supine acquisition and if there is an equivocal perfusion defect in the inferior wall. However, it should be noted that the prone position might also produce artefacts.
4.1.3. Field of view
• It is imperative that the area of interest (i.e. the heart) is included in every projection image. If it is not, the resulting truncation of the images will produce artefacts in the final reconstructed images.
• Special caution should be taken when using magnification factor (zoom).
4.1.4. Orbit
• A 180º orbit (45º right anterior oblique, right anterior oblique to 45º left posterior oblique) is recommended for single and dual detector systems.
• For a 180º acquisition with dual head cameras, detectors should be in a 90º configuration. The majority of cameras allow the configuration to be adapted (i.e. 75%) depending on the contours of the patient. The main orbit options are circular and non-circular (elliptical or body contoured).
• Non-circular orbits follow the contour of the patient, bringing the camera closer to the chest, thereby improving spatial resolution, but may suffer from reconstruction artefacts due to changes in spatial resolution [4.3].
• Circular orbits maintain a fixed radius of rotation but — on average — result in the detector being further from the patient. In general, there is reduced (but more uniform) spatial resolution with circular orbits, since the detector-to-source distance is greater (yet constant) with this technique.
• When available, the use of a non-circular orbit with body autocontouring is recommended.
4.1.5. Acquisition type
• The camera may move in a continuous motion during acquisition but typically it should remain stationary during the acquisition of each projection image, before advancing to the next position in a ‘step and shoot’ mode of operation, in order to avoid degradation of resolution.
• An alternative can be the ‘continuous step and shoot’ mode, which slightly improves the count statistics for a given scan time, even though there is a slight loss in angular resolution [4.4, 4.5].
28
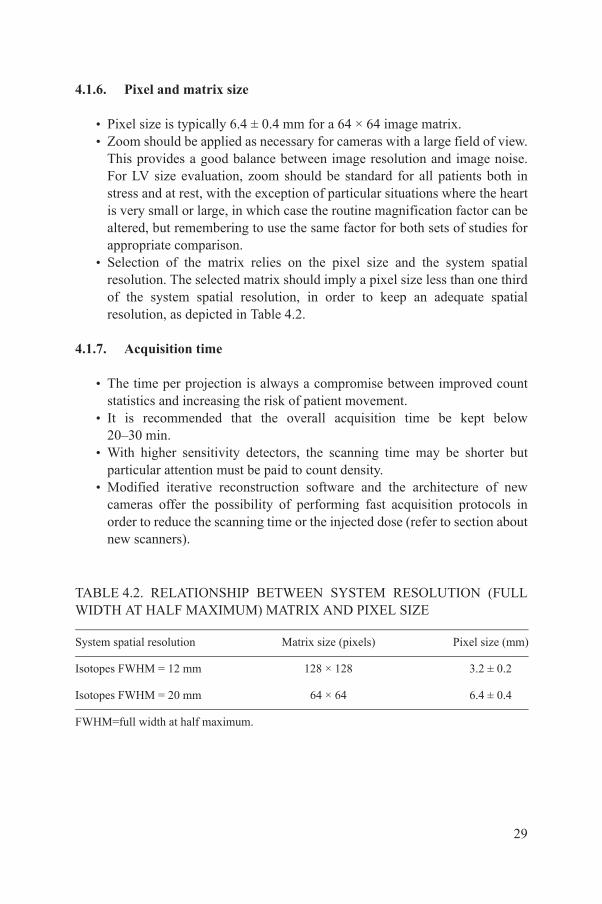
4.1.6. Pixel and matrix size
• Pixel size is typically 6.4 ± 0.4 mm for a 64 × 64 image matrix.• Zoom should be applied as necessary for cameras with a large field of view.
This provides a good balance between image resolution and image noise. For LV size evaluation, zoom should be standard for all patients both in stress and at rest, with the exception of particular situations where the heart is very small or large, in which case the routine magnification factor can be altered, but remembering to use the same factor for both sets of studies for appropriate comparison.
• Selection of the matrix relies on the pixel size and the system spatial resolution. The selected matrix should imply a pixel size less than one third of the system spatial resolution, in order to keep an adequate spatial resolution, as depicted in Table 4.2.
4.1.7. Acquisition time
• The time per projection is always a compromise between improved count statistics and increasing the risk of patient movement.
• It is recommended that the overall acquisition time be kept below 20–30 min.
• With higher sensitivity detectors, the scanning time may be shorter but particular attention must be paid to count density.
• Modified iterative reconstruction software and the architecture of new cameras offer the possibility of performing fast acquisition protocols in order to reduce the scanning time or the injected dose (refer to section about new scanners).
TABLE 4.2. RELATIONSHIP BETWEEN SYSTEM RESOLUTION (FULL WIDTH AT HALF MAXIMUM) MATRIX AND PIXEL SIZE
System spatial resolution Matrix size (pixels) Pixel size (mm)
Isotopes FWHM = 12 mm 128 × 128 3.2 ± 0.2
Isotopes FWHM = 20 mm 64 × 64 6.4 ± 0.4
FWHM=full width at half maximum.
29
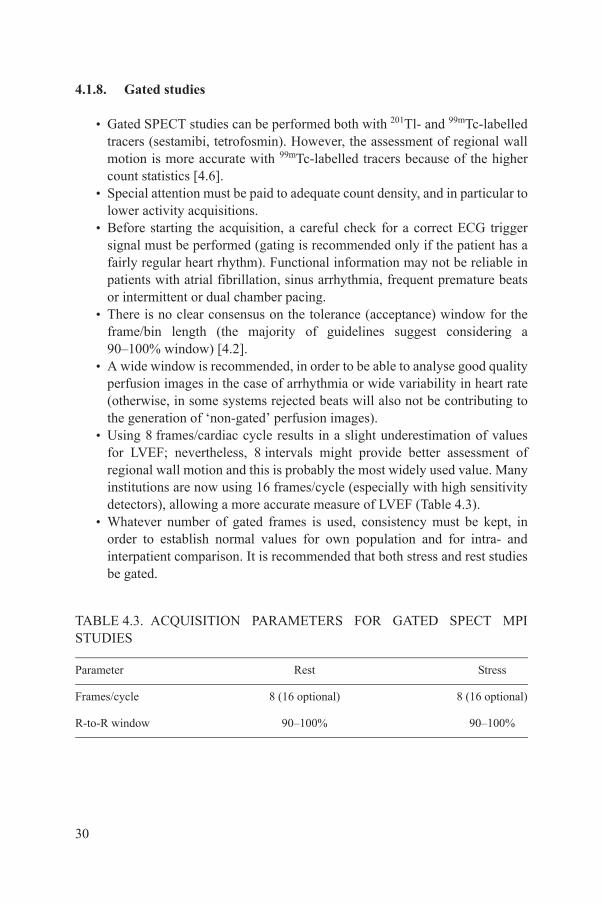
4.1.8. Gated studies
• Gated SPECT studies can be performed both with 201Tl- and 99mTc-labelled tracers (sestamibi, tetrofosmin). However, the assessment of regional wall motion is more accurate with 99mTc-labelled tracers because of the higher count statistics [4.6].
• Special attention must be paid to adequate count density, and in particular to lower activity acquisitions.
• Before starting the acquisition, a careful check for a correct ECG trigger signal must be performed (gating is recommended only if the patient has a fairly regular heart rhythm). Functional information may not be reliable in patients with atrial fibrillation, sinus arrhythmia, frequent premature beats or intermittent or dual chamber pacing.
• There is no clear consensus on the tolerance (acceptance) window for the frame/bin length (the majority of guidelines suggest considering a 90–100% window) [4.2].
• A wide window is recommended, in order to be able to analyse good quality perfusion images in the case of arrhythmia or wide variability in heart rate (otherwise, in some systems rejected beats will also not be contributing to the generation of ‘non-gated’ perfusion images).
• Using 8 frames/cardiac cycle results in a slight underestimation of values for LVEF; nevertheless, 8 intervals might provide better assessment of regional wall motion and this is probably the most widely used value. Many institutions are now using 16 frames/cycle (especially with high sensitivity detectors), allowing a more accurate measure of LVEF (Table 4.3).
• Whatever number of gated frames is used, consistency must be kept, in order to establish normal values for own population and for intra- and interpatient comparison. It is recommended that both stress and rest studies be gated.
TABLE 4.3. ACQUISITION PARAMETERS FOR GATED SPECT MPI STUDIES
Parameter Rest Stress
Frames/cycle 8 (16 optional) 8 (16 optional)
R-to-R window 90–100% 90–100%
30
4.1.9. Quality assurance (QA)
QA is crucial to all aspects of nuclear medicine practice, including the measurement of radioactivity, the preparation of radiopharmaceuticals, the use of instrumentation to obtain images, computations to calculate functional parameters, and interpretation of the results by the physician. It plays an integral part in fulfilling the regulatory requirement for establishing a comprehensive QA programme as described in the International Basic Safety Standards for Protection against Ionizing Radiation and for the Safety of Radiation Sources [4.7]. It is strongly recommended that attention be given to the literature cited in IAEA Human Health Series No. 6 regarding QA for SPECT systems [4.8].
4.2. PROCESSING
4.2.1. Motion correction
• Quality control (QC) of cardiac studies implies primarily the evaluation of the presence of motion during acquisition [4.9]. If motion is present to a significant degree, it is suggested the acquisition is repeated; an alternative may be the use of motion correction software.
• A number of motion correction packages are available from different manufacturers. It should be noted that these methods only correct relatively simple forms of motion such as motion in the longitudinal axis. More complex patterns of motion involving rotational motion cannot be adequately corrected using current methods.
• It has been demonstrated that movement by 1 pixel does not produce significant artefacts in the reconstructed images [4.10, 4.11]. Correction of significant motion should be attempted by software but if this is not possible, the entire acquisition should be repeated, also considering the prone position.
• Images must be reviewed immediately after acquisition to check for motion and extracardiac hot spots, before the patient is discharged from the department.
4.2.2. Image reconstruction
• Both filtered back projection (FBP) and iterative methods are useful but the latter (such as maximum likelihood expectation minimization (MLEM) or ordered subset expectation maximization (OSEM)) are preferred, since they offer more accurate modelling of physical processes and reduce noise
31
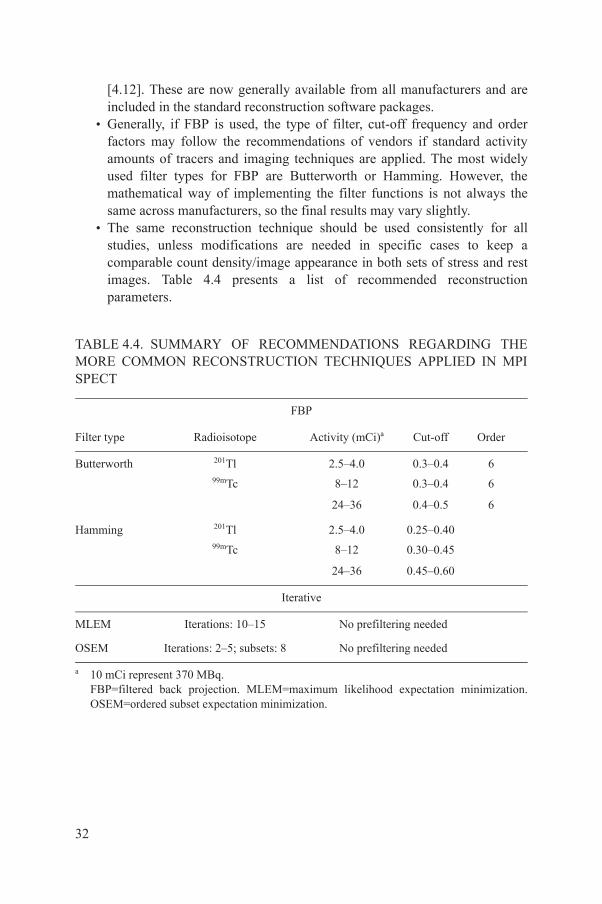
[4.12]. These are now generally available from all manufacturers and are included in the standard reconstruction software packages.
• Generally, if FBP is used, the type of filter, cut-off frequency and order factors may follow the recommendations of vendors if standard activity amounts of tracers and imaging techniques are applied. The most widely used filter types for FBP are Butterworth or Hamming. However, the mathematical way of implementing the filter functions is not always the same across manufacturers, so the final results may vary slightly.
• The same reconstruction technique should be used consistently for all studies, unless modifications are needed in specific cases to keep a comparable count density/image appearance in both sets of stress and rest images. Table 4.4 presents a list of recommended reconstruction parameters.
TABLE 4.4. SUMMARY OF RECOMMENDATIONS REGARDING THE MORE COMMON RECONSTRUCTION TECHNIQUES APPLIED IN MPI SPECT
FBP
Filter type Radioisotope Activity (mCi)a Cut-off Order
Butterworth 201Tl 2.5–4.0 0.3–0.4 699mTc 8–12 0.3–0.4 6
24–36 0.4–0.5 6
Hamming 201Tl 2.5–4.0 0.25–0.4099mTc 8–12 0.30–0.45
24–36 0.45–0.60
Iterative
MLEM Iterations: 10–15 No prefiltering needed
OSEM Iterations: 2–5; subsets: 8 No prefiltering needed
a 10 mCi represent 370 MBq.FBP=filtered back projection. MLEM=maximum likelihood expectation minimization. OSEM=ordered subset expectation minimization.
32
4.2.3. Reorientation
• A critical phase of myocardial processing is reorientation of tomographic data into the natural approximate symmetry axes of an individual patient’s heart. This is performed either manually or automatically.
• Automated methods of reorientation are available and have been shown to be at least as accurate as trained operators and may achieve greater reproducibility and results in sectioning the data into vertical long axis (VLA), horizontal long axis (HLA) and short axis (SA) planes [4.13, 4.14].
• Inappropriate plane selections can result in misaligned myocardial walls between rest and stress datasets, potentially resulting in artefacts and incorrect interpretation.
• All axis choices must be available as QC screens, in order to verify that axes were selected properly.
4.2.4. Image display
• Stress and rest images should be appropriately aligned and presented in a format that allows ready comparison.
• Each SPECT study should be displayed with the top of the colour scale at the maximum count/pixel within the myocardium for each set of images. It is recommended to use a linear colour scale or a grey scale.
• Displays with the top of the colour scale at the maximum of each individual tomogram and those that use the same maximum for stress and rest images should not be used [4.15].
• The bottom end of the colour scale should be set to zero and background subtraction should be avoided.
• Care should be taken if the pixel with maximum counts lies outside the myocardium, in which case manual adjustment or masking of extracardiac activity may be required. Removal of subdiaphragmatic activity should be attempted for final display.
• Three sets of axes should be displayed: SA slices from apex to base, VLA from septal to lateral and HLA slices from inferior to anterior wall. Sequential images (stress and rest) should be aligned and adjacent to each other serially.
• Normalization: Each series of stress, rest (and/or redistribution in the case of 201Tl) should be normalized to the brightest pixel in the entire series separately.
33

4.2.5. Quantification
This is an extremely valuable tool in MPI, as it provides an objective assessment of the parameters under investigation, conveys the degree of severity of the parameter, and thus aids the physician in the interpretation of results and eventually allows further appropriate action to be taken, based on these results. It is adequate for follow-up when the same software is used. There are several commercially available software packages; among them the most extensively used are: Cedars Sinai (QGS, QPS) (Los Angeles, California); Emory Cardiac Toolbox (Atlanta, Georgia) and 4DM SPECT (Invia, Ann Arbor, Michigan). These methods have been extensively validated, but their use is not fully interchangeable [4.16–4.18]. For further reference, see Figs 5.8 and 5.9.
4.2.6. Perfusion defect size
A perfusion defect (stress and rest) is usually considered as significant when the perfusion intensity is less than 2.5 standard deviations below that of the normal database. The extent of defects can generally be calculated in one of two ways:
• Quantification by percentage size of the LV (% terms, limits 0–100%):° Small (0–10%);° Medium (>10% to 20%);° Large (>20% to 40%);° Very large (>40%).
• Quantification by number of segments in a 17 or 20 segment model 4.19. In a 20 segment model, each segment would represent 5%; in the 17 segment model, each segment would represent 5.9%. The summed score for both stress and rest images is then calculated (integer) based on the severity and size of defect. When available, the 17 segment model is recommended (see Fig. 5.9).
4.2.7. Perfusion defect severity
The perfusion defect severity is also extremely important. It can be divided and scored into (Fig. 4.1):
• Absent update = 4;• Severely reduced uptake = 3;• Moderately reduced uptake = 2;• Mildly reduced uptake = 1;• Normal uptake = 0.
34

4.2.8. Summed scores
The difference between the stress and rest defect size and severity is considered the size and severity of ischaemia, which should be reported routinely as it has a significant prognostic value. It is important to highlight that although the scores serve as reference for the interpretation of the MPI studies, they should always be analysed in addition to the images. The value can best be expressed in terms of score numbers:
Summed scores = severity score of each defect × number of segments with defect
In this way, three scores are computed, either manually or automatically through the available software:
• Summed stress score: This represents the perfusion defect seen at stress but does not distinguish between ischaemia and infarction.
• Summed rest score: This is considered equal to the magnitude of a fixed defect, and hence represents — in most cases — the size and severity of a myocardial infarction (although in some cases this may prove to be due to the presence of hibernating myocardium with viability).
• Summed difference score: This is the most important parameter in terms of prognosis, and expresses the magnitude of ischaemia (reversibility).
Mild reduction(60–80%)Score 1 Normal
(>80%)Score 0
Moderate reduction(50–60%)Score 2
Severe reduction(>50%)Score 3
FIG. 4.1. Perfusion defect severity scoring of MPI.
35
• It is generally accepted to consider a summed score ≤3 consistent with a normal result; while 4–8 is a mild defect, 9–12 is a moderate defect and >12 is a severe defect. However, interpretation of summed scores should be consistent with the visual analysis of the images, since there are several possible pitfalls in the score calculation, especially when it is derived from automated software.
4.2.9. Polar maps
The location of perfusion defects, based on the 17 or 20 segment model, must be registered as well. This is best achieved through the polar maps (Bull’s eye), which are 2-D representations of the 3-D distribution of activity in the myocardium. Stress, rest and ‘reversibility’ maps are widely used to represent the distribution of activity through the different walls of the myocardium and the location of defects, sometimes with correlation with the three main coronary territories.
4.2.10. LVEF
Gated MPI using either 8 or 16 frames can be used to automatically calculate LVEF, derived from estimating the LV end-diastolic and end-systolic volumes (LVEDV and LVESV). The measure is highly reproducible and adds significantly to the overall interpretation of the study and its clinical impact, especially in terms of prognosis. Post-stress and rest LVEF should be registered, as well as the difference between both values (so-called delta EF).
• Post-stress EF: Note that since post-stress EF is acquired when the ST has already been terminated and the patient is at ‘rest’, LV function can either reflect the true ‘rest’ state or it can still be undergoing a recovery period if the stress has caused ischaemia. Thus, it should not always be considered either a true ‘stress’ EF or a true ‘rest’ EF. It has been demonstrated that post-stress LVEF has a prognostic value by itself, regardless of the rest EF.
• Rest EF: When using a 2 day protocol, this can be considered a true ‘rest’ EF. However, when using a 1 day protocol and stress is performed first, the ‘rest’ EF can still be under the influence of ischaemia developed during the ST, and thus be lower than a true rest EF in the same patient. Nevertheless, this is infrequent and only expected to occur when ischaemia is very severe.
• Difference between stress EF and rest EF (delta EF): When a significant difference between these two values is encountered, the presence of post-ischaemic myocardial ‘stunning’ should be considered, especially if reversible perfusion defects exist 4.20. Regardless of the absolute values,
36
a stress EF value that is at least 10% lower than the rest EF value is generally considered pathological and is associated with high risk of cardiac events. This parameter is of particular value for protocols using equal doses of radiotracer injection (2 day protocols).
• To ensure that the EF values are reliable, proper gating is required, with a stable regular heart rate during acquisition. LVEF estimation by gated MPI has certain limitations: because of partial volume effect, the estimation of volumes in very small or very large hearts may be compromised, resulting in an erroneously high or low EF respectively. In general, LVEF should be reported as >75% for all values beyond 75% and <15% for all values below 15%. In general, the normal lower limit of LVEF is 50%, although values as low as 45% have been reported in normal patients.
4.2.11. Regional LV function
• Regional wall motion can be visually assessed as:° Normal wall motion = 0;° Mild hypokinesis = 1;° Moderate hypokinesis = 2;° Severe hypokinesis = 3;° Akinesis (infarct) = 4;° Dyskinesis (infarct, aneurysm) = 5.
• Software can now assess the amount of cardiac motion (from diastole to systole) in millimetres of motion in each of the 17/20 segments of the heart, in a fully quantitative manner. Emphasis is again placed on the importance of careful analysis, which should always combine the visual analysis with the software data.
• Regional wall thickening can be assessed quantitatively (percentage wall thickening from diastole to systole) and expressed in scores and colour-scaled polar plots. Wall thickening can be evaluated using a semi-quantitative scale, where:° Normal thickening = 0;° Mild reduction in thickening = 1;° Moderate to severe reduction in thickening = 2;° No thickening = 3.
• Phase analysis of gated MPI studies has been applied to investigate asynchronous myocardial contraction and is now available in certain software packages. The method has been proven useful in assessing the need for resynchronization therapy and to evaluate its results.
37
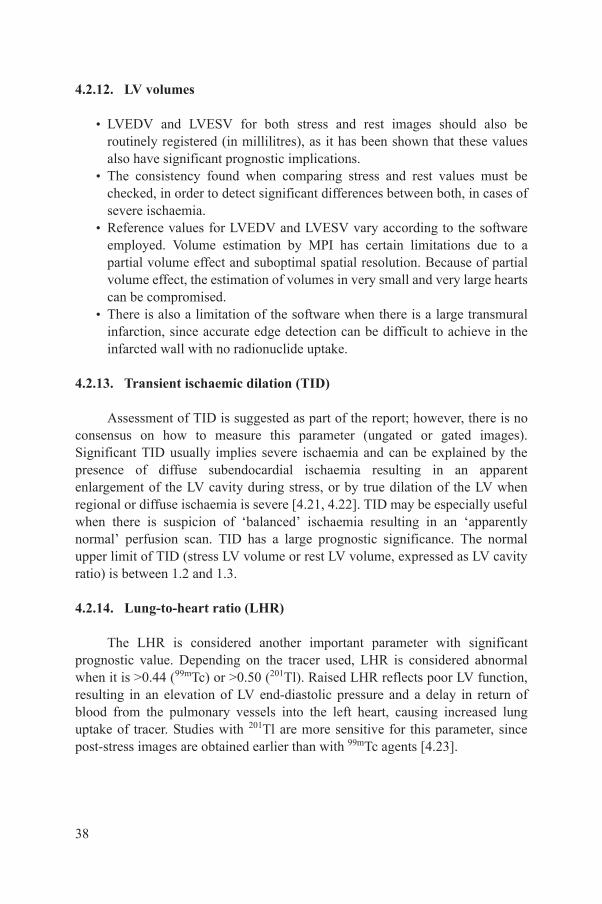
4.2.12. LV volumes
• LVEDV and LVESV for both stress and rest images should also be routinely registered (in millilitres), as it has been shown that these values also have significant prognostic implications.
• The consistency found when comparing stress and rest values must be checked, in order to detect significant differences between both, in cases of severe ischaemia.
• Reference values for LVEDV and LVESV vary according to the software employed. Volume estimation by MPI has certain limitations due to a partial volume effect and suboptimal spatial resolution. Because of partial volume effect, the estimation of volumes in very small and very large hearts can be compromised.
• There is also a limitation of the software when there is a large transmural infarction, since accurate edge detection can be difficult to achieve in the infarcted wall with no radionuclide uptake.
4.2.13. Transient ischaemic dilation (TID)
Assessment of TID is suggested as part of the report; however, there is no consensus on how to measure this parameter (ungated or gated images). Significant TID usually implies severe ischaemia and can be explained by the presence of diffuse subendocardial ischaemia resulting in an apparent enlargement of the LV cavity during stress, or by true dilation of the LV when regional or diffuse ischaemia is severe [4.21, 4.22]. TID may be especially useful when there is suspicion of ‘balanced’ ischaemia resulting in an ‘apparently normal’ perfusion scan. TID has a large prognostic significance. The normal upper limit of TID (stress LV volume or rest LV volume, expressed as LV cavity ratio) is between 1.2 and 1.3.
4.2.14. Lung-to-heart ratio (LHR)
The LHR is considered another important parameter with significant prognostic value. Depending on the tracer used, LHR is considered abnormal when it is >0.44 (99mTc) or >0.50 (201Tl). Raised LHR reflects poor LV function, resulting in an elevation of LV end-diastolic pressure and a delay in return of blood from the pulmonary vessels into the left heart, causing increased lung uptake of tracer. Studies with 201Tl are more sensitive for this parameter, since post-stress images are obtained earlier than with 99mTc agents [4.23].
38

4.2.15. Right ventricular (RV) uptake
This parameter is usually not quantifiable with available software, although some methods have been proposed. Normally, the RV uptake shows faint uptake of the tracer, mostly because the RV wall thickness is about one third that of the LV. When the RV uptake is high compared with the LV uptake, it may represent severe LV ischaemia or RV hypertrophy. This is an insensitive but specific marker of multivessel and/or left main CAD [4.24]. Acute or chronic LV dysfunction causes RV overload due to an increase in pulmonary BP.
4.2.16. Overall image quality
This can be semi-quantitatively assessed. The quality of the image should be reported and can be assessed as:
• Excellent;• Good;• Poor;• Uninterpretable (need to repeat the scan).
This will give an indication of the confidence of the interpreter in reporting the images, as a poorly performed scan can result in many artefacts. Sometimes, the quality of the study cannot be improved significantly by repeated imaging the same day (e.g. large body habitus, insufficient dose, persistent unavoidable patient movement, interposition of subdiaphragmatic activity) and the patient should be rescheduled.
REFERENCES
[4.1] HANSEN, C.L., et al., ASNC Imaging Guidelines For Nuclear Cardiology Procedures. Myocardial perfusion and function: Single photon emission computed tomography, J. Nucl. Cardiol. 14 (2007) 39–60.
[4.2] HOLLY, T.A., et al., ASNC Imaging Guidelines for Nuclear Procedures. Single photon emission computed tomography, J. Nucl. Cardiol. 17 (2010) 941–973.
[4.3] EISNER, R.L., et al., Fundamentals of 180-degree acquisition and reconstruction in SPECT imaging, J. Nucl. Med. 27 (1986) 1717–1728.
[4.4] ESTEVES, F.P., et al., Novel solid-state-detector dedicated cardiac camera for fast myocardial perfusion imaging: Multicenter comparison with standard dual detector cameras, J. Nucl. Cardiol. 16 (2009) 927–934.
39

[4.5] VENERO, C.V., et al., A multicenter evaluation of a new post-processing method with depth-dependent collimator resolution applied to full-time and half-time acquisitions without and with simultaneously acquired attenuation correction, J. Nucl. Cardiol. 17(2010) 706.
[4.6] GERMANO, G., et al., Automatic quantification of ejection fraction from gated myocardial perfusion SPECT, J. Nucl. Med. 36 (1995) 2138–2147.
[4.7] INTERNATIONAL ATOMIC ENERGY AGENCY, International Basic Safety Standards for Protection against Ionizing Radiation and for the Safety of Radiation Sources, IAEA Safety Series No. 115, IAEA, Vienna (1996).
[4.8] INTERNATIONAL ATOMIC ENERGY AGENCY, Quality Assurance for SPECT Systems, IAEA Human Health Series No. 6, IAEA, Vienna (2009).
[4.9] FRIEDMAN, J., et al., Patient motion in thallium-201 myocardial SPECT imaging: An easily identified frequent source of artifactual defect, Clin. Nucl. Med. 13 (1988) 321–324.
[4.10] COOPER, J.A., NEUMANN, P.H., McCANDLESS, B.K., Effect of patient motion on tomographic myocardial perfusion imaging, J. Nucl. Med. 33 (1992) 1566–1571.
[4.11] MATSUMOTO, N., et al., Quantitative assessment of motion artefacts and validation of a new motion-correction program for myocardial perfusion SPECT, J. Nucl. Med. 42(2001) 687–694.
[4.12] HUTTON, B.F., LAU, Y.H., Application of distance-dependent resolution compensation and post-reconstruction filtering for myocardial SPECT, Phys. Med. Biol. 43 (1998) 1679–1693.
[4.13] GERMANO, G., et al., Operator-less processing of myocardial perfusion SPECT studies, J. Nucl. Med. 36 (1995) 2127–2132.
[4.14] SLOMKA, P.J., et al., Automated alignment and sizing of myocardial stress and rest scans to three-dimensional normal templates using an image registration algorithm, J. Nucl. Med. 36 (1995) 1115–1122.
[4.15] ANAGNOSTOPOULOS, C., et al., Procedure guidelines for radionuclide myocardial perfusion imaging, Heart 90 (2004) Suppl 1: 1–10.
[4.16] GERMANO, G., et al., Quantitation in gated perfusion SPECT imaging: The Cedars-Sinai approach, J. Nucl. Cardiol. 14 (2007) 433–454.
[4.17] FABER, T.L., et al., Left ventricular function and perfusion from gated SPECT perfusion images: An integrated method, J. Nucl. Med. 40 (1999) 650–659.
[4.18] WOLAK, A., SLOMKA, P.J., FISH, M.B., Quantitative myocardial-perfusion SPECT: Comparison of three state-of-the-art software packages, J. Nucl. Cardiol. 15 (2008) 27–34.
[4.19] CERQUEIRA, M.D., et al., Standardized myocardial segmentation and nomenclature for tomographic imaging of the heart: a statement for healthcare professionals from the Cardiac Imaging Committee of the Council on Clinical Cardiology of the American Heart Association, Circulation 105 (2002) 539–542.
[4.20] MUT, F., et al., Identification of myocardial stunning by means of gated perfusion SPECT in patients undergoing ischaemic stress myocardial tests, World J. Nucl. Med. 2 (2003) 122–125.
[4.21] WEISS, A.T., et al., Transient ischemic dilation of the left ventricle on stress thallium-201 scintigraphy: A marker of severe and extensive coronary artery disease, J. Am. Coll. Cardiol. 9 (1987) 752–759.
40

[4.22] McLAUGHLIN, M.G., DANIAS, P.G., Transient ischemic dilation: A powerful diagnostic and prognostic finding of stress myocardial perfusion imaging, J. Nucl. Cardiol. 9 (2002) 663–667.
[4.23] HANSEN, C.L., SANGRIGOLI, R., NKADI, E., KRAMER, M., Comparison of pulmonary uptake with transient cavity dilation after exercise thallium-201 perfusion imaging, J. Am. Coll. Cardiol. 33 (1999) 1323–1327.
[4.24] WILLIAMS, K.A., SCHNEIDER, C.M., Increased stress right ventricular activity on dual isotope perfusion SPECT: A sign of multivessel and/or left main coronary artery disease, J. Am. Coll. Cardiol. 34 (1999) 420–427.
41

5. INTERPRETATION AND REPORTING OF MPI STUDIES
5.1. INTRODUCTION
A systematic review of the images and study details is important to ensure that the report is complete and comprehensive [5.1, 5.2]. Appropriate review of myocardial perfusion images includes the steps of QC, image display, artefact recognition and image interpretation.
5.2. QC
The raw projection images (Fig. 5.1) must be reviewed in cine mode to determine the presence of potential sources of image degradation and artefacts. The raw projection images are used to evaluate several important items:
• Counting statistics: Injection can be checked if extravasation is suspected.• Tracer biodistribution: Abnormal distribution of the tracer, for example in
the stomach, or lack of visualization of the myocardium, represents poor labelling efficiency and the study should be repeated after QC of the radiopharmaceutical.
• Patient motion: Since conventional SPECT images are obtained in a step and shoot mode, patient motion is evident on the rotating projection images as a step up or down.
FIG. 5.1. Anterior view of the chest from a set of 64 projection images of a SPECT MPI study depicting normal biodistribution of 99mTc-sestamibi.
42

• Soft tissue attenuation: Photon attenuation from the soft tissues (breast in females, diaphragm in males) could cause false-positive results.
• Interposition of metallic objects: These can rarely cause artefacts but should be identified.
• Increased pulmonary uptake of radiotracer.• Position of subdiaphragmatic organs: Excessive uptake in the liver,
gallbladder and bowel, and hiatus hernia can cause imaging artefacts and should be recognized.
• Extracardiac abnormal areas of focal increased or decreased uptake: Focal uptake in the breast or lung, for example, could represent an unsuspected cancer and a focal decrease in uptake could be seen in liver or kidney cysts.
• Missing projections: This can eventually occur due to camera malfunction.• Acquisition zoom: This should be the same for stress and rest; similar image
acquisition zoom will be important to adequately align both sets of images.• Position of the arms: This should be the same for stress and rest; usually, the
left arm is raised above the shoulder and must be in a similar position during the rest and stress acquisition.
• Truncation of the heart in some projections: This is more common with large hearts and should be considered, since it can result in incomplete evaluation of myocardial segments after reconstruction.
5.3. GATING PROCEDURE
Gated studies are the standard in MPI and quality should be checked before quantitative results of ventricular function are considered reliable.
• The QC page of the gated images typically shows a beat histogram. It should present a narrow peak (less variable R–R cycle lengths); a widened peak or multiple peaks would indicate variable heart rate, frequent arrhythmias or improper gating.
• A sinogram analysis is helpful in detecting ECG gating errors and should be used whenever in doubt. With significant gating error, beats may be rejected and the sinogram may show missing data.
5.3.1. Reconstructed images
Once the SPECT myocardial images have been reconstructed, several steps should be performed before the information is considered ready to be interpreted. To ensure quality of data and to minimize the possibility of artefact production or to facilitate its recognition, the verifications listed next are necessary.
43

• Alignment of slices: The stress and rest set of slices should be correctly aligned — i.e. SA, VLA and HLA tomograms should be displayed in such a way that each stress slice corresponds anatomically with a matching rest slice for comparison (Fig. 5.2). It is possible that ventricular size differs in respective situations (it is typically larger at stress if severe ischaemia is present), so precise slice matching may be difficult or even impossible. In any case, it is recommended that a stress midventricular tomogram is selected and matched with the corresponding rest image, then the matching pair of slices positioned at the centre of the display, with a corresponding number of slices at both sides.
• Count density for stress and rest: Visual assessment of count density is important to ensure adequate comparison and avoidance of artefacts or wrong interpretation. Poor signal-to-noise ratio may be due to partial dose extravasation at injection, poor labelling of the radiopharmaceutical, biodegradation of the tracer with low myocardial uptake, or mismatch between the patient body habitus (weight) and injected dose (i.e. using a standard dose for an obese patient instead of adjusting it by weight). Poor signal-to-noise ratio may lead to the false appearance of reversible defects. Reprocessing of data using different filter parameters to compensate for low count density, or even a repeat study, might be necessary.
FIG. 5.2. Stress (upper row on each set of paired images) and rest (bottom row) 99mTc-sestamibi SPECT images.
44

• Selection of the LV long axis: Reorientation of the heart after SPECT reconstruction should be done by proper selection of the LV long axis in the stress and rest studies; otherwise the orthogonal planes depicted by the three sets of slices will not be perpendicular to each other and comparison can be misleading.
• Masking: This is particularly important in order not to include extracardiac activity (Fig. 5.3); if masking is not properly performed, any structure with activity higher than that of the myocardium can produce scaling artefacts, with apparent lower cardiac counts in the corresponding images.
• Normalization: Image count normalization is usually performed automatically by the software on display; if this is not the case, the operator will need to do it, taking as reference the maximum count density in any image of the pair of image sets. Caution must be taken not to normalize against a ‘hot’ extracardiac structure, due to inadequate masking.
5.3.2. Polar maps
These are helpful tools for study interpretation but are subject to a number of errors.
• Generation of polar maps requires that the basal and apical limits of the myocardium are properly selected; even if current software packages can perform the operation automatically, it is recommended that these limits are checked visually by the operator.
• A basal limit positioned away from the base will produce an external ring ‘defect’ in the polar maps, whereas a limit away from the apical tip will produce a central circular ‘defect’.
FIG. 5.3. SA slices with ‘hot’ extracardiac structure (left); mask definition preserving activity within the region of interest only (centre); original short slices after masking (right).
45
5.3.3. Gated images
Accurate calculation of LVEF is based on an edge detection algorithm that permits 3-D geometrical evaluation of ventricular volumes.
• Verification of the computer generated contours, especially the endocardial contours, is essential for assessing the reliability of the software performance.
• This also includes checking the automatic selection of apical and basal (valvular plane) limits, as well as the LV long axis (Fig. 5.4).
• If inaccuracy is detected, the operator is usually able to correct the contours, or some reference limits affecting their positioning.
• Cine display (‘beating heart’) is essential to check for missing frames, ‘flickering’ and other gating artefacts.
5.3.4. Attenuation correction
Attenuation artefacts can limit the specificity of SPECT MPI 5.3.
• Owing to energy considerations, 201Tl images are more prone to attenuation artefacts than 99mTc images.
• There are several ways to deal with attenuation artefacts; most commonly, gated images are used to differentiate attenuation artefacts from real defects. Fixed perfusion defects with normal wall motion and wall thickening on the gated images are typically assumed to represent attenuation artefacts.
FIG. 5.4. Computer generated LV contours of gated images used for calculation of LV volumes and EF. Contours should only track myocardial activity and the valve plane.
46
• Soft tissue attenuation can be measured using a transmission map and corrected. Transmission maps can be performed using a dedicated radionuclide line source (153Ga or 68Ge), or a low dose computed tomography (CT) scan of the chest. The transmission/attenuation maps are typically performed before or after the emission scan.
• The transmission maps need to be checked for count density and count uniformity. This is particularly important for radionuclide source attenuation maps. If the source activity is old (decayed), the attenuation map can be count poor and will need to be acquired for a longer duration. This is not a problem with CT based attenuation correction, since the transmission maps are typically count rich.
• The other QC step in attenuation correction is to check for registration of the transmission and emission images. This is critical to avoid artefacts from misregistration between transmission and emission images. Registration should be checked in the axial, sagittal and coronal projections, as well as the standard cardiac planes of SA, HLA and VLA images.
• If the transmission and emission images are misregistered, they need to be realigned appropriately using software, and a new attenuation map needs to be generated. The emission images must then be corrected for attenuation using the new attenuation map.
5.4. IMAGE DISPLAY
5.4.1. Slice display
Interpretation of the myocardial perfusion scan findings is based primarily on assessment of the conventional SPECT slices.
• The standard cardiac tomographic image sets should be used: short axis oblique, VLA and HLA.
• Summed gated images must be used for slice display.• The LV should be well represented. All slices must be properly aligned and
normalized.• Proper adjustment of brightness and contrast might be necessary in the
presence of hot spots.• It is recommended that image interpretation be performed using the
computer monitor whenever possible.• Good quality colour hard copies may be used as an alternative, only if these
are consistent with the computer monitor images.
47
• If images are provided together with the report, they should reflect the findings and interpretation of the report.
5.4.2. Polar map display
• Polar maps should only be used for assisting interpretation of image slices, and not be interpreted on their own.
• The polar map display varies depending on the software used.• The reference polar map used should take into account factors such as the
radiotracer, sex, body habitus and prior mastectomy.• Interpreting physicians should recognize that the loaded polar maps may
not conform to their patient population. Ideally, a local reference polar map should be used if available.
5.4.3. Gated display
The gated display format will be largely dependent on the software available.
• Representative slices of all the axes should be shown (at a minimum the apical, midventricular and basal SA, central VLA and central HLA).
• The LV contours as outlined by the software should be checked to make sure that only myocardial activity is tracked (the study should be reprocessed as necessary).
• Gated slices are preferably read without the contours.• The grey scale is recommended for assessment of wall motion.• Owing to the ‘partial volume effect’, wall thickening is more easily
assessed using a colour scale.• LVEF should be considered reliable if proper contouring is achieved and
there is no significant arrhythmia. Software based gated scoring is typically not used for clinical interpretation.
• A good QC for gated images is to evaluate the LV volume curve and to check for the integrity and shape of all phases of the curve (Fig. 5.5).
5.4.4. 3-D images and quantitative analysis
Since artefacts can lead to quantification errors, it is advisable to always use these software tools with caution, and to compare them with slides and raw data.
48
• 3-D volume-rendered static (perfusion) and gated (ventricular function) images (Fig. 5.6) may assist in image evaluation but should not be used as the primary images for diagnostic interpretation.
• Similarly, automated semiquantitative or fully quantitative scoring software should not be the sole basis for study interpretation, and should only be used for supplementary information or to double check the visual findings.
FIG. 5.5. Volume curve of the LV (black curve) of a 16 frame gated SPECT study, showing a normal shape (systolic and diastolic phases). Checking the LV volume curve is a critical aspect of the study QC.
FIG. 5.6. Left and right, respectively: 3-D volume-rendered static perfusion image, and gated end-diastolic and end-systolic volumetric display depicting anterior-apical abnormalities in perfusion and wall motion. These types of image should be used only as an aid for study interpretation.
49
5.5. ARTEFACT RECOGNITION
5.5.1. Motion artefacts
Patient motion is one of the most frequent sources of artefacts in MPI 5.4, 5.5.
• Besides checking for patient motion by looking at the rotating raw data or the sinograms, once the images have been reconstructed, motion artefacts can be recognized.
• Usually, motion artefacts produce a characteristic misalignment of the myocardial walls in the HLA slices, which is more prominent at the apex.
• In the SA images, motion is suggested when the so-called ‘hurricane sign’ appears, with a ‘tail’ of activity emerging from one of the myocardial walls.
5.5.2. Attenuation artefacts
Soft tissue photon attenuation in the thorax leads to a non-uniform reduction of counts from myocardial activity, possibly producing imaging artefacts (Fig. 5.7). The extent of these artefacts is based upon the distribution of the soft tissue, bone and lung, overall patient body size and the depth of the heart in the thorax [5.4].
• Attenuation artefacts usually manifest as a persistent perfusion defect that may be incorrectly interpreted as a true perfusion defect, i.e. a myocardial scar. In addition, these ‘defects’ may demonstrate reversibility with changes in position and may be confused with myocardial ischaemia.
FIG. 5.7. Anterior wall ‘defect’ due to breast attenuation in a woman (left) and inferior wall ‘defect’ due to diaphragmatic attenuation in a male (right). Studies were performed with 99mTc-sestamibi. In both cases, no coronary lesions were found in angiography.
50
• This may produce a decrease in diagnostic accuracy due predominantly to an increase in false-positive studies, although sometimes it may also lead to an underinterpretation of true perfusion abnormalities, when the effect of soft tissue attenuation is overestimated by the observer.
• Diaphragmatic attenuation is most often seen in men and occurs in up to 25% of MPIs. It results in a variable decrease in counts detected from the inferior wall, which may be confused with an inferior wall scar. Although there is generally a relationship between diaphragmatic attenuation and body size, this is not always predictable. Prone imaging can overcome the problem in the majority of cases; however, acquisition time is prolonged. Usually, acquiring only the stress study in the prone position will suffice to demonstrate the presence of inferior wall attenuation.
• Breast attenuation produces the effect of fewer photons emanating from the anterior regions of the heart and may occur in up to 40% of women; furthermore, these artefacts can occur in a variety of locations — anterior, anterolateral, anteroseptal and apical. Special concern for artefacts arises in women with breast implants or following mastectomy. Although quantitation software takes breast tissue into account by the development of normal female databases, these databases cannot account for all body types. Repeating the study with breast repositioning might reveal that an anterior defect was due to an attenuation artefact.
• Attenuation due to obesity can produce global or localized attenuation artefacts, which are difficult to predict. In general, the use of 99mTc agents (with higher photon energy) rather than 201Tl and adjusting the injected dose by patient weight will help to minimize artefacts.
• Analysis of gated images showing preserved wall motion and thickening is useful to characterize most fixed attenuation artefacts 5.5. The generation of attenuation maps with external sources, or CT, may overcome the problem of soft tissue attenuation artefacts, although these methods are not widely available.
5.5.3. Extracardiac activity
• Activity in various subdiaphragmatic organs can interfere with evaluation of perfusion of the inferior wall.
• In patients with hiatus hernia and prominent gastric uptake, there can be overlapping with lateral wall activity of the LV. Intense liver activity adjacent to the inferior wall may make it impossible to tell if there is any defect; a repeat acquisition with longer delay may result in cleared liver activity.
51
5.5.4. Extravasation of tracer
• Infiltrated injection results in low counts in the corresponding stress or rest images, making it difficult to assess the presence of defects.
• This may result in either overestimation or underestimation of defects, and a repeat study might be necessary, depending on the degree of degradation.
5.5.5. Polar plots
• Proper delineation of the apex and base segments of the polar plots is critical.
• Raw patient polar plots at rest and stress and reversibility should be reviewed.
• Sex and tracer specific polar plots are recommended to define the extent and severity of perfusion defects on the polar plots.
5.5.6. Gating errors
• Gating two waves per cycle (i.e. P and R waves) will result in two beats per cycle when reviewing the gated images in cine display. The volume curve will show two humps and valleys instead of a single one.
• High variability of the R–R interval during gated acquisition will result in image ‘flickering’ due to loss of counts of the last images in the cardiac cycle. The volume curve will show a tail ‘drop off’.
5.5.7. Hot spots
• Areas of high activity (‘hot spots’) close to the heart may interfere with interpretation.
• If there are hot spots with ‘negative’ (cold) surrounding areas due to a FBP artefact, reconstruction with iterative methods should be attempted.
• Incidental findings, especially hot spots in the lungs, should be confirmed in both the reconstructed and raw images, with appropriate localization in the SPECT tomograms (if necessary, a specific reconstruction should be performed) and the information included in the report.
52
5.6. IMAGE INTERPRETATION
5.6.1. Perfusion defects
The perfusion images should be interpreted without knowledge of the clinical and stress information (to avoid bias), as categories of normal, probably normal, equivocal, probably abnormal or abnormal. Once the images are interpreted, the clinical and stress data can be reviewed and the interpretation finalized as normal or abnormal and the terms of probably normal or probably abnormal must be avoided.
• Normally, there should be homogeneity of tracer uptake in the LV myocardial wall on both rest and stress images.
• Any segmental or diffuse decrease of uptake during stress would correspond to ischaemia, if reversible on rest images.
• The finding could correspond to an infarct if the defect is fixed (similar on both phases). However, hibernating myocardium could produce the same result.
• Areas of mixed reversible and fixed defects can also be identified as infarct plus ischaemia.
• All findings would be supported by semiquantitative analysis with available software (Fig. 5.8). The software could help in determining the severity and extent of defects.
• A 17 segment American Society of Nuclear Cardiology/American Heart Association (AHA)/American College of Cardiology (ACC) visual scoring method is recommended for visually scoring the myocardial perfusion defects. The suggested model is shown in Fig. 5.9.
5.6.2. High risk scan features
The following features should be noted on the image interpretation as high risk scan features; when present, they should preferably be communicated to the referring physician, as they are associated with a high risk of cardiac events:
• Transient dilation of the LV;• Transient increase in RV uptake;• Increased pulmonary uptake of radiotracer;• Multiple and extensive perfusion defects;• Transient wall motion abnormalities;• Post-stress LVEF lower than rest LVEF.
53

FIG. 5.8. Semi-quantitative perfusion analysis with polar plots, 3-D LV display, summed scores and 17 segment model in a patient with anterior and apical ischaemia.
FIG. 5.9. SPECT myocardial segmentation using a 17 segment model: 1=basal anterior, 2=basal anteroseptal, 3=basal inferoseptal, 4=basal inferior, 5=basal inferolateral, 6=basal anterolateral, 7=mid-anterior, 8=mid-anteroseptal, 9=mid-inferoseptal, 10=mid-inferior, 11=mid-inferolateral, 12=mid-anterolateral, 13=apical anterior, 14=apical septal, 15=apical inferior, 16=apical lateral, 17=apex.
54

5.6.3. TID of the LV
Before segmental analysis of the perfusion images, it should be noted whether or not there is enlargement of the LV cavity at rest, post-stress or both. TID is defined based on the endocardial borders of the LV cavity observed on the static/summed images (there is no consensus about using gated images). An increased stress:rest LV cavity ratio (Fig. 5.10) has been described as a marker for high risk (severe and multivessel coronary disease). Although non-specific for ischaemia, when not associated with segmental perfusion defects, TID may represent either global subendocardial ischaemia or balanced ischaemia in the three coronary regions. TID is described qualitatively but may be quantified using software. The normal upper limit of TID (LV cavity ratio) is 1.2–1.3 but may vary based on the study protocol and radiotracer used. Apparent TID may be observed in dual isotope studies (rest 201Tl and stress 99mTc), and hence the normal limits may be higher compared with single isotope protocols.
FIG. 5.10. TID of LV. The LV volume is greater at stress (upper row on each set of paired images) than at rest (bottom row). TID is an additional high risk finding with independent prognostic value, although severe and extensive perfusion defects (as in this particular case) are frequently — but not always — present as well.
55
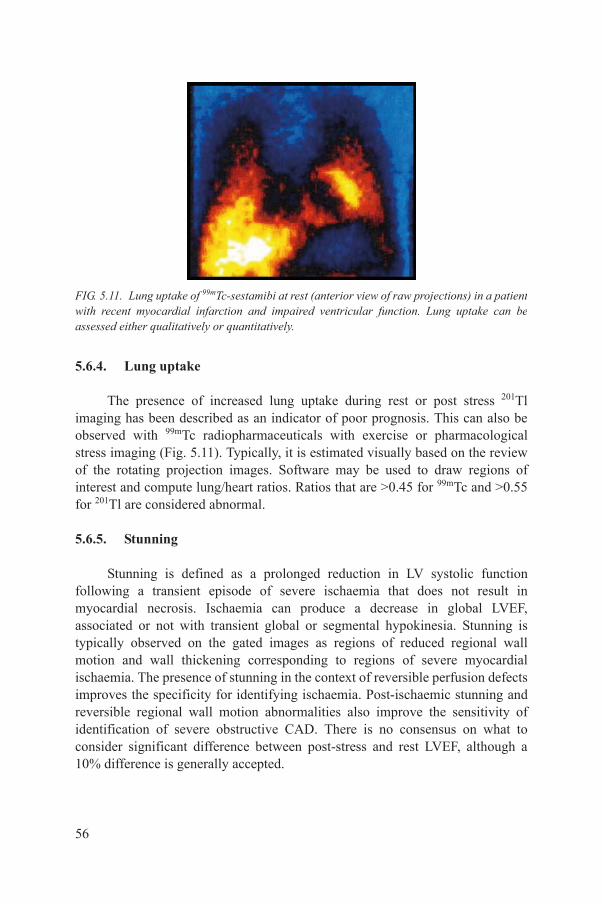
5.6.4. Lung uptake
The presence of increased lung uptake during rest or post stress 201Tl imaging has been described as an indicator of poor prognosis. This can also be observed with 99mTc radiopharmaceuticals with exercise or pharmacological stress imaging (Fig. 5.11). Typically, it is estimated visually based on the review of the rotating projection images. Software may be used to draw regions of interest and compute lung/heart ratios. Ratios that are >0.45 for 99mTc and >0.55 for 201Tl are considered abnormal.
5.6.5. Stunning
Stunning is defined as a prolonged reduction in LV systolic function following a transient episode of severe ischaemia that does not result in myocardial necrosis. Ischaemia can produce a decrease in global LVEF, associated or not with transient global or segmental hypokinesia. Stunning is typically observed on the gated images as regions of reduced regional wall motion and wall thickening corresponding to regions of severe myocardial ischaemia. The presence of stunning in the context of reversible perfusion defects improves the specificity for identifying ischaemia. Post-ischaemic stunning and reversible regional wall motion abnormalities also improve the sensitivity of identification of severe obstructive CAD. There is no consensus on what to consider significant difference between post-stress and rest LVEF, although a 10% difference is generally accepted.
FIG. 5.11. Lung uptake of 99mTc-sestamibi at rest (anterior view of raw projections) in a patient with recent myocardial infarction and impaired ventricular function. Lung uptake can be assessed either qualitatively or quantitatively.
56

5.6.6. RV tracer uptake
RV uptake may be qualitatively assessed on the raw projection data and on the reconstructed data (Fig. 5.12). In general, the intensity of the RV is approximately 50% of maximum LV intensity. RV uptake increases in the presence of RV hypertrophy or overload, most typically because of pulmonary hypertension. The intensity of the RV may also appear relatively increased when LV uptake is globally reduced. Transient increase in RV tracer uptake (>20% higher RV uptake compared with LV uptake) is a specific sign of left main disease. The size of the RV should also be noted, as RV dilation can provide a clue to the presence of right heart volume overload due to conditions such as atrial septal defect or severe tricuspid regurgitation.
5.6.7. Multiple and extensive perfusion defects
Several studies have demonstrated the prognostic value of myocardial perfusion images [5.6]. The number and extent of perfusion defects are powerful predictors of future adverse cardiovascular events [5.7].
5.7. REPORTING AND ESSENTIAL ELEMENTS OF A COMPREHENSIVE REPORT
5.7.1. Introduction
Accurate reporting is one of the most critical steps in MPI. The report is the final product of a complex process, involving substantial human and material
FIG. 5.12. SA slices of a SPECT study. At stress (upper row) the RV is clearly seen, associated with extensive LV perfusion defects, which are mostly reversible at rest (bottom row) where RV uptake almost disappears.
57

resources. Quality reports typically must be concise and include all the relevant information for the referring physician [5.1, 5.2]. Structured reporting will facilitate not only high quality patient care but also appropriate recognition and accreditation by the health system, insurance companies and academic institutions. Reports include separate sections on demographics, methods, interpretation and conclusions related to the ST, static and gated myocardial perfusion images (including all of the critical elements listed below). The calcium score and CT coronary angiogram studies are also reported when performed as a part of the MPI study with hybrid systems.
• Demographics: The patient age, sex, coronary risk factors, prior cardiac history, cardiac medications and rest ECG information should be listed in this section (see Section 5.7.2).
• Clinical question or reason for referral: This is a very important point and should be clearly stated (see Section 5.7.3).
• ST: The details of the ST must be provided (see Section 5.7.4). Whenever possible, the ST report should be combined with the MPI report. If not, the relevant details of the ST report must also be included in the MPI report.
• Acquisition protocol: The MPI report must include details about the technique and type and dose of radiotracer used (see Section 5.7.4). The imaging protocol, including attenuation correction parameters (if performed) should be described.
• General description: A comment about image quality (uninterpretable, fair, good, excellent). The LV and RV size, relative cavity size between stress and rest (TID), and lung tracer uptake should be described first (see Section 5.7.5).
• Perfusion defects: The defect size, severity, location and reversibility must then be described following either vascular distributions or myocardial walls or segments (see Section 5.7.5). Reporting the summed scores is generally not routine, unless specifically requested by the referring physician or when a quantitative follow-up evaluation might be relevant.
• LV function: This should be reported and include estimation of global LV systolic function (LVEF), regional wall motion and wall thickening whenever feasible (see Section 5.7.6). LVEF values greater than 75% should be reported as >75% and EF less than 15% as <15%, without giving specific numbers (e.g. if EF = 90%, the report should read ‘LVEF >75%’; if EF = 11%, the report should read ‘LVEF <15%’). If height and weight are available, LV volumes may be normalized to body surface area (it is recommended not to report end-diastolic volume <60 mL). Any high risk scan features can be described.
58
• Conclusions: This section must include a definitive statement about the overall scan results, taking into consideration the stress ECG and MPI findings (see Section 5.7.8).° The clinical question should be specifically addressed.° The report should clearly state whether the overall study is normal or
abnormal. Use of the terms ‘probably’ or ‘equivocal’ should be avoided.° A list of possible causes for the imaging findings (e.g. attenuation versus
scar versus ischaemia) should be avoided in this section.° The gated results must be summarized, also as normal or abnormal.° High risk scan features should be highlighted.° Classification as medium or low risk should be reported optionally.° Comparison should be made to prior study images if available.
Essential components of a comprehensive report are listed below.
5.7.2. General information
Information about the laboratory and study date.Name of referring physician and contact information.Patient demographics:
• Name;• Age and sex;• ID number;• Institution;• Contact information (telephone number, address).
5.7.3. Clinical background
Clinical reason for test; common reasons (among others):
• Diagnosis of CAD;• Risk stratification in chronic CAD;• Risk stratification after myocardial infarction;• Risk stratification before non-cardiac surgery;• Evaluation of therapy.
59

Clinical history:
• Coronary risk factors;• Past cardiac history.
Current cardiac medications (specify withdrawal).Resting ECG interpretation.
5.7.4. Methods
MPI protocol:
• One day/two day/rest–stress or stress–rest.• Radiotracer type and dose used for rest and stress.• Attenuation correction technique (if performed).• Imaging position:
° Supine;° Prone;° Supine followed by prone.
Stress protocol:
• Protocol type;• Exercise duration;• Functional capacity (metabolic equivalent tasks (METs));• Resting heart rate, systolic and diastolic BP;• Maximal systolic and diastolic BP;• Maximal heart rate and percentage of age predicted maximal heart rate
achieved.
Stress ECG changes:
• Arrhythmias: Type of arrhythmia should be described.• ST segment changes: ST depression or elevation (mm); type of depression
(horizontal/down/upsloping); heart rate or workload at onset of ST changes; time at which ST changes resolved.
• Symptoms: Type of symptoms (chest pain, dyspnoea); type of pain (typical/atypical); heart rate or workload at onset of symptoms; time at which symptoms resolved; intervention required if any (nitrates, etc.).
60
Reason for termination of test:
• Exhaustion;• Chest pain;• ST changes;• Arrhythmias;• BP;• Other.
5.7.5. Perfusion (rest and stress 99mTc perfusion imaging)
Overview:
• Image quality (good or with technical limitations due to: patient motion, dose extravasation, body habitus of the patient, attenuation artefacts, etc.).
• LV size (rest LV size and transient cavity dilation if present);• LV hypertrophy;• RV size and tracer uptake;• Lung uptake.
Defect description:
• Size;• Severity;• Location;• Reversibility.
5.7.6. Ventricular function
• Segmental wall motion assessment (visual);• Wall thickening (visual);• RV function (visual);• Post-stress/rest LVEF (recommended);• Rest LVEF only (optional for 1 day protocol);• LV volumes (optional).
5.7.7. Ancillary findings
Any abnormal increase or decrease in radiotracer distribution or focal uptake.
61

5.7.8. Conclusions
Myocardial perfusion:
• Normal;• Abnormal: Describe the extent and magnitude of scar and/or ischaemia;
include a statement about risk if high risk findings are seen.
LV function:
• Normal or abnormal;• Post-stress stunning.
Comparison to prior studies (date and findings if changed or unchanged).Final report should be sensitive to the needs of the local community and
answer the primary question posed by the referring doctor.Date of report and signature.
REFERENCES
[5.1] TILKEMEIER, P.L., et al., American Society of Nuclear Cardiology information statement: Standardized reporting matrix for radionuclide myocardial perfusion imaging, J. Nucl. Cardiol. 13 (2006) 157–171.
[5.2] TILKEMEIER, P.L., et al., ASNC Imaging Guidelines for Nuclear Cardiology Procedures, standardized reporting of radionuclide myocardial perfusion and function, J. Nucl. Cardiol. 16 (2009) 650–662.
[5.3] HENDEL, R.C., et al., The value and practice of attenuation correction for myocardial perfusion SPECT imaging: A Joint Position Statement from the American Society of Nuclear Cardiology and the Society of Nuclear Medicine, J. Nucl. Med. 43 (2002) 273–280.
[5.4] DEPUEY, E.G., GARCIA, E.V., Optimal specificity of thallium-201 SPECT through recognition of imaging artifacts, J. Nucl. Med. 30 (1989) 441–449.
[5.5] CHOI, J.Y., et al., Gating provides improved accuracy for differentiating artifacts from true lesions in equivocal fixed defects on technetium 99m tetrofosmin perfusion SPECT, J. Nucl. Cardiol. 5 (1998) 395–401.
[5.6] HACHAMOVITCH, R., BERMAN, D.S., The use of nuclear cardiology in clinical decision making, Semin. Nucl. Med. 35 (2005) 62–72.
[5.7] HACHAMOVITCH, R., et al., Impact of ischaemia and scar on the therapeutic benefit derived from myocardial revascularization vs. medical therapy among patients undergoing stress-rest myocardial perfusion scintigraphy, Eur. Heart J. 32 (2011) 1012–1024.
62
Appendix I
PATIENT INFORMATION BROCHURE
The need for patient education before the scan must be emphasized. The patient is to be informed of the risks and benefits of the procedure, the technical details of the actual ST and the imaging protocol, the need to avoid medications as instructed by the referring physician, the need to avoid caffeine for 24 h before the test, etc. These are all important details that should be given to the patient as a brochure before the actual test, so that he or she can conform to the instructions. The brochure will serve to keep the patient informed, in order to avoid unexpected circumstances on the day of the test.
Note: This procedure serves as a guide to what a comprehensive brochure should include; therefore, if there is information that does/does not apply to the internal procedures at the institute, it is important to make sure that any changes are accommodated accordingly.
I.1. INFORMATION FOR THE PATIENT
• Please bring your medications and any medical history information with you.
• If you are breast feeding or pregnant or think you may be pregnant, please inform your doctor and staff, since other tests may be recommended and could be preferred in this case. You should discuss further procedures with your doctor, who may advise you to postpone the test.
• Your doctor has ordered a myocardial perfusion scan for assessment of your heart arteries. This test is actually a scan of the blood flow in the heart muscle, an indirect indicator of the status of the patency of your coronary arteries.
• To perform this test, your doctor will have informed you of certain medications that you should avoid for a period of time (usually some days) to make the test more accurate.6 If not, please continue all regular medications. Do not take drugs for erectile dysfunction for 2 days prior to the studies.
6 List of medication to be given by local institution.
63
• Please also avoid all caffeinated beverages (coffee, all forms of tea, chocolate drinks), chocolates and soft drinks (such as Coca Cola, Pepsi Cola, 7 Up, Sprite, root beer, etc.) for 24 h before the test, as these may interfere with the efficacy of the stress testing.
• An IV device will first be inserted into a vein in your hand or elbow.• The protocol may start either with an ST or with a tracer injection for a rest
scan. In certain circumstances, another injection of tracer may be given later the same day or after 24 h for better diagnostic accuracy.
• Subsequent to completing this test, your referring physician may or may not ask you to continue to another form of medical imaging (e.g. computed tomography angiography (CTA) or calcium score) as required, depending on the result.
• To perform this test, you will be required to do some form of exercise (stress) on either a treadmill exercise machine (walking, jogging, running) or a bicycle ergometer (cycling).
• Please wear proper exercise attire and comfortable shoes for this test.• If you think you are unable to exercise, or the doctor has directed you not to
exercise, you will instead be given intravenous medication to ‘stress’ your heart. You may also be required to perform some slow walking or cycling if possible.
• Possible mild self-limiting side effects of the medication given for the ‘stress’ state, may include nausea, vomiting, a hot feeling, abdominal discomfort, headache and giddiness. These side effects may last for approximately 5–10 min following the infusion and occur in approximately 40–50% of patients given the medication. We do have an antidote to the medication, which can be given if necessary.
• The test will also involve an injection of a radioactive tracer into you vein. The amount of radiation involved is very small and will disappear within hours.
• To promote more rapid removal of the tracer from the body, you are encouraged to drink liquids liberally to promote urinary excretion. However, because of the short lifespan of the tracer, most of the radioactive tracer will be automatically inactivated quickly.
• There are no significant side effects of this tracer, except perhaps a short-lasting metallic taste in the mouth.
• You will then be under the scanning machine (gamma-camera) 5–60 min after the ST, depending on the tracer injected.
• This will require you to lie (on your back or chest/abdomen) on a couch while the camera taking pictures of your heart rotates around you.
• You will be asked to lie as still as possible for about 3–20 min, breathing in a regular manner, without taking deep breaths.
64
• The camera may come very close to your chest but will not touch or harm your body in any way.
• The interpreting physician will then look at the results of your heart scan. Usually, a second scan is required in the resting state, so a second injection of tracer will be required, either on the same day or on another day.
• Before the rest scan injection, you may occasionally (depending on the clinical question to be addressed by the test) be given a tablet to be placed under the tongue and allowed to dissolve slowly.
• After the second tracer injection, you will be required to wait for about 20–60 min before your scan is performed. Upon completion of the scan, the technologist will inform you when you can go home.
• In total, you may have to spend up to 6–8 h to complete the entire scan in a single day.
• As there is very little radiation involved in using this technique, it is completely safe to resume all forms of daily activities once you have completed your scan. There is no danger of passing the radiation to others around you, and you should not isolate yourself unnecessarily. The only exception is that if there are young children (<10 years old) in the household, they should be advised not to be in your close proximity for the first 6 h after tracer injection, and women who are breast feeding should avoid close contact with the baby post-scan.
• The interpreting physician will report on your scan, and then will either ask you to pick up your results, or transmit the results to your referring physician (who will then arrange an interview with you for further advice).
• You should continue with all regular medications, including ones you were told to stop specifically for this test.
65
Appendix II
CHECKLIST FOR MPI STUDIES
II.1. SCINTILLATION CAMERA QC
• Scintillation camera QC should be performed periodically, according to system requirements and to the manufacturer’s specifications. They are usually measured according to the National Electrical Manufacturers Association.
• The performance of multiple head detectors must be matched. Images from the heads must be aligned.
• Collimators MUST BE checked periodically. Clear messages to avoid damage during collimator change should be displayed.
• Daily QC: symmetry of energy window, position over the photo-peak, low count uniformity (intrinsic ≤2%, extrinsic ≤3%, maximum difference in system sensitivity between heads <5%).
• Periodically (at least every 6 months, frequency depending on stability of systems): spatial resolution, linearity, centre of rotation offset (128°–128 matrix <0.5 pixel for 360°); tilt of detector heads, measured by centre of rotation (128°–128 matrix); variation <4 mm/1 pixel for 360°.
• Check for monitor linearity and uniformity by proper phantoms.• For comprehensive instructions on scintillation camera QC, readers are
recommended to refer to IAEA Human Health Series No. 6 for further reading II.1.
II.2. RADIOPHARMACEUTICALS
• Provide all radiopharmaceutical QC as specified by manufacturers.• Define the range of activities you want to inject to get similar count
statistics in all your patients, according to patient weight, height and shape.• Optimize injected activity in order to reach optimal count statistics
according to the acquisition system characteristics and to keep radiation doses as small as possible (see reconstruction algorithms).
• For further reading, readers are referred to the IAEA publication Operational Guidance on Hospital Radiopharmacy: A Safe and Effective Approach II.2.
66

II.3. BEFORE ACQUISITION
• Find the most comfortable position on the SPECT bed.• Ask the patient to avoid movements, to breathe normally and to avoid deep
breaths.• In case of a problem during acquisition, ask the patient to inform the
technologist without moving.• Inform the patient of the expected acquisition time.• Check for heart rhythm: atrial fibrillation, sinus arrhythmia, frequent
premature beats, intermittent and dual chamber pacing, etc. These patients should not be studied with ECG triggering, or the type of rhythm should be registered for the interpreting physician to consider.
II.4. DURING ACQUISITION
• Ask frequently if everything is OK.• Inform the patient of the remaining time.• Instruct the patient to avoid movements.
II.5. AFTER ACQUISITION
• Check immediately for lateral or vertical movements of the heart and for extracardiac ‘hot spots’ that can interfere with reconstruction and processing (e.g. lung, liver, gallbladder, muscle) on the rotating cinematic review of the projection data.
• Consider whether to repeat the acquisition immediately (movements) or after a time interval (hotspots).
• Check for truncation of cardiac activity or severe truncation of body activity.
• If there is suspected severe diaphragmatic/breast attenuation, consider a second acquisition in the supine/prone position.
II.6. IMAGE PROCESSING
• Verify the need to apply motion correction algorithms for the vertical movements (≥2 pixel motion, 4 mm).
67
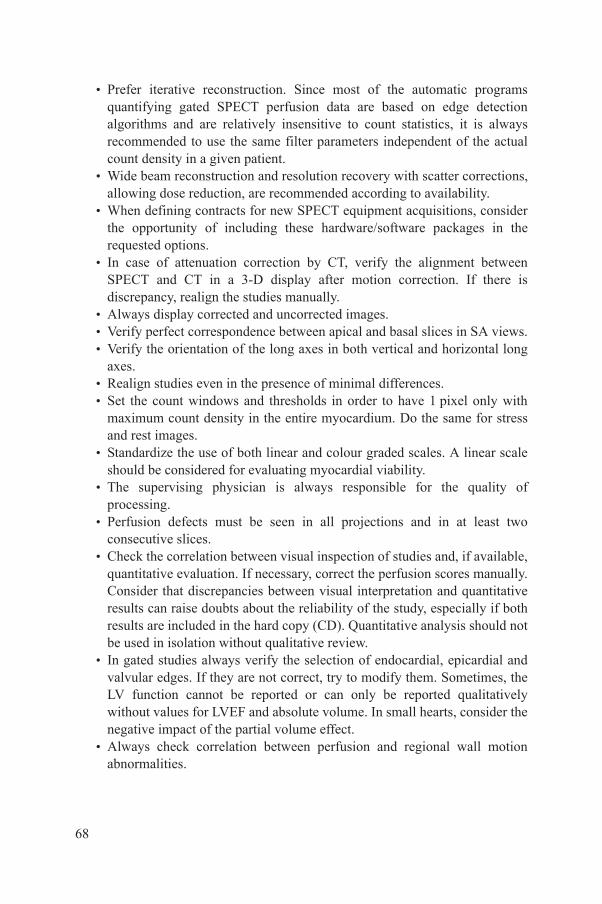
• Prefer iterative reconstruction. Since most of the automatic programs quantifying gated SPECT perfusion data are based on edge detection algorithms and are relatively insensitive to count statistics, it is always recommended to use the same filter parameters independent of the actual count density in a given patient.
• Wide beam reconstruction and resolution recovery with scatter corrections, allowing dose reduction, are recommended according to availability.
• When defining contracts for new SPECT equipment acquisitions, consider the opportunity of including these hardware/software packages in the requested options.
• In case of attenuation correction by CT, verify the alignment between SPECT and CT in a 3-D display after motion correction. If there is discrepancy, realign the studies manually.
• Always display corrected and uncorrected images.• Verify perfect correspondence between apical and basal slices in SA views.• Verify the orientation of the long axes in both vertical and horizontal long
axes.• Realign studies even in the presence of minimal differences.• Set the count windows and thresholds in order to have 1 pixel only with
maximum count density in the entire myocardium. Do the same for stress and rest images.
• Standardize the use of both linear and colour graded scales. A linear scale should be considered for evaluating myocardial viability.
• The supervising physician is always responsible for the quality of processing.
• Perfusion defects must be seen in all projections and in at least two consecutive slices.
• Check the correlation between visual inspection of studies and, if available, quantitative evaluation. If necessary, correct the perfusion scores manually. Consider that discrepancies between visual interpretation and quantitative results can raise doubts about the reliability of the study, especially if both results are included in the hard copy (CD). Quantitative analysis should not be used in isolation without qualitative review.
• In gated studies always verify the selection of endocardial, epicardial and valvular edges. If they are not correct, try to modify them. Sometimes, the LV function cannot be reported or can only be reported qualitatively without values for LVEF and absolute volume. In small hearts, consider the negative impact of the partial volume effect.
• Always check correlation between perfusion and regional wall motion abnormalities.
68
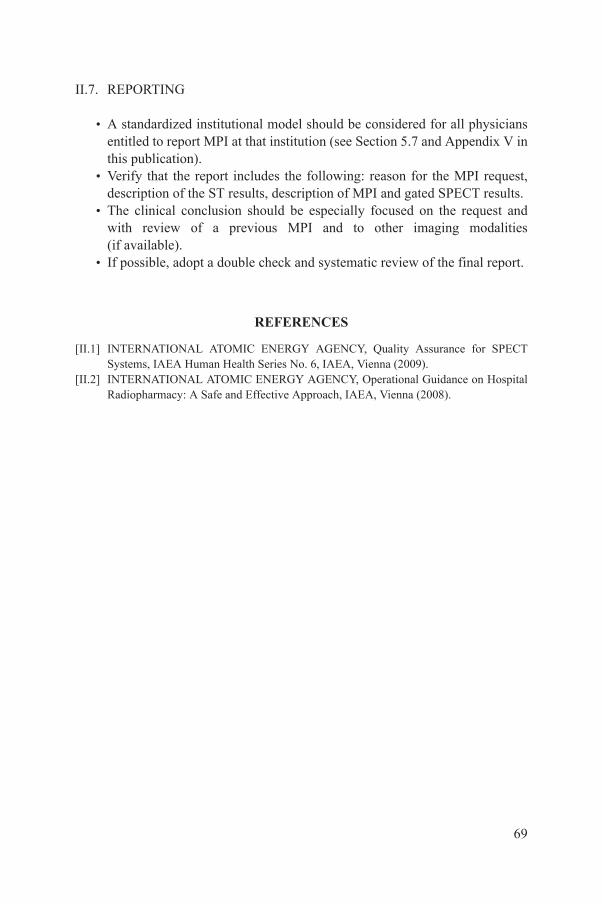
II.7. REPORTING
• A standardized institutional model should be considered for all physicians entitled to report MPI at that institution (see Section 5.7 and Appendix V in this publication).
• Verify that the report includes the following: reason for the MPI request, description of the ST results, description of MPI and gated SPECT results.
• The clinical conclusion should be especially focused on the request and with review of a previous MPI and to other imaging modalities (if available).
• If possible, adopt a double check and systematic review of the final report.
REFERENCES
[II.1] INTERNATIONAL ATOMIC ENERGY AGENCY, Quality Assurance for SPECT Systems, IAEA Human Health Series No. 6, IAEA, Vienna (2009).
[II.2] INTERNATIONAL ATOMIC ENERGY AGENCY, Operational Guidance on Hospital Radiopharmacy: A Safe and Effective Approach, IAEA, Vienna (2008).
69

Appendix III
EXAMPLES OF MPI REPORTS
III.1. SAMPLE 1
Exercise MPI report, adapted with permission from Brigham and Women’s Hospital, Non-Invasive Cardiovascular Imaging Laboratory.
III.1.1. General information
Referring physician: Dr________________
Mr/Ms _______, a ____ year old _________male/female with a history of (hypertension, diabetes, dyslipidaemia, diabetes, smoking) was referred to us for the evaluation of (typical angina/atypical angina/non-anginal chest pain, dyspnoea, etc.).
Past cardiac history includes (a prior coronary artery bypass surgery or percutaneous coronary intervention, myocardial infarction, etc.).
Medications include: blockers, antiplatelet drugs, hypolipidaemic drugs.
Resting ECG was (normal) or showed__________ (describe abnormality).
Study protocol was (single day/two day 99mTc-sestamibi rest/stress myocardial perfusion).
The patient received ___mCi/MBq of 99mTc-sestabimi/tetrofosmin/201Tl intravenously and (stress) rest gated SPECT imaging was performed.
Attenuation correction was performed using a rotating line source/multidetector CT scan (10 mA, 120 KeV, gantry rotation time 500 ms).
For viability assessment, delayed images were obtained at___time (201Tl) or nitrates given (99mTc tracers).
70
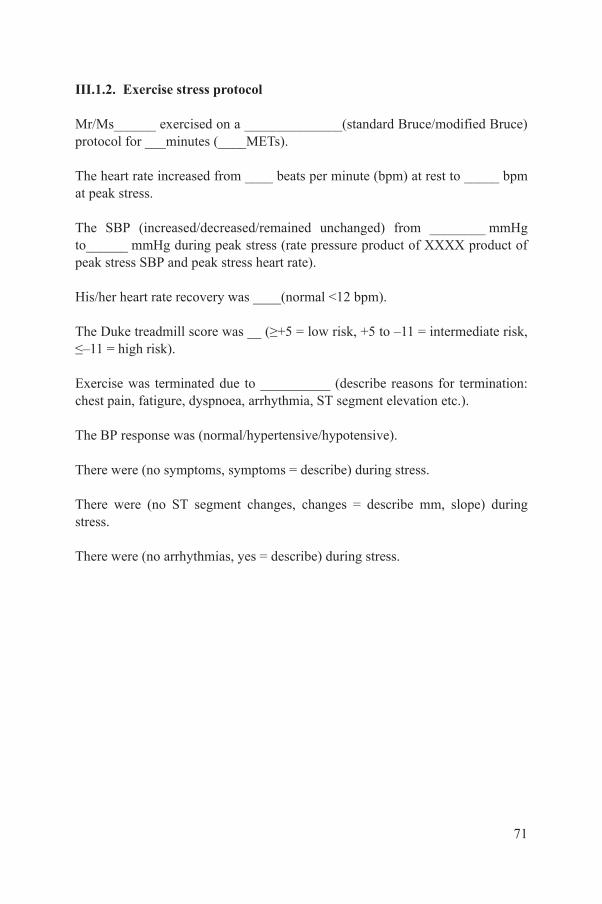
III.1.2. Exercise stress protocol
Mr/Ms______ exercised on a ______________(standard Bruce/modified Bruce) protocol for ___minutes (____METs).
The heart rate increased from ____ beats per minute (bpm) at rest to _____ bpm at peak stress.
The SBP (increased/decreased/remained unchanged) from ________ mmHg to______ mmHg during peak stress (rate pressure product of XXXX product of peak stress SBP and peak stress heart rate).
His/her heart rate recovery was ____(normal <12 bpm).
The Duke treadmill score was __ (≥+5 = low risk, +5 to –11 = intermediate risk, ≤–11 = high risk).
Exercise was terminated due to __________ (describe reasons for termination: chest pain, fatigure, dyspnoea, arrhythmia, ST segment elevation etc.).
The BP response was (normal/hypertensive/hypotensive).
There were (no symptoms, symptoms = describe) during stress.
There were (no ST segment changes, changes = describe mm, slope) during stress.
There were (no arrhythmias, yes = describe) during stress.
71

III.1.3. Vasodilator stress protocol
The LV was (normal/mildly dilated/moderately dilated/severely dilated) in size.
The RV was (normal/mildly dilated/moderately dilated/severely dilated) in size.
The RV tracer uptake was (normal/increased/transiently increased).
The rest and stress myocardial perfusion images were normal (or the stress myocardial perfusion images demonstrated a ________(small/medium/large) perfusion defect of_______(mild/moderate/severe) intensity in the ___________(list segments in vascular distribution) that was _____________(fixed, reversible, mildly reversible, moderately reversible, completely reversible).
Speed/grade Time Heart rate (bpm) Blood pressure (mmHg)
Baseline
Exercise
Stage I 1.7 mph, 10% 2 min
Stage II 2.5 mph, 12% 5 min
Stage III 2.8 mph, 14% 8 min
Stage IV 3.4 mph, 14% 11 min
Stage V 4.2 mph, 16% 14 min
Stage VI 5.0 mph, 18% 17 min
Recovery 0 min
1 min
3 min
5 min
72

III.1.4. Gated myocardial perfusion images
The LV was (normal/abnormal in size with normal/abnormal wall motion and thickening).
The post-stress/ rest LVEF was normal (abnormal) at_____%.
The RV was normal (abnormal) in size with normal (abnormal) wall motion and thickening.
III.1.5. Ancillary findings
None, or (there was a focal abnormal increase in 99mTc-sestamibi uptake in the region of_______; suggest clinical examination and further evaluation if clinically indicated).
III.1.6. Conclusions
• The rest and stress MPI study was normal (or abnormal demonstrating a large/medium/small area of severe/moderate/mild ischaemia in the anterior, anteroseptal and apical walls, or vascular distribution optional).
• The gated study was normal, or abnormal and demonstrated (wall motion abnormalities = describe).
• LVEF values were within (below) normal limits, and post-stress LVEF was similar (decreased with respect to) rest LVEF.
• A prior myocardial perfusion study was performed on ______(date). The current study demonstrates (no significant change/significant disease progression/significant improvement) when compared with the prior study in the anterior/lateral/inferior walls.
• Viability: based on the imaging findings, the myocardial segments are (viable or non-viable).
Signed by: Dr _______________________ Date__________________________
73
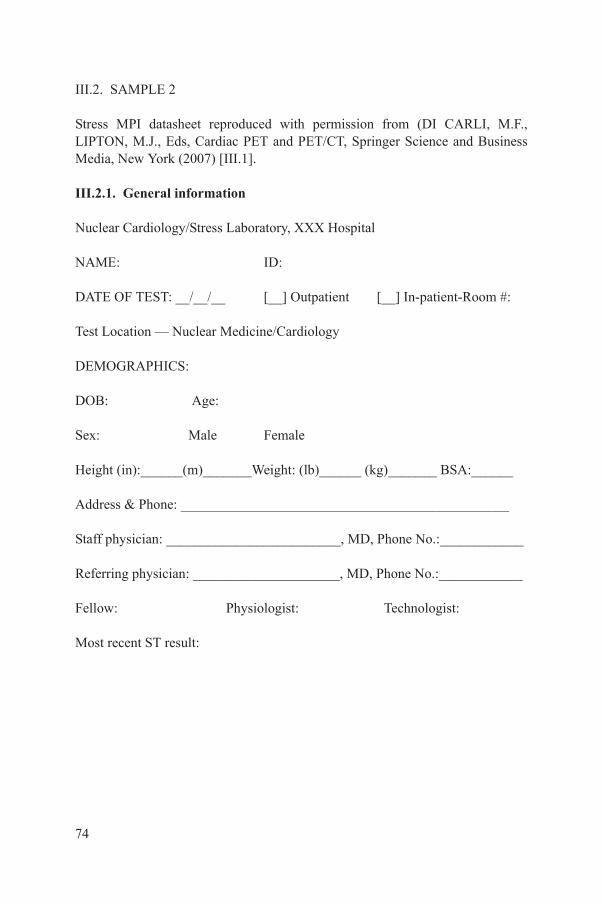
III.2. SAMPLE 2
Stress MPI datasheet reproduced with permission from (DI CARLI, M.F., LIPTON, M.J., Eds, Cardiac PET and PET/CT, Springer Science and Business Media, New York (2007) [III.1].
III.2.1. General information
Nuclear Cardiology/Stress Laboratory, XXX Hospital
NAME: ID:
DATE OF TEST: __/__/__ [__] Outpatient [__] In-patient-Room #:
Test Location — Nuclear Medicine/Cardiology
DEMOGRAPHICS:
DOB: Age:
Sex: Male Female
Height (in):______(m)_______Weight: (lb)______ (kg)_______ BSA:______
Address & Phone: _______________________________________________
Staff physician: _________________________, MD, Phone No.:____________
Referring physician: _____________________, MD, Phone No.:____________
Fellow: Physiologist: Technologist:
Most recent ST result:
74

Brief history:
Cardiac risk factors Yes Prior cardiac history Date Chest pain history
Hypertension No Cardiac Hx Substernal Yes No
Dyslipidemia Recent MI (<1mo) Exertional Yes No
Diabetes Prior MI (>1 mo) Relieved by rest/NTG Yes No
Family Hx CABG NYHA Class
Tobacco PTCA I
Obesity CHF II
Postmenop. Valvular Dz III
None Vascular Dz IV
Reason for test Yes Reason for test Yes Comments
Chest pain evaluation Post-MI evaluation
Dyspnea Post-CABG
Palpitations Post-PCI
Pre-op evaluation Viability assessment
Pre-transplant evaluation Arrhythmias
CHF Other
Medications
Digoxin Nitrates
Betablockers Diuretics
Ca channel blockers Other
ACE inhibitors ALLERGIES?
75
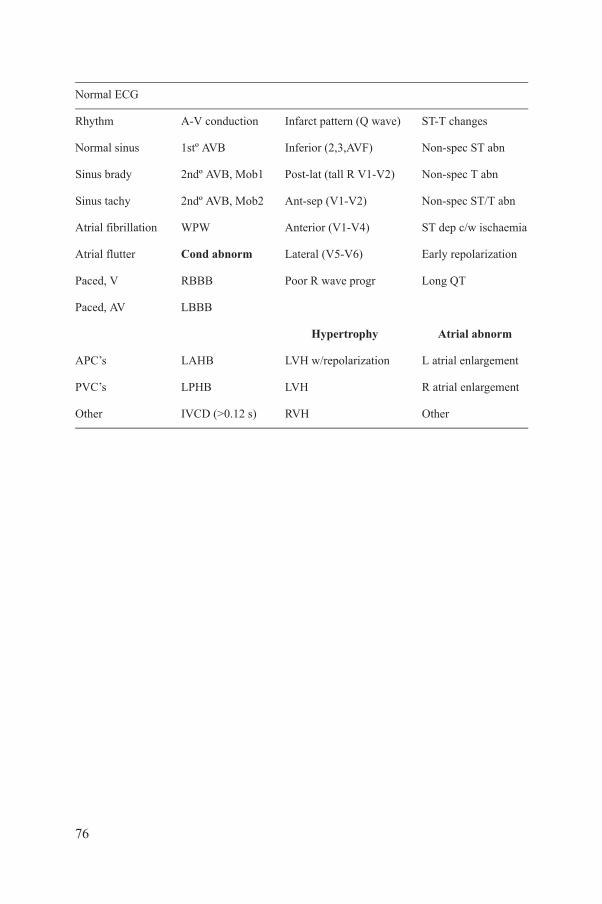
Normal ECG
Rhythm A-V conduction Infarct pattern (Q wave) ST-T changes
Normal sinus 1stº AVB Inferior (2,3,AVF) Non-spec ST abn
Sinus brady 2ndº AVB, Mob1 Post-lat (tall R V1-V2) Non-spec T abn
Sinus tachy 2ndº AVB, Mob2 Ant-sep (V1-V2) Non-spec ST/T abn
Atrial fibrillation WPW Anterior (V1-V4) ST dep c/w ischaemia
Atrial flutter Cond abnorm Lateral (V5-V6) Early repolarization
Paced, V RBBB Poor R wave progr Long QT
Paced, AV LBBB
Hypertrophy Atrial abnorm
APC’s LAHB LVH w/repolarization L atrial enlargement
PVC’s LPHB LVH R atrial enlargement
Other IVCD (>0.12 s) RVH Other
76

III.2.2. Stress protocol
[__] Bruce[__] Modified Bruce
[__] Dobutamine [__] Dipyridamole [__] Adenosine [__] Regadenoson
85% of APHR (age predicted heart rate): _____________
Minutes Stage/Dose HR BP (mmHg) ECG Symptoms
REST Supine:
Standing:
STRESS
RECOVERY
77

III.2.3. Results of ST
Exercise time (min):_________
Rest HR: ________ bpm Peak HR: ________ bpmRest BP: _________mmHg Peak BP: _________mmHg
% of APHR: _______RPP:________METS achieved: _________
ST changes during the test: Y / N, Chest pain during the test: Y / N
Dipyridamole: ___________mg
Adenosine:_____________mg
Amynophylline:_______mg
Max Dobutamine:____mcg/kg/min Atropine:______mg Metoprolol:______mg
NTG:_________mg
Rest 99mTc dose: _____ mCi, Stress 99mTc dose: _____ mCi
III.2.4. Reason for termination
[__] Achieved target workload[__] Completed infusion[__] Leg fatigue[__] Mod-severe chest pain[__] Dyspnea[__] Fatigue[__] >10 mm Hg drop in BP[__] Sustained VT (≥3 beat run)[__] ST elevation (≥1.0 mm)[__] ST depression (≥2 mm horizontal or dowsloping)[__] Hypertensive response (SBP >220 mmHg and/or DBP > 115 mmHg)[__] Other:
78

III.2.5. BP response
[__] Normal[__] Flat BP response[__] Hypotensive response[__] Hypertensive response[__] Not applicable – Vasodilator stress[__] Other:
III.2.6. Arrhythmias
[__] None[__] Atrial Fib/Flutter[__] SVT[__] PVCs: _________________[__] PACs: _________________[__] VT: _________________[__] A-V block: _________________[__] Other: _________________
79

III.2.7. ST segment changes
[__] No ST changes[__] ST segment depression:
[__] Horizontal [__] Downsloping [__] Upsloping
Max ST depression in leads: ____________________
Additional leads with ST depression: ______________________________
Began at ____ min into test, at a HR: ________, at a SBP: ____________
Resolved ____ min into recovery
[__] ST segment elevation (in non-Q wave lead)
In leads: _______________________
Began at ____ min into test at a HR: ________
Resolved ____ min into recovery
[__] Other:
80

III.2.8. Symptoms
[__] None
[__] Typical chest pain: /10 during test/recoveryBegan at ____ min into test at a HR: ________, at a SBP:_______Resolved ____ min into recovery
[__] Atypical chest painBegan at ____ min into test at a HR: ________, at a SBP: _______Resolved ____ min into recovery
[__] DyspneaBegan at ____ min into test at a HR: ________, at a SBP: _______Resolved ____ min into recovery
[__] Other:
III.2.9. Functional capacity
[__] Excellent[__] Very good[__] Good[__] Reduced[__] Not measurable – pharmacological stress
81

III.2.10. Impression
[__] Negative test for myocardial ischaemia[__] Positive test for myocardial ischaemia[__] Positive test for ischaemia but reduced specificity due to baseline ECG
abnormalities[__] Borderline positive test[__] Non-diagnostic test due to baseline ECG abnormalities[__] Non-diagnostic test due to LBBB[__] Clinically significant rhythm disturbance[__] No ECG changes during infusion[__] ST segment depression during infusion[__] Other:
Staff Physician ____________________________________________________Physiologist/Nurse/Technologist ______________________________________
REFERENCE
[III.1] DI CARLI, M.F., LIPTON, M.J., Eds, Cardiac PET and PET/CT, Springer Science and Business Media, New York (2007).
82

Appendix IV
STRATEGIES TO REDUCE THE RADIATION DOSE IN MPI
In the last 30 years, there has been a steady rise in the dose of radiation from medical imaging, which, according to the National Council on Radiation Protection and Measurements accounts for a sixfold increase in the USA IV.1, IV.2, whereby 22% of the total effective dose is attributable to MPI, a radiation intensive technique IV.3. There is a trend towards lowering the radiation burden, given the increasing recognition of the lifetime risks of radiation. Therefore, there is a need for the nuclear medicine community to develop dose reduction strategies similar to what is happening in the field of CTA, where modern technology has enabled a fourfold dose reduction (from 20 mSv down to 4–5 mSv). This goal should be reached while maintaining sensitivity and specificity for MPI IV.4. Additionally, there are now alternative strategies to MPI that can possibly provide similar information to MPI (e.g. stress echocardiography, CT/magnetic resonance perfusion), and they should also be considered in the diagnostic workup of cardiac patients.
Strategies include:
• Stress imaging only or a stress–rest protocol: For the sake of reducing the amount of tracer and radiation exposure, theoretically if the stress image is completely normal then the rest image is not required [IV.5]. Avoiding an unnecessary rest scan can reduce the amount of radiation exposure by more than a half, depending on the protocol utilized. However, for this to be a reliable protocol, it is best suited for patients at low risk for CAD, and the interpretation of the study should be made by an experienced physician.
• Development of solid state (e.g. cadmium zinc telluride) gamma cameras with high photon sensitivity/efficiency: This has reduced the dose required to obtain a diagnostic image. In general, the new-generation cameras have led to a reduction in administered dose of about 40%, without sacrificing diagnostic accuracy [IV.6, IV.7].
• New software algorithms such as wide beam reconstruction technology are now incorporated into all major vendor cardiac imaging software. When wide beam reconstruction is combined with resolution recovery and iterative reconstruction, the dose required for a diagnostic image can be reduced by as much as half, even when conventional camera technology is used [IV.8]. This should be validated on the camera type to be used.
• Technetium-99m based tracers are associated with a lower radiation dose to patient, even when two injections are required for a stress and rest scan. The use of 201Tl is associated with an increased radiation dose, especially if the
83

imaging protocol is combined with a reinjection protocol. The move away from 201Tl is a good way of reducing the radiation dose for the patient, especially when viability is not an issue. The use of the dual isotope (Tl + Tc) protocol should also be discouraged.
• Separate day protocol: The imaging protocol used for can also influence the radiation dose received by the patient. Subject to patient convenience and scheduling, reduced doses and separate day protocols can be selected, resulting in reduced radiation exposure [IV.9, IV.10].
• Tailored dose: The injected dose should be tailored to the body weight of the patient, and not be provided in a ‘one size fits all’ standard dose.
• Cardiac PET: The use of certain PET perfusion tracers can also reduce the radiation dose delivered to the patient.
When used appropriately, these measures will reduce the amount of radiation the patient will receive for MPI. The best measure to reduce radiation risk would be to perform MPI in patients who will most benefit from the test. The appropriate use criteria [IV.11] should be adhered to and national and international guidelines for MPI use followed, so that MPI is not done inappropriately. The decision on the test performed should be made by the referring physician and the MPI team.
REFERENCES
[IV.1] NATIONAL COUNCIL ON RADIATION PROTECTION AND MEASUREMENTS, Ionizing Radiation Exposure of the Population of the United States: Recommendations of the National Council on Radiation Protection and Measurements, Report No.160, NCRP, Bethesda (2009).
[IV.2] METTLER, F.A., Jr, et al., Medical radiation exposure in the US in 2006: preliminary results, Health Phys. 95 (2008) 502–507.
[IV.3] FAZEL, R., et al., Exposure to low-dose ionizing radiation from medical imaging procedures, N. Engl. J. Med. 361 (2009) 849–857.
[IV.4] CERQUEIRA, M.D., et al., Recommendations for reducing radiation exposure in myocardial perfusion imaging, J. Nucl. Cardiol. 17 (2010) 709–718.
[IV.5] CHANG, S.M., et al., Normal stress-only vs. stress/rest myocardial perfusion imaging: Similar patient mortality with reduced radiation exposure, J. Am. Coll. Cardiol. 55(2010) 221–230.
[IV.6] ESTEVES, F.P., et al., Novel solid-state-detector dedicated cardiac camera for fast myocardial perfusion imaging: Multicenter comparison with standard dual detector camera, J. Nucl. Cardiol. 16 (2009) 927–934.
[IV.7] SONGY, B., et al., Comparison of myocardial perfusion imaging using thallium-201 between a new cadmium-zinc-telluride cardiac camera and a conventional SPECT camera, Clin. Nucl. Med. 36 (2011) 776–780.
84

[IV.8] BORGES-NETO, S., et al., Clinical results of a novel wide beam reconstruction method for shortening scan time of Tc-99m cardiac SPECT perfusion studies, J. Nucl. Cardiol. 14 (2007) 555–565.
[IV.9] QURESHI, M., ROBI, A., BHATIA, K., BOKHARI, S., Utility of a low dose technetium stress protocol to minimize radiation exposure in patients with low to intermediate pre-test likelihood of obstructive CAD, J. Am. Coll. Cardiol. 55 (2010) 10A:A90, E850.
[IV.10] DUVALL, W.L., et al., Reduced isotope dose and rapid imaging SPECT MPI with excellent image quality, J. Am. Coll. Cardiol. 55 (2010) 10A:A90.E851.
[IV.11] HENDEL, R.C., et al., ACCF/ASNC/ACR/AHA/ASE/SCCT/SCMR/SNM 2009 Appropriate use criteria for cardiac radionuclide imaging: A report of the American College of Cardiology Foundation, Appropriate Use Criteria Task Force, J. Am. Coll. Cardiol. 53 (2009) 2201–2229.
85
Appendix V
NUCLEAR CARDIOLOGY FOR THE REFERRING PHYSICIAN
The role of MPI as a gatekeeper for patients with and without documented CAD in the diagnostic algorithm is well established. Choosing the right test for the right patient is in the domain of the referring doctor. While certain patients may be suitable for other non-invasive tests (stress ECG, magnetic resonance imaging, echocardiography, or cardiac CT), other patients, particularly those with unstable coronary syndromes, are more suited to invasive coronary angiography. The team supervising the MPI will be aware of the need to keep radiation doses to a minimum; doses used must be within accepted guidelines. If possible, the use of MPI should be avoided in patients who are pregnant. Clinical indications for MPI are presented next.
V.1. CLINICAL INDICATIONS FOR MPI
V.1.1. Evaluation of patients with chest pain or ischaemic equivalent
• Those with intermediate (≥20% to <50%) or high (≥50%) likelihood of CAD7;
• Those with low likelihood of CAD (<20%), with uninterpretable resting ECG or unable to exercise;
• Possible acute coronary syndrome or new or recent onset chest pain.
V.1.2. Clinical situations or symptoms other than ischaemic equivalent
• Cardiac enzyme elevation in conjunction with chest pain and/or ECG abnormalities;
• Patients with abnormal, equivocal or discordant stress testing by ECG or other imaging modality in which the diagnosis of CAD remains a concern;
• Evaluation of coronary stenosis of uncertain significance observed on invasive or non-invasive coronary angiography;
• Evaluation of new-onset or newly diagnosed heart failure;• Evaluation of ventricular tachycardia;
7 Algorithms are available to estimate the likelihood of CAD (see Chapter 2). However, as the prevalence and age of onset of CAD vary from country to country, these algorithms are most applicable to the population on which they were based and not to all populations.
86

• Syncope in patients with an intermediate (>10%) or high (>20%) absolute 10-year risk of a cardiac event based on pre-test CAD risk factors8.
V.1.3. Risk stratification and prognosis assessment
• Chest pain syndrome in a patient with high pre-test likelihood of CAD;• Following myocardial infarction or acute coronary syndrome;• Monitoring the effects of treatment of CAD, including revascularization
and medical therapy;• Patients with a previous abnormal coronary angiography or stress imaging
study, in whom MPI would be expected to alter clinical management;• Viability assessment in patients with LV systolic dysfunction, in whom this
assessment would be expected to alter clinical management;• Patients undergoing non-cardiac major surgery and with an intermediate
(≥20% to <50%) or high (≥50%) likelihood of CAD.
V.1.4. Possible indications for asymptomatic patients
• Patients with an intermediate (≥10% to <20%) or high (≥20%) absolute 10-year risk of a cardiac event based on pre-test CAD risk factors;
• Patients with diabetes and evidence of a diabetic complication, prolonged duration of diabetes or an additional CAD risk factor, or patients with diabetes who are female;
• Patients with evidence of extracardiac atherosclerotic vascular disease;• Patients with a coronary calcium Agatston score of >400 or >100 in patients
with diabetes;• Chronic kidney disease (glomerular filtration rate) <30 mL/min);• Troponin elevation without evidence of acute coronary syndrome;• Syncope with intermediate to high pre-test likelihood of CAD.
Patient preparation prior to testing will help achieve maximal accuracy in the study. Ideally, an information sheet should be given to the patient (see Appendix I). Below is a list of important considerations for the referring doctor.
8 Algorithms are available to estimate the absolute 10-year risk of a cardiac event (references for the various scores, Framingham, Prospective Cardiovascular Münster Study, etc.). Analogous to the likelihood evaluation described above, differences in the prevalence and age of onset of CAD vary from country to country, making these algorithms most applicable to the population on which they were based.
87
V.2. PATIENT PREPARATION — KEY ISSUES FOR REFERRING CLINICIANS
• Anti-anginal medication, especially beta blockers, should ideally be ceased for up to 48 h prior to testing. This is particularly important for an exercise or dobutamine protocol. In occasional prognostic evaluations, a study can be performed on medication.
• Patients should cease all caffeine (or similar) intake 24 h prior to study. This will allow a dipyridamole or adenosine protocol to be performed, even unscheduled. Caffeine will block adenosine receptors and may result in a false-negative study.
• Asthma can be aggravated by dipyridamole and adenosine, which may be contraindicated. Dobutamine can be used instead. Patients with COPD without bronchospasm may still be suitable for dipyridamole and adenosine testing.
• The patient should always come prepared for exercise (which may be combined with pharmacological studies to improve sensitivity and image quality).
• The study may involve two sets of imaging, possibly even a 2 day protocol, so that ischaemia can be evaluated by looking for a reversible defect.
• If a LBBB or paced rhythm is present, a dipyridamole or adenosine protocol is often used. Higher heart rates (such as those with exercise or dobutamine) will increase the likelihood of a false-positive reversible septal defect in these patients.
The MPI study will provide the clinician with a combination of clinical information, stress data and the perfusion image.
• The study may be normal (after the exclusion of artefacts), ischaemic (with the identification of a reversible defect) or indicative of a previous infarct (a fixed defect), or a combination of the latter.
• The MPI study will provide the clinician the ability to triage their patient accordingly. Additionally, this decision is often guided not simply by the presence of ischaemia but also by the amount of ischaemia and the level of stress performed.
• In most patients, LV function can also be assessed by gating the study at stress and/or rest. This may allow further implementation of varying strategies for heart failure.
• Increased lung uptake of tracer and TID may also infer increased cardiac risk.
88
• Once the result is available, the clinician can incorporate the results into the management algorithm.
• If the study is normal, the patient’s risk of a cardiac event remains less than 1% per annum — slightly greater in patients with diabetes, patients with prior CAD and patients undergoing pharmacological stress testing. The MPI remains a test of ischaemia, not of atherosclerosis and hence the non-obstructive lesion will be missed. The option remains of combining the MPI with CTA or calcium scoring, to address this issue.
• Conversely, the presence of increasing ischaemia is associated with an increasingly adverse prognosis. Studies have shown that if more than 12.5% of the patient’s heart is ischaemic, they will do better with revascularization (if possible) rather than medical therapy.
• However, this cannot be applied to all patients universally — any decision regarding management must incorporate the patient’s symptomatic status, clinical examination, other tests and any potential benefit of an intervention. If the MPI result and clinical data/stress ECG results are discordant, a more aggressive management plan may be necessary.
In conclusion, MPI remains a powerful and robust test, which can become a vital part of the clinician’s armamentarium in the diagnosis and management of coronary disease. Discussion with the physician supervising the MPI should always be encouraged.
89
Appendix VI
ROLE OF CARDIAC PET AND PET/CT IN DEVELOPING COUNTRIES
VI.1. GENERAL CONSIDERATIONS
• CAD is a major health problem in developing countries. Non-invasive imaging has an important cost effective role for diagnosis and to guide therapy in this group of patients. PET/CT is now more available in many of these countries; it is used mainly in oncology, but cardiac studies may increase in the future, especially with new 18F labelled perfusion agents [VI.1, VI.2].
• Cardiac PET/CT, a hybrid imaging technique, allows an anatomic and functional evaluation of the heart. This method gives information about the coronary artery calcium score, coronary anatomy through CTA, myocardial perfusion and metabolism, and rest and stress EF. Coronary artery calcium score has an important role in estimating coronary risk. CTA has a high negative predictive value to exclude CAD but its positive predictive value is still low.
• The goal of evaluating myocardial perfusion with PET imaging is to detect haemodynamically significant CAD. PET tracers have a short half-life and are more physiologic agents than those used in SPECT. The most commonly used agents for perfusion are 13N, ammonia, 82Rb, and 15O water. PET tracers are valuable agents for measuring either absolute or relative MBF; for absolute measure, dynamic acquisition from the time of injection is required. Assessment of MBF is a promising technique and its clinical value is still under research.
• The major indication of a PET/CT study is to establish the diagnosis and prognosis of patients with known or suspected CAD, through the evaluation of MBF (perfusion agents) and viability (metabolic agents).
• For stress–rest PET perfusion studies, patient preparation is similar to that described for a myocardial SPECT study. Pharmacological stress is always preferred because patients need to be positioned under the camera during injection. If an 18F-fluorodeoxyglucose (FDG) (viability) study is to be performed, appropriate consideration of the patient’s glucose level should be made, with utilization of glucose load and insulin clamps according to local protocols.
90

• The acquisition protocols are related to the duration of uptake and clearance of the different radiopharmaceuticals and their physical half-lives. CT is used for rest and stress attenuation correction. The recommendations for display of PET perfusion rest–stress images are consistent with those for SPECT.
VI.2. IMAGE ANALYSIS AND INTERPRETATION
• Myocardial perfusion: The images should be interpreted initially without clinical information, in order to minimize any bias in study interpretation.
• Lung uptake.• RV uptake (rarely seen with 82Rb).• Blood pool activity.• Evaluation of perfusion defects at rest and during stress to detect necrosis
and ischaemia, perfusion defect location, perfusion defect severity and extent; LV and RV size.
• Extracardiac findings.• Metabolic images: These images are performed with 18F-FDG and are used
for viability assessment.• Metabolic images need to be compared with perfusion images to establish
the mismatch or match pattern.• A mismatch pattern (a perfusion defect with metabolic uptake of FDG)
represents viability, while a matched pattern (perfusion defect with no FDG uptake) represents scarred tissue.
• After revascularization, patients with a mismatch pattern usually have improvement in heart failure symptoms, EF and survival.
• Extracardiac findings can be related to the presence of malignant tumours and should be investigated.
VI.3. CLINICAL APPLICATIONS OF PET/CT
• Myocardial perfusion: This is an important clinical application of PET for the diagnosis and prognosis of patients with CAD and has a sensitivity higher than 90%.
• MBF quantification: Quantitative assessment of MBF in absolute units (mL/min/g tissue) offers an objective interpretation that is inherently more reproducible than visual analysis. Absolute quantification may aid in assessing the physiological significance of a coronary stenosis and in describing changes between two studies in the same patient and may
91

identify balanced impaired MBF due to multivessel disease or diffuse, small vessel disease. It requires the acquisition of images in dynamic mode (list mode). The added value in terms of diagnosis and prognosis is still being researched.
• Endothelial function: Endothelial dysfunction represents the first stage of coronary atherosclerotic disease. It appears in asymptomatic patients with coronary risk factors. The evaluation of PET MBF can be done at rest and stress and, if required, by the cold pressor test. This can help to identify endothelial dysfunction, through the evaluation of coronary flow reserve (stress/rest MBF) and endothelium-dependent vasodilatation index (cold pressor test/rest MBF).
• Combination of perfusion and coronary CTA: The accuracy of the study increases with the combination of anatomic and functional information. However, dual modality studies are associated with higher radiation burden, and, on the other hand, the true clinical utility of combined information is currently under investigation.
• Myocardial viability: PET represents a helpful technique for diagnosis of myocardial viability, based on a mismatch pattern.
• Coronary plaque inflammation: High FDG uptake can be observed in atherosclerotic coronary plaques; this issue is still under investigation.
REFERENCES
[VI.1] MACHAC, J., et al., Imaging guidelines for nuclear cardiology procedures: Positron emission tomography myocardial perfusion and glucose metabolism imaging, J. Nucl. Cardiol. 13 (2006) 121–151.
[VI.2] FLOTATS, A., et al., Cardiovascular Committee of the EANM, the ESCR and the ECNC, Hybrid cardiac imaging: SPECT/CT and PET/CT, a joint position statement by the European Association of Nuclear Medicine (EANM), the European Society of Cardiac Radiology (ESCR) and the European Council of Nuclear Cardiology (ECNC), Eur. J. Nucl. Med. Mol. Imaging 38 (2011) 201–212.
92
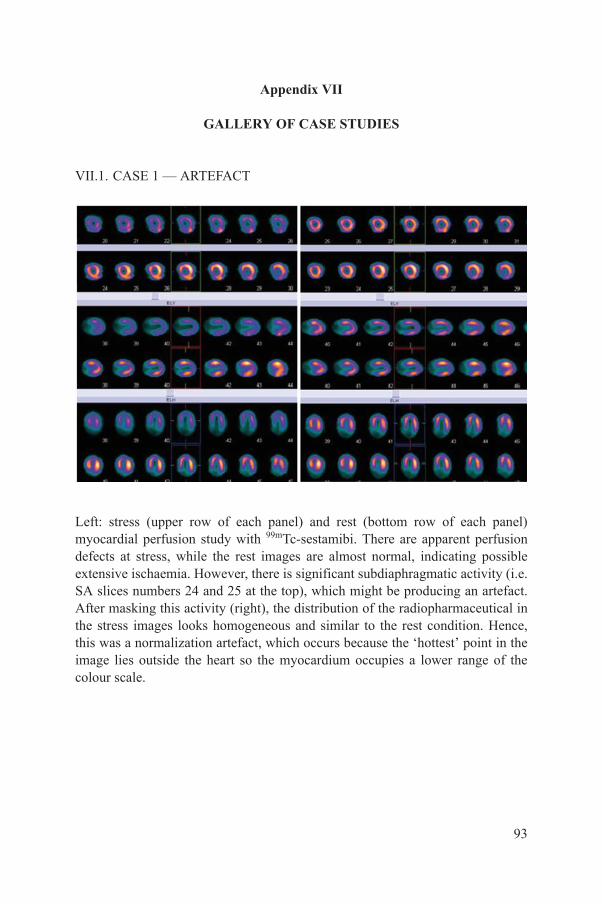
Appendix VII
GALLERY OF CASE STUDIES
VII.1. CASE 1 — ARTEFACT
Left: stress (upper row of each panel) and rest (bottom row of each panel) myocardial perfusion study with 99mTc-sestamibi. There are apparent perfusion defects at stress, while the rest images are almost normal, indicating possible extensive ischaemia. However, there is significant subdiaphragmatic activity (i.e. SA slices numbers 24 and 25 at the top), which might be producing an artefact. After masking this activity (right), the distribution of the radiopharmaceutical in the stress images looks homogeneous and similar to the rest condition. Hence, this was a normalization artefact, which occurs because the ‘hottest’ point in the image lies outside the heart so the myocardium occupies a lower range of the colour scale.
93
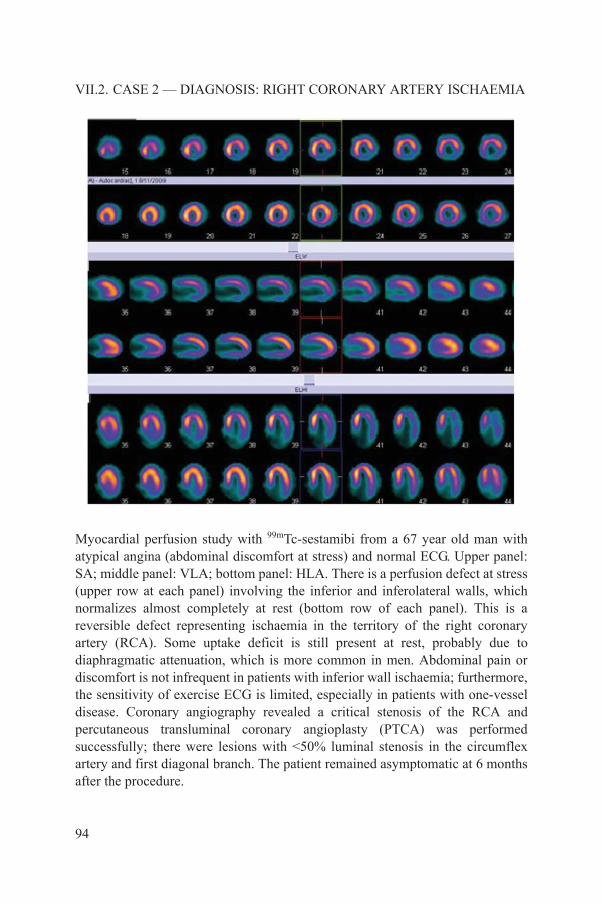
VII.2. CASE 2 — DIAGNOSIS: RIGHT CORONARY ARTERY ISCHAEMIA
Myocardial perfusion study with 99mTc-sestamibi from a 67 year old man with atypical angina (abdominal discomfort at stress) and normal ECG. Upper panel: SA; middle panel: VLA; bottom panel: HLA. There is a perfusion defect at stress (upper row at each panel) involving the inferior and inferolateral walls, which normalizes almost completely at rest (bottom row of each panel). This is a reversible defect representing ischaemia in the territory of the right coronary artery (RCA). Some uptake deficit is still present at rest, probably due to diaphragmatic attenuation, which is more common in men. Abdominal pain or discomfort is not infrequent in patients with inferior wall ischaemia; furthermore, the sensitivity of exercise ECG is limited, especially in patients with one-vessel disease. Coronary angiography revealed a critical stenosis of the RCA and percutaneous transluminal coronary angioplasty (PTCA) was performed successfully; there were lesions with <50% luminal stenosis in the circumflex artery and first diagonal branch. The patient remained asymptomatic at 6 months after the procedure.
94

VII.3. CASE 3 — DIAGNOSIS AND RISK STRATIFICATION
A 56 year old woman with diabetes and a history of dyspnoea and an equivocal exercise ECG. With dipyridamole (upper row at each panel), a perfusion defect is seen at the mid-portion of the anterior wall, which resolves completely at rest. This reversible defect is consistent with ischaemia in the territory of a diagonal branch of the left anterior descending artery (LAD). In addition, there is TID of the LV (compare the size of the LV cavity at stress and at rest). Coronary angiography demonstrated multiple lesions in the LAD and its main branches, the circumflex artery and distal right coronary artery. TID is associated with high risk for cardiac events and is commonly seen in patients with multivessel disease. In this case, the perfusion defect is only evident in the distribution of the diagonal branch; however, the presence of TID should raise the suspicion of more extensive disease.
95
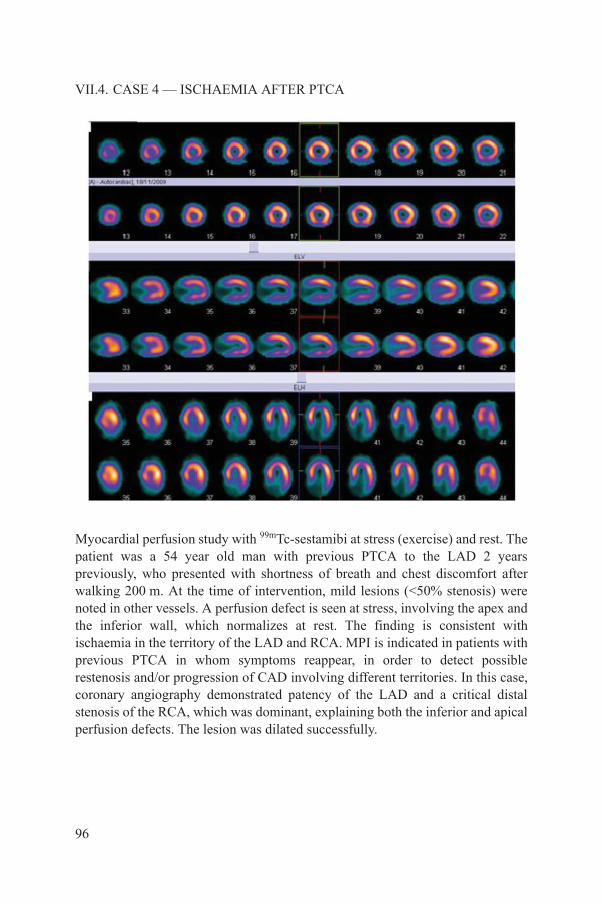
VII.4. CASE 4 — ISCHAEMIA AFTER PTCA
Myocardial perfusion study with 99mTc-sestamibi at stress (exercise) and rest. The patient was a 54 year old man with previous PTCA to the LAD 2 years previously, who presented with shortness of breath and chest discomfort after walking 200 m. At the time of intervention, mild lesions (<50% stenosis) were noted in other vessels. A perfusion defect is seen at stress, involving the apex and the inferior wall, which normalizes at rest. The finding is consistent with ischaemia in the territory of the LAD and RCA. MPI is indicated in patients with previous PTCA in whom symptoms reappear, in order to detect possible restenosis and/or progression of CAD involving different territories. In this case, coronary angiography demonstrated patency of the LAD and a critical distal stenosis of the RCA, which was dominant, explaining both the inferior and apical perfusion defects. The lesion was dilated successfully.
96
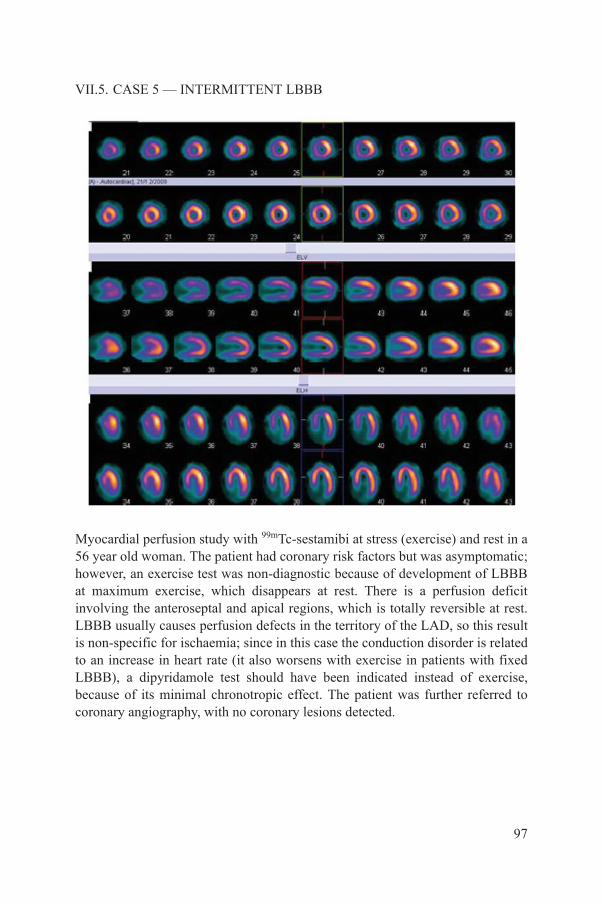
VII.5. CASE 5 — INTERMITTENT LBBB
Myocardial perfusion study with 99mTc-sestamibi at stress (exercise) and rest in a 56 year old woman. The patient had coronary risk factors but was asymptomatic; however, an exercise test was non-diagnostic because of development of LBBB at maximum exercise, which disappears at rest. There is a perfusion deficit involving the anteroseptal and apical regions, which is totally reversible at rest. LBBB usually causes perfusion defects in the territory of the LAD, so this result is non-specific for ischaemia; since in this case the conduction disorder is related to an increase in heart rate (it also worsens with exercise in patients with fixed LBBB), a dipyridamole test should have been indicated instead of exercise, because of its minimal chronotropic effect. The patient was further referred to coronary angiography, with no coronary lesions detected.
97
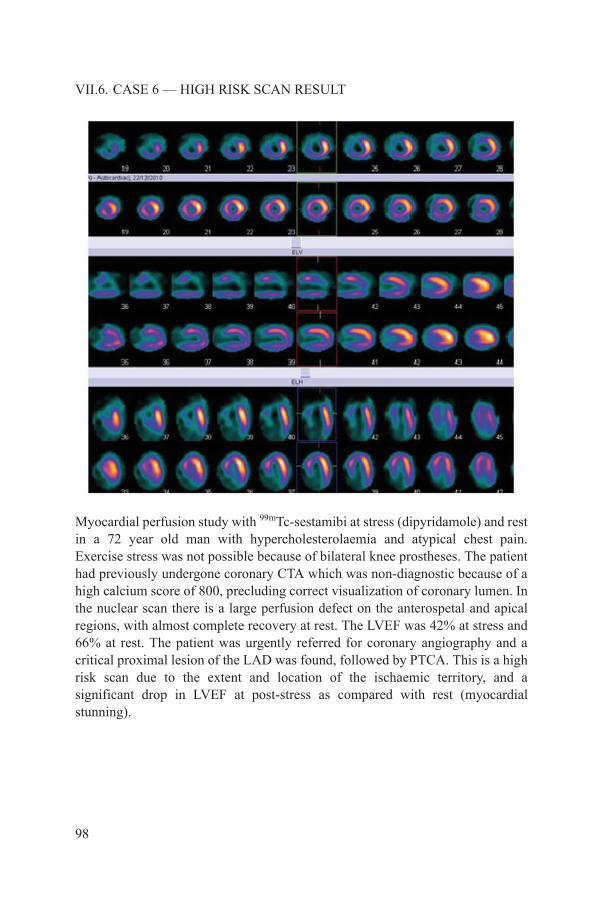
VII.6. CASE 6 — HIGH RISK SCAN RESULT
Myocardial perfusion study with 99mTc-sestamibi at stress (dipyridamole) and rest in a 72 year old man with hypercholesterolaemia and atypical chest pain. Exercise stress was not possible because of bilateral knee prostheses. The patient had previously undergone coronary CTA which was non-diagnostic because of a high calcium score of 800, precluding correct visualization of coronary lumen. In the nuclear scan there is a large perfusion defect on the anterospetal and apical regions, with almost complete recovery at rest. The LVEF was 42% at stress and 66% at rest. The patient was urgently referred for coronary angiography and a critical proximal lesion of the LAD was found, followed by PTCA. This is a high risk scan due to the extent and location of the ischaemic territory, and a significant drop in LVEF at post-stress as compared with rest (myocardial stunning).
98
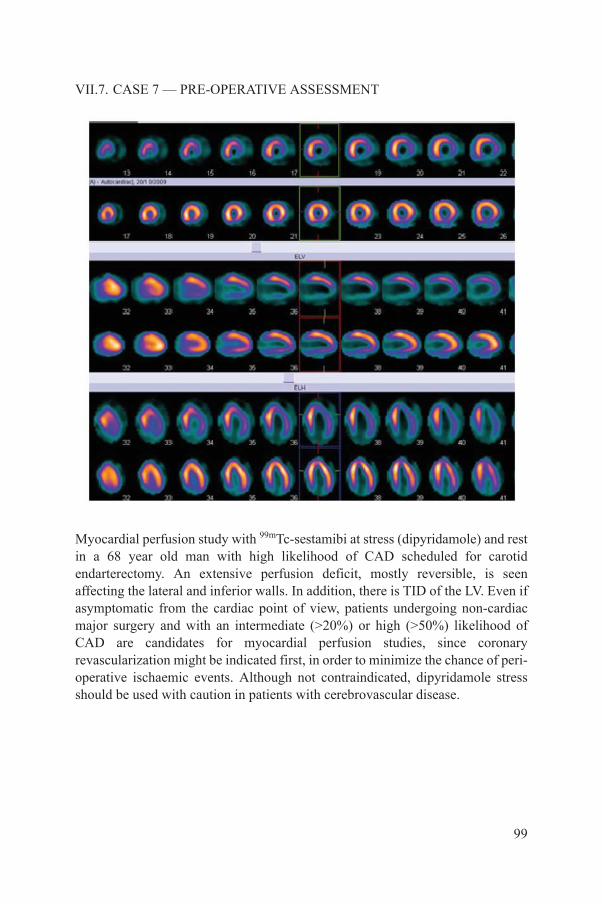
VII.7. CASE 7 — PRE-OPERATIVE ASSESSMENT
Myocardial perfusion study with 99mTc-sestamibi at stress (dipyridamole) and rest in a 68 year old man with high likelihood of CAD scheduled for carotid endarterectomy. An extensive perfusion deficit, mostly reversible, is seen affecting the lateral and inferior walls. In addition, there is TID of the LV. Even if asymptomatic from the cardiac point of view, patients undergoing non-cardiac major surgery and with an intermediate (>20%) or high (>50%) likelihood of CAD are candidates for myocardial perfusion studies, since coronary revascularization might be indicated first, in order to minimize the chance of peri-operative ischaemic events. Although not contraindicated, dipyridamole stress should be used with caution in patients with cerebrovascular disease.
99

VII.8. CASE 8 — TID WITH NEAR-NORMAL PERFUSION
Myocardial perfusion study with 99mTc-sestamibi at stress (dipyridamole) and rest in a 45 year old woman with diabetes and a syncopal episode and no previous cardiac history. At admission, periods of self-limited ventricular tachycardia were registered but with no ischaemic ECG changes and normal troponin serum levels. Although only few equivocal perfusion defects are observed in the nuclear scan (apex, inferior wall), there is very significant TID of the LV. Since the nuclear result was not conclusive and the patient was now stable and asymptomatic, as a second non-invasive test she was referred to CTA, where multiple coronary lesions were detected. Cardiac catheterization was performed, followed by coronary artery bypass graft with bypass grafts to the three main coronary arteries. In the absence of definite perfusion defects, TID suggests triple vessel disease with balanced ischaemia. Diabetes can also be associated with small vessel disease, adding to the diffuse nature of ischaemic episodes.
100
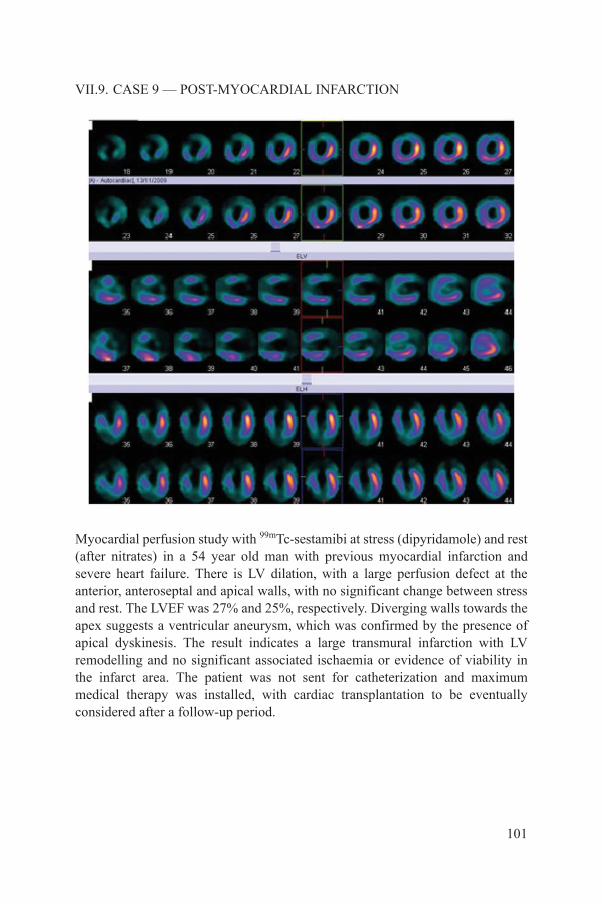
VII.9. CASE 9 — POST-MYOCARDIAL INFARCTION
Myocardial perfusion study with 99mTc-sestamibi at stress (dipyridamole) and rest (after nitrates) in a 54 year old man with previous myocardial infarction and severe heart failure. There is LV dilation, with a large perfusion defect at the anterior, anteroseptal and apical walls, with no significant change between stress and rest. The LVEF was 27% and 25%, respectively. Diverging walls towards the apex suggests a ventricular aneurysm, which was confirmed by the presence of apical dyskinesis. The result indicates a large transmural infarction with LV remodelling and no significant associated ischaemia or evidence of viability in the infarct area. The patient was not sent for catheterization and maximum medical therapy was installed, with cardiac transplantation to be eventually considered after a follow-up period.
101
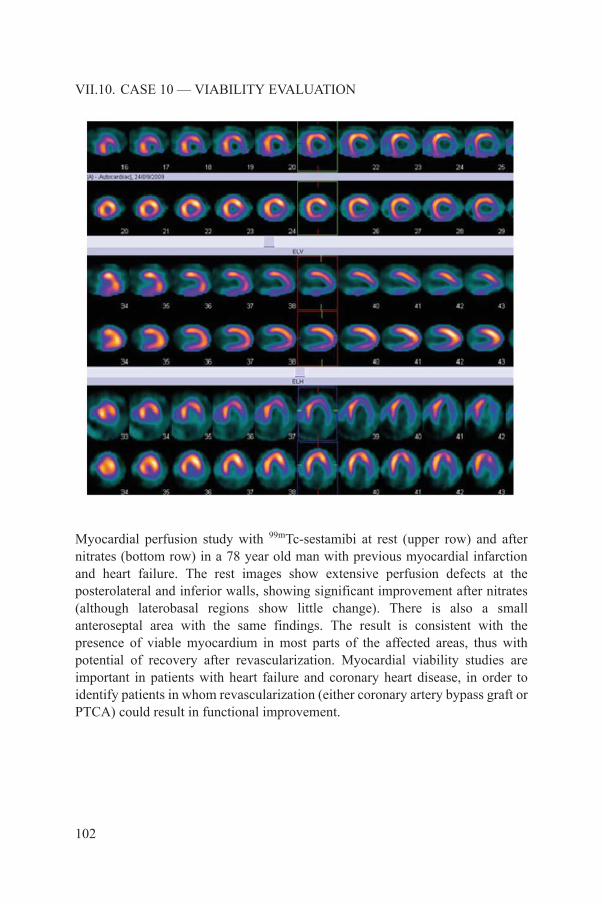
VII.10. CASE 10 — VIABILITY EVALUATION
Myocardial perfusion study with 99mTc-sestamibi at rest (upper row) and after nitrates (bottom row) in a 78 year old man with previous myocardial infarction and heart failure. The rest images show extensive perfusion defects at the posterolateral and inferior walls, showing significant improvement after nitrates (although laterobasal regions show little change). There is also a small anteroseptal area with the same findings. The result is consistent with the presence of viable myocardium in most parts of the affected areas, thus with potential of recovery after revascularization. Myocardial viability studies are important in patients with heart failure and coronary heart disease, in order to identify patients in whom revascularization (either coronary artery bypass graft or PTCA) could result in functional improvement.
102
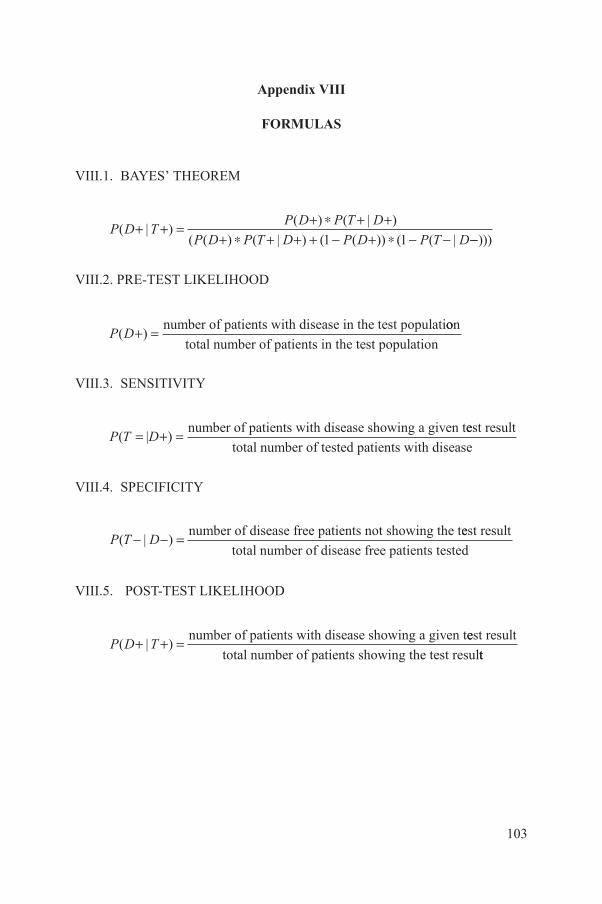
Appendix VIII
FORMULAS
VIII.1. BAYES’ THEOREM
VIII.2. PRE-TEST LIKELIHOOD
VIII.3. SENSITIVITY
VIII.4. SPECIFICITY
VIII.5. POST-TEST LIKELIHOOD
P D TP D P T D
P D P T D P D P T D( | )
( ) ( | )
( ( ) ( | ) ( ( )) ( ( |+ + = + * + +
+ * + + + - + * - -1 1 --)))
P D( )+ = number of patients with disease in the test populatioon
total number of patients in the test population
P T D( )= + =|number of patients with disease showing a given teest result
total number of tested patients with disease
P T D( | )- - = number of disease free patients not showing the teest result
total number of disease free patients tested
P D T( | )+ + = number of patients with disease showing a given teest result
total number of patients showing the test resultt
103

.
ABBREVIATIONS
ACC American College of CardiologyAHA American Heart AssociationBP blood pressureCAD coronary artery diseaseCOPD chronic obstructive pulmonary diseaseCT computed tomographyCTA computed tomography angiographyECG electrocardiogramEF ejection fractionFBP filtered back projectionFDG fluorodeoxyglucoseHLA horizontal long axisIV intravenous/intravenouslyLAD left anterior descending arteryLBBB left bundle branch blockLHR lung-to-heart ratioLV left ventricle/left ventricularLVEDV left ventricular end-diastolic volumeLVEF left ventricular ejection fractionLVESV left ventricular end-systolic volumeMBF myocardial blood flowMET metabolic equivalent taskMIBI methoxyisobutylisonitrileMLEM maximum likelihood expectation minimizationMPHR maximum predicted heart rateMPI myocardial perfusion imagingOSEM ordered subset expectation minimizationPET positron emission tomographyPTCA percutaneous transluminal coronary angioplastyQA quality assuranceQC quality controlRCA right coronary arteryRV right ventricle/right ventricularSA short axisSBP systolic blood pressureSPECT single photon emission computed tomographyST stress testTID transient ischaemic dilationVLA vertical long axis
105

.
CONTRIBUTORS TO DRAFTING AND REVIEW
Alexanderson, E. Universidad Nacional Autónoma de México, Mexico
Better, N. Royal Melbourne Hospital, Australia
Bouyoucef, S.-E. Centre Hospitalier Universitaire de Bab El-Qued, Algeria
Dondi, M. International Atomic Energy Agency
Dorbala, S. Brigham and Women’s Hospital,United States of America
El-Haj, N. International Atomic Energy Agency
Giubbini, R. Spedali Civili di Brescia, Italy
Keng, F. National Heart Centre, Singapore
Kumar, A. Fortis Escorts Heart Institute and Research Centre, India
Marcassa, C. Cardiology Division Fondazione Salvatore Maugeri IRCCS, Italy
Massardo, T. Universidad de Chile, Chile
Milan, E. Ospedale Civili U.O., Italy
Mut, F. Asociación Española, Uruguay
Obaldo, J. Philippine Heart Center For Asia, Philippines
Paez, D. International Atomic Energy Agency
Peix, A. Instituto de Cardiologia y Cirugia Cardiovascular, Cuba
Thomas, G. Mission Internal Medical Group,United States of America
107

Vitola, J. Quanta Diagnostico Nuclear, Brazil
Vorster, M. Pretoria Academic Hospital, South Africa
Consultants MeetingVienna, Austria: 21–25 February 2011
108

@������
��������� ���������������� ��������������������������������� �������������������������� ������������ ���������
����������������������������������� �������������������������������� ����� !"����������
������ �#��������� ��� ��$�����%&'�(� �������)�����*�+!,�*�-.-/��
+�������0�1%.�-�2/.3�4444�5�6�70�1%.�-�2/.3�44''��
���0����$��8������ ��������5�(���� �0�� �099���������� ��������
!� " �#:�������;��������$��������)��/3/��<=..23�<��������
+�������0�1-/�/�>-'�&-�3'�5�6�70�1-/�/�>-'�3'�&.��
���0��������������8������������5�(���� �0�� �099��������=��=���������
$���%�<������������ ����&>3.�6������<$��� � ��/33��;�������*#�/343%=&-&%��� ���
+�������0�.='33='%>=-&>4�5�6�70�.='33='%>=-&>3��
���0���� ��������8�����������5�(���� �0�� �099���������������
)������������?�!�������; ����.=>-%2�!��� ���)����" �����"� �����@.:�2:-��
+�������0�1%.-�4&>�/%%>�5�6�70�1%.-�4&>�4%%3��
���0���������� 8����������������5�(���� �0�� �099��������������������
$& ������������ ������!�����0�!���������������?������� ���!������ ����+����� ��� �� ������"��<�7�/.3-��<���?�
$'�$&���(�! $ ������!A�� �)�"���@�����$��-&4��.'3�/.�������2��
+�������0�1&/3�/%%3-�>-%&�5�6�70�1&/3�/'&'/�.%&%��
���0������8��������B�5�(���� �0�� �099������������B�
) � ��%��� �������@������������"�<"C�./'�D@������� ��.E��6��=33.3.�,������
+�������0�1->'�2�./.�&.�5�6�70�1->'�2�./.�&&>3��
���0���� ���8��� �����������5�(���� �0�� �099������� �����������
)���$�6���=�� ��>������:����������"��<�7�/>��6=4>2/.������!���7�.2��
+�������0�1--�.�&/�3.�&2�&2�5�6�70�1--�.�&/�3.�23�23��
���0������� 8������ ����5�(���� �0�� �099����������� ����
;�$����� � ��.&>�����������$?����2&/-%�!������!���7��
+�������0�1�--�.�&4�&3�%4�3/�5�6�7�1--�.�&4�&3�%4�3/��
���0��������$�����8�$��������5�(���� �0�� �099�����$��������
"��#��*��"=F���?��F�� ����=�����F���?��G��,�����,��?�� ���.3��#=>-..-�<�����
+�������0�1�&2�//'�2&�23�/3�5�6�70�1&2�//'�2&�23�/3����1&2�//'�2&�23�///��
���0���� ���?8���=$���?����5�(���� �0�� �099�������=$���?����
&��"��*;��� �����; ����<��������� ����"��<�7�./%��,=.%>%�<������ ��
+�������0�1-%�.�/>4�4444�5�6�70�1-%�.�/>4�4&4/�5����0������8��� ��������
�% ��������������G������.� �6�����#������,������.>��:�����,������*��?��<������� � ���*�����&33�33.���
+�������0�12.�//�//%.42/%9/4�5�6�70�12.�//�//%.42/'��
���0�����8$�������5�(���� �0�� �099��������������������
<�������/94/����������!������#���..3332��
+�������0�12.�..�/-/%'4'%��12.�..�/-/>4/%&�5�6�70�12.�..�/-/'.-.>��
���0�������8$����� �
�� *;������ ��� H���#� ��;������<����I���"�J��F��!������%���=/3.&%�*����
+�������0�1-2�3/�&'�2>�&>�>/����&'�2>�&>�%/�5�6�70�1-2�3/�&'�2>�&>�&'��
���0����8�������������5�(��� �0�����������������

+�(��*���B���!��������; ����.-=%�����������-��������!���=����+�����.3-=33/4��
+�������0�1'.�-�-/4>�'>'/�5�6�70�1'.�-�-/4>�234/��
���0�������8����B���������5�(���� �0�� �099��������B���������
��(�! $�,)�-,���@�� �������������� ���<�������#�� �� �����<�?��/���6�����/4>=.�K��?�:��=���?� ��!��=G�� ����.-4=.-3�
+�������0�13/�>'2�.4&3�5�6�70�13/�>'2�.4&%�5�(���� �0�� �099��������������
���&�� ��%�#��;���������� ���� ���������� ���<�F���*�������)�� ��� ��� �/3����;=4&'/�<A�,�������?����
+�������0�1-.�D3E�>-�>4&333&�5�6�70�1-.�D3E�>-�>4/2/2%��
���0������8��������������5�(���� �0�� �099������������������
*�� ������������� ���� �����@���������>3����"��<�7�.'>-��/433�!A�A�� ��������
+�������0�1-.�42-�%'&�&33�5�6�70�1-.�42-�%.>�%2'��
���0����8���������5�(���� �0�� �099�������������
�� ������A� �?�����$�����"��<�7�'-3��/.%3� A�;�����
+�������0�1-.�/>/�&->�...�5�6�70�1-.�/>/�&.>�'''��
���0������8��� ����5�(���� �0�� �099������� ����
����'�� ��%#��������� ��� ��$�����%&'�(� �������)�����*�+!,�*�-.-/����� �����
+�������0�1%.�-�2/.3�4444�5�6�70�1%.�-�2/.3�44''��
���0����$��8������ ��������5�(���� �0�� �099���������� ��������
� ,.�� �!�������$��A��B���������@�� ����$��/�� �=.>./�;���������
+�������0�1-'%�.�&-/�-.�&&�5�6�70�1-'%�.�/-3�.&�->��
���0����� ������8��������$�=B���5�(���� �0�� �099������������$�=B��9�$�B�
�(� �#L�B���� �� ���� ������9�:����<��$���-����=/'33%�*������
+�������0�1-&�2.�4'.�2&�'3�5�6�70�1-&�2.�>4>�>>�%-��
���0��������8��B����� �������������8��B����� ���������������8��B����� ����������8��B����� �����
(���� �0�� �099������B����� ������
�� ��%�- �"%,#+��� � ������"�H���; ����� ���� ���� �����?�������"�<�7�/2�����������)-�.�G���
+��������D������E0�1&&�'43�%33�>>>/�5�D��M����E0�1&&�/34�'4-�'-4/�5�6�70�1&&�/34�'4-�'/3-��
����D������E0������������8 ���������5�D��M����E0��������M����8 ���������5�(���� �0�� �099���� ���������
"�=�����������
#�;+���� ��<����(���������; ����-2���7������)���������� ����� �������@+.>�/�N��
���0����8��������������5�(���� �0�� �099������������������
<�������� �����$������ ��
��� ���� �; ������"��<�7�..2�� �$���?�� G.�&+���
+�������0�1&&�.&-'4&'...�5�6�70�1&&�.&-'4&''&&��
���0�������8��� ���� �����5�(���� �0�� �099������� ���� ����
�� ��%���� ,��#�� ���33&��)����#!/=3'>-��6�� ��$������ �&% �� ��� ������K�������K��.33.4��� ���
D��E�+�������0�1'33�/>-=2%&%����1/./�2%-='-3/�5�6�70�1/./�2%-=-&'2��
���0������ ���8�����?�5�(���� �0�� �099���������?�
�� ��%��������,)��#�� $�<������������ ����&>3.�6������<$���� � ��/33��;�������*#�/343%=&-&%�
+�������0�.='33='%>=-&>4�5�6�70�.='33='%>=-&>3��
���0���� ��������8�����������O�(���� �0�� �099���������������
)������������?�!�������; ����'./����� ����$����"?�������?���K��.-%%2��
+�������0�1'''�>>.�4&43�D �=����E�5�6�70�1'''�>%'�'>&%�D �=����E��
���0���������� 8����������������5�(���� �0�� �099��������������������
,�������/������������0������������������������������� �� �0�
#�1������������������2� ��������������0������3�����3��
F������� ���� ����!�� �����"�<�7�.33��.&33�F��������� ���
+�������0�1&-�.�/%33�//>/2�D���//>-3E�5�6�70�1&-�.�/%33�/2-3/�
���0����������� ���8������?�5�(���� �0�� �099����������?9�����
12-19451

IAEA HUMAN HEALTH SERIES PUBLICATIONS
The mandate of the IAEA human health programme originates from Article II of its Statute, which states that the “Agency shall seek to accelerate and enlarge the contribution of atomic energy to peace, health and prosperity throughout the world”. The main objective of the human health programme is to enhance the capabilities of IAEA Member States in addressing issues related to the prevention, diagnosis and treatment of health problems through the development and application of nuclear techniques, within a framework of quality assurance.
Publications in the IAEA Human Health Series provide information in the areas of: radiation medicine, including diagnostic radiology, diagnostic and therapeutic nuclear medicine, and radiation therapy; dosimetry and medical radiation physics; and stable isotope techniques and other nuclear applications in nutrition. The publications have a broad readership and are aimed at medical practitioners, researchers and other professionals. International experts assist the IAEA Secretariat in drafting and reviewing these publications. Some of the publications in this series may also be endorsed or co-sponsored by international organizations and professional societies active in the relevant fields. There are two categories of publications in this series:
IAEA HUMAN HEALTH SERIESPublications in this category present analyses or provide information of an
advisory nature, for example guidelines, codes and standards of practice, and quality assurance manuals. Monographs and high level educational material, such as graduate texts, are also published in this series.
IAEA HUMAN HEALTH REPORTSHuman Health Reports complement information published in the IAEA Human
Health Series in areas of radiation medicine, dosimetry and medical radiation physics, and nutrition. These publications include reports of technical meetings, the results of IAEA coordinated research projects, interim reports on IAEA projects, and educational material compiled for IAEA training courses dealing with human health related subjects. In some cases, these reports may provide supporting material relating to publications issued in the IAEA Human Health Series.
All of these publications can be downloaded cost free from the IAEA web site:http://www.iaea.org/Publications/index.html
Further information is available from:Marketing and Sales UnitInternational Atomic Energy AgencyVienna International CentrePO Box 1001400 Vienna, Austria
Readers are invited to provide their impressions on these publications. Information may be provided via the IAEA web site, by mail at the address given above, or by email to:
RELATED PUBLICATIONS
www.iaea.org/books
NUCLEAR CARDIOLOGY: ITS ROLE IN COST EFFECTIVE CAREIAEA Human Health Series No. 18STI/PUB/1516 (87 pp.; 2012)ISBN 978–92–0–117410–9 Price: €30.00
INTERNATIONAL ATOMIC ENERGY AGENCYVIENNA
ISBN 978–92–0–131710–0ISSN 2075-3772
Coronary artery disease is the leading cause of death in adults in many parts of the western world, and increasingly so in low to middle income countries. Predictions for 2030 foresee a toll of more than 23 million deaths worldwide. Early diagnosis and treatment can mean the difference between life and death for many people. Over the past 20 years, advancements in cardiology have made use of nuclear techniques to help with the diagnosis and treatment of heart diseases. One such development is nuclear cardiology, which involves the use of specialized imaging processes and radioactive material to diagnose the health and functional ability of the heart. Myocardial perfusion imaging (MPI) is by far the most widely used nuclear cardiology technique in a variety of clinical conditions. Clinical scenarios where patients are most likely to benefi t from single photon emission computed tomography or positron emission tomography are also included in this publication. The aim of the publication is to help strengthen current nuclear cardiology practices.
IAEA HUMAN HEALTH SERIES
Nuclear C
ardiology: Guidance and R
ecomm
endations for Implem
entation in Developing C
ountriesIAEA HUM
AN HEALTH SERIES No. 23
IAEA HUMAN HEALTH SERIESNo. 23
Nuclear Cardiology:Guidance and
Recommendations for Implementation in Developing Countries
IAEA HUMAN HEALTH SERIES


