IAR Embedded Workbench® IDE Version 7+ for MSP430™ MCUs
User's GuideSLAU138AR–June 2004–Revised May 2018
IAR Embedded Workbench® IDE Version 7+for MSP430™ MCUs
This manual describes the use of IAR Embedded Workbench® (EW430) with the MSP430™ ultra-low-power microcontrollers.
Contents1 Read This First ............................................................................................................... 3
1.1 How to Use This Manual........................................................................................... 31.2 Information About Cautions and Warnings ...................................................................... 31.3 Related Documentation From Texas Instruments .............................................................. 31.4 If You Need Assistance ............................................................................................ 4
2 Get Started Now! ............................................................................................................ 52.1 Software Installation ................................................................................................ 52.2 Flashing the LED ................................................................................................... 5
3 Development Flow ........................................................................................................... 73.1 Overview ............................................................................................................. 73.2 Project Settings ..................................................................................................... 83.3 Using Math Library for MSP430 (MSPMathlib) in IAR EW430 5.60.1 and Newer ......................... 93.4 Additional Project Settings for MSP430L092 and MSP430C092............................................. 93.5 Creating a Project From Scratch ................................................................................ 113.6 Additional Project Settings for Ultra-Low-Power Mode (LPMx.5) Debugging ............................. 123.7 Download Options for MSP430 Devices ....................................................................... 143.8 Password Protection for MSP430 Devices .................................................................... 153.9 Stack Management and .xcl Files ............................................................................... 163.10 How to Generate TI .TXT (and Other Format) Files .......................................................... 163.11 Overview of Example Programs................................................................................. 163.12 Using C-SPY ....................................................................................................... 16
4 EnergyTrace™ Technology ............................................................................................... 214.1 Introduction......................................................................................................... 214.2 Energy Measurement ............................................................................................. 214.3 IAR Embedded Workbench® for MSP430 Integration ........................................................ 214.4 Measuring Low-Power Currents................................................................................. 314.5 EnergyTrace Technology FAQs ................................................................................. 32
5 MSP430 FRAM Memory Protection Mechanisms...................................................................... 355.1 Memory Protection Unit .......................................................................................... 355.2 Intellectual Property Encapsulation (IPE) ...................................................................... 365.3 FRAM Write Protection (FRWP)................................................................................. 38
IAR Embedded Workbench® IDE Version 7+ for MSP430™ MCUs
3 L092 Mode.................................................................................................................... 94 C092 Emulation Mode ..................................................................................................... 105 C092 Password............................................................................................................. 106 Enable Ultra-Low-Power Debug Mode .................................................................................. 127 LPMx.5 Notifications ....................................................................................................... 138 Download Options.......................................................................................................... 159 JTAG Password ............................................................................................................ 1510 Pulse Density and Current Flow.......................................................................................... 2111 Debug Session With EnergyTrace++ Windows ........................................................................ 2212 Debug Options.............................................................................................................. 2313 Emulator Pulldown Menu With EnergyTrace++-Related Functions ................................................. 2414 Enabling the State Log Window.......................................................................................... 2415 State Log Window With EnergyTrace++ Data.......................................................................... 2516 State Log Summary With EnergyTrace++ Data........................................................................ 2517 Power Log Setup Window ................................................................................................ 2518 Power Log Window With EnergyTrace++ Data ........................................................................ 2619 Timeline With Power Log and State Graphs Disabled ................................................................ 2620 Timeline With EnergyTrace++ Data ..................................................................................... 2721 Function Profiler With EnergyTrace++ Data ............................................................................ 2722 Debug Session With EnergyTrace Windows ........................................................................... 2823 Emulator Pulldown Menu With EnergyTrace-Related Functions .................................................... 2924 Power Log Setup Window ................................................................................................ 2925 Power Log Window With EnergyTrace Data ........................................................................... 3026 Timeline With Power Log Graph Disabled .............................................................................. 3027 Timeline With EnergyTrace Data......................................................................................... 3128 LPM3 Current When Executing Under Debug Control ................................................................ 3129 Release JTAG on Go Option in Emulator Pulldown Menu ........................................................... 3230 LPM3 Current When Executing with JTAG Signals Released ....................................................... 3231 MPU Configuration Dialog ................................................................................................ 3532 IPE Configuration Dialog .................................................................................................. 3633 IPE Debug Settings ........................................................................................................ 3734 FRWP Configuration Dialog............................................................................................... 38
List of Tables
1 Device Architecture, Breakpoints, and Other Emulation Features................................................... 17
TrademarksMSP430, E2E, EnergyTrace are trademarks of Texas Instruments.IAR Embedded Workbench is a registered trademark of IAR Systems.ThinkPad is a trademark of IBM.Intel is a registered trademark of Intel Corporation.Motorola is a trademark of Motorola Corporation.All other trademarks are the property of their respective owners.
IAR Embedded Workbench® IDE Version 7+ for MSP430™ MCUs
1 Read This First
1.1 How to Use This ManualRead and follow the instructions in Section 2. This chapter provides instructions on installing the software,and describes how to run the demonstration programs. After you see how quick and easy it is to use thedevelopment tools, TI recommends that you read all of this manual.
This manual describes only the setup and basic operation of the software development environment, but itdoes not fully describe the MSP430 microcontrollers or the complete development software and hardwaresystems. For details of these items, see the appropriate TI and IAR™ documents listed in Section 1.3.
This manual applies to the use of the TI MSP-FET, TI MSP-FET430UIF, MSP-FET430PIF, and eZ430development tools series.
These tools contain the most up-to-date materials available at the time of packaging. For the latestmaterials (including data sheets, user's guides, software, and application information), visit the TI MSP430website or contact your local TI sales office.
1.2 Information About Cautions and WarningsThis book may contain cautions and warnings.
CAUTIONThis is an example of a caution statement.
A caution statement describes a situation that could potentially damage yoursoftware or equipment.
WARNINGThis is an example of a warning statement.A warning statement describes a situation that could potentiallycause harm to you.
The information in a caution or a warning is provided for your protection. Read each caution and warningcarefully.
1.3 Related Documentation From Texas InstrumentsMSP430 development tools documentation:
MSP430 Hardware Tools User's GuideeZ430-F2013 Development Tool User's GuideeZ430-RF2480 User's GuideeZ430-RF2500 Development Tool User's GuideeZ430-RF2500-SEH Development Tool User's GuideeZ430-Chronos Development Tool User's GuideMSP Debugger's User's Guide
MSP430 device documentation:MSP430F1xx Family User's GuideMSP430F2xx Family User's GuideMSP430F3xx Family User's GuideMSP430F4xx Family User's GuideMSP430F5xx and MSP430F6xx Family User's Guide
IAR Embedded Workbench® IDE Version 7+ for MSP430™ MCUs
MSP430FR57xx Family User's GuideMSP430FR58xx, MSP430FR59xx, MSP430FR68xx, and MSP430FR69xx Family User's Guide
CC430 device documentation:CC430 Family User's Guide
1.4 If You Need AssistanceSupport for the MSP430 devices and the FET development tools is provided by the TI Product InformationCenter (PIC). Contact information for the PIC can be found on the TI website. The TI E2E™ Communityfor the MSP430 is available to provide open interaction with peer engineers, TI engineers, and otherexperts. Additional device-specific information can be found on the MSP430 website.
IAR Embedded Workbench® IDE Version 7+ for MSP430™ MCUs
2 Get Started Now!This chapter provides instruction on installing the software, and shows how to run the demonstrationprograms.
2.1 Software InstallationFollow the instructions on the supplied READ ME FIRST document to install the IAR EmbeddedWorkbench™. Read the file <Installation Root>\EmbeddedWorkbenchx.x\common\doc\EW_QuickReference_LMS2.ENU.pdf from IAR for the latest information aboutthe Workbench.
To install and run IAR Embedded Workbench, you need the following:• A Pentium-compatible PC with Microsoft Windows Vista (SP2), Windows 7, Windows 8, Windows 8.1,
or Windows 10. Both 32- and 64-bit variants of Windows are supported.• Internet Explorer 7 or higher• At least 2GB of RAM and 10GB of free disk space• Adobe Acrobat Reader to access the product documentation
NOTE: If the MSP-FET or eZ-FET debugger driver install fails:
Under certain conditions (depending on the hardware and operating system that is used), theMSP-FET or eZ-FET driver install may fail on the first attempt. This can lead to unresponsivebehavior on IDEs. To resolve this issue, disconnect the MSP-FET or eZ-FET and then plug itagain, or plug it in to a different USB port, and restart the IDE.
2.2 Flashing the LEDThis section demonstrates on the FET the equivalent of the C-language "Hello World!" introductoryprogram. An application that flashes the LED is developed and downloaded to the FET, and then run.1. Start the Workbench (Start → Programs → IAR Systems → IAR Embedded Workbench for
MSP430 Vxx → IAR Embedded Workbench).2. Click File → Open Workspace to open the file at: <Installation Root>\Embedded Workbench
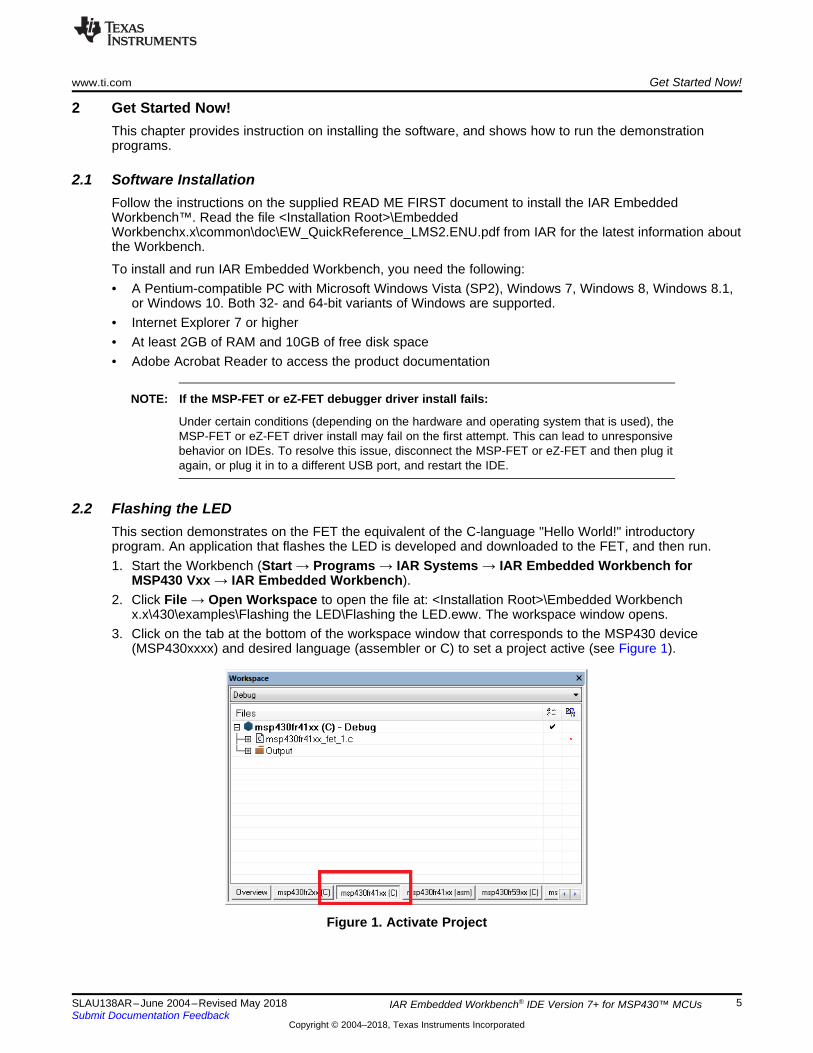
x.x\430\examples\Flashing the LED\Flashing the LED.eww. The workspace window opens.3. Click on the tab at the bottom of the workspace window that corresponds to the MSP430 device
(MSP430xxxx) and desired language (assembler or C) to set a project active (see Figure 1).
IAR Embedded Workbench® IDE Version 7+ for MSP430™ MCUs
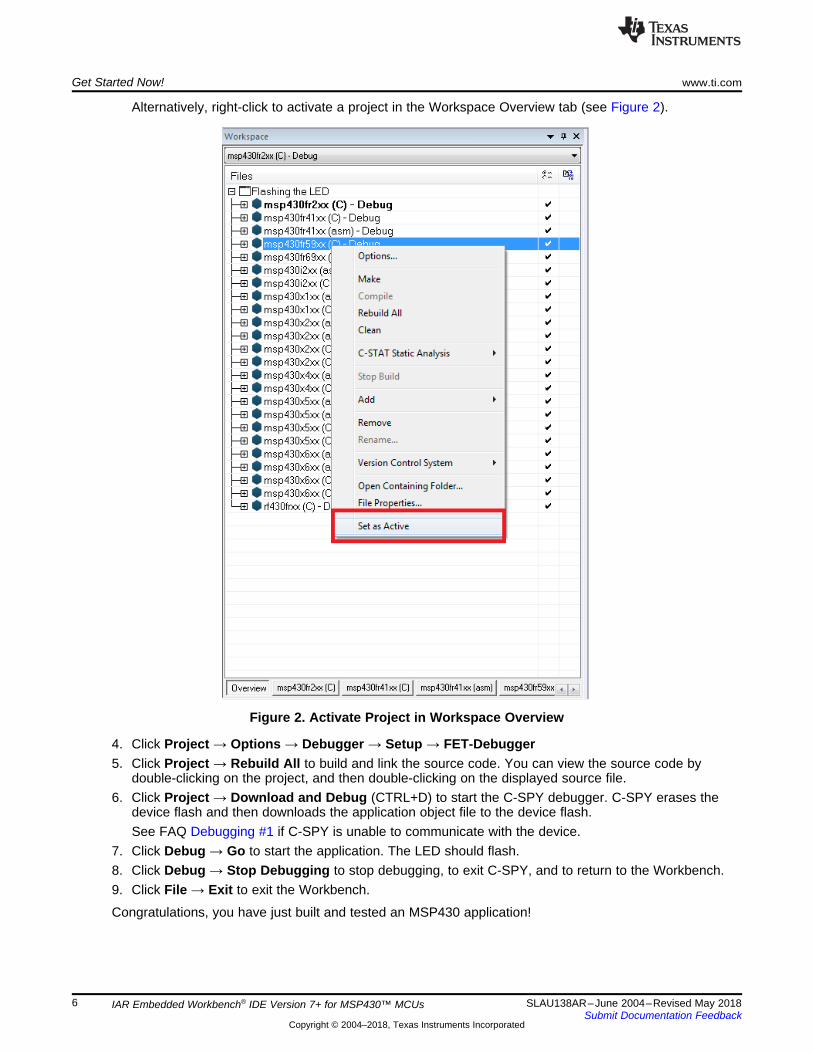
Alternatively, right-click to activate a project in the Workspace Overview tab (see Figure 2).
Figure 2. Activate Project in Workspace Overview
4. Click Project → Options → Debugger → Setup → FET-Debugger5. Click Project → Rebuild All to build and link the source code. You can view the source code by
double-clicking on the project, and then double-clicking on the displayed source file.6. Click Project → Download and Debug (CTRL+D) to start the C-SPY debugger. C-SPY erases the
device flash and then downloads the application object file to the device flash.See FAQ Debugging #1 if C-SPY is unable to communicate with the device.
7. Click Debug → Go to start the application. The LED should flash.8. Click Debug → Stop Debugging to stop debugging, to exit C-SPY, and to return to the Workbench.9. Click File → Exit to exit the Workbench.
Congratulations, you have just built and tested an MSP430 application!
IAR Embedded Workbench® IDE Version 7+ for MSP430™ MCUs
3 Development FlowThis chapter describes how to use IAR EW430 to develop application software and how to use C-SPY todebug it.
3.1 OverviewApplications are developed in assembler or C using the Workbench, and they are debugged using C-SPY.C-SPY is seamlessly integrated into the Workbench. However, it is more convenient to make thedistinction between the code development environment (Workbench) and the debugger (C-SPY). C-SPYcan be configured to operate with the FET (that is, an actual MSP430 device) or with a software simulatorof the device. IAR EW430 refers to the Workbench and C-SPY collectively.
Documentation for the MSP430 family and IAR EW430 is extensive. The MSP430 home page is anothersource of MSP430 information.
The components of IAR EW430 (IDE, debugger, assembler, compiler, linker) are fully documented in<Installation Root>\Embedded Workbench x.x\common\doc and <Installation Root>\EmbeddedWorkbench\430\doc.
.htm files located throughout the EW430 directory tree contain the most up-to-date information andsupplement the PDF files. In addition, EW430 documentation is available online through Help.
IAR Embedded Workbench® IDE Version 7+ for MSP430™ MCUs
3.2 Project SettingsThe settings required to configure the Workbench and C-SPY are numerous and detailed. Read andthoroughly understand the documentation supplied by IAR when dealing with project settings. Review theproject settings of the supplied assembler and C examples (the project settings are accessed usingProject → Options with the project name selected). Use these project settings as templates whendeveloping your own projects. Note that if the project name is not selected when settings are made, thesettings are applied to the selected file (not to the project).
The following project settings are recommended or required:• Specify the target device (General Options → Target → Device).• Enable the generation of an executable output file (General Options → Output → Output file →
Executable).• To most easily debug a C project, disable optimization [C/C++ Compiler → Optimizations → Size →
None (Best debug support)].• Enable the generation of debug information in the compiler output (C/C++ Compiler → Output →
Generate debug information).• Specify the search path for the C preprocessor (C/C++ Compiler → Preprocessor → Include Paths).• Enable the generation of debug information in the assembler output (Assembler → Output →
Generate Debug Info).• Specify the search path for the assembler preprocessor (Assembler → Preprocessor → Include
Paths).• To debug the project using C-SPY, specify a compatible format [Linker → Output → Format →
Debug information for C-SPY (with runtime control modules or with I/O emulation modules)].• Specify the search path for any used libraries (Linker → Config → Search paths).• Specify the C-SPY driver. Select Project → Options → Debugger → Setup → Driver → FET
Debugger to debug on the FET (that is, MSP430 device). Select Simulator to debug on the simulator.If FET Debugger is selected, use Project → Options → FET Debugger → Setup → Connection toselect the appropriate port: Texas Instruments LPT-IF for the parallel FET Interface (MSP-FET430PIF)or Texas Instruments USB-IF for the USB Interface (MSP-FET430UIF) or for the eZ430.
• Enable the Device Description file. This file makes C-SPY "aware" of the specifics of the device it isdebugging. This file corresponds to the specified target device (Debugger → Setup → Devicedescription file → Override default).
• Enable the erasure of the Main and Information memories before object code download (FETDebugger → Download → Erase main and Information memory).
• To maximize system performance during debug, disable Virtual Breakpoints (FET Debugger →Breakpoints → Use virtual breakpoints) and disable all System Breakpoints (FET Debugger →Breakpoints → System breakpoints on).
NOTE: Use Factory Settings to quickly configure a project.
Use the Factory Settings button to quickly configure a project to a usable state.
The following steps can be used to quickly configure a project. Note that the General Options tab does nothave a Factory Settings button.1. Specify the target device (General Options → Target → Device).2. Enable the generation of an executable output file (General Options → Output → Output file →
Executable).3. Accept the factory settings for the compiler (C/C++ Compiler → Factory Settings).4. Accept the factory settings for the assembler (Assembler → Factory Settings).5. Accept the factory settings for the linker (Linker → Factory Settings).6. Accept the factory settings for C-SPY (Debugger → Factory Settings).
IAR Embedded Workbench® IDE Version 7+ for MSP430™ MCUs
7. Debug on the hardware (Debugger → Setup → Driver → FET Debugger).8. Specify the active parallel port used to interface to the FET if not LPT1 (FET Debugger → Setup →
Connection → Texas Instruments LPT-IF) or specify the USB port (FET Debugger → Setup →Connection → Texas Instruments USB-IF).
NOTE: Avoid the use of absolute path names when referencing files.
Instead, use the relative pathname keywords $TOOLKIT_DIR$ and $PROJ_DIR$. See theIAR documentation for a description of these keywords. The use of relative path namespermits projects to be moved easily, and projects do not require modification when IARsystems are upgraded (for example, from Limited or Baseline to Full).
3.3 Using Math Library for MSP430 (MSPMathlib) in IAR EW430 5.60.1 and NewerTI's MSPMathlib is part of EW430 5.60.1 and newer releases. This optimized library provides up to 26xbetter performance in applications that use floating point scalar math. For details, see the MSPMathlibweb page.
MSPMathlib may be enabled for new and existing projects on all supported devices. Enable or disableMSPMathlib in the project options (General Options → Library Configuration → Use TI MathLib).
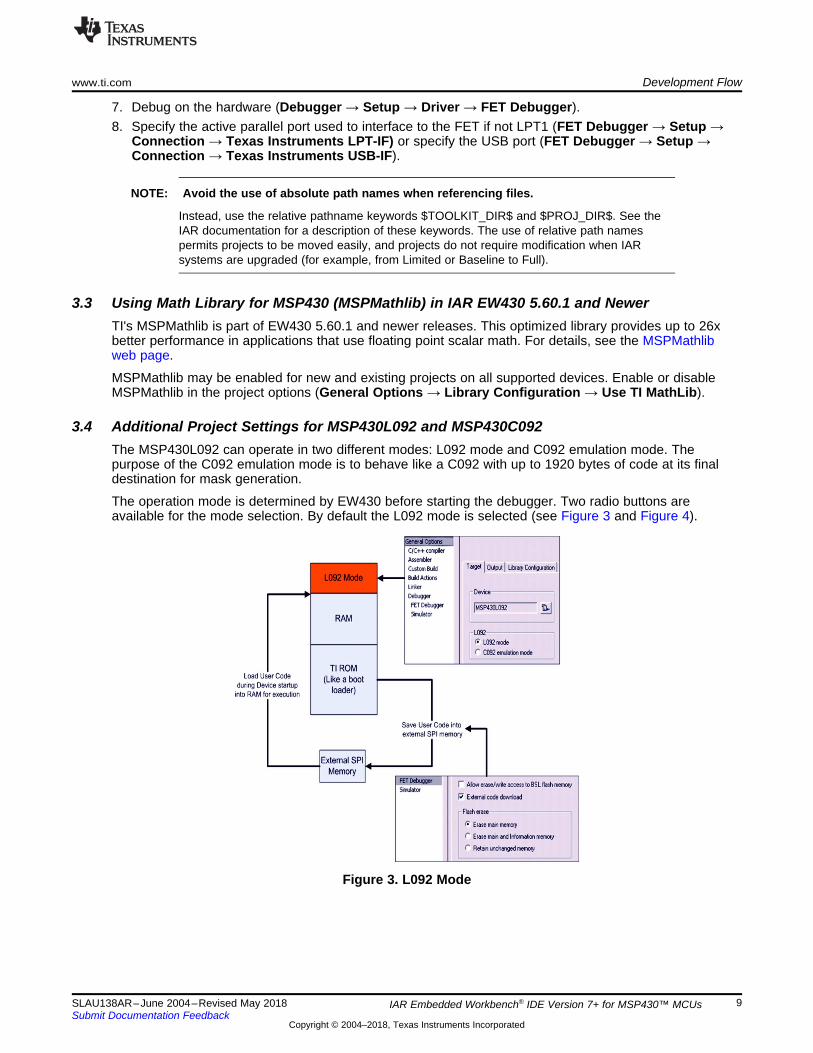
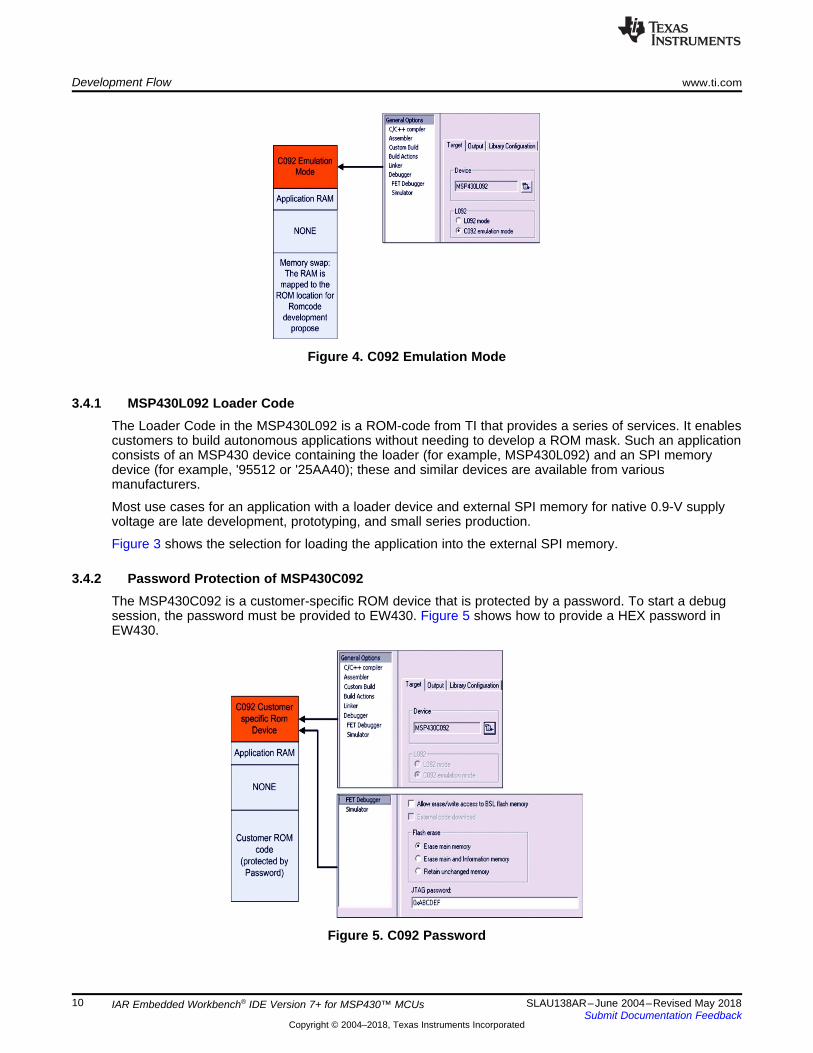
3.4 Additional Project Settings for MSP430L092 and MSP430C092The MSP430L092 can operate in two different modes: L092 mode and C092 emulation mode. Thepurpose of the C092 emulation mode is to behave like a C092 with up to 1920 bytes of code at its finaldestination for mask generation.
The operation mode is determined by EW430 before starting the debugger. Two radio buttons areavailable for the mode selection. By default the L092 mode is selected (see Figure 3 and Figure 4).
IAR Embedded Workbench® IDE Version 7+ for MSP430™ MCUs
Figure 4. C092 Emulation Mode
3.4.1 MSP430L092 Loader CodeThe Loader Code in the MSP430L092 is a ROM-code from TI that provides a series of services. It enablescustomers to build autonomous applications without needing to develop a ROM mask. Such an applicationconsists of an MSP430 device containing the loader (for example, MSP430L092) and an SPI memorydevice (for example, '95512 or '25AA40); these and similar devices are available from variousmanufacturers.
Most use cases for an application with a loader device and external SPI memory for native 0.9-V supplyvoltage are late development, prototyping, and small series production.
Figure 3 shows the selection for loading the application into the external SPI memory.
3.4.2 Password Protection of MSP430C092The MSP430C092 is a customer-specific ROM device that is protected by a password. To start a debugsession, the password must be provided to EW430. Figure 5 shows how to provide a HEX password inEW430.
IAR Embedded Workbench® IDE Version 7+ for MSP430™ MCUs
3.5 Creating a Project From ScratchThis section presents step-by-step instructions to create an assembler or C project from scratch, and todownload and run the application on the MSP430 (see also Section 3.2, Project Settings). The MSP430IAR Embedded Workbench IDE User's Guide presents a more comprehensive overview of the process.1. Start the Workbench (Start → Programs → IAR Systems → IAR Embedded Workbench for
MSP430 → IAR Embedded Workbench).2. Create a new text file (File → New → File).3. Enter the program text into the file.
NOTE: Use .h files to simplify your code development.
IAR EW430 is supplied with files that define the device registers and the bit names for eachdevice. These files can greatly simplify the task of developing your program. The files arelocated in <Installation Root>\Embedded Workbench x.x\430\inc. Include the .h filecorresponding to your target device in your text file (#include "msp430xyyy.h"). Additionally,files io430xxxx.h are provided and are optimized to be included by C source files.
4. Save the program text file (File → Save).It is recommended that assembler text files be saved with a file-type suffix of ".s43" and that C text filesbe saved with a file-type suffix of ".c".
5. Create a new workspace (File → New → Workspace).6. Create a new project (Project → Create New Project). Select Tool chain: MSP430, Project
Templates: Empty project and click OK. Specify a project name and click Save.7. Add the program text file to the project (Project → Add Files). Select the program text file and click
Open. Alternatively, double-click on the file to add it to the project.
NOTE: How to add assembler source files to your project
The default file type presented in the Add Files window is C/C++ Files. To view assemblerfiles (.s43), select Assembler Files in the Files of type drop-down menu.
8. Save the workspace (File → Save Workspace). Specify a workspace name and click Save.9. Configure the project options (Project → Options). For each of the subcategories (General Options,
C/C++ Compiler, Assembler, Linker, Debugger), accept the default Factory Settings with thefollowing exceptions:• Specify the target device (General Options → Target → Device).• Enable the generation of an executable output file (General Options → Output → Output file →
Executable).• To debug on the FET (that is, the MSP430), click Debugger → Setup → Driver → FET
Debugger.• Specify the active port used to interface to the FET (FET Debugger → Setup → Connection).
10. Build the project (Project → Rebuild All).11. Debug the application using C-SPY (Project → Debug). This starts C-SPY, and C-SPY takes control
of the target, erases the target memory, programs the target memory with the application, and resetsthe target.See FAQ Debugging #1 if C-SPY is unable to communicate with the device.
12. Click Debug → Go to start the application.13. Click Debug → Stop Debugging to stop the application, to exit C-SPY, and to return to the
Workbench.14. Click File → Exit to exit the Workbench.
IAR Embedded Workbench® IDE Version 7+ for MSP430™ MCUs
3.6 Additional Project Settings for Ultra-Low-Power Mode (LPMx.5) Debugging
3.6.1 What is LPMx.5LPMx.5 is an ultra-low-power mode in which the entry and exit is handled differently than the other low-power modes.
LPMx.5 gives the lowest power consumption available on a device. To achieve this, entry to LPMx.5disables the LDO of the PMM module, which removes the supply voltage from the core and the JTAGmodule of the device. Because the supply voltage is removed from the core, all register contents andSRAM contents are lost. Exit from LPMx.5 causes a BOR event, which forces a complete reset of thesystem.
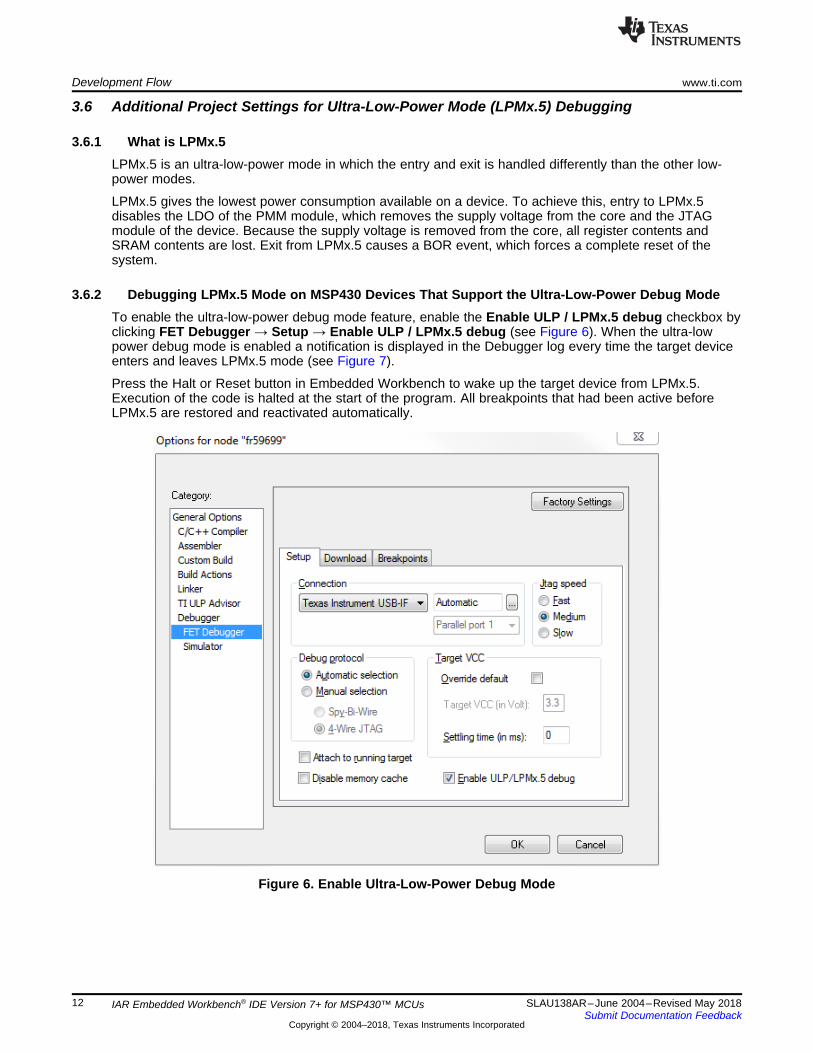
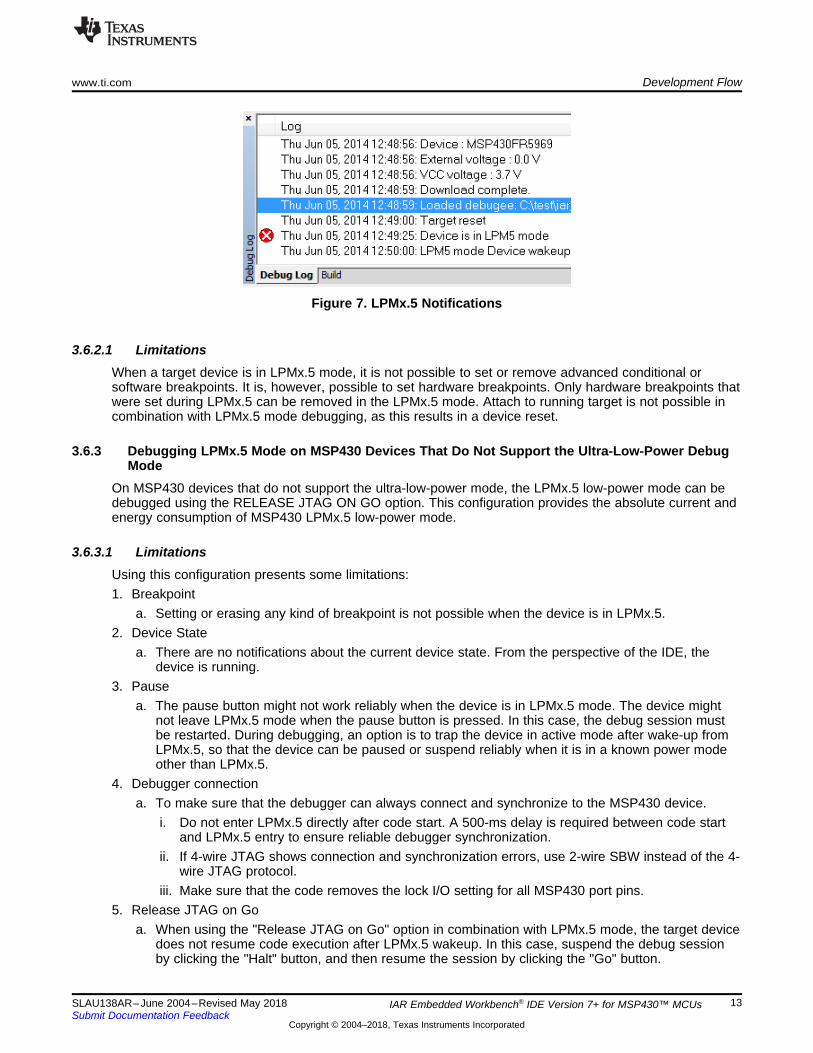
3.6.2 Debugging LPMx.5 Mode on MSP430 Devices That Support the Ultra-Low-Power Debug ModeTo enable the ultra-low-power debug mode feature, enable the Enable ULP / LPMx.5 debug checkbox byclicking FET Debugger → Setup → Enable ULP / LPMx.5 debug (see Figure 6). When the ultra-lowpower debug mode is enabled a notification is displayed in the Debugger log every time the target deviceenters and leaves LPMx.5 mode (see Figure 7).
Press the Halt or Reset button in Embedded Workbench to wake up the target device from LPMx.5.Execution of the code is halted at the start of the program. All breakpoints that had been active beforeLPMx.5 are restored and reactivated automatically.
IAR Embedded Workbench® IDE Version 7+ for MSP430™ MCUs
Figure 7. LPMx.5 Notifications
3.6.2.1 LimitationsWhen a target device is in LPMx.5 mode, it is not possible to set or remove advanced conditional orsoftware breakpoints. It is, however, possible to set hardware breakpoints. Only hardware breakpoints thatwere set during LPMx.5 can be removed in the LPMx.5 mode. Attach to running target is not possible incombination with LPMx.5 mode debugging, as this results in a device reset.
3.6.3 Debugging LPMx.5 Mode on MSP430 Devices That Do Not Support the Ultra-Low-Power DebugMode
On MSP430 devices that do not support the ultra-low-power mode, the LPMx.5 low-power mode can bedebugged using the RELEASE JTAG ON GO option. This configuration provides the absolute current andenergy consumption of MSP430 LPMx.5 low-power mode.
3.6.3.1 LimitationsUsing this configuration presents some limitations:1. Breakpoint
a. Setting or erasing any kind of breakpoint is not possible when the device is in LPMx.5.2. Device State
a. There are no notifications about the current device state. From the perspective of the IDE, thedevice is running.
3. Pausea. The pause button might not work reliably when the device is in LPMx.5 mode. The device might
not leave LPMx.5 mode when the pause button is pressed. In this case, the debug session mustbe restarted. During debugging, an option is to trap the device in active mode after wake-up fromLPMx.5, so that the device can be paused or suspend reliably when it is in a known power modeother than LPMx.5.
4. Debugger connectiona. To make sure that the debugger can always connect and synchronize to the MSP430 device.
i. Do not enter LPMx.5 directly after code start. A 500-ms delay is required between code startand LPMx.5 entry to ensure reliable debugger synchronization.
ii. If 4-wire JTAG shows connection and synchronization errors, use 2-wire SBW instead of the 4-wire JTAG protocol.
iii. Make sure that the code removes the lock I/O setting for all MSP430 port pins.5. Release JTAG on Go
a. When using the "Release JTAG on Go" option in combination with LPMx.5 mode, the target devicedoes not resume code execution after LPMx.5 wakeup. In this case, suspend the debug sessionby clicking the "Halt" button, and then resume the session by clicking the "Go" button.
IAR Embedded Workbench® IDE Version 7+ for MSP430™ MCUs
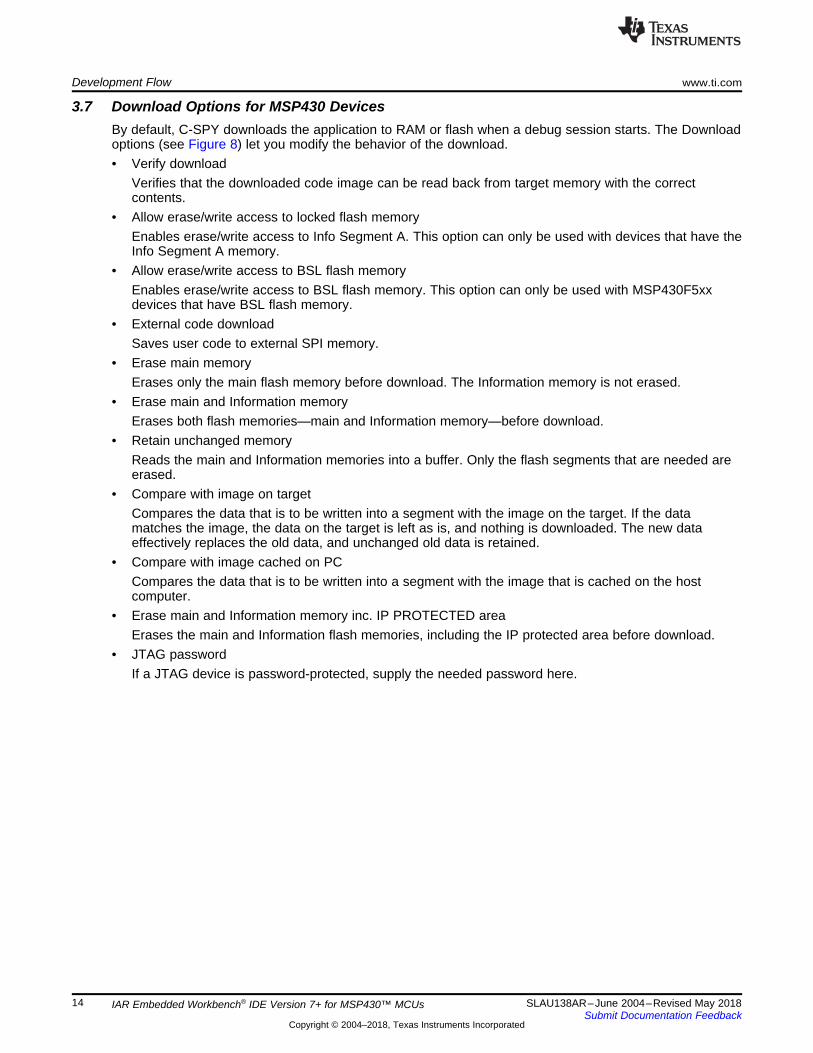
3.7 Download Options for MSP430 DevicesBy default, C-SPY downloads the application to RAM or flash when a debug session starts. The Downloadoptions (see Figure 8) let you modify the behavior of the download.• Verify download
Verifies that the downloaded code image can be read back from target memory with the correctcontents.
• Allow erase/write access to locked flash memoryEnables erase/write access to Info Segment A. This option can only be used with devices that have theInfo Segment A memory.
• Allow erase/write access to BSL flash memoryEnables erase/write access to BSL flash memory. This option can only be used with MSP430F5xxdevices that have BSL flash memory.
• External code downloadSaves user code to external SPI memory.
• Erase main memoryErases only the main flash memory before download. The Information memory is not erased.
• Erase main and Information memoryErases both flash memories—main and Information memory—before download.
• Retain unchanged memoryReads the main and Information memories into a buffer. Only the flash segments that are needed areerased.
• Compare with image on targetCompares the data that is to be written into a segment with the image on the target. If the datamatches the image, the data on the target is left as is, and nothing is downloaded. The new dataeffectively replaces the old data, and unchanged old data is retained.
• Compare with image cached on PCCompares the data that is to be written into a segment with the image that is cached on the hostcomputer.
• Erase main and Information memory inc. IP PROTECTED areaErases the main and Information flash memories, including the IP protected area before download.
• JTAG passwordIf a JTAG device is password-protected, supply the needed password here.
IAR Embedded Workbench® IDE Version 7+ for MSP430™ MCUs
Figure 8. Download Options
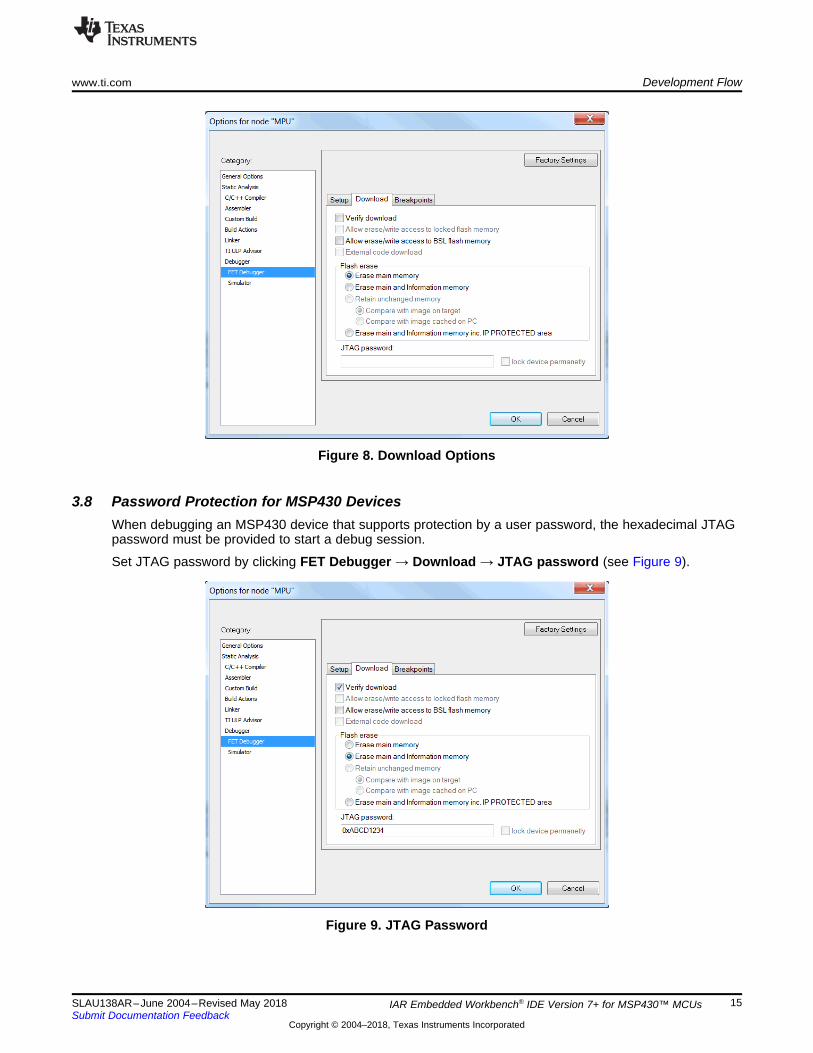
3.8 Password Protection for MSP430 DevicesWhen debugging an MSP430 device that supports protection by a user password, the hexadecimal JTAGpassword must be provided to start a debug session.
Set JTAG password by clicking FET Debugger → Download → JTAG password (see Figure 9).
IAR Embedded Workbench® IDE Version 7+ for MSP430™ MCUs
3.9 Stack Management and .xcl FilesThe reserved stack size can be configured through either the project options dialog (General Options →Stack/Heap) or through direct modification of the .xcl linker control files. These files are input to the linkerand contain statements that control the allocation of device memory (RAM, flash). See the IAR XLINKdocumentation for a complete description of these files. The .xcl files provided with the IAR EW430(<Installation Root>\Embedded Workbench x.x\430\config\lnk430xxxx.xcl) define a relocatable segment(RSEG) called CSTACK. CSTACK is used to define the region of RAM that is used for the system stackwithin C programs. CSTACK can also be used in assembler programs (MOV.W #SFE(CSTACK), SP).CSTACK is defined to extend from the last location of RAM for 50 bytes (that is, the stack extendsdownward through RAM for 50 bytes).
Other statements in the .xcl file define other relocatable regions that are allocated from the first location ofRAM to the bottom of the stack.
NOTE:• The supplied .xcl files reserve 50 bytes of RAM for the stack, whether or not this amount
of stack is actually required (or if it is sufficient).• There is no runtime checking of the stack. The stack can overflow the 50 reserved bytes
and possibly overwrite the other segments. No error is output.
The supplied .xcl files can be modified to tune the size of the stack to the needs of the application; edit -D_STACK_SIZE=xx to allocate xx bytes for the stack. The .xcl file also reserves 50 byes for the heap ifrequired [for example, by malloc()].
3.10 How to Generate TI .TXT (and Other Format) FilesThe linker can be configured to output objects in TI .TXT format for use with the MSP-GANGprogrammers. Click Project → Options → Linker → Output → Format → Other → msp430-txt. Intel®and Motorola™ formats also can be selected.
For more information, see FAQ Program Development #6 in Section 6.
3.11 Overview of Example ProgramsExample programs for MSP430 devices are provided in <Installation Root>\Embedded Workbenchx.x\430\examples. Each tool folder contains folders that contain the assembler and C sources.
<Installation Root>\Embedded Workbench\x.x\430\examples\Flashing the LED\Flashing the LED.ewwconveniently organizes the FET_1 demonstration code into a workspace. The workspace containsassembler and C projects of the code for each of the MSP430 device families. Debug and Releaseversions are provided for each of the projects.
Additional code examples can be found on the MSP430 home page under Code Examples. Note thatsome example programs require a 32-kHz crystal on LFXT1, and not all FETs are supplied with a 32-kHzcrystal.
3.12 Using C-SPYSee Section 7 for a description of FET-specific menus within C-SPY.
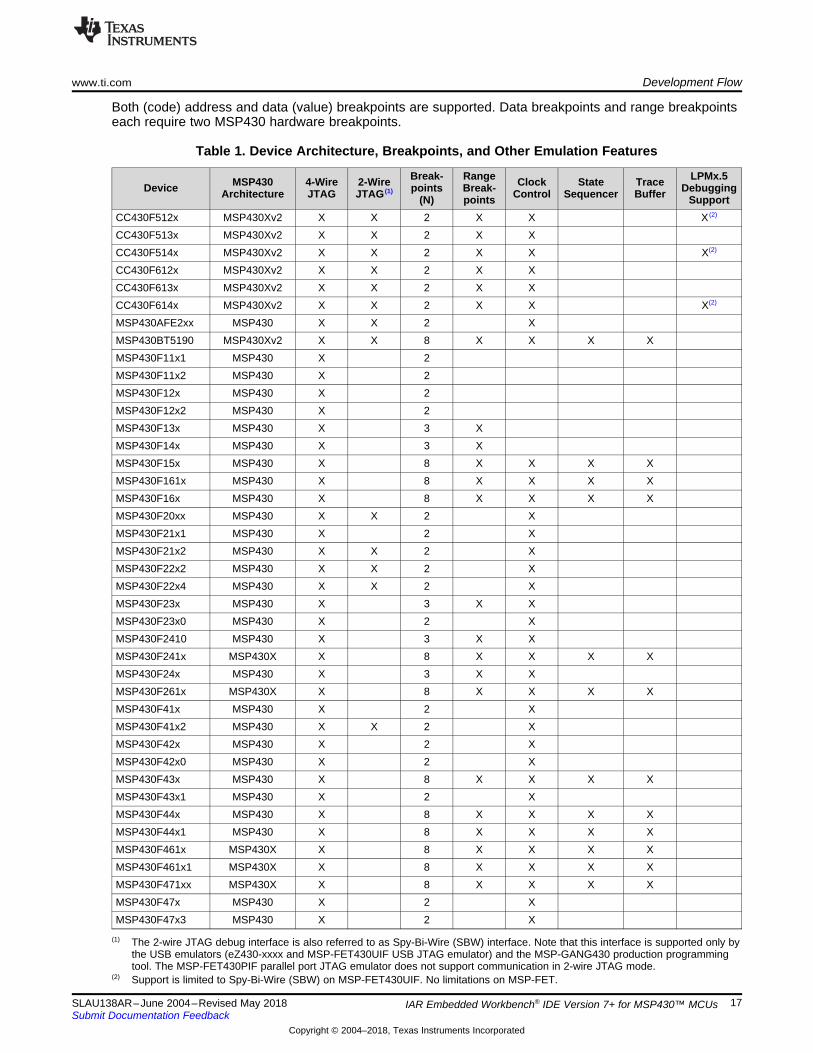
3.12.1 Breakpoint TypesThe C-SPY breakpoint mechanism uses a limited number of on-chip debugging resources (specifically, Nbreakpoint registers, see Table 1). When N or fewer breakpoints are set, the application runs at full devicespeed (or realtime). When greater than N breakpoints are set and Use Virtual Breakpoints is enabled (FETDebugger → Breakpoints → Use virtual breakpoints), the application runs under the control of the hostPC; the system operates at a much slower speed but offers unlimited software breakpoints (or non-realtime). During non-realtime mode, the PC, in effect, repeatedly single steps the device and interrogatesthe device after each operation to determine if a breakpoint has been hit.
IAR Embedded Workbench® IDE Version 7+ for MSP430™ MCUs
Both (code) address and data (value) breakpoints are supported. Data breakpoints and range breakpointseach require two MSP430 hardware breakpoints.
(1) The 2-wire JTAG debug interface is also referred to as Spy-Bi-Wire (SBW) interface. Note that this interface is supported only bythe USB emulators (eZ430-xxxx and MSP-FET430UIF USB JTAG emulator) and the MSP-GANG430 production programmingtool. The MSP-FET430PIF parallel port JTAG emulator does not support communication in 2-wire JTAG mode.
(2) Support is limited to Spy-Bi-Wire (SBW) on MSP-FET430UIF. No limitations on MSP-FET.
Table 1. Device Architecture, Breakpoints, and Other Emulation Features
Device MSP430Architecture
4-WireJTAG
2-WireJTAG (1)
Break-points
(N)
RangeBreak-points
ClockControl
StateSequencer
TraceBuffer
LPMx.5Debugging
SupportCC430F512x MSP430Xv2 X X 2 X X X (2)
CC430F513x MSP430Xv2 X X 2 X XCC430F514x MSP430Xv2 X X 2 X X X(2)
CC430F612x MSP430Xv2 X X 2 X XCC430F613x MSP430Xv2 X X 2 X XCC430F614x MSP430Xv2 X X 2 X X X(2)
MSP430AFE2xx MSP430 X X 2 XMSP430BT5190 MSP430Xv2 X X 8 X X X XMSP430F11x1 MSP430 X 2MSP430F11x2 MSP430 X 2MSP430F12x MSP430 X 2MSP430F12x2 MSP430 X 2MSP430F13x MSP430 X 3 XMSP430F14x MSP430 X 3 XMSP430F15x MSP430 X 8 X X X XMSP430F161x MSP430 X 8 X X X XMSP430F16x MSP430 X 8 X X X XMSP430F20xx MSP430 X X 2 XMSP430F21x1 MSP430 X 2 XMSP430F21x2 MSP430 X X 2 XMSP430F22x2 MSP430 X X 2 XMSP430F22x4 MSP430 X X 2 XMSP430F23x MSP430 X 3 X XMSP430F23x0 MSP430 X 2 XMSP430F2410 MSP430 X 3 X XMSP430F241x MSP430X X 8 X X X XMSP430F24x MSP430 X 3 X XMSP430F261x MSP430X X 8 X X X XMSP430F41x MSP430 X 2 XMSP430F41x2 MSP430 X X 2 XMSP430F42x MSP430 X 2 XMSP430F42x0 MSP430 X 2 XMSP430F43x MSP430 X 8 X X X XMSP430F43x1 MSP430 X 2 XMSP430F44x MSP430 X 8 X X X XMSP430F44x1 MSP430 X 8 X X X XMSP430F461x MSP430X X 8 X X X XMSP430F461x1 MSP430X X 8 X X X XMSP430F471xx MSP430X X 8 X X X XMSP430F47x MSP430 X 2 XMSP430F47x3 MSP430 X 2 X
IAR Embedded Workbench® IDE Version 7+ for MSP430™ MCUs
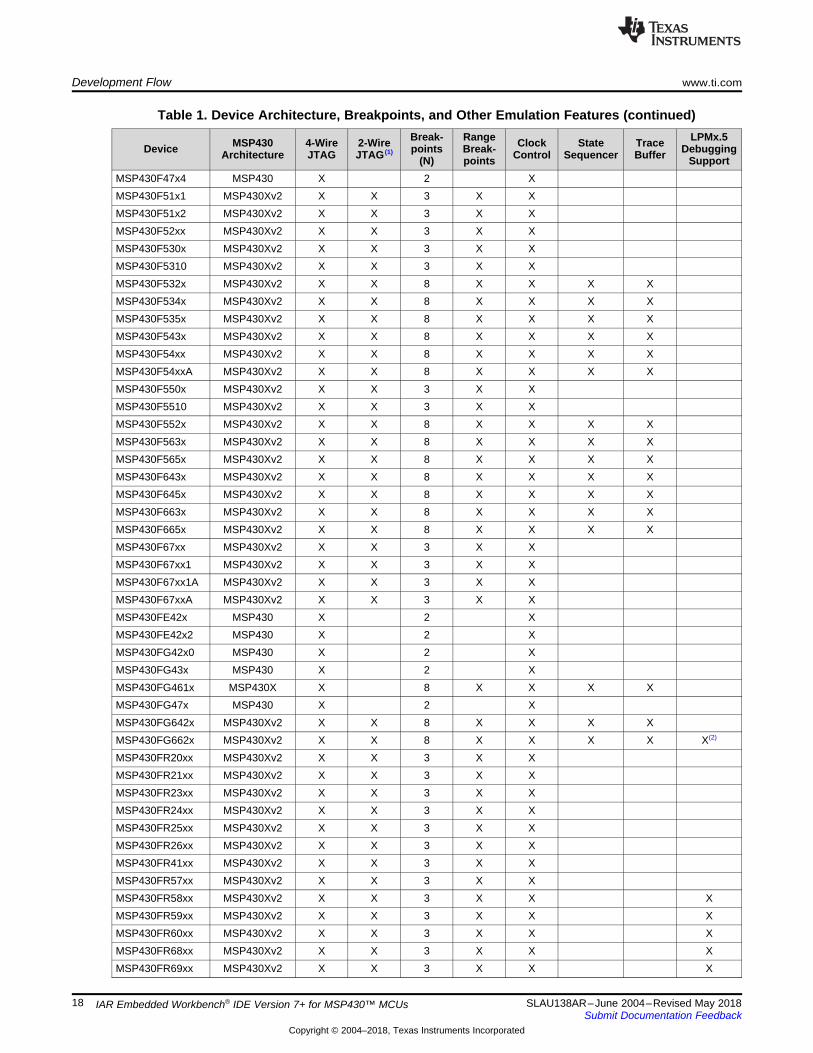
Table 1. Device Architecture, Breakpoints, and Other Emulation Features (continued)
Device MSP430Architecture
4-WireJTAG
2-WireJTAG (1)
Break-points
(N)
RangeBreak-points
ClockControl
StateSequencer
TraceBuffer
LPMx.5Debugging
SupportMSP430F47x4 MSP430 X 2 XMSP430F51x1 MSP430Xv2 X X 3 X XMSP430F51x2 MSP430Xv2 X X 3 X XMSP430F52xx MSP430Xv2 X X 3 X XMSP430F530x MSP430Xv2 X X 3 X XMSP430F5310 MSP430Xv2 X X 3 X XMSP430F532x MSP430Xv2 X X 8 X X X XMSP430F534x MSP430Xv2 X X 8 X X X XMSP430F535x MSP430Xv2 X X 8 X X X XMSP430F543x MSP430Xv2 X X 8 X X X XMSP430F54xx MSP430Xv2 X X 8 X X X XMSP430F54xxA MSP430Xv2 X X 8 X X X XMSP430F550x MSP430Xv2 X X 3 X XMSP430F5510 MSP430Xv2 X X 3 X XMSP430F552x MSP430Xv2 X X 8 X X X XMSP430F563x MSP430Xv2 X X 8 X X X XMSP430F565x MSP430Xv2 X X 8 X X X XMSP430F643x MSP430Xv2 X X 8 X X X XMSP430F645x MSP430Xv2 X X 8 X X X XMSP430F663x MSP430Xv2 X X 8 X X X XMSP430F665x MSP430Xv2 X X 8 X X X XMSP430F67xx MSP430Xv2 X X 3 X XMSP430F67xx1 MSP430Xv2 X X 3 X XMSP430F67xx1A MSP430Xv2 X X 3 X XMSP430F67xxA MSP430Xv2 X X 3 X XMSP430FE42x MSP430 X 2 XMSP430FE42x2 MSP430 X 2 XMSP430FG42x0 MSP430 X 2 XMSP430FG43x MSP430 X 2 XMSP430FG461x MSP430X X 8 X X X XMSP430FG47x MSP430 X 2 XMSP430FG642x MSP430Xv2 X X 8 X X X XMSP430FG662x MSP430Xv2 X X 8 X X X X X(2)
MSP430FR20xx MSP430Xv2 X X 3 X XMSP430FR21xx MSP430Xv2 X X 3 X XMSP430FR23xx MSP430Xv2 X X 3 X XMSP430FR24xx MSP430Xv2 X X 3 X XMSP430FR25xx MSP430Xv2 X X 3 X XMSP430FR26xx MSP430Xv2 X X 3 X XMSP430FR41xx MSP430Xv2 X X 3 X XMSP430FR57xx MSP430Xv2 X X 3 X XMSP430FR58xx MSP430Xv2 X X 3 X X XMSP430FR59xx MSP430Xv2 X X 3 X X XMSP430FR60xx MSP430Xv2 X X 3 X X XMSP430FR68xx MSP430Xv2 X X 3 X X XMSP430FR69xx MSP430Xv2 X X 3 X X X
IAR Embedded Workbench® IDE Version 7+ for MSP430™ MCUs
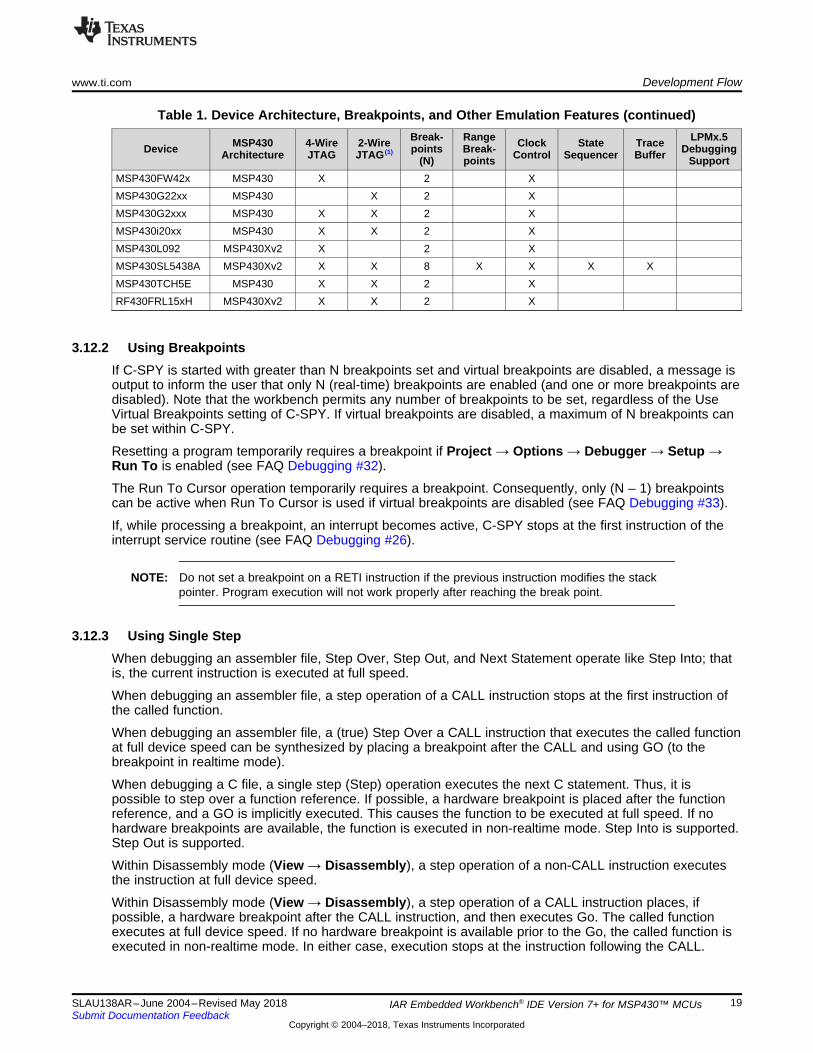
Table 1. Device Architecture, Breakpoints, and Other Emulation Features (continued)
Device MSP430Architecture
4-WireJTAG
2-WireJTAG (1)
Break-points
(N)
RangeBreak-points
ClockControl
StateSequencer
TraceBuffer
LPMx.5Debugging
SupportMSP430FW42x MSP430 X 2 XMSP430G22xx MSP430 X 2 XMSP430G2xxx MSP430 X X 2 XMSP430i20xx MSP430 X X 2 XMSP430L092 MSP430Xv2 X 2 XMSP430SL5438A MSP430Xv2 X X 8 X X X XMSP430TCH5E MSP430 X X 2 XRF430FRL15xH MSP430Xv2 X X 2 X
3.12.2 Using BreakpointsIf C-SPY is started with greater than N breakpoints set and virtual breakpoints are disabled, a message isoutput to inform the user that only N (real-time) breakpoints are enabled (and one or more breakpoints aredisabled). Note that the workbench permits any number of breakpoints to be set, regardless of the UseVirtual Breakpoints setting of C-SPY. If virtual breakpoints are disabled, a maximum of N breakpoints canbe set within C-SPY.
Resetting a program temporarily requires a breakpoint if Project → Options → Debugger → Setup →Run To is enabled (see FAQ Debugging #32).
The Run To Cursor operation temporarily requires a breakpoint. Consequently, only (N – 1) breakpointscan be active when Run To Cursor is used if virtual breakpoints are disabled (see FAQ Debugging #33).
If, while processing a breakpoint, an interrupt becomes active, C-SPY stops at the first instruction of theinterrupt service routine (see FAQ Debugging #26).
NOTE: Do not set a breakpoint on a RETI instruction if the previous instruction modifies the stackpointer. Program execution will not work properly after reaching the break point.
3.12.3 Using Single StepWhen debugging an assembler file, Step Over, Step Out, and Next Statement operate like Step Into; thatis, the current instruction is executed at full speed.
When debugging an assembler file, a step operation of a CALL instruction stops at the first instruction ofthe called function.
When debugging an assembler file, a (true) Step Over a CALL instruction that executes the called functionat full device speed can be synthesized by placing a breakpoint after the CALL and using GO (to thebreakpoint in realtime mode).
When debugging a C file, a single step (Step) operation executes the next C statement. Thus, it ispossible to step over a function reference. If possible, a hardware breakpoint is placed after the functionreference, and a GO is implicitly executed. This causes the function to be executed at full speed. If nohardware breakpoints are available, the function is executed in non-realtime mode. Step Into is supported.Step Out is supported.
Within Disassembly mode (View → Disassembly), a step operation of a non-CALL instruction executesthe instruction at full device speed.
Within Disassembly mode (View → Disassembly), a step operation of a CALL instruction places, ifpossible, a hardware breakpoint after the CALL instruction, and then executes Go. The called functionexecutes at full device speed. If no hardware breakpoint is available prior to the Go, the called function isexecuted in non-realtime mode. In either case, execution stops at the instruction following the CALL.
IAR Embedded Workbench® IDE Version 7+ for MSP430™ MCUs
It is possible to single step only when source statements are present. Breakpoints must be used whenrunning code for which there is no source code (that is, place the breakpoint after the CALL to the functionfor which there is no source, and then Go to the breakpoint in realtime mode).
If, during a single step operation, an interrupt becomes active, the current instruction is completed and C-SPY stops at the first instruction of the interrupt service routine (see FAQ Debugging #26).
3.12.4 Using Watch WindowsThe C-SPY Watch Window mechanism permits C variables to be monitored during the debugging session.Although not originally designed to do so, the Watch Window mechanism can be extended to monitorassembler variables.
Assume that the variables to watch are defined in RAM, for example:RSEG DATA16_I varword ds 2 ; two bytes per word varchar ds 1 ; one byte per character
In C-SPY:1. Open the Watch Window (View → Watch).2. Click Debug → Quick Watch.3. To watch varword, enter in the Expression box:
(__data16 unsigned int *) varword
4. To watch varchar, enter in the Expression box:(__data16 unsigned char *) varchar
5. Click the Add Watch button.6. Close the Quick Watch window.7. For the created entry in the Watch Window, click on the + symbol to display the contents (or value) of
the watched variable.
To change the format of the displayed variable (default, binary, octal, decimal, hex, char), select the type,click the right mouse button, and then select the desired format. The value of the displayed variable canbe changed by selecting it, and then entering the new value.
In C, variables can be watched by selecting them and then dragging and dropping them into the WatchWindow.
Because the MSP430 peripherals are memory mapped, it is possible to extend the concept of watchingvariables to watching peripherals. Be aware that there may be side effects when peripherals are read andwritten by C-SPY (see FAQ Debugging #24).
CPU core registers can be specified for watching by preceding their name with '#' (that is, #PC, #SR, #SP,#R5, and so forth).
Variables watched within the Watch Window are updated only when C-SPY gets control of the device (forexample, following a breakpoint hit, a single step, or a stop or escape).
Although registers can be monitored in the Watch Window, View → Register is the preferred method.
IAR Embedded Workbench® IDE Version 7+ for MSP430™ MCUs
4 EnergyTrace™ Technology
4.1 IntroductionEnergyTrace™ Technology is an energy-based code analysis tool that measures and displays theapplication’s energy profile and helps to optimize it for ultra-low-power consumption.
MSP430 devices with built-in EnergyTrace+[CPU State]+[Peripheral States] (or in shortEnergyTrace++™) support allow real-time monitoring of many internal device states while user programcode executes. EnergyTrace++ technology is supported on selected MSP430 devices and debuggers.
EnergyTrace mode (without the "++") is the base of EnergyTrace Technology and enables analogenergy measurement to determine the energy consumption of an application but does not correlate it tointernal device information. The EnergyTrace mode is available for all MSP430 devices with selecteddebuggers, include CCS.
4.2 Energy MeasurementDebuggers with EnergyTrace Technology support include a new and unique way of continuouslymeasuring the energy supplied to a target microcontroller that differs considerably from the well-knownmethod of amplifying and sampling the voltage drop over a shunt resistor at discrete times. A software-controlled dc-dc converter is used to generate the target power supply. The time density of the dc-dcconverter charge pulses equals the energy consumption of the target microcontroller. A built-in on-the-flycalibration circuit defines the energy equivalent of a single dc-dc charge pulse.
Figure 10 shows the energy measurement principle. Periods with a small number of charge pulses pertime unit indicate low energy consumption and thus low current flow. Periods with a high number of chargepulses per time unit indicate high energy consumption and also a high current consumption. Each chargepulse leads to a rise of the output voltage VOUT, which results in an unavoidable voltage ripple common toall dc-dc converters.
Figure 10. Pulse Density and Current Flow
The benefit of sampling continuously is evident: even the shortest device activity that consumes energycontributes to the overall recorded energy. No shunt-based measurement system can achieve this.
4.3 IAR Embedded Workbench® for MSP430 IntegrationEnergyTrace Technology is available as part of IAR Embedded Workbench for MSP430 microcontrollersVersion 6.10.0 or higher. During debugging of an application, additional windows are available if thedebug probe and the target device support EnergyTrace Technology.
IAR Embedded Workbench® IDE Version 7+ for MSP430™ MCUs
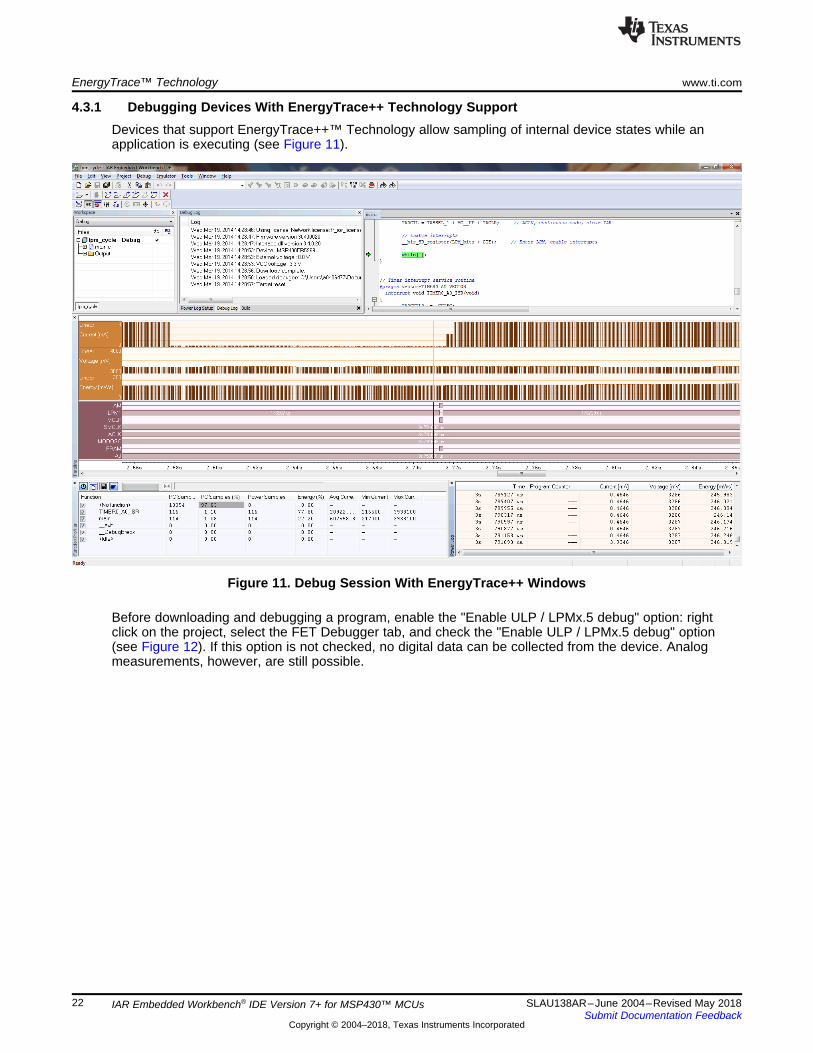
4.3.1 Debugging Devices With EnergyTrace++ Technology SupportDevices that support EnergyTrace++™ Technology allow sampling of internal device states while anapplication is executing (see Figure 11).
Figure 11. Debug Session With EnergyTrace++ Windows
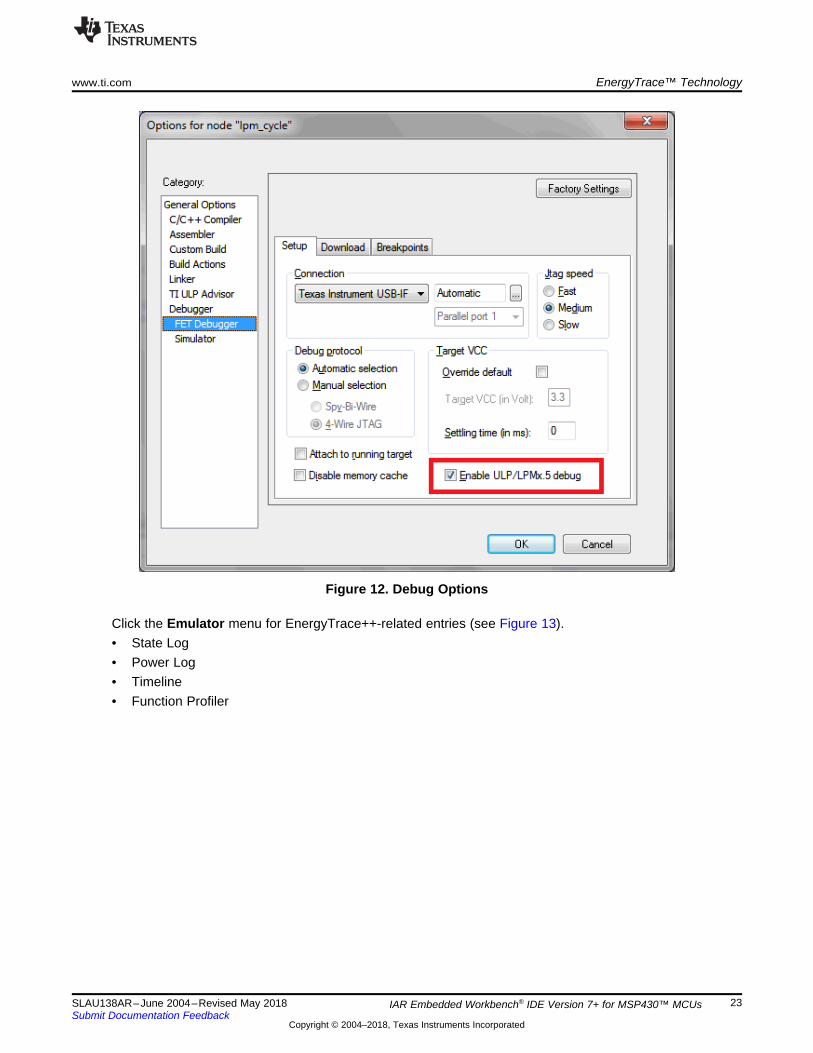
Before downloading and debugging a program, enable the "Enable ULP / LPMx.5 debug" option: rightclick on the project, select the FET Debugger tab, and check the "Enable ULP / LPMx.5 debug" option(see Figure 12). If this option is not checked, no digital data can be collected from the device. Analogmeasurements, however, are still possible.
IAR Embedded Workbench® IDE Version 7+ for MSP430™ MCUs
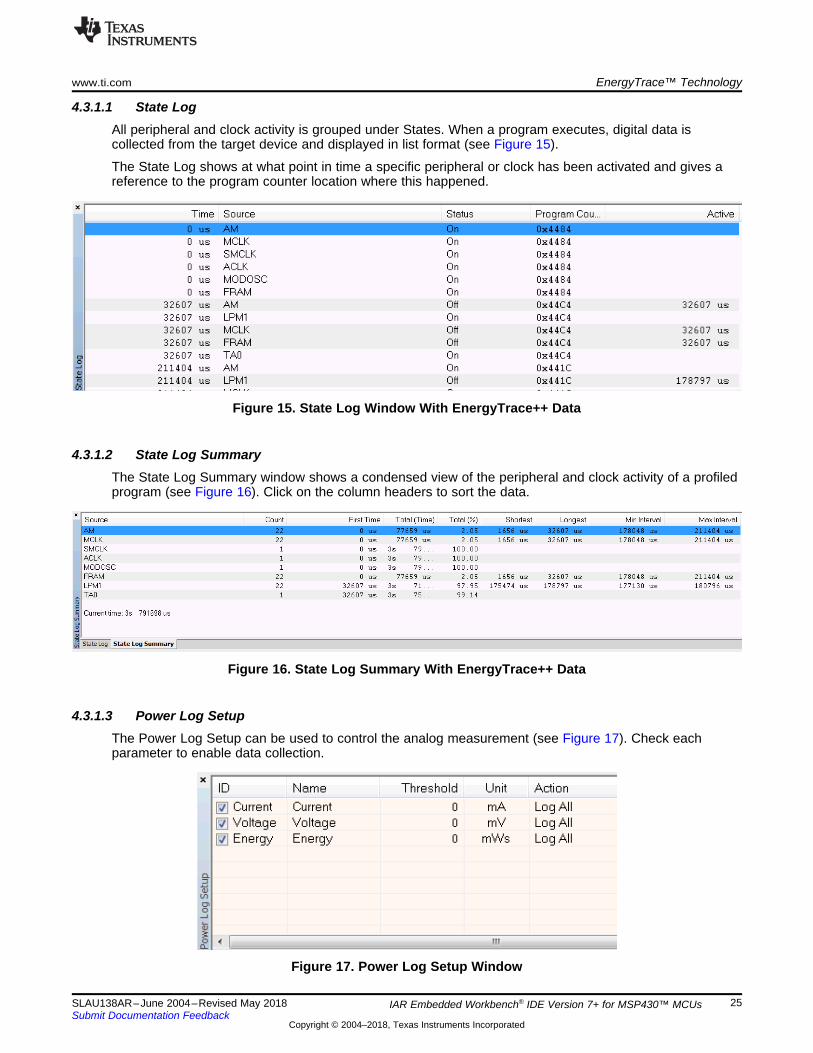
4.3.1.1 State LogAll peripheral and clock activity is grouped under States. When a program executes, digital data iscollected from the target device and displayed in list format (see Figure 15).
The State Log shows at what point in time a specific peripheral or clock has been activated and gives areference to the program counter location where this happened.
Figure 15. State Log Window With EnergyTrace++ Data
4.3.1.2 State Log SummaryThe State Log Summary window shows a condensed view of the peripheral and clock activity of a profiledprogram (see Figure 16). Click on the column headers to sort the data.
Figure 16. State Log Summary With EnergyTrace++ Data
4.3.1.3 Power Log SetupThe Power Log Setup can be used to control the analog measurement (see Figure 17). Check eachparameter to enable data collection.
IAR Embedded Workbench® IDE Version 7+ for MSP430™ MCUs
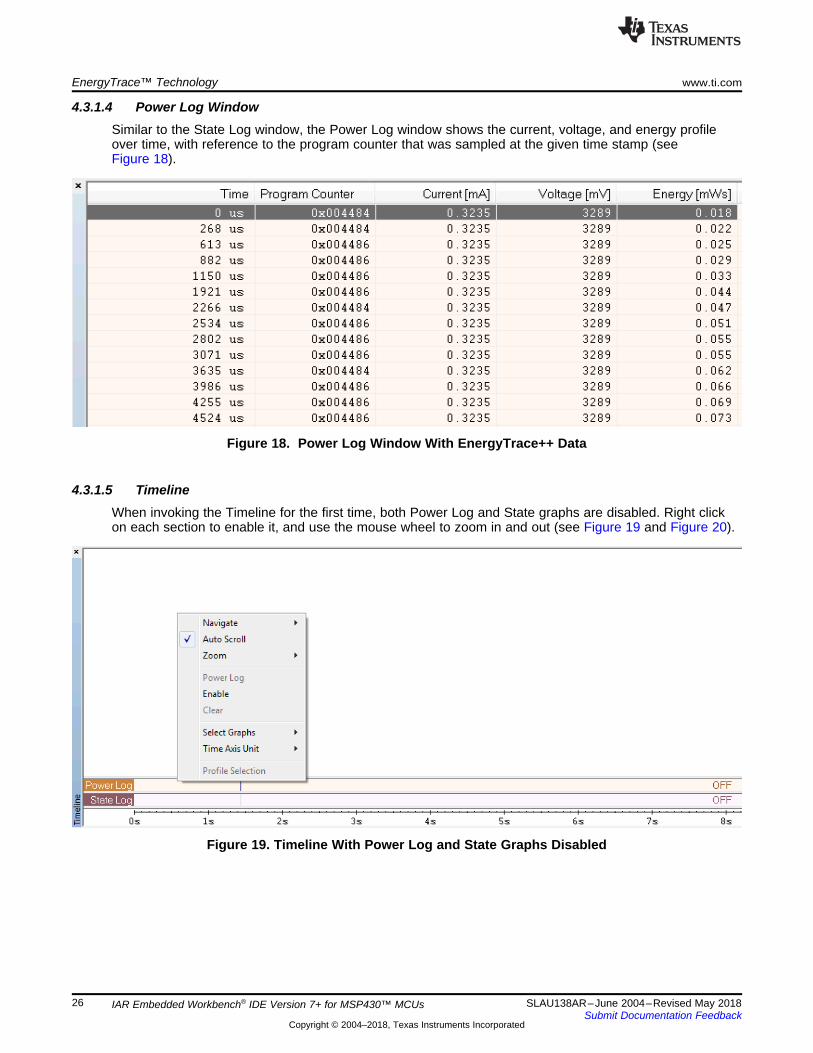
4.3.1.4 Power Log WindowSimilar to the State Log window, the Power Log window shows the current, voltage, and energy profileover time, with reference to the program counter that was sampled at the given time stamp (seeFigure 18).
Figure 18. Power Log Window With EnergyTrace++ Data
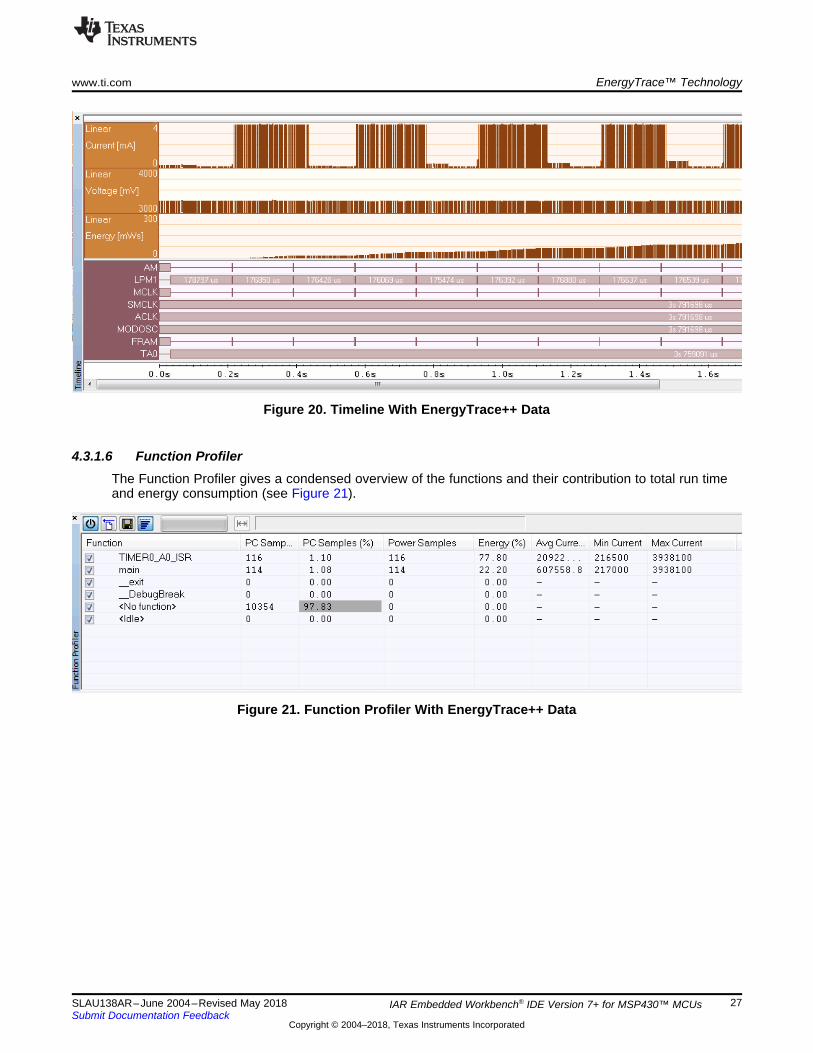
4.3.1.5 TimelineWhen invoking the Timeline for the first time, both Power Log and State graphs are disabled. Right clickon each section to enable it, and use the mouse wheel to zoom in and out (see Figure 19 and Figure 20).
Figure 19. Timeline With Power Log and State Graphs Disabled
IAR Embedded Workbench® IDE Version 7+ for MSP430™ MCUs
Figure 20. Timeline With EnergyTrace++ Data
4.3.1.6 Function ProfilerThe Function Profiler gives a condensed overview of the functions and their contribution to total run timeand energy consumption (see Figure 21).
Figure 21. Function Profiler With EnergyTrace++ Data
IAR Embedded Workbench® IDE Version 7+ for MSP430™ MCUs
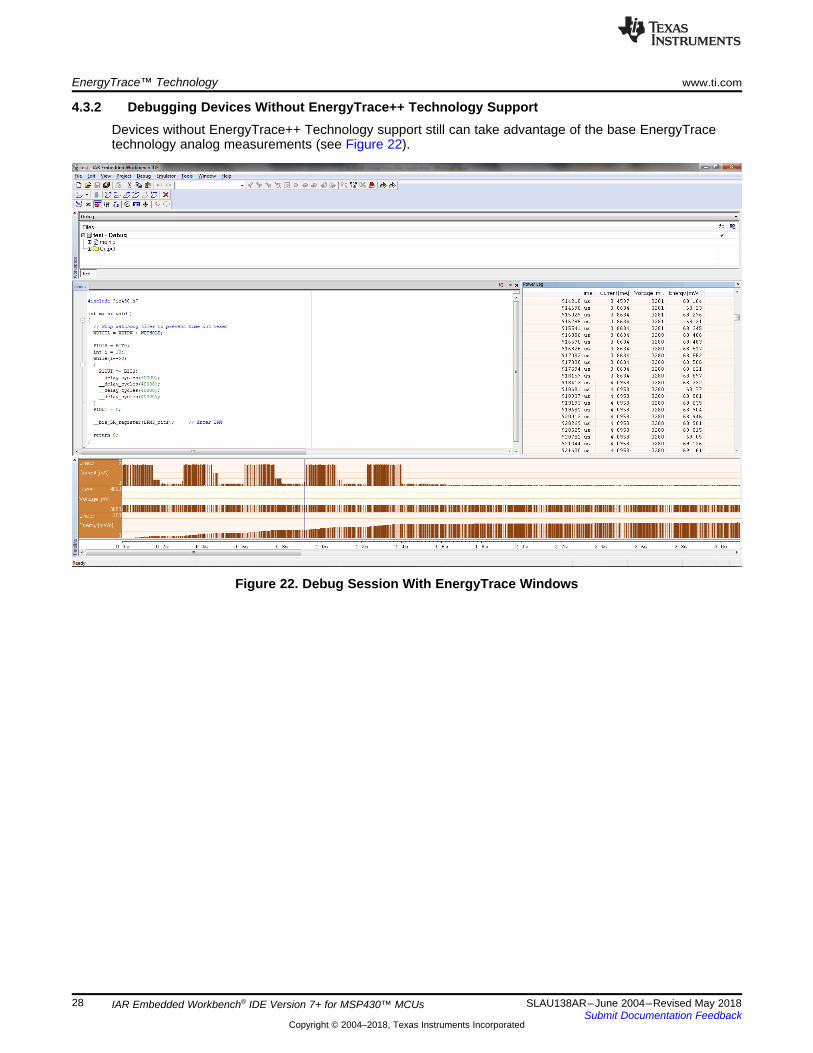
4.3.2 Debugging Devices Without EnergyTrace++ Technology SupportDevices without EnergyTrace++ Technology support still can take advantage of the base EnergyTracetechnology analog measurements (see Figure 22).
IAR Embedded Workbench® IDE Version 7+ for MSP430™ MCUs
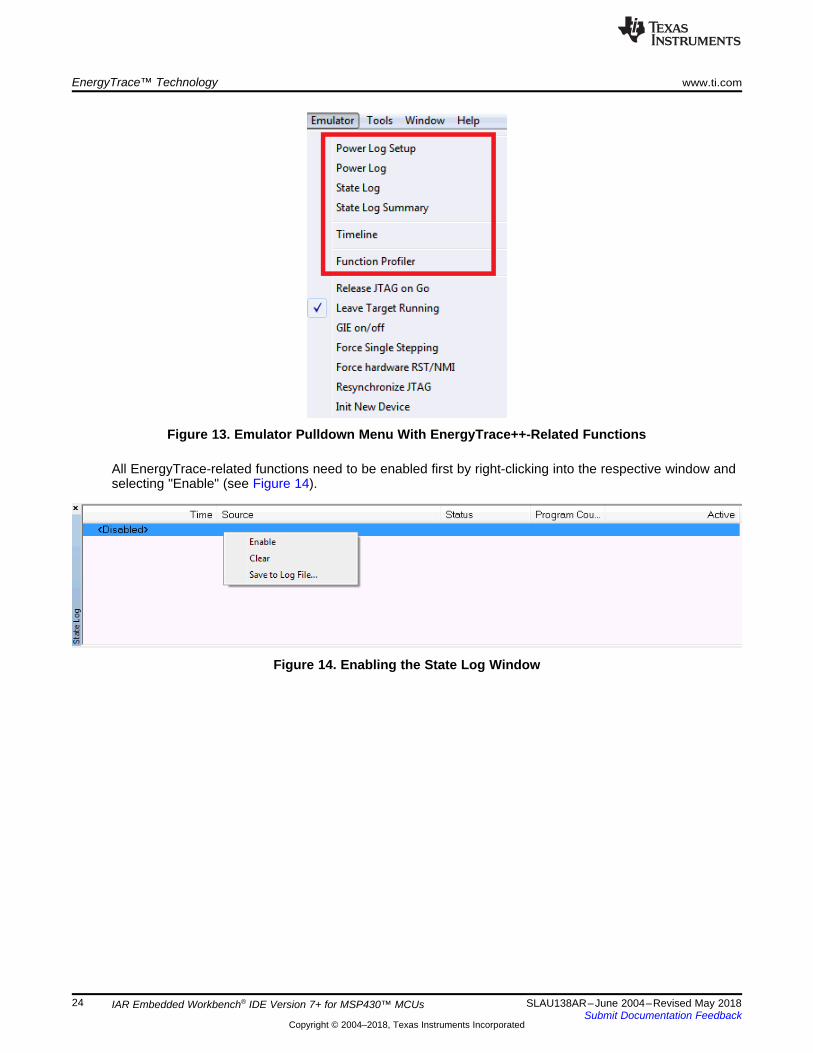
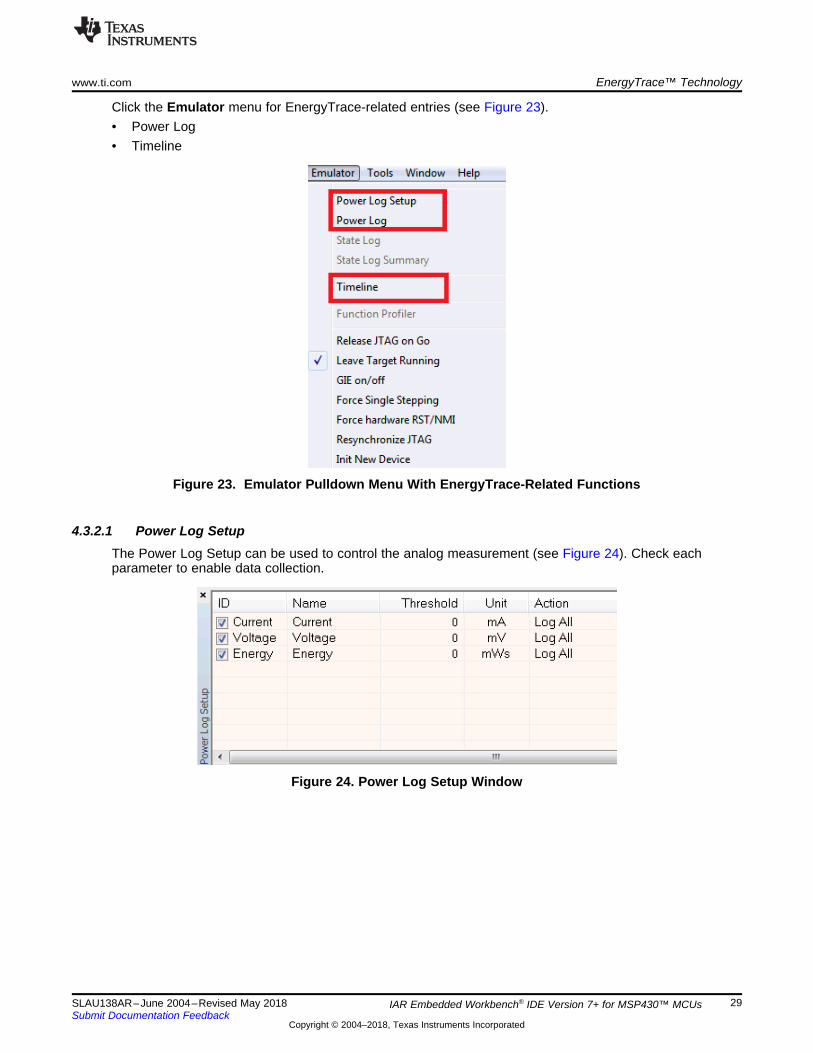
Click the Emulator menu for EnergyTrace-related entries (see Figure 23).• Power Log• Timeline
Figure 23. Emulator Pulldown Menu With EnergyTrace-Related Functions
4.3.2.1 Power Log SetupThe Power Log Setup can be used to control the analog measurement (see Figure 24). Check eachparameter to enable data collection.
IAR Embedded Workbench® IDE Version 7+ for MSP430™ MCUs
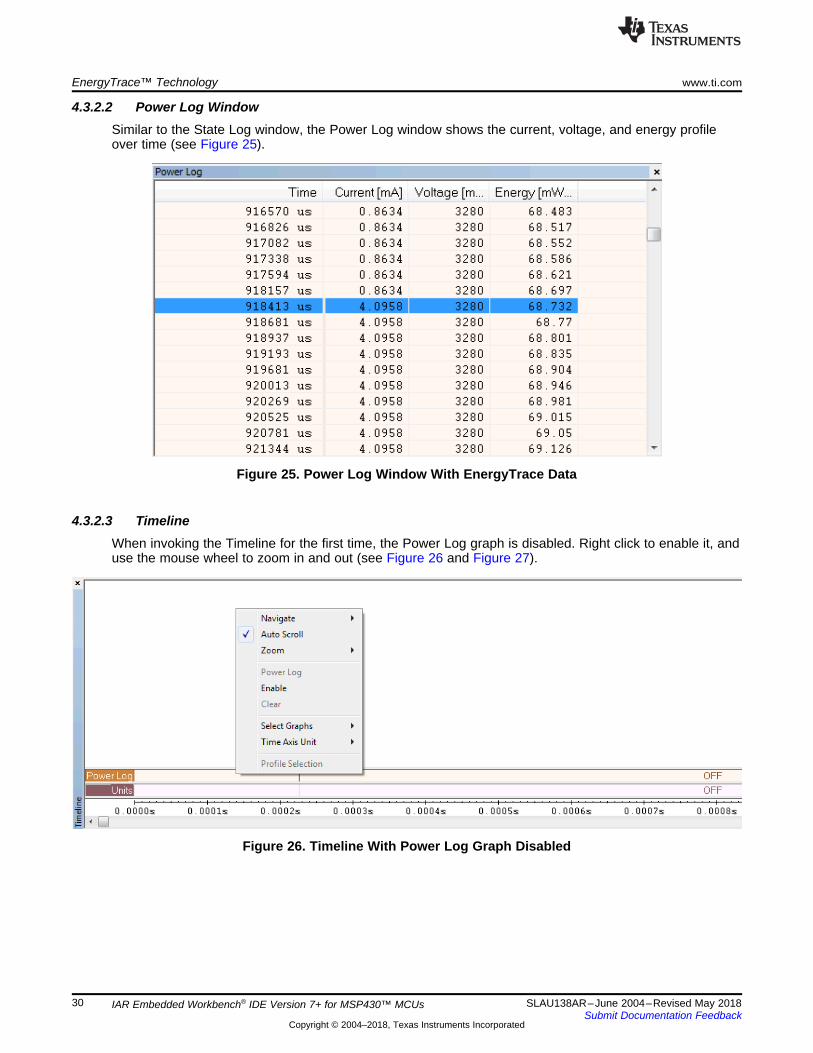
4.3.2.2 Power Log WindowSimilar to the State Log window, the Power Log window shows the current, voltage, and energy profileover time (see Figure 25).
Figure 25. Power Log Window With EnergyTrace Data
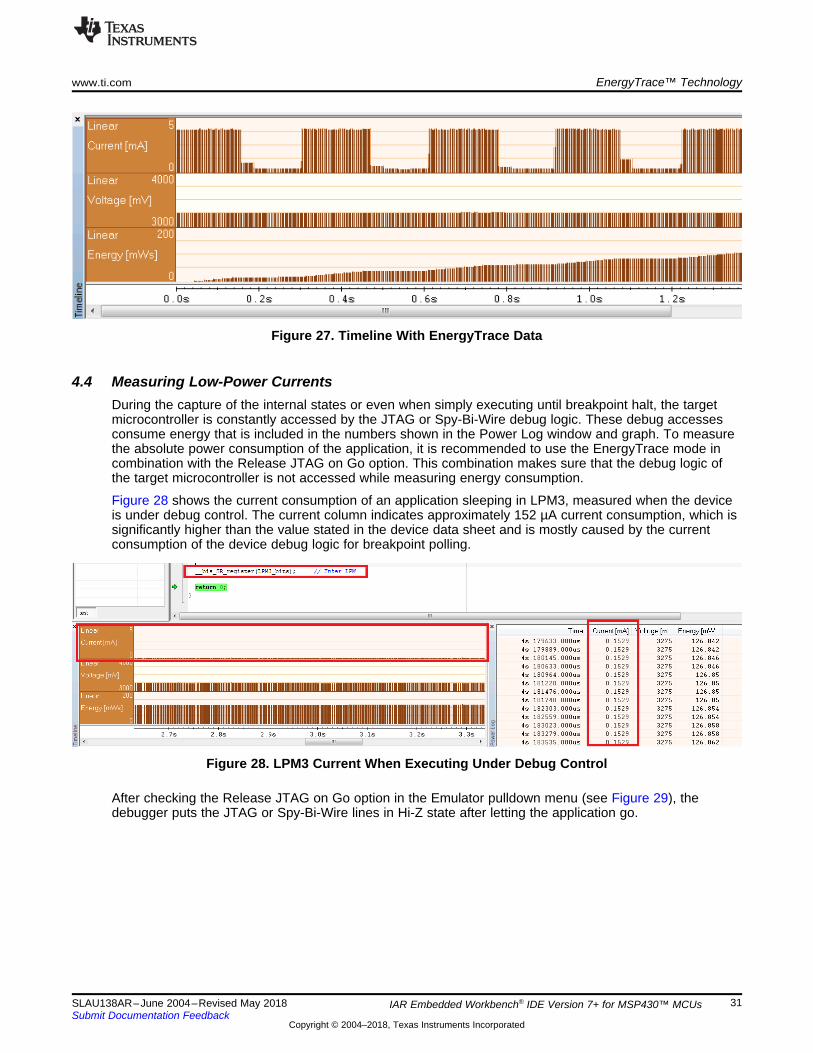
4.3.2.3 TimelineWhen invoking the Timeline for the first time, the Power Log graph is disabled. Right click to enable it, anduse the mouse wheel to zoom in and out (see Figure 26 and Figure 27).
IAR Embedded Workbench® IDE Version 7+ for MSP430™ MCUs
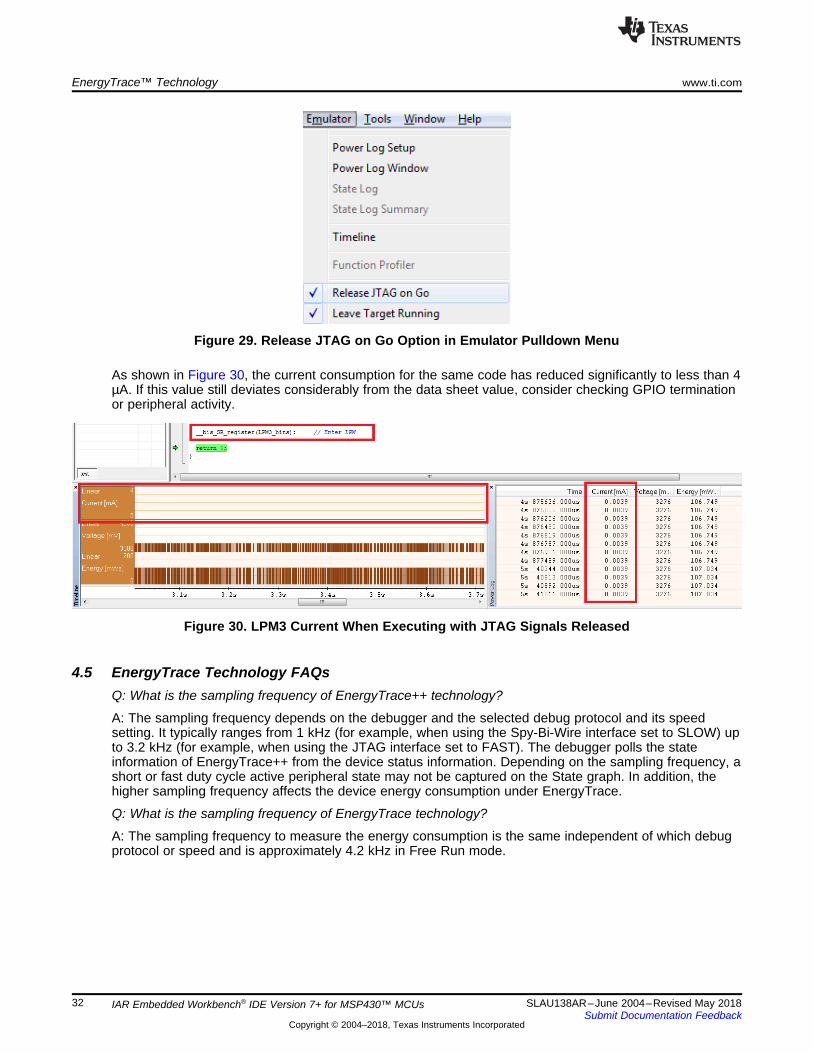
Figure 27. Timeline With EnergyTrace Data
4.4 Measuring Low-Power CurrentsDuring the capture of the internal states or even when simply executing until breakpoint halt, the targetmicrocontroller is constantly accessed by the JTAG or Spy-Bi-Wire debug logic. These debug accessesconsume energy that is included in the numbers shown in the Power Log window and graph. To measurethe absolute power consumption of the application, it is recommended to use the EnergyTrace mode incombination with the Release JTAG on Go option. This combination makes sure that the debug logic ofthe target microcontroller is not accessed while measuring energy consumption.
Figure 28 shows the current consumption of an application sleeping in LPM3, measured when the deviceis under debug control. The current column indicates approximately 152 µA current consumption, which issignificantly higher than the value stated in the device data sheet and is mostly caused by the currentconsumption of the device debug logic for breakpoint polling.
Figure 28. LPM3 Current When Executing Under Debug Control
After checking the Release JTAG on Go option in the Emulator pulldown menu (see Figure 29), thedebugger puts the JTAG or Spy-Bi-Wire lines in Hi-Z state after letting the application go.
IAR Embedded Workbench® IDE Version 7+ for MSP430™ MCUs
Figure 29. Release JTAG on Go Option in Emulator Pulldown Menu
As shown in Figure 30, the current consumption for the same code has reduced significantly to less than 4µA. If this value still deviates considerably from the data sheet value, consider checking GPIO terminationor peripheral activity.
Figure 30. LPM3 Current When Executing with JTAG Signals Released
4.5 EnergyTrace Technology FAQsQ: What is the sampling frequency of EnergyTrace++ technology?
A: The sampling frequency depends on the debugger and the selected debug protocol and its speedsetting. It typically ranges from 1 kHz (for example, when using the Spy-Bi-Wire interface set to SLOW) upto 3.2 kHz (for example, when using the JTAG interface set to FAST). The debugger polls the stateinformation of EnergyTrace++ from the device status information. Depending on the sampling frequency, ashort or fast duty cycle active peripheral state may not be captured on the State graph. In addition, thehigher sampling frequency affects the device energy consumption under EnergyTrace.
Q: What is the sampling frequency of EnergyTrace technology?
A: The sampling frequency to measure the energy consumption is the same independent of which debugprotocol or speed and is approximately 4.2 kHz in Free Run mode.
IAR Embedded Workbench® IDE Version 7+ for MSP430™ MCUs
Q: My Power graph seems to include noise. Is my board defective?
A: The power values shown in the Power graph are derived (that is, calculated) from the accumulatedenergy counted by the measurement system. When the target is consuming little energy, a small numberof energy packets over time are supplied to the target, and the software needs to accumulate the dc-dccharge pulses over time before a new current value can be calculated. For currents under 1 µA, this cantake up to one second, while for currents in the milliamp range, a current can be calculated everymillisecond. Additional filtering is not applied so that detail information is not lost. Another factor thataffects the energy (and with it, the current) that is consumed by the target is periodic background debugaccess during normal code execution, either through capturing of States information or through breakpointpolling. Try recording in Free Run mode to see a much smoother Power graph.
Q: I have a code that repeatedly calls functions that have the same size. I would expect the functionprofile to show an equal distribution of the run time. In reality, I see some functions having slightly morerun time than expected, and some functions slightly less.
A: During program counter trace, various factors affect the number of times a function is detected by theprofiler over time. The microcontroller code could benefit from the internal cache, thus executing somefunctions faster than others. Another influencing factor is memory wait states and CPU pipeline stalls,which add time variance to the code execution. An outside factor is the sampling frequency of thedebugger itself, which normally runs asynchronous to the microcontroller's code execution speed, but insome cases shows overlapping behavior, which also results in an unequal function run time distribution.
Q: My power mode profile sometimes shows short periods of power modes that I haven't used anywherein my code. For example, I'm expecting a transition from active mode to LPM3, but I see a LPM2 duringthe transition.
A: When capturing in EnergyTrace++ mode, digital information is continuously collected from the targetdevice. One piece of this information is the power mode control signals. Activation of low-power modesrequires stepping through a number of intermediate states. Usually this happens too quickly to becaptured by the trace function, but sometimes intermediate states can be captured and are displayed for ashort period of time as valid low-power modes.
Q: My profile sometimes includes an <Undetermined> low-power mode, and there are gaps in the Statesgraph Power Mode section. Where does the <Undetermined> low-power mode originate from?
A: During transitions from active mode to low-power mode, internal device clocks are switched off, andoccasionally the state information is not updated completely. This state is displayed as <Undetermined> inthe Profile window, and the States graph shows a gap during the time that the <Undetermined> low-powermode persists. The <Undetermined> state is an indication that your application has entered a low-powermode, but which mode cannot be accurately determined. If your application is frequently entering low-power modes, the <Undetermined> state will probably be shown more often than if your application onlyrarely uses low-power modes.
Q: What are the influencing factors for the accuracy of the energy measurement?
A: The energy measurement circuit is directly supplied from the USB bus voltage, and thus it is sensitiveto USB bus voltage variations. During calibration, the energy equivalent of a single dc-dc charge pulse isdefined, and this energy equivalent depends on the USB voltage level. To ensure a good repeatability andaccuracy, power the debugger directly from an active USB port, and avoid using bus-powered hubs andlong USB cables that can lead to voltage drops, especially when other consumers are connected to theUSB hub. Furthermore the LDO and resistors used for reference voltage generation and those in thecalibration circuit come with a certain tolerance and ppm rate over temperature, which also influencesaccuracy of the energy measurement.
Q: I am trying to capture in EnergyTrace++ mode or EnergyTrace mode with a MSP430 device that isexternally powered, but there is no data shown in the Profile, Energy, Power and States window.
A: Both EnergyTrace++ mode and EnergyTrace mode require the target to be supplied from thedebugger. No data can be captured when the target microcontroller is externally powered.
IAR Embedded Workbench® IDE Version 7+ for MSP430™ MCUs
Q: I cannot measure LPM currents when I am capturing in EnergyTrace++ mode. I am expecting a fewmicroamps but measure more than 150 µA.
A: Reading digital data from the target microcontroller consumes energy in the JTAG domain of themicrocontroller. Hence, an average current of approximately 150 µA is measured when connecting anampere meter to the device power supply pins. If you want to eliminate energy consumption throughdebug communication, switch to EnergyTrace mode, and let the target microcontroller execute with"Release JTAG on Go" option checked.
Q: My LPM currents seem to be wrong. I am expecting a few microamps but measure more, even in FreeRun mode or when letting the device execute without debug control from an independent power supply.
A: The most likely cause of this extra current is improper GPIO termination, as floating pins can lead toextra current flow. Also check the JTAG pins again, especially when the debugger is still connected (butidle), as the debugger output signal levels in idle state might not match how the JTAG pins have beenconfigured by the application code. This could also lead to extra current flow.
IAR Embedded Workbench® IDE Version 7+ for MSP430™ MCUs
5 MSP430 FRAM Memory Protection MechanismsThe available memory of an FRAM-based microcontroller can be seen as unified memory, which meansthe memory can be arbitrarily divided between code and data sections. As a consequence, a singleFRAM-based microcontroller can be customized for a wide range of application use cases. MSP430devices support two memory protection methods:• Memory Protection Unit (MPU) and Intellectual Property Encapsulation (IPE)• FRAM Memory Write Protection (FRWP). The protection granularity (1k) can be configured on some
devices.
See the device-specific data sheet to determine which method is available on a particular device. Forinstructions on the efficient use of this technology, see MSP430™ FRAM Technology – How To and BestPractices.
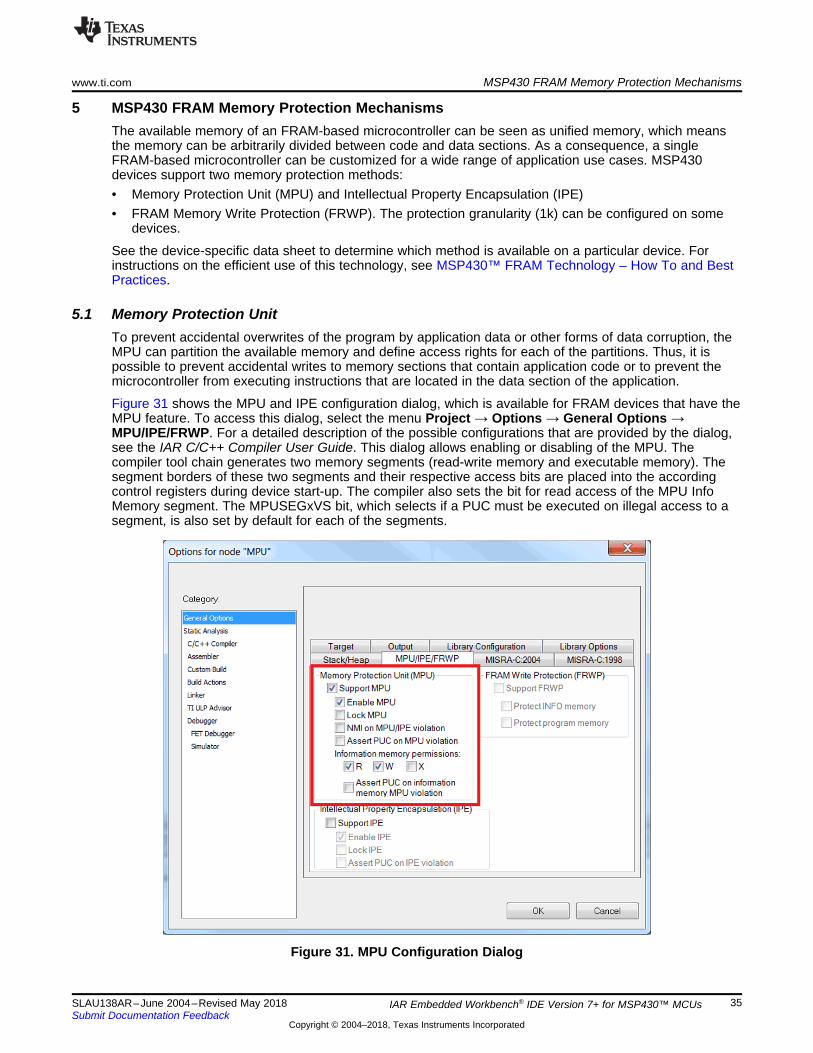
5.1 Memory Protection UnitTo prevent accidental overwrites of the program by application data or other forms of data corruption, theMPU can partition the available memory and define access rights for each of the partitions. Thus, it ispossible to prevent accidental writes to memory sections that contain application code or to prevent themicrocontroller from executing instructions that are located in the data section of the application.
Figure 31 shows the MPU and IPE configuration dialog, which is available for FRAM devices that have theMPU feature. To access this dialog, select the menu Project → Options → General Options →MPU/IPE/FRWP. For a detailed description of the possible configurations that are provided by the dialog,see the IAR C/C++ Compiler User Guide. This dialog allows enabling or disabling of the MPU. Thecompiler tool chain generates two memory segments (read-write memory and executable memory). Thesegment borders of these two segments and their respective access bits are placed into the accordingcontrol registers during device start-up. The compiler also sets the bit for read access of the MPU InfoMemory segment. The MPUSEGxVS bit, which selects if a PUC must be executed on illegal access to asegment, is also set by default for each of the segments.
IAR Embedded Workbench® IDE Version 7+ for MSP430™ MCUs
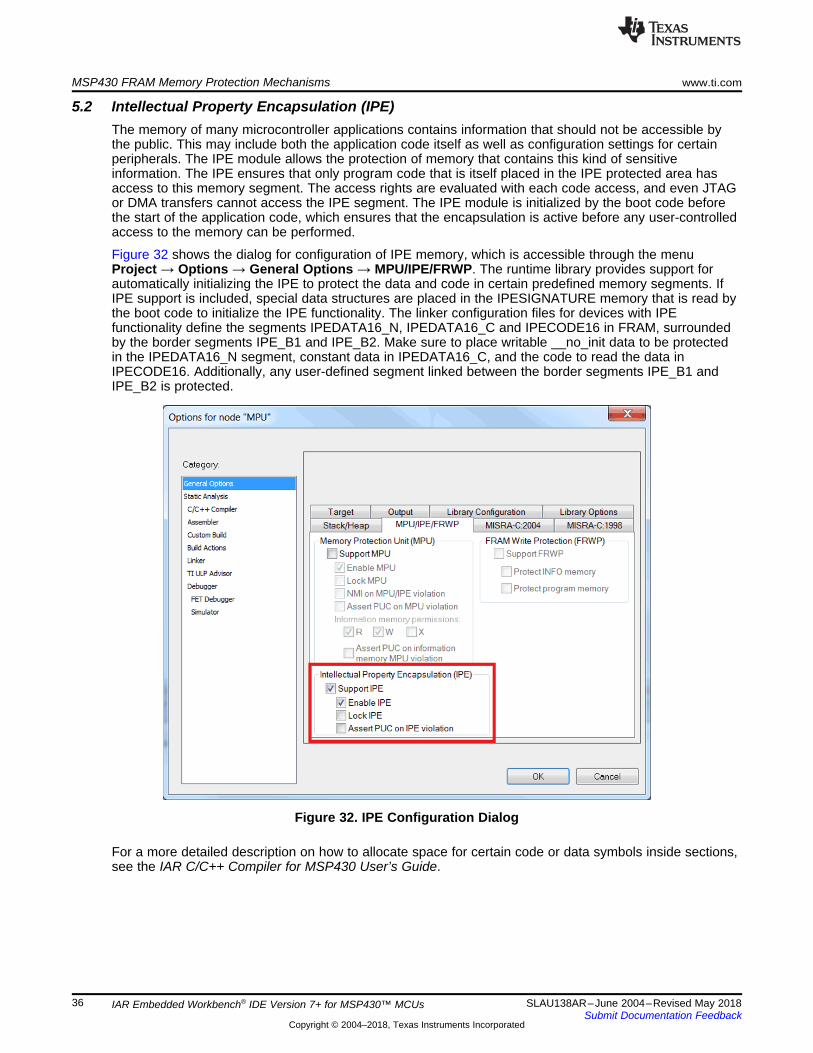
5.2 Intellectual Property Encapsulation (IPE)The memory of many microcontroller applications contains information that should not be accessible bythe public. This may include both the application code itself as well as configuration settings for certainperipherals. The IPE module allows the protection of memory that contains this kind of sensitiveinformation. The IPE ensures that only program code that is itself placed in the IPE protected area hasaccess to this memory segment. The access rights are evaluated with each code access, and even JTAGor DMA transfers cannot access the IPE segment. The IPE module is initialized by the boot code beforethe start of the application code, which ensures that the encapsulation is active before any user-controlledaccess to the memory can be performed.
Figure 32 shows the dialog for configuration of IPE memory, which is accessible through the menuProject → Options → General Options → MPU/IPE/FRWP. The runtime library provides support forautomatically initializing the IPE to protect the data and code in certain predefined memory segments. IfIPE support is included, special data structures are placed in the IPESIGNATURE memory that is read bythe boot code to initialize the IPE functionality. The linker configuration files for devices with IPEfunctionality define the segments IPEDATA16_N, IPEDATA16_C and IPECODE16 in FRAM, surroundedby the border segments IPE_B1 and IPE_B2. Make sure to place writable __no_init data to be protectedin the IPEDATA16_N segment, constant data in IPEDATA16_C, and the code to read the data inIPECODE16. Additionally, any user-defined segment linked between the border segments IPE_B1 andIPE_B2 is protected.
Figure 32. IPE Configuration Dialog
For a more detailed description on how to allocate space for certain code or data symbols inside sections,see the IAR C/C++ Compiler for MSP430 User’s Guide.
IAR Embedded Workbench® IDE Version 7+ for MSP430™ MCUs
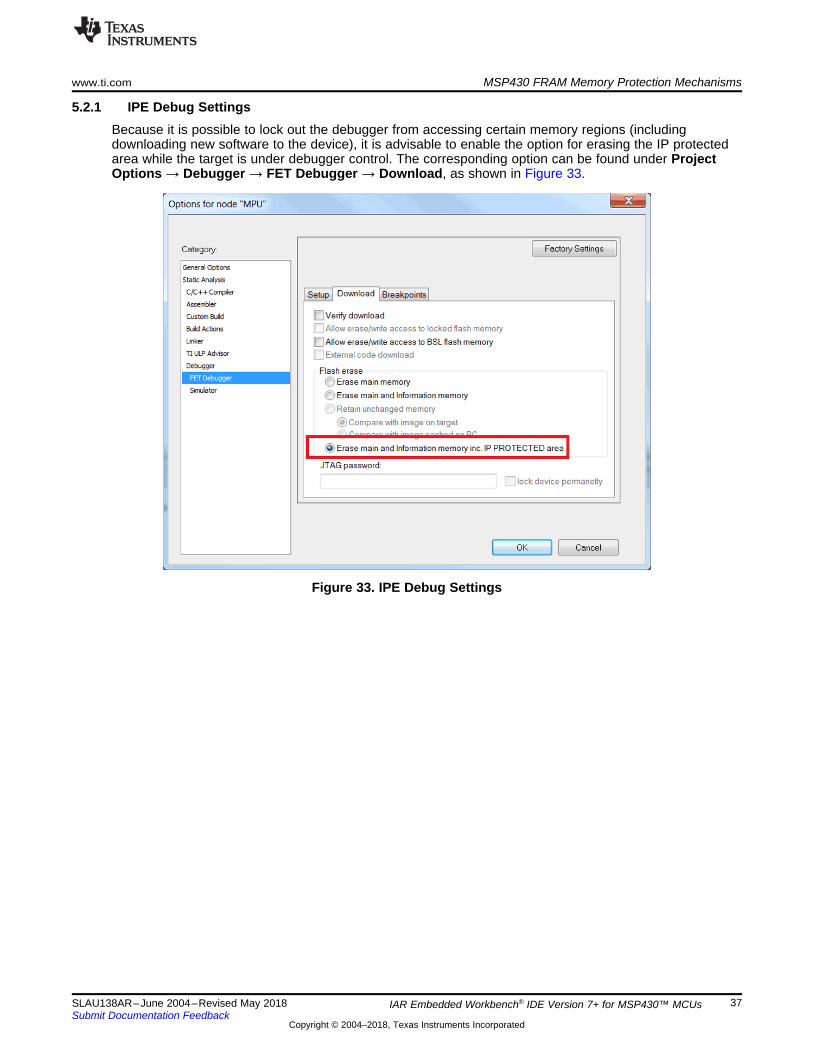
5.2.1 IPE Debug SettingsBecause it is possible to lock out the debugger from accessing certain memory regions (includingdownloading new software to the device), it is advisable to enable the option for erasing the IP protectedarea while the target is under debugger control. The corresponding option can be found under ProjectOptions → Debugger → FET Debugger → Download, as shown in Figure 33.
IAR Embedded Workbench® IDE Version 7+ for MSP430™ MCUs
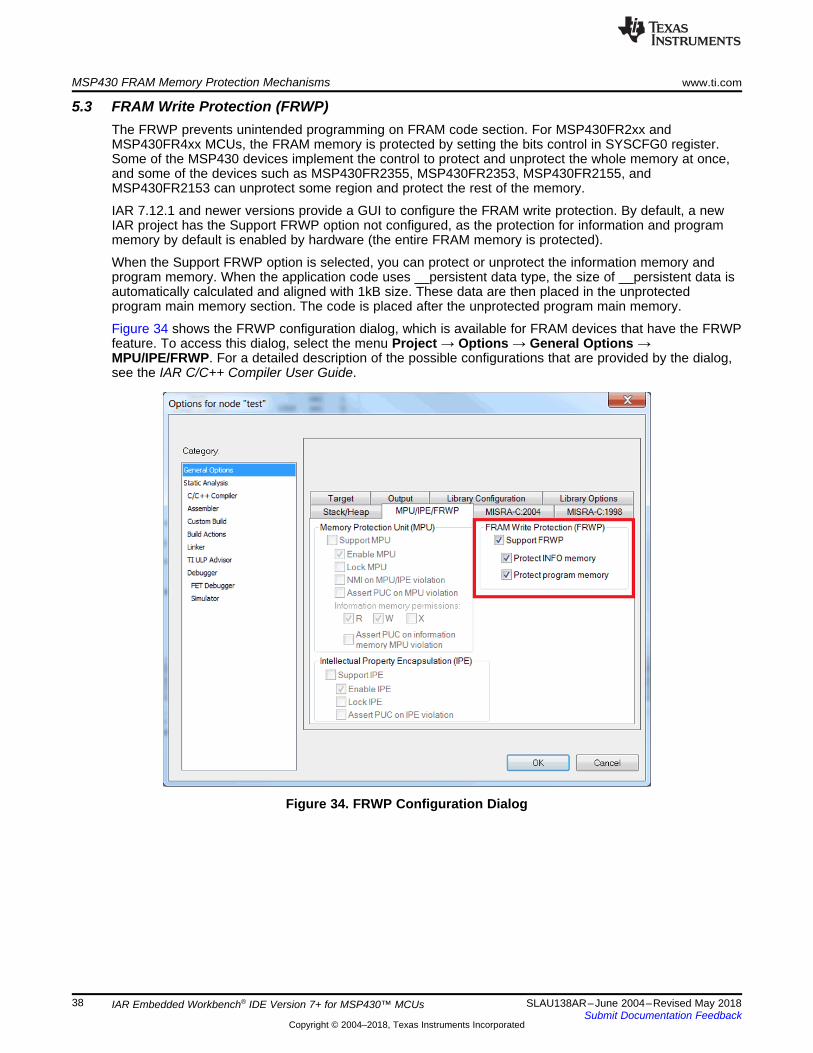
5.3 FRAM Write Protection (FRWP)The FRWP prevents unintended programming on FRAM code section. For MSP430FR2xx andMSP430FR4xx MCUs, the FRAM memory is protected by setting the bits control in SYSCFG0 register.Some of the MSP430 devices implement the control to protect and unprotect the whole memory at once,and some of the devices such as MSP430FR2355, MSP430FR2353, MSP430FR2155, andMSP430FR2153 can unprotect some region and protect the rest of the memory.
IAR 7.12.1 and newer versions provide a GUI to configure the FRAM write protection. By default, a newIAR project has the Support FRWP option not configured, as the protection for information and programmemory by default is enabled by hardware (the entire FRAM memory is protected).
When the Support FRWP option is selected, you can protect or unprotect the information memory andprogram memory. When the application code uses __persistent data type, the size of __persistent data isautomatically calculated and aligned with 1kB size. These data are then placed in the unprotectedprogram main memory section. The code is placed after the unprotected program main memory.
Figure 34 shows the FRWP configuration dialog, which is available for FRAM devices that have the FRWPfeature. To access this dialog, select the menu Project → Options → General Options →MPU/IPE/FRWP. For a detailed description of the possible configurations that are provided by the dialog,see the IAR C/C++ Compiler User Guide.
IAR Embedded Workbench® IDE Version 7+ for MSP430™ MCUs
6 Frequently Asked Questions (FAQs)This section gives solutions to frequently asked questions regarding program hardware development anddebugging tools.
6.1 HardwareFor a complete list of hardware-related FAQs, see the MSP430 Hardware Tools User's Guide.
6.2 Program Development (Assembler, C-Compiler, Linker)1. The files supplied in the 430\tutor folder work only with the simulator. Do not use the files with
the FET (see FAQ Program Development #11).2. A common MSP430 "mistake" is to fail to disable the Watchdog mechanism; the Watchdog is
enabled by default, and it resets the device if not disabled or properly handled by the application (seeFAQ Program Development #14).
3. When adding source files to a project, do not add files that are included by source files thathave already been added to the project (for example, an .h file within a .c or .s43 file). These filesare added to the project file hierarchy automatically.
4. In assembler, enclosing a string in double quotes ("string") automatically appends a zero byte tothe string (as an end-of-string marker). Enclosing a string in single-quotes ('string') does not.
5. When using the compiler or the assembler, if the last character of a source line is backslash (\),the subsequent carriage return or line feed is ignored (that is, it is as if the current line and thenext line are a single line). When used in this way, the backslash character is a "line continuation"character.
6. The linker output format must be "Debug information for C-SPY" (.d43) for use with C-SPY. C-SPY does not start otherwise, and an error message is output. C-SPY cannot input a .TXT file.
7. Position-independent code can be generated using Project → Options → General Options →Target → Position-Independent Code.
8. Within the C libraries, GIE (Global Interrupt Enable) is disabled before (and restored after) thehardware multiplier is used. To disable this behavior, contact TI for the source code for theselibraries.
9. It is possible to mix assembler and C programs within the Workbench. See the AssemblerLanguage Interface chapter of the C/C++ Compiler Reference Guide from IAR.
10. The Workbench can produce an object file in TI .TXT format. C-SPY cannot input an object file inTI.TXT format. An error message is output in this case.
11. The example programs given in the KickStart documentation (that is, Demo, Tutor, and soforth) are not correct. The programs work only in the simulator. The programs do not functioncorrectly on an actual device, because the watchdog mechanism is active. The programs need to bemodified to disable the watchdog mechanism. Disable the watchdog mechanism with this C-statement:WDTCTL = WDTPW + WDTHOLD;or with this assembler statement:mov.w # WDTPW+WDTHOLD,&WDTCTL
12. Access to MPY using an 8-bit operation is flagged as an error. Within the .h files, 16-bit registersare defined in such a way that 8-bit operations upon them are flagged as an error. This feature isnormally beneficial and can catch register access violations. However, in the case of MPY, it is alsovalid to access this register using 8-bit operators. If 8-bit operators are used to access MPY, theaccess violation check mechanism can be defeated by using "MPY_" to reference the register.Similarly, 16-bit operations on 8-bit registers are flagged.
13. Constant definitions (#define) used within the .h files are effectively reserved and include, forexample, C, Z, N, and V. Do not create program variables with these names.
IAR Embedded Workbench® IDE Version 7+ for MSP430™ MCUs
14. The CSTARTUP that is implicitly linked with all C applications does not disable the Watchdogtimer. Use WDTCL = WDTPW + WDTHOLD; to explicitly disable the Watchdog. This statement is bestplaced in the __low_level_init() function that is executed before main().If the Watchdog timer is not disabled, and the Watchdog triggers and resets the device duringCSTARTUP, the source screen goes blank, as C-SPY is not able to locate the source code forCSTARTUP. Be aware that CSTARTUP can take a significant amount of time to execute if a largenumber of initialized global variables are used.
int __low_level_init(void){
/* Insert your low-level initializations here */
WDTCTL = WDTPW + WDTHOLD; // Stop Watchdog timer
/*==================================*//* Choose if segment initialization *//* should be done or not. *//* Return: 0 to omit seg_init *//* 1 to run seg_init *//*==================================*/return (1);
}
15. Compiler optimization can remove unused variables and statements that have no effect andcan affect debugging. Optimization: NONE is supported within Project → Options → C/C++ Compiler→ Code → Optimizations. Alternatively, variables can be declared volatile.
16. The IAR tutorial assumes a Full or Baseline version of the Workbench. Within a KickStartsystem, it is not possible to configure the C compiler to output assembler mnemonics.
17. Existing projects from an IAR 1.x system can be used within the new IAR 2.x or 3.x system; seethe IAR document migration guide for EW430 x.x. This document is located in <InstallationRoot>\Embedded Workbench x.x\430\doc\migration.htm
18. Assembler projects must reference the code segment (RSEG CODE) to use the Linker →Processing → Fill Unused Code Memory mechanism. No special steps are required to use Linker →Processing → Fill Unused Code Memory with C projects.
19. Ensure that the proper C runtime library is selected for C-only and mixed C and assemblylanguage projects (Project → General Options → Library Configuration → Library). For assembly-onlyprojects, the runtime library must not get linked in, otherwise the build fails and a linker error is output(for example, that the RESET vector is allocated twice).
20. Numerous C and C++ runtime libraries are provided with the Workbench:cl430d: C, 64-bit doublescl430dp: C, 64-bit doubles, position independentcl430f: C, 32-bit doublescl430fp: C, 32-bit doubles, position independentdl430d: C++, 64-bit doublesdl430dp: C++, 64-bit doubles, position independentdl430f: C++, 32-bit doublesdl430fp: C++, 32-bit doubles, position independentSee the IAR MSP430 C/C++ compiler reference guide for more information on which library to use.
IAR Embedded Workbench® IDE Version 7+ for MSP430™ MCUs
6.3 Debugging (C-SPY)1. Debugging with C-SPY does not seem to affect an externally connected MSP430 device. Should
this be the case, check whether the main debugger menu bar contains a menu item called Simulator. Ifso, an actual C-SPY MSP430 core simulator session is running, and no actual communication with thetarget device is established. Solution: Ensure that the C-SPY driver is set to FET Debugger(Project → Options → Debugger → Setup → Driver).
2. C-SPY reports that it cannot communicate with the device. Possible solutions to this probleminclude:• Ensure the correct debug interface is selected; use Project → Options → FET Debugger →
Connection.• Ensure the correct parallel port (LPT1, 2, or 3) is being specified in the C-SPY configuration if a
parallel port MSP-FET430PIF interface is used; use Project → Options → FET Debugger →Connection → Parallel Port → LPT1 (default) or LPT2 or LPT3. Check the PC BIOS for the parallelport address (0x378, 0x278, 0x3BC), and the parallel port configuration (ECP, Compatible,Bidirectional, or Normal) (see FAQ Debugging #8). For users of IBM ThinkPad™computers, tryport specifications LPT2 and LPT3, even if the operating system reports the parallel port is atLPT1.
• Ensure that the jumper settings are configured correctly on the target hardware.• Ensure that no other software application has reserved or taken control of the COM or parallel port
(for example, printer drivers, ZIP drive drivers, ) if a parallel port MSP-FET430PIF interface isused. Such software can prevent the C-SPY or FET driver from accessing the parallel port and,hence, communicating with the device.
• Open the Device Manager and determine if the driver for the FET tool has been correctly installedand if the COM or parallel port is successfully recognized by the Windows OS.
• It may be necessary to reboot the computer to complete the installation of the required port drivers.• Ensure that the MSP430 device is securely seated in the socket (so that the "fingers" of the socket
completely engage the pins of the device), and that its pin 1 (indicated with a circular indentationon the top surface) aligns with the "1" mark on the PCB.
CAUTIONPossible Damage to DeviceAlways handle MSP430 devices using a vacuum pick-up tool only; do notuse your fingers, as they can easily bend the device pins and render thedevice useless. Also, always observe and follow proper ESD precautions.
3. C-SPY reports that the device JTAG security fuse is blown. With current MSP-FET430PIF andMSP430-FET430UIF JTAG interface tools, there is a weakness when adapting target boards that arepowered externally. This leads to an accidental fuse check in the MSP430 and results in the JTAGsecurity fuse being recognized as blown although it is not. This is valid for MSP-FET430PIF and MSP-FET430UIF but is mainly seen on MSP-FET430UIF.Workarounds:• Connect the device RST/NMI pin to JTAG header (pin 11), MSP-FET430PIF or MSP-FET430UIF
interface tools are able to pull the RST line, this also resets the device internal fuse logic.• Do not connect both VCC Tool (pin 2) and VCC Target (pin 4) of the JTAG header and also specify a
value for VCC in the debugger that is equal to the external supply voltage.
NOTE: When the VCC voltage is not high enough when trying to erase or write flash memory, thefollowing message displays in the console: "Target device supply voltage is too low for Flasherase/programming". If this occurs, try to change your supply voltage.
IAR Embedded Workbench® IDE Version 7+ for MSP430™ MCUs
4. C-SPY can download data into RAM, information, and flash main memories. A warning messageis output if an attempt is made to download data outside of the device memory spaces.
5. C-SPY can debug applications that use interrupts and low-power modes (see FAQ Debugging#26).
6. C-SPY cannot access the device registers and memory while the device is running. C-SPYdisplays "-" to indicate that a register or memory field is invalid. The user must stop the device toaccess device registers and memory. Any displayed register or memory fields are then updated.
7. When C-SPY is started, the flash memory is erased and the opened file is programmed inaccordance with the download options as set in Project → Options → FET Debugger → DownloadControl. This initial erase and program operations can be disabled selecting Project → Options → FETDebugger → Download Control → Suppress Download. Programming of the flash can be initiatedmanually with Emulator → Init New Device.
8. The parallel port designators (LPTx) have the following physical addresses: LPT1: 378h, LPT2:278h, LPT3: 3BCh. The configuration of the parallel port (ECP, Compatible, Bidirectional, Normal) isnot significant; ECP seems to work well (see FAQ Debugging #1 for additional hints on solvingcommunication problems between C-SPY and the device).
9. C-SPY may assert RST/NMI to reset the device when C-SPY is started and when the device isprogrammed. The device is also reset by the C-SPY RESET button, and when the device is manuallyreprogrammed (Emulator → Init New Device), and when the JTAG is resynchronized (Emulator →Resynchronize JTAG). When RST/NMI is not asserted (low), C-SPY sets the logic driving RST/NMI tohigh-impedance, and RST/NMI is pulled high through a resistor on the PCB.RST/NMI may get asserted and negated after power is applied when C-SPY is started. RST/NMI maythen get asserted and negated a second time after device initialization is complete.Within C-SPY, Emulator → "Power on" Reset cycles power to the target to generate a power-on reset.
10. C-SPY can debug a device whose program reconfigures the function of the RST/NMI pin toNMI.
11. The level of the XOUT/TCLK pin is undefined when C-SPY resets the device. The logic drivingXOUT/TCLK is set to high-impedance at all other times.
12. When making current measurements of the device, ensure that the JTAG control signals arereleased (Emulator → Release JTAG on Go), otherwise the device is powered by the signals on theJTAG pins and the measurements are erroneous (see FAQ Debugging #14).
13. Most C-SPY settings (breakpoints, ) are preserved between sessions.14. When C-SPY has control of the device, the CPU is ON (that is, it is not in low-power mode)
regardless of the settings of the low-power mode bits in the status register. Any low-power modeconditions are restored prior to Step or Go. Consequently, do not measure the power consumed by thedevice while C-SPY has control of the device. Instead, run your application using Go with JTAGreleased (see FAQ Debugging #12).
15. The View → Memory → Memory Fill dialog of C-SPY requires hexadecimal values for StartingAddress, Length, and Value to be preceded with "0x". Otherwise the values are interpreted asdecimal.
16. The Memory debug view of C-SPY (View → Memory) can be used to view the RAM, the informationmemory, and the flash main memory. The Memory utility of C-SPY can be used to modify the RAM;the information memory and flash main memory cannot be modified using the Memory utility.The information memory and flash main memory can be programmed only when a project is openedand the data is downloaded to the device, or when Emulator → Init New Device is selected.
17. C-SPY does not permit the individual segments of the information memory and the flash mainmemory to be manipulated separately; consider the information memory to be one contiguousmemory, and the flash main memory to be a second contiguous memory.
IAR Embedded Workbench® IDE Version 7+ for MSP430™ MCUs
18. The Memory window correctly displays the contents of memory where it is present. However, theMemory window incorrectly displays the contents of memory where there is none present.Memory should be used only in the address ranges specified by the device data sheet.
19. C-SPY uses the system clock to control the device during debugging. Therefore, device counters, ,that are clocked by the Main System Clock (MCLK) are affected when C-SPY has control of thedevice. Special precautions are taken to minimize the effect upon the Watchdog Timer. The CPU coreregisters are preserved. All other clock sources (SMCLK, ACLK) and peripherals continue to operatenormally during emulation. In other words, the Flash Emulation Tool is a partially intrusive tool.Devices that support clock control (Emulator → Advanced → Clock Control) can further minimize theseeffects by selecting to stop the clock(s) during debugging (see FAQ Debugging #24).
20. There is a time after C-SPY performs a reset of the device [when the C-SPY session is firststarted, when the flash is reprogrammed (via Init New Device), and when JTAG is resynchronized(Resynchronize JTAG)] and before C-SPY has regained control of the device that the deviceexecutes code normally. This behavior may have side effects. Once C-SPY has regained control ofthe device, it performs a reset of the device and retains control.
21. When programming the flash, do not set a breakpoint on the instruction immediately followingthe write to flash operation. A simple workaround to this limitation is to follow the write to flashoperation with a NOP, and set a breakpoint on the instruction following the NOP (see FAQ Debugging#23).
22. The Dump Memory length specifier is restricted to four hexadecimal digits (0 to FFFF). Thislimits the number of bytes that can be written from 0 to 65535. Consequently, it is not possible to writememory from 0 to 0xFFFF inclusive, as this would require a length specifier of 65536 (or 10000h).
23. Multiple internal machine cycles are required to clear and program the flash memory. When singlestepping over instructions that manipulate the flash, control is given back to C-SPY before theseoperations are complete. Consequently, C-SPY updates its memory window with erroneousinformation. A workaround to this behavior is to follow the flash access instruction with a NOP, andthen step past the NOP before reviewing the effects of the flash access instruction (see FAQDebugging #21).
24. Peripheral bits that are cleared when read during normal program execution (that is, interruptflags) are cleared when read while being debugged (that is, memory dump, peripheral registers).When using certain MSP430 devices (such as MSP430F15x, MSP430F16x, MSP430F43x, andMSP430F44x devices), bits do not behave this way (that is, the bits are not cleared by C-SPY readoperations).
25. C-SPY cannot be used to debug programs that execute in the RAM of MSP430F12x andMSP430F41x devices. A workaround to this limitation is to debug programs in flash.
26. While single stepping with active and enabled interrupts, it can appear that only the interruptservice routine (ISR) is active (that is, the non-ISR code never appears to execute, and the singlestep operation always stops on the first line of the ISR). However, this behavior is correct because thedevice always processes an active and enabled interrupt before processing non-ISR (that is, mainline)code. A workaround for this behavior is, while within the ISR, to disable the GIE bit on the stack so thatinterrupts are disabled after exiting the ISR. This permits the non-ISR code to be debugged (butwithout interrupts). Interrupts can later be reenabled by setting GIE in the status register in the Registerwindow.On devices with the clock control emulation feature, it may be possible to suspend a clock betweensingle steps and delay an interrupt request (Emulator → Advanced → Clock Control).
27. The base (decimal, hexadecimal, ) property of Watch Window variables is not preservedbetween C-SPY sessions; the base reverts to Default Format.
28. On devices equipped with a Data Transfer Controller (DTC), the completion of a data transfer cyclepreempts a single step of a low-power mode instruction. The device advances beyond the low-power mode instruction only after an interrupt is processed. Until an interrupt is processed, it appearsthat the single step has no effect. A workaround to this situation is to set a breakpoint on the instructionfollowing the low-power mode instruction, and then execute (Go) to this breakpoint.
IAR Embedded Workbench® IDE Version 7+ for MSP430™ MCUs
29. The transfer of data by the Data Transfer Controller (DTC) may not stop precisely when theDTC is stopped in response to a single step or a breakpoint. When the DTC is enabled and asingle step is performed, one or more bytes of data can be transferred. When the DTC is enabled andconfigured for two-block transfer mode, the DTC may not stop precisely on a block boundary whenstopped in response to a single step or a breakpoint.
30. The C-SPY Register window supports instruction cycle length counters. The cycle counter isactive only while single stepping. The count is reset when the device is reset, or the device is run (Go).The count can be edited (normally set to zero) at any time.
31. It is possible to use C-SPY to get control of a running device whose state is unknown. Simplyuse C-SPY to program a dummy device, and then start the application with Release JTAG on Goselected. Remove the JTAG connector from the dummy device and connect to the unknown device.Select Debug → Break (or the Stop hand) to stop the unknown device. The state of the device canthen be interrogated.
32. Resetting a program temporarily requires a breakpoint if Project → Options → Debugger → Setup →Run To is enabled. If N or more breakpoints are set, Reset sets a virtual breakpoint and runs to theRun To function. Consequently, it may require a significant amount of time before the programresets (that is, stops at the Run To function). During this time the C-SPY indicates that the program isrunning, and C-SPY windows may be blank (or may not be correctly updated).
33. Run To Cursor temporarily requires a breakpoint. If N breakpoints are set and virtual breakpoints aredisabled, Run To Cursor incorrectly uses a virtual breakpoint. This results in very slow programexecution.
34. The simulator is a CPU core simulator only; peripherals are not simulated, and interrupts arestatistical events.
35. On devices without data breakpoint capabilities, it is possible to associate with an instructionbreakpoint an (arbitrarily complex) expression that C-SPY evaluates when the breakpoint is hit. Thismechanism can be used to synthesize a data breakpoint. See the C-SPY documentation for adescription of this complex breakpoint mechanism.
36. The ROM Monitor referenced by the C-SPY documentation applies only to older MSP430Exxx(EPROM) based devices; it can be ignored when using the FET and the flash-based MSP430Fdevices.
37. Special function registers (SFRs) and the peripheral registers are displayed in View → Register.38. The putchar() and getchar() breakpoints are set only if these functions are present (and the
mechanism is enabled). Note that putchar() and getchar() could be indirectly referenced by a libraryfunction.
39. The flash program and download progress bar does not update gradually. This behavior is to beexpected. The progress bar updates whenever a "chunk" of memory is written to flash. Thedevelopment tools attempt to minimize the number of program chunks to maximize programmingefficiency. Consequently, it is possible, for example, for a 60Kbyte program to be reduced to a singlechunk, and the progress bar is not updated until the entire write operation is complete.
40. After moving a complete EW430 project (including workspace, project, source and generatedobject files) to a different storage location (for example, a different PC) a rebuild of the object files(rebuild project) is required before starting C-Spy. The Linker stores absolute path names in the objectfiles, which probably do not match the new storage location. C-Spy can show a message that thesource files cannot be located or can show strange artifacts during debugging.
NOTE: Linux and OS X do not support the MSP-FET430UIF if it has an old firmware image (MSPDebug Stack v2) on it.
Customers who buy a new MSP-FET430UIF will encounter this issue on OS X or Linux,because the MSP Debug Stack v2 is programmed on the debugger during production. Toresolve this problem, connect the debugger to a Windows PC and use IAR, CCS, or theMSP430 Flasher to update the firmware on the debugger to the latest version (v3 or newer).
NOTE: Do not connect through a USB hub when performing a firmware update on the MSP-FET,the MSP-FET430UIF, or a LaunchPad™ development kit.
IAR Embedded Workbench® IDE Version 7+ for MSP430™ MCUs
7 FET-Specific Menus
7.1 Menus
7.1.1 Emulator → Device InformationOpens a window with information about the target device being used. Also, this window allows adjustingthe target voltage in the case an MSP-FET430UIF interface is used to supply power to the target byperforming a right-click inside this window. The supply voltage can be adjusted between 1.8 V and 5 V.This voltage is available on pin 2 of the 14-pin target connector to supply the target from the MSP-FET430UIF. If the target is supplied externally, the external supply voltage should be connected to pin 4 ofthe target connector, so the MSP-FET430UIF can set the level of the output signals accordingly.
7.1.2 Emulator → Release JTAG on GoC-SPY uses the device JTAG signals to debug the device. On some MSP430 devices, these JTAGsignals are shared with the device port pins. Normally, C-SPY maintains the pins in JTAG mode so thatthe device can be debugged. During this time the port functionality of the shared pins is not available.
However, when Release JTAG On Go is selected, the JTAG drivers are set to three-state, and the deviceis released from JTAG control (TEST pin is set to GND) when Go is activated. Any active on-chipbreakpoints are retained, and the shared JTAG port pins revert to their port functions.
At this time, C-SPY has no access to the device and cannot determine if an active breakpoint (if any) hasbeen reached. C-SPY must be manually commanded to stop the device, at which time the state of thedevice is determined (that is, was a breakpoint reached?) (see FAQ Debugging #12).
7.1.3 Emulator → Resynchronize JTAGRegain control of the device.
It is not possible to Resynchronize JTAG while the device is operating.
7.1.4 Emulator → Init New DeviceInitialize the device according to the settings in the Download Options. Basically, the current program fileis downloaded to the device memory. The device is then reset. This option can be used to programmultiple devices with the same program from within the same C-SPY session.
It is not possible to select Init New Device while the device is operating.
7.1.5 Emulator → Secure - Blow JTAG FuseBlows the fuse on the target device. After the fuse is blown, no communication with the device is possible.
7.1.6 Emulator → Breakpoint UsageList all used hardware and virtual breakpoints, as well as all currently defined EEM breakpoints.
7.1.7 Emulator → Advanced → Clock ControlDisable the specified system clock while C-SPY has control of the device (following a Stop or breakpoint).All system clocks are enabled following a Go or a single step (Step or Step Into) (see FAQ Debugging#19).
7.1.8 Emulator → Advanced → Emulation ModeSpecify the device to be emulated. The device must be reset (or reinitialized through Init New Device)following a change to the emulation mode.
IAR Embedded Workbench® IDE Version 7+ for MSP430™ MCUs
7.1.9 Emulator → Advanced → Memory DumpWrite the specified device memory contents to a specified file. A conventional dialog is displayed thatpermits the user to specify a file name, a memory starting address, and a length. The addressed memoryis then written in a text format to the named file. Options permit the user to select word or byte text format,and address information and register contents also can be appended to the file.
7.1.10 Emulator → Advanced → Breakpoint CombinerOpen the Breakpoint Combiner dialog box. The Breakpoint Combiner dialog box permits one to specifybreakpoint dependencies. A breakpoint is triggered when the breakpoints are encountered in the specifiedorder.
7.1.11 Emulator → State Storage ControlOpen the State Storage dialog box. The State Storage dialog box permits the user to use the statestorage module. The State Storage Module is not present on all MSP430 derivatives. See Table 1 forimplementation details
See the IAR C-SPY FET Debugger section in the MSP430 IAR Embedded Workbench IDE User Guide.
7.1.12 Emulator → State Storage WindowOpen the State Storage window, and display the stored state information as configured by the StateStorage dialog.
See the IAR C-SPY FET Debugger section in the MSP430 IAR Embedded Workbench IDE User Guide.
7.1.13 Emulator → Sequencer ControlOpen the Sequencer dialog box. The Sequencer dialog box permits the user to configure the sequencerstate machine.
See the IAR C-SPY FET Debugger section in the MSP430 IAR Embedded Workbench IDE User Guide.
7.1.14 Emulator → "Power on" ResetCycle power to the device to effect a reset.
7.1.15 Emulator → GIE on/offEnables or disables all interrupts. Needs to be restored manually before Go.
7.1.16 Emulator → Leave Target RunningIf C-SPY is closed, the target keeps running the user program.
7.1.17 Emulator → Force Single SteppingOn Go the program is executed by single steps. The cycle counter works correctly only in this mode.
NOTE: Availability of Emulator → Advanced menus
Not all Emulator → Advanced menus are supported by all MSP430 devices. These menusare grayed out.
Revision HistoryNOTE: Page numbers for previous revisions may differ from page numbers in the current version.
Changes from April 1, 2018 to May 11, 2018 ................................................................................................................... Page
• Updated document layout, including section, figure, and table numbering........................................................ 1• Added Section 3.7, Download Options for MSP430 Devices ...................................................................... 14• Changed Figure 9, JTAG Password .................................................................................................. 15• Updated all contents in Section 5, MSP430 FRAM Memory Protection Mechanisms.......................................... 35
IMPORTANT NOTICE FOR TI DESIGN INFORMATION AND RESOURCES
Texas Instruments Incorporated (‘TI”) technical, application or other design advice, services or information, including, but not limited to,reference designs and materials relating to evaluation modules, (collectively, “TI Resources”) are intended to assist designers who aredeveloping applications that incorporate TI products; by downloading, accessing or using any particular TI Resource in any way, you(individually or, if you are acting on behalf of a company, your company) agree to use it solely for this purpose and subject to the terms ofthis Notice.TI’s provision of TI Resources does not expand or otherwise alter TI’s applicable published warranties or warranty disclaimers for TIproducts, and no additional obligations or liabilities arise from TI providing such TI Resources. TI reserves the right to make corrections,enhancements, improvements and other changes to its TI Resources.You understand and agree that you remain responsible for using your independent analysis, evaluation and judgment in designing yourapplications and that you have full and exclusive responsibility to assure the safety of your applications and compliance of your applications(and of all TI products used in or for your applications) with all applicable regulations, laws and other applicable requirements. Yourepresent that, with respect to your applications, you have all the necessary expertise to create and implement safeguards that (1)anticipate dangerous consequences of failures, (2) monitor failures and their consequences, and (3) lessen the likelihood of failures thatmight cause harm and take appropriate actions. You agree that prior to using or distributing any applications that include TI products, youwill thoroughly test such applications and the functionality of such TI products as used in such applications. TI has not conducted anytesting other than that specifically described in the published documentation for a particular TI Resource.You are authorized to use, copy and modify any individual TI Resource only in connection with the development of applications that includethe TI product(s) identified in such TI Resource. NO OTHER LICENSE, EXPRESS OR IMPLIED, BY ESTOPPEL OR OTHERWISE TOANY OTHER TI INTELLECTUAL PROPERTY RIGHT, AND NO LICENSE TO ANY TECHNOLOGY OR INTELLECTUAL PROPERTYRIGHT OF TI OR ANY THIRD PARTY IS GRANTED HEREIN, including but not limited to any patent right, copyright, mask work right, orother intellectual property right relating to any combination, machine, or process in which TI products or services are used. Informationregarding or referencing third-party products or services does not constitute a license to use such products or services, or a warranty orendorsement thereof. Use of TI Resources may require a license from a third party under the patents or other intellectual property of thethird party, or a license from TI under the patents or other intellectual property of TI.TI RESOURCES ARE PROVIDED “AS IS” AND WITH ALL FAULTS. TI DISCLAIMS ALL OTHER WARRANTIES ORREPRESENTATIONS, EXPRESS OR IMPLIED, REGARDING TI RESOURCES OR USE THEREOF, INCLUDING BUT NOT LIMITED TOACCURACY OR COMPLETENESS, TITLE, ANY EPIDEMIC FAILURE WARRANTY AND ANY IMPLIED WARRANTIES OFMERCHANTABILITY, FITNESS FOR A PARTICULAR PURPOSE, AND NON-INFRINGEMENT OF ANY THIRD PARTY INTELLECTUALPROPERTY RIGHTS.TI SHALL NOT BE LIABLE FOR AND SHALL NOT DEFEND OR INDEMNIFY YOU AGAINST ANY CLAIM, INCLUDING BUT NOTLIMITED TO ANY INFRINGEMENT CLAIM THAT RELATES TO OR IS BASED ON ANY COMBINATION OF PRODUCTS EVEN IFDESCRIBED IN TI RESOURCES OR OTHERWISE. IN NO EVENT SHALL TI BE LIABLE FOR ANY ACTUAL, DIRECT, SPECIAL,COLLATERAL, INDIRECT, PUNITIVE, INCIDENTAL, CONSEQUENTIAL OR EXEMPLARY DAMAGES IN CONNECTION WITH ORARISING OUT OF TI RESOURCES OR USE THEREOF, AND REGARDLESS OF WHETHER TI HAS BEEN ADVISED OF THEPOSSIBILITY OF SUCH DAMAGES.You agree to fully indemnify TI and its representatives against any damages, costs, losses, and/or liabilities arising out of your non-compliance with the terms and provisions of this Notice.This Notice applies to TI Resources. Additional terms apply to the use and purchase of certain types of materials, TI products and services.These include; without limitation, TI’s standard terms for semiconductor products http://www.ti.com/sc/docs/stdterms.htm), evaluationmodules, and samples (http://www.ti.com/sc/docs/sampterms.htm).