176
ANNUAL REPORT of the Inter-American Tropical Tuna Commission 2000 INFORME ANUAL de la Comisión Interamericana del Atún Tropical La Jolla, California 2002 ISSN: 0074-1000

ANNUAL REPORTof the
Inter-American Tropical Tuna Commission
2000
INFORME ANUALde la
Comisión Interamericana del Atún Tropical
La Jolla, California
2002
ISSN: 0074-1000

The Inter-American Tropical Tuna Commission(IATTC) operates under the authority and direc-tion of a convention originally entered into byCosta Rica and the United States. The convention,which came into force in 1950, is open to adherenceby other governments whose nationals fish fortropical tunas in the eastern Pacific Ocean. Underthis provision Panama adhered in 1953, Ecuador in1961, Mexico in 1964, Canada in 1968, Japan in1970, France and Nicaragua in 1973, Vanuatu in1990, Venezuela in 1992, El Salvador in 1997, andGuatemala in 2000. Canada withdrew from theCommission in 1984.
Additional information about the IATTC andits publications can be found on the inside backcover of this report.
COSTA RICAGeorge HeigoldHerbert Nanne
ECUADORLuis Torres NavarreteRafael Trujillo Bejarano
EL SALVADORMario González RecinosRoberto InterianoMargarita Salazar de Jurado
FRANCE—FRANCIAPaul MennecierJean-Christophe PailleJulien Turenne
GUATEMALAFélix Ramiro Pérez ZarcoAntonio Salaverría
JAPAN—JAPONYoshiaki ItoDaishiro NagahataYamato Ueda
La Comisión Interamericana del Atún Tropical(CIAT) funciona bajo la autoridad y dirección deuna convención establecida originalmente porCosta Rica y los Estados Unidos. La Convención,vigente desde 1950, está abierta a la afiliación deotros go-biernos cuyos ciudadanos pescan atunesen el Océano Pacífico oriental. Bajo esta estipu-lación, Panamá se afilió en 1953, Ecuador en 1961,México en 1964, Canadá en 1968, Japón en 1970,Francia y Nicaragua en 1973, Vanuatu en 1990,Venezuela en 1991, El Salvador en 1997, yGuatemala en 2000. Canadá se retiró de laComisión en 1984.
Información adicional sobre la CIAT y sus pub-licaciones puede ser encontrada en la parteinterna posterior de la cubierta de este informe.
MEXICOMaría Teresa Bandala MedinaGuillermo Compeán JiménezMichel DreyfusMara Angélica Murillo Correa
NICARAGUAMiguel A. Marenco U.Sergio Martínez Casco
PANAMAArnulfo L. Franco Rodríguez
USA—EE.UU.M. Austin FormanWilliam HogarthRebecca Lent (alternate)James T. McCarthy
VANUATUJohn RoosenA. N. TillettEdward E. Weissman
VENEZUELACarolina BeltránFrancisco Ortisi, Jr.Jean-François Pulvenis
COMMISSIONERS—COMISIONADOS
DirectorRobin Allen
Headquarters and Main Laboratory—Oficina y Laboratorio Principal8604 La Jolla Shores Drive
La Jolla, California 92037-1508, U.S.A.www.iattc.org

ANNUAL REPORTof the
Inter-American Tropical Tuna Commission
2000
INFORME ANUALde la
Comisión Interamericana del Atún Tropical
La Jolla, California
2002

CONTENTS−−INDICE
ENGLISH VERSION−−VERSION EN INGLESPage
INTRODUCTION . . . . . . . . . . . . . . . . . . . . . . . . . . . . . . . . . . . . . . . . . . . . . . . . . . . . . . . . . . . . . .5MEETINGS . . . . . . . . . . . . . . . . . . . . . . . . . . . . . . . . . . . . . . . . . . . . . . . . . . . . . . . . . . . . . . . . . . .6
IATTC meetings . . . . . . . . . . . . . . . . . . . . . . . . . . . . . . . . . . . . . . . . . . . . . . . . . . . . . . . . . .6Meetings of IATTC working groups . . . . . . . . . . . . . . . . . . . . . . . . . . . . . . . . . . . . . . . . . .7Meetings of the Parties to the Agreement on the International Dolphin Conservation
Program (AIDCP) . . . . . . . . . . . . . . . . . . . . . . . . . . . . . . . . . . . . . . . . . . . . . . . . . . . . .9Meetings of working groups of the AIDCP . . . . . . . . . . . . . . . . . . . . . . . . . . . . . . . . . . . . .9
ADMINISTRATION . . . . . . . . . . . . . . . . . . . . . . . . . . . . . . . . . . . . . . . . . . . . . . . . . . . . . . . . . . .10Budget . . . . . . . . . . . . . . . . . . . . . . . . . . . . . . . . . . . . . . . . . . . . . . . . . . . . . . . . . . . . . . . . .10Financial statement . . . . . . . . . . . . . . . . . . . . . . . . . . . . . . . . . . . . . . . . . . . . . . . . . . . . . . 10
INTER-AGENCY COOPERATION . . . . . . . . . . . . . . . . . . . . . . . . . . . . . . . . . . . . . . . . . . . . . . . 10DATA COLLECTION . . . . . . . . . . . . . . . . . . . . . . . . . . . . . . . . . . . . . . . . . . . . . . . . . . . . . . . . . .12
The fishery for tunas and tuna-like fishes in the eastern Pacific Ocean . . . . . . . . . . . .13Size compositions of the catches of tunas . . . . . . . . . . . . . . . . . . . . . . . . . . . . . . . . . . . . .19Observer program . . . . . . . . . . . . . . . . . . . . . . . . . . . . . . . . . . . . . . . . . . . . . . . . . . . . . . . .21
RESEARCH . . . . . . . . . . . . . . . . . . . . . . . . . . . . . . . . . . . . . . . . . . . . . . . . . . . . . . . . . . . . . . . . . .22Reproductive biology of bigeye tuna . . . . . . . . . . . . . . . . . . . . . . . . . . . . . . . . . . . . . . . . .22Tuna tagging . . . . . . . . . . . . . . . . . . . . . . . . . . . . . . . . . . . . . . . . . . . . . . . . . . . . . . . . . . . .23Ecological studies . . . . . . . . . . . . . . . . . . . . . . . . . . . . . . . . . . . . . . . . . . . . . . . . . . . . . . . .25Early life history studies . . . . . . . . . . . . . . . . . . . . . . . . . . . . . . . . . . . . . . . . . . . . . . . . . .29Oceanography and meteorology . . . . . . . . . . . . . . . . . . . . . . . . . . . . . . . . . . . . . . . . . . . . .34Stock assessment of tunas and billfishes . . . . . . . . . . . . . . . . . . . . . . . . . . . . . . . . . . . . .35Dolphins . . . . . . . . . . . . . . . . . . . . . . . . . . . . . . . . . . . . . . . . . . . . . . . . . . . . . . . . . . . . . . .35
GEAR PROGRAM . . . . . . . . . . . . . . . . . . . . . . . . . . . . . . . . . . . . . . . . . . . . . . . . . . . . . . . . . . . . .40Dolphin safety panel alignments . . . . . . . . . . . . . . . . . . . . . . . . . . . . . . . . . . . . . . . . . . . .41Training and certification of fishing captains . . . . . . . . . . . . . . . . . . . . . . . . . . . . . . . . . .41Other services . . . . . . . . . . . . . . . . . . . . . . . . . . . . . . . . . . . . . . . . . . . . . . . . . . . . . . . . . . .41
MEASURES FOR THE CONSERVATION OF TUNAS . . . . . . . . . . . . . . . . . . . . . . . . . . . . . . .41Yellowfin tuna . . . . . . . . . . . . . . . . . . . . . . . . . . . . . . . . . . . . . . . . . . . . . . . . . . . . . . . . . .42Bigeye tuna . . . . . . . . . . . . . . . . . . . . . . . . . . . . . . . . . . . . . . . . . . . . . . . . . . . . . . . . . . . . .42Bycatches . . . . . . . . . . . . . . . . . . . . . . . . . . . . . . . . . . . . . . . . . . . . . . . . . . . . . . . . . . . . . .42
THE INTERNATIONAL DOLPHIN CONSERVATION PROGRAM . . . . . . . . . . . . . . . . . . . . .43System for tracking and verifying tuna . . . . . . . . . . . . . . . . . . . . . . . . . . . . . . . . . . . . . .43At-sea reporting by observers . . . . . . . . . . . . . . . . . . . . . . . . . . . . . . . . . . . . . . . . . . . . . .43
PUBLICATIONS . . . . . . . . . . . . . . . . . . . . . . . . . . . . . . . . . . . . . . . . . . . . . . . . . . . . . . . . . . . . . .44WEB SITE . . . . . . . . . . . . . . . . . . . . . . . . . . . . . . . . . . . . . . . . . . . . . . . . . . . . . . . . . . . . . . . . . . .44
FIGURES−−FIGURAS . . . . . . . . . . . . . . . . . . . . . . . . . . .45
TABLES−−TABLAS . . . . . . . . . . . . . . . . . . . . . . . . . . . .87

VERSION EN ESPAÑOL−−SPANISH VERSIONPágina
INTRODUCCION . . . . . . . . . . . . . . . . . . . . . . . . . . . . . . . . . . . . . . . . . . . . . . . . . . . . . . . . . . . .119REUNIONES . . . . . . . . . . . . . . . . . . . . . . . . . . . . . . . . . . . . . . . . . . . . . . . . . . . . . . . . . . . . . . . .120
Reuniones de la CIAT . . . . . . . . . . . . . . . . . . . . . . . . . . . . . . . . . . . . . . . . . . . . . . . . . . . .120Reuniones de grupos de trabajo de la CIAT . . . . . . . . . . . . . . . . . . . . . . . . . . . . . . . . . .121Reuniones de las Partes del Acuerdo sobre el Programa Internacional para la
Conservación de los Delfines (APICD) . . . . . . . . . . . . . . . . . . . . . . . . . . . . . . . . . .123Reuniones de grupos de trabajo del APICD . . . . . . . . . . . . . . . . . . . . . . . . . . . . . . . . . .123
ADMINISTRACION . . . . . . . . . . . . . . . . . . . . . . . . . . . . . . . . . . . . . . . . . . . . . . . . . . . . . . . . . .124Presupuesto . . . . . . . . . . . . . . . . . . . . . . . . . . . . . . . . . . . . . . . . . . . . . . . . . . . . . . . . . . . .124Informe financiero . . . . . . . . . . . . . . . . . . . . . . . . . . . . . . . . . . . . . . . . . . . . . . . . . . . . . .124
COLOBARACION CON ENTIDADES AFINES . . . . . . . . . . . . . . . . . . . . . . . . . . . . . . . . . . . .124TOMA DE DATOS . . . . . . . . . . . . . . . . . . . . . . . . . . . . . . . . . . . . . . . . . . . . . . . . . . . . . . . . . . .127
La pesqueria de atunes y especies afines en le Océano Pacífico oriental . . . . . . . . . . .127Composición por tamaño de la captura de atunes . . . . . . . . . . . . . . . . . . . . . . . . . . . . .133Programa de observadores . . . . . . . . . . . . . . . . . . . . . . . . . . . . . . . . . . . . . . . . . . . . . . . .135
INVESTIGACION . . . . . . . . . . . . . . . . . . . . . . . . . . . . . . . . . . . . . . . . . . . . . . . . . . . . . . . . . . . .137Biología reproductora de atún patudo . . . . . . . . . . . . . . . . . . . . . . . . . . . . . . . . . . . . . . .137Marcado de atunes . . . . . . . . . . . . . . . . . . . . . . . . . . . . . . . . . . . . . . . . . . . . . . . . . . . . . .137Estudios ecológicos . . . . . . . . . . . . . . . . . . . . . . . . . . . . . . . . . . . . . . . . . . . . . . . . . . . . . .140Estudios del ciclo vital temprano . . . . . . . . . . . . . . . . . . . . . . . . . . . . . . . . . . . . . . . . . . .143Oceanografía y meteorología . . . . . . . . . . . . . . . . . . . . . . . . . . . . . . . . . . . . . . . . . . . . . .149Evaluación de los stocks de atunes y peces picudos . . . . . . . . . . . . . . . . . . . . . . . . . . . .150Delfines . . . . . . . . . . . . . . . . . . . . . . . . . . . . . . . . . . . . . . . . . . . . . . . . . . . . . . . . . . . . . . .150
PROGRAMA DE ARTES DE PESCA . . . . . . . . . . . . . . . . . . . . . . . . . . . . . . . . . . . . . . . . . . . .156Alineaciones del paño de protección de delfines . . . . . . . . . . . . . . . . . . . . . . . . . . . . . . .156Entrenamiento y certificación de capitanes de pesca . . . . . . . . . . . . . . . . . . . . . . . . . . .156Otros servicios . . . . . . . . . . . . . . . . . . . . . . . . . . . . . . . . . . . . . . . . . . . . . . . . . . . . . . . . .157
MEDIDAS PARA LA CONSERVACION DEL ATUN . . . . . . . . . . . . . . . . . . . . . . . . . . . . . . . .157Atún aleta amarilla . . . . . . . . . . . . . . . . . . . . . . . . . . . . . . . . . . . . . . . . . . . . . . . . . . . . .157Atún patudo . . . . . . . . . . . . . . . . . . . . . . . . . . . . . . . . . . . . . . . . . . . . . . . . . . . . . . . . . . .158Capturas incidentales . . . . . . . . . . . . . . . . . . . . . . . . . . . . . . . . . . . . . . . . . . . . . . . . . . . .158
EL PROGRAMA INTERNACIONAL PARA LA CONSERVACION DE LOS DELFINES . . .158Sistema de seguimiento y verificación de atún . . . . . . . . . . . . . . . . . . . . . . . . . . . . . . . .158Informes desde el mar por los observadores . . . . . . . . . . . . . . . . . . . . . . . . . . . . . . . . . .159
PUBLICACIONES . . . . . . . . . . . . . . . . . . . . . . . . . . . . . . . . . . . . . . . . . . . . . . . . . . . . . . . . . . .159SITIO DE INTERNET . . . . . . . . . . . . . . . . . . . . . . . . . . . . . . . . . . . . . . . . . . . . . . . . . . . . . . . .159
APPENDIX 1−−ANEXO 1STAFF−PERSONAL . . . . . . . . . . . . . . . . . . . . . . . . . . . . . . . . . . . . . . . . . . . . . . . . . . . . . . . . . .160VISITING SCIENTISTS AND STUDENTS−CIENTIFICOS Y ESTUDIANTES EN
VISITA . . . . . . . . . . . . . . . . . . . . . . . . . . . . . . . . . . . . . . . . . . . . . . . . . . . . . . . . . . . . . . .163APPENDIX 2−−ANEXO 2
FINANCIAL STATEMENT−DECLARACION FINANCIERA . . . . . . . . . . . . . . . . . . . . . . . . .164APPENDIX 3−−ANEXO 3
CONTRIBUTIONS BY IATTC STAFF MEMBERS PUBLISHED DURING 2000−CONTRIBUCIONES POR PERSONAL DE CIAT PUBLICADOS DURANTE 2000 . . . . . . .170


ANNUAL REPORT OF THEINTER-AMERICAN TROPICAL TUNA COMMISSION, 2000
INTRODUCTION
The Inter-American Tropical Tuna Commission (IATTC) operates under the authorityand direction of a convention originally entered into by Costa Rica and the United States. Theconvention, which came into force in 1950, is open to adherence by other governments whosenationals fish for tropical tunas and tuna-like species in the eastern Pacific Ocean (EPO).Under this provision Panama adhered in 1953, Ecuador in 1961, Mexico in 1964, Canada in1968, Japan in 1970, France and Nicaragua in 1973, Vanuatu in 1990, Venezuela in 1992, ElSalvador in 1997, and Guatemala in 2000. Canada withdrew from the IATTC in 1984.
The IATTC’s responsibilities are met with two programs, the Tuna-Billfish Program andthe Tuna-Dolphin Program.
The principal responsibilities of the Tuna-Billfish Program specified in the IATTC’s con-vention were (1) to study the biology of the tunas and related species of the eastern PacificOcean to estimate the effects that fishing and natural factors have on their abundance and (2)to recommend appropriate conservation measures so that the stocks of fish could be maintainedat levels which would afford maximum sustainable catches. It was subsequently given theresponsibility of collecting information on compliance with Commission resolutions.
The IATTC’s responsibilities were broadened in 1976 to address the problems arisingfrom the incidental mortality in purse seines of dolphins that associate with yellowfin tuna inthe EPO. The Commission agreed that it “should strive to maintain a high level of tuna pro-duction and also to maintain [dolphin] stocks at or above levels that assure their survival in per-petuity, with every reasonable effort being made to avoid needless or careless killing of[dolphins]” (IATTC, 33rd meeting, minutes: page 9). The principal responsibilities of theIATTC’s Tuna-Dolphin Program are (1) to monitor the abundance of dolphins and their mor-tality incidental to purse-seine fishing in the EPO, (2) to study the causes of mortality of dol-phins during fishing operations and promote the use of fishing techniques and equipment thatminimize these mortalities, (3) to study the effects of different modes of fishing on the variousfish and other animals of the pelagic ecosystem, and (4) to provide a secretariat for theInternational Dolphin Conservation Program, described below.
On June 17, 1992, the Agreement for the Conservation of Dolphins (“the 1992 La JollaAgreement”), which created the International Dolphin Conservation Program (IDCP), wasadopted. The main objective of the Agreement was to reduce the mortality of dolphins in thepurse-seine fishery without harming the tuna resources of the region and the fisheries thatdepend on them. On May 21, 1998, the Agreement on the International Dolphin ConservationProgram (AIDCP), which built on and formalized the provisions of the 1992 La Jolla Agreement,was signed, and it came into effect on February 15, 1999. The Parties to this agreement wouldbe “committed to ensure the sustainability of tuna stocks in the eastern Pacific Ocean and toprogressively reduce the incidental mortalities of dolphins in the tuna fishery of the easternPacific Ocean to levels approaching zero; to avoid, reduce and minimize the incidental catch andthe discard of juvenile tuna and the incidental catch of non-target species, taking into consider-ation the interrelationship among species in the ecosystem.”
To carry out these missions, the IATTC conducts a wide variety of investigations at sea,in ports where tunas are landed, and in its laboratories. The research is carried out by a perma-nent, internationally-recruited research and support staff (Appendix 1) selected by the Director,
ANNUAL REPORT 2000 5

who is directly responsible to the Commission.The scientific program is now in its 50th year. The results of the IATTC staff ’s research
are published in the IATTC’s Bulletin and Stock Assessment Report series in English and Span-ish, its two official languages, in its Special Report and Data Report series, and in books, out-side scientific journals, and trade journals. Summaries of each year’s activities are reportedupon in the IATTC’s Annual Reports, also in the two languages.
MEETINGSThe minutes or chairman’s reports of the various meetings described below are available
on the IATTC’s web site, www.iattc.org.
IATTC MEETINGS66th meeting of the IATTC
The 66th meeting of the IATTC was held in San Jose, Costa Rica, on June 12 and 14-15,2000. The following actions were taken:
(1) A resolution on a catch quota for yellowfin tuna was adopted. This resolution estab-lished a “restricted period,” during which purse seiners and baitboats would be required to re-frain from fishing for yellowfin in two areas, one off Mexico and the other off Ecuador, and a“closure date,” after which the prohibition would include the entire Commission’s YellowfinRegulatory Area (Figure 1).
(2) A resolution on the conservation of bigeye tuna was adopted. This resolution setrestrictions on making purse-seine sets on tunas associated with floating objects.
(3) A resolution on bycatches, calling for, among other things, implementation of a 1-yearpilot program for 2001, during which all yellowfin, skipjack, and bigeye tuna that were caught,regardless of size, would be retained by the vessels, was adopted.
(4) A resolution concerning a regional vessel register was adopted. This resolution calledupon the Parties to the IATTC Convention and the non-member governments with jurisdictionover vessels participating in the fishery to furnish information on those vessels to the staff ofthe IATTC.
(5) A resolution concerning compliance was adopted. This resolution established obliga-tions regarding compliance with IATTC resolutions for Parties to its Convention and for non-Parties whose fleets operate in the EPO.
(6) A resolution establishing the contributions of the Parties to the IATTC Convention toits budget for the fiscal year of 2000-2001 was adopted.
(7) A resolution on fishing by vessels under the jurisdiction of states or fisheries entitiesthat are not members of the IATTC was adopted.
(8) A resolution on studies of the abundance of dolphins in the eastern Pacific Ocean(EPO) was adopted. This resolution pertained mostly to studies being conducted by the U.S. Na-tional Marine Fisheries Service.
(9) Ambassador Jean-François Pulvenis of Venezuela was elected Chairman of theIATTC for the period of June 2000 to June 2001.
67th meeting of the IATTC
The 67th meeting of the IATTC was held in La Jolla, California, USA, on October 26,2000. Dr. Robin Allen, Director of the IATTC, gave informal reports on the recent meetings ofthe Scientific Working Group on Bigeye Tuna, the scientific review of the methods used to esti-
6 TUNA COMMISSION

mate dolphin abundance, and the catches to date of yellowfin tuna in the EPO.
Symposium on World Tuna Fisheries
To commemorate the 50th anniversary of the IATTC, a Symposium on World TunaFisheries was held in San Jose, Costa Rica, on June 13, 2000. M.Sc. Herbert Nanne of CostaRica served as Chairman. The following persons spoke at the Symposium: Mr. John F. Caddy,Imperial College of London; Mr. Campbell McGregor, Commission for the Conservation ofSouthern Bluefin Tuna; Dr. Robin Allen, IATTC; Mr. Adolfo Ribeiro Lima, InternationalCommission for the Conservation of Atlantic Tunas; Mr. Alejandro A. Anganuzzi, Indian OceanTuna Commission; Mr. Michael Lodge, International Seabed Authority; Dr. James Joseph,IATTC. These presentations were to be published as an IATTC Special Report in 2001.
Scientific review of the methods used to estimate dolphin abundance
A scientific review of the methods used to estimate dolphin abundance was held in LaJolla, California, USA, on October 19-20, 2000. The material covered during the meeting in-cluded the design and results of the dolphin surveys conducted by the U.S. National MarineFisheries Service during 1998 and 1999, the differences between the surveys of the two years,the distributions of the various stocks of dolphins, the oceanography related to the distributionof dolphins in the EPO, a potential regime shift in the EPO, the inter-annual variability in thesurvey results and oceanography, and other factors potentially affecting the variability of thesurveys.
MEETINGS OF IATTC WORKING GROUPS
Third meeting of the Permanent Working Group on Fleet Capacity
The third meeting of the Permanent Working Group on Fleet Capacity was held in SanJose, Costa Rica, on January 26-28, 2000. The group made a set of recommendations that wassubsequently distributed to the members of the IATTC and adopted as a resolution on February17, 2000.
Fourth meeting of the Permanent Working Group on Fleet Capacity
The fourth meeting of the Permanent Working Group on Fleet Capacity was held in Pa-nama, R.P., on July 31-August 2, 2000. The working group considered several proposals tomanage the size of the purse-seine fleet operating in the EPO. A resolution to acknowledge thecommitment to establish a limit on the total capacity of the fleet was agreed to by correspon-dence on August 19, 2000.
Fifth meeting of the Permanent Working Group on Fleet Capacity
The fifth meeting of the Permanent Working Group on Fleet Capacity was held in LaJolla, California, USA, on October 25-26, 2000. A draft resolution on the capacity of the tunafleet operating in the EPO was discussed, but agreement on it was not reached.
Second meeting of the Working Group on Finance
The second meeting of the Working Group on Finance was held in Mexico City on Feb-ruary 9-10, 2000. The Working Group’s mission was to (1) develop a system for determining theobligations of the Parties to the IATTC for financing the IATTC in the future and (2) determine
ANNUAL REPORT 2000 7

the obligations of the Parties to the IATTC for the 2001 fiscal year (October 1, 2000-September30, 2001). It was agreed that is necessary that the system be based on a formula, so thatCommissioners and administrators of each nation can explain the system and rationale bywhich national obligations were determined to their legislatures and budget officials. Severalpossible systems were presented and discussed, and it was agreed that the one that met withthe most support would be presented at the next plenary session of the IATTC.
Second meeting of the Working Group on Bycatch
The second meeting of the Working Group on Bycatch was held in La Jolla, California,USA, on April 4-6, 2000. Reports of the Subgroups on Ecological Studies and Modeling and onTechnology and Fishing Practices were presented and discussed, and then options for reducingbycatches in the fishery were discussed.
First meeting of the Scientific Working Group
The Scientific Working Group met in La Jolla, California, USA, on April 10-13, 2000. Themembers of the Working Group reviewed stock assessments for yellowfin, skipjack, bigeye,bluefin, albacore, and blue marlin prepared by the staff.
Meeting of the Scientific Working Group on Bigeye Tuna
A meeting of the Scientific Working Group On Bigeye Tuna was held in La Jolla, Cali-fornia, USA, on October 23-24, 2000. The principal subjects of discussion at this meeting wererecent developments in the fishery, an update on stock assessment of bigeye in the EPO, areport on Pacific-wide modeling of bigeye, results of a pilot tagging program conducted by theIATTC during early 2000, alternative methods for reducing the catches of juvenile bigeye, andaccuracy of the estimated catches of bigeye.
Fourth meeting of the Working Group on the IATTC Convention
The fourth meeting of the Working Group on the IATTC Convention was held in La Jolla,California, USA, on May 22-25, 2000.
Fifth meeting of the Working Group on the IATTC Convention
The fifth meeting of the Working Group on the IATTC Convention was held in La Jolla,California, USA, on September 11-16, 2000. The group continued its discussion of the revisedchairman’s text of the convention and of some issues left pending from its previous meetings;also, some new proposals were made. The members of the Group agreed to meet again in March2001, and set June 2001 as a target date for presenting an agreed draft text to the Commission.
First meeting of the Working Group on Compliance
The first meeting of the Working Group on Compliance was held in San Jose, Costa Rica,on June 9-10, 2000. At this meeting the problems of assuring compliance with IATTC resolu-tions, and methods, including vessel monitoring systems, to overcome lack of compliance were discussed.
8 TUNA COMMISSION

MEETINGS OF THE PARTIES TO THE AGREEMENT ON THE INTERNATIONALDOLPHIN CONSERVATION PROGRAM (AIDCP)
Third meeting of the Parties to the AIDCP
The third Meeting of the Parties to the AIDCP was held in San Jose, Costa Rica, on June17, 2000. Modifications were made to the Tuna Tracking System.
Fourth meeting of the Parties to the AIDCP
The fourth Meeting of the Parties to the AIDCP was held in La Jolla, California, USA, onOctober 28-29, 2000. The topics of discussion included the report of the 25th meeting of the In-ternational Review Panel, assignments of dolphin mortality limits (DMLs) to individual vessels,guidelines for experimental gear or techniques, the report of the Working Group on Per-stock,Per-year Dolphin Mortality Caps, a real-time reporting system for dolphin mortalities, and thesituation regarding a state that was not cooperating with the AIDCP.
MEETINGS OF WORKING GROUPS OF THE AIDCP
23rd meeting of the International Review Panel
The 23rd meeting of the International Review Panel was held in San Jose, Costa Rica, onJanuary 24-25, 2000. The Panel reviewed possible infractions of the AIDCP reported by ob-servers, approved a list of captains qualified to fish for tunas associated with dolphins, reviewedthe initial assignments of DMLs for 2000, discussed the system for tracking and verifying tuna,and discussed alternate dolphin rescue procedures in lieu of backdown.
24th meeting of the International Review Panel
The 24th meeting of the International Review Panel was held in San Jose, Costa Rica, onJune 7-8, 2000. The Panel reviewed possible infractions of the AIDCP reported by observers,reviewed the DMLs for 1999 and 2000 and the list of qualified captains, discussed criteria forgranting vessels the exemption of force majeure or extraordinary circumstances, and discussedthe system for tracking and verifying tuna.
25th meeting of the International Review Panel
The 25th meeting of the International Review Panel (IRP) was held in La Jolla, Califor-nia, USA, on October 27, 2000. The Panel reviewed possible infractions of the AIDCP reportedby observers, approved a proposed procedure for adding fishermen to the list of qualified cap-tains, discussed the report of the Chair of the Working Group on Tuna Tracking, and reviewedthe following: dolphin mortality limits (DMLs) for 2000 and 2001, the list of vessels qualified toreceive DMLs for 2001, guidelines for determining possible infractions of the AIDCP, and ac-tions by parties in response to possible infractions reported by the IRP.
Fifth meeting of the Permanent Working Group on Tuna Tracking
The fifth meeting of the Permanent Working Group on Tuna Tracking was held in LaJolla, California, USA, on October 27, 2000. Mechanisms for tuna tracking were discussed.
Third meeting of the Working Group on Per-stock, Per-year Dolphin Mortality Caps
The third meeting of the Working Group on Per-stock, Per-year Dolphin Mortality Caps
ANNUAL REPORT 2000 9

was held in La Jolla, California, USA, on October 28, 2000. A system for 2001 was discussed,and most of the participants agreed that the per-stock, per-year limits should be implementedon a global basis, as during 2000.
ADMINISTRATION
BUDGETAt its 61st meeting, held in La Jolla, California, USA, on June 10-12, 1998, the Commis-
sion unanimously approved the budget for the 1999-2000 fiscal year, submitted by the Director,in the amount of $4,701,333. However, the final amount received from the member statesduring the 1999-2000 fiscal year was $4,392,475, a shortfall of $308,858 relative to the amountthat was recommended and approved for the regular budget. As a consequence, some plannedresearch had to be curtailed. In addition to its regular budget, during the 1999-2000 fiscal yearthe IATTC received $1,497,891 from vessel owners to pay part of the costs of placing observerson their vessels, as required by the Agreement on the International Dolphin ConservationProgram, and $112,543 from interest and other sources.
FINANCIAL STATEMENTThe Commission’s financial accounts for the 1999-2000 fiscal year were audited by KPMG
LLP. Summary tables of its report are shown in Appendix 2 of this report.
INTER-AGENCY COOPERATION
During 2000 the scientific staff of the IATTC continued to maintain close contact withinternational, governmental, university, and private research organizations and institutions.This contact enabled the staff to keep abreast of the rapid advances and developments takingplace in fisheries and oceanography research throughout the world. Some aspects of these rela-tionships are described below.
The IATTC’s headquarters is located on the campus of Scripps Institution of Oceanogra-phy (SIO), University of California, La Jolla, California, USA, one of the major world centers forthe study of marine science and the headquarters for federal and state agencies involved in fish-eries, oceanography, and related sciences. This situation provides the staff with an excellentopportunity to maintain frequent contact with scientists of those organizations. Dr. Richard B.Deriso was a member of the faculty of SIO during 2000.
Dr. Deriso also served as a member of the faculty of the University of Washington, Seat-tle, Washington, USA, Dr. Martín A. Hall as a member of the faculty of the University of BritishColumbia, Vancouver, B.C., Canada, Dr. Michael G. Hinton as a member of the faculty of theUniversity of San Diego, San Diego, California, USA, and Dr. Pablo R. Arenas as a member ofthe faculty of the Centro Interdisciplinario de Ciencias Marinas (CICIMAR), InstitutoPolitécnico Nacional, La Paz, Mexico. Drs. Deriso, Hall, Hinton, Arenas, and Robert J. Olsonserved on committees that supervised the research of graduate students at various universitiesduring 2000.
The cordial and productive relationships that the IATTC has enjoyed with the ComisiónPermanente del Pacífico Sur (CPPS), the Convention for the Conservation of Southern BluefinTuna (CCSBT), the Food and Agriculture Organization (FAO) of the United Nations, the IndianOcean Tuna Commission (IOTC), the International Commission for the Conservation of AtlanticTunas (ICCAT), the Organización Latinoamericana de Desarrollo Pesquero (OLDEPESCA), the
10 TUNA COMMISSION

Secretariat of the Pacific Community (SPC), and other international organizations have contin-ued for many years. The IATTC became a member of the Coordinating Working Party on Fish-eries Statistics of the FAO in December 2000. Dr. Robin Allen was a member of the steeringcommittee for a symposium, held in early 2000, on climate variability and its ecological impactson the biota of the Pacific Ocean. The symposium was sponsored by the North Pacific MarineScience Organization (PICES), the IATTC, the International Pacific Halibut Commission, andthe Interim Scientific Committee for Tuna and Tuna-Like Species in the North Pacific Ocean.Dr. Allen was also a member of the steering committee for the Expert Consultation on Implica-tions of the Precautionary Approach: Tuna Biological and Technological Research, sponsored bythe CCSBT, FAO, the IATTC, ICCAT, the IOTC, and the SPC, which met in March 2000. Dr.Allen served as Chairman for the meeting, and Dr. Michael G. Hinton served as convener of theWorking Group on Statistics and Data Collection for the consultation. Drs. Mark N. Maunderand George M. Watters were participants, with scientists from the National Research Instituteof Far Seas Fisheries of Japan and the SPC, in a cooperative project to assess the condition ofthe stock(s) of bigeye tuna in the Pacific Ocean. This program receives its funding from thePelagic Fisheries Research Program, University of Hawaii.
Also during 2000 the IATTC staff maintained close working relationships with fisheryagencies of its member countries, and with similar institutions in many non-member countriesin various parts of the world. Dr. Richard B. Deriso was a member of the Scientific andStatistical Committee of the Western Pacific Fishery Management Council of the United States.Dr. Ashley J. Mullen was Associate Editor of Natural Resource Modeling, a journal published bythe Rocky Mountain Mathematics Consortium in association with the Resource ModelingAssociation. Dr. Michael D. Scott was Chairman of the Pacific Scientific Review Group, whichhas the responsibility of monitoring U.S. marine mammal management policies and research inthe Pacific Ocean. In addition, Dr. Scott participated in joint research on Atlantic bottlenosedolphins with scientists from the U.S. National Marine Fisheries Service, the University ofNorth Carolina at Wilmington, and the Woods Hole Oceanographic Institution. Dr. NaozumiMiyabe of the National Research Institute of Far Seas Fisheries, Shimizu, Japan, and Mr. KurtM. Schaefer of the IATTC were involved in collaborative research on the reproductive biology ofbigeye tuna in the eastern Pacific Ocean. Drs. Felipe Galván-Magaña of CICIMAR and RobertJ. Olson of the IATTC continued their joint study of the trophic interactions of yellowfin tuna,dolphins, and associated predators in the eastern Pacific Ocean described on pages 27-28 of theIATTC Annual Report for 1995. Dr. Olson was a co-convener, with Dr. James F. Kitchell of theUniversity of Wisconsin, of the Working Group on Ecological Implications of Alternative FishingStrategies for Apex Predators, sponsored by the National Center for Ecological Analysis andSynthesis (NCEAS), which is funded by the U.S. National Science Foundation and the state ofCalifornia. The grant provided by the NCEAS is funding a series of workshops to develop andevaluate a food web model for the tropical pelagic eastern Pacific Ocean. Dr. George M. Watterswas also a member of the Working Group. Dr. Cleridy E. Lennert-Cody worked with Dr. StephenT. Buckland, a former employee of the IATTC and at that time a member of the faculty of theUniversity of St. Andrews in Scotland, and Ms. Fernanda F. C. Marques, a graduate student atthat university, on revision of the IATTC’s current methodology for estimating the relativeabundances of dolphin species and stocks in the EPO. During 1999 and 2000 personnel of theMonterey Bay Aquarium, who were catching bluefin tuna off Baja California for various scien-tific studies, placed IATTC dart tags on the fish that were too small for their purposes andreleased them. The tags attached to the fish that were recaptured were returned to the IATTCstaff, and the information on these was entered into the IATTC’s tagging data base.
ANNUAL REPORT 2000 11

Since 1977 the IATTC staff has been training observers for placement aboard tuna vessels tocollect data on abundance, mortality, and other aspects of the biology of dolphins. In addition,these observers have collected stomach contents and samples of gonads and other tissues oftunas, recorded data on the incidental catches of species other than tunas and dolphins,recorded information on floating objects and the fauna and flora associated with them, etc.Government organizations, educational institutions, and industry representatives from the var-ious countries involved have cooperated fully in the training and placement of these observers.Mexico started its own observer program in 1991, and Ecuador and Venezuela started their ownobserver programs in 2000. Messrs. Ernesto Altamirano Nieto and Marlon H. Román Verdesotoassisted in the training of the Ecuadorian observers, and Mr. Nickolas W. Vogel worked withstaff members of the Venezuelan program on the incorporation of data entry and editing pro-grams and the establishment of data bases similar to those used by the IATTC staff, and he wasto do the same thing with staff members of the Ecuadorian program in early 2001. This makesefficient exchange of data between programs possible.
Over the years, scientists and students from many countries have spent several weeks ormonths at the IATTC’s headquarters in La Jolla and at its Achotines Laboratory learning newresearch methods and conducting research utilizing IATTC facilities and data. The visitorswhose stays amounted to 2 weeks or more are listed in Appendix 1. Also, IATTC scientists haveoften rendered assistance with research on fisheries for tunas and other species to scientists ofvarious countries while on duty travel to those countries, and occasionally have traveled to var-ious locations for the specific purpose of teaching or assisting with research programs.
The establishment by the IATTC of a research facility at Achotines Bay, Panama, gavethe staff the opportunity to work more closely with Panamanian fisheries personnel. IATTCpersonnel have assisted local scientists in the implementation of research projects on speciesother than tunas, e.g. corvina-like fishes (Sciaenidae) and snappers (Lutjanidae), discussed inthe subsection entitled Spawning and rearing of corvinas and spotted rose snappers.
Late in 1993 an agreement was reached by the Overseas Fishery Cooperation Foundation(OFCF) of Japan, the government of the Republic of Panama, and the IATTC to undertake ajoint five-year project, funded mostly by the OFCF, at the Achotines Laboratory. The project,which entered its initial stage in 1994, encompasses research on the feasibility of culturingadult yellowfin tuna, corvina-like fishes, and snappers to supply larvae for research, and theproduction of food organisms for their larvae and juveniles. This project is described in the sec-tion entitled EARLY LIFE HISTORY STUDIES. In November 1999 it was recommended thatthe project be extended by an additional year, through March 2001.
Over the years, IATTC employees have collected tissue samples and hard parts of tunasand billfishes for use in genetic studies conducted by scientists of other organizations. During2000 samples of otoliths of bluefin tuna were collected for the Department of Marine Biology,Texas A. and M. University, Galveston, Texas, USA.
IATTC staff members are also active in professional societies. During 2000 Dr. Martín A.Hall was a member of the Board of Directors of the National Fisheries Conservation Center, Dr.Michael G. Hinton was Director of the Southern California District of the American Institute ofFishery Research Biologists, and Dr. Daniel Margulies served as the Western Regional Repre-sentative of the Early Life History Section of the American Fisheries Society.
DATA COLLECTIONThe IATTC staff is concerned principally with the eastern Pacific Ocean (EPO; Figure 1),
currently defined as the area bounded by the coastline of North, Central, and South America,
12 TUNA COMMISSION

40°N, 150°W, and 40°S.During 2000 the IATTC had scientists and technicians in La Jolla and at its field offices
in Las Playas and Manta, Ecuador; Ensenada and Mazatlán, Mexico; Panama, Republic of Pa-nama; Mayaguez, Puerto Rico, USA; and Cumaná, Venezuela. IATTC personnel collect land-ings data, abstract the logbooks of tuna vessels to obtain catch and effort data, measure fish andcollect other biological data, and assist with the training, placement, and debriefing of observersaboard vessels participating in the International Dolphin Conservation Program (IDCP). Thiswork is carried out not only in the above-named ports, but also in other ports in California, Co-lombia, Costa Rica, Ecuador, Mexico, Panama, Peru, Puerto Rico, and Venezuela, which are vis-ited regularly by IATTC employees. During 2000 IATTC personnel abstracted the logbookinformation for 1,486 trips of commercial fishing vessels, sampled the contents of 845 wells ofcommercial fishing vessels (often obtaining length-frequency data for more than one speciesfrom the fish in the well), and sampled 58 landings of bluefin caught by sport-fishing vessels.Also, the staffs of the field offices placed IATTC observers on 562 fishing trips by vessels par-ticipating in the IDCP, and debriefed the observers after each of the 552 trips completed duringthe year.
THE FISHERY FOR TUNAS AND TUNA-LIKE FISHES IN THE EASTERN PACIFICOCEAN
The fleet
The IATTC staff maintains detailed records of gear, flag, and fish-carrying capacity formost of the vessels that fish at the surface for yellowfin (Thunnus albacares), skipjack (Katsu-wonus pelamis), bigeye (Thunnus obesus), or Pacific bluefin (T. orientalis) tuna in the easternPacific Ocean (EPO; Figure 1). Detailed records are not maintained for most longline vessels,nor for sport-fishing vessels and small craft such as canoes and launches. However, catch datafor most of the larger longline vessels, and for U.S.-flag sport-fishing vessels and some other ves-sels, are obtained from various sources and entered into the IATTC’s data bases. The fleetdescribed here includes purse seiners and baitboats that have fished all or part of the year inthe EPO for yellowfin, skipjack, bigeye, or bluefin tuna.
The owner’s or builder’s estimates of vessel carrying capacities are used until landing re-cords indicate that revision of these is appropriate. The vessels are grouped, by carrying capac-ity, into the following size classes for reporting purposes: class 1, less than 46 metric tons (mt);class 2, 46-91 mt; class 3, 92-181 mt; class 4, 182-272 mt; class 5, 273-363 mt; and class 6, morethan 363 mt.
Until about 1960 fishing for tunas in the EPO was dominated by baitboats operating inthe more coastal regions and in the vicinity of offshore islands. During the late 1950s and early1960s most of the larger baitboats were converted to purse seiners, and by 1961 the EPO sur-face fleet was dominated by these vessels. During the 1961-2000 period the number of baitboatsdecreased from 93 to 11, and their total capacity from about 11 to 1 thousand cubic meters (m3).During the same period the number of purse seiners increased from 125 to 205, and their capac-ity from about 32 to 176 thousand m3. The peak in numbers and capacity of purse seiners oc-curred from the mid-1970s to the early 1980s, when the maximum number of vessels, 282, andthe maximum capacity, about 196 thousand m3, were reached (Table 1).
The construction of new purse seiners, which began during the mid-1960s, resulted in anincrease in the total surface fleet capacity from about 49 thousand m3 in 1966 to about 195 thou-sand m3 in 1976. During the 1977-1981 period the fleet capacity remained fairly stable. During
ANNUAL REPORT 2000 13

this period the construction of new vessels continued, but the new capacity was offset by lossesdue to sinkings and vessels leaving the fishery. A major El Niño event began in mid-1982 andpersisted until late 1983. The catch rates in the EPO were low during the 1978-1981 period dueto concentration of fishing effort on small fish, and the situation was exacerbated by the El Niñoepisode, which made the fish less vulnerable to capture. In 1982 the fleet capacity declined byabout 19 thousand m3 as vessels were deactivated or left the EPO to fish in other areas, pri-marily the western Pacific Ocean. This trend continued through 1983 as the catch rates in theEPO declined further, and the fleet capacity declined by about 56 thousand m3 during 1983 and1984. The fleet capacity in 1984, about 125 thousand m3, was the lowest it had been since 1971.In 1985, however, due primarily to the return of vessels from the western Pacific, the capacityincreased to about 140 thousand m3, but in 1986 it decreased slightly to about 134 thousand m3.During 1987 several new vessels were added to the fleet, and others returned to the EPO fisheryfrom the western Pacific, causing the fleet capacity to increase to about 155 thousand m3. Thistrend continued in 1988, resulting in a fleet capacity of about 160 thousand m3. This was thegreatest fleet capacity since 1982. In the spring of 1990 the U.S. tuna-canning industry adopteda policy of not purchasing tunas caught during trips during which sets on tunas associated withdolphins were made. This caused many of the U.S.-flag vessels fishing in the EPO to leave thatfishery and enter the fisheries of the Atlantic or western Pacific, with a consequent reduction inthe EPO fleet to about 119 thousand m3 in 1992. With increases in participation of non-U.S.-flag vessels in the fishery, the capacity has increased steadily since 1992, and the 2000 capacitywas about 177 thousand m3.
The 1999 and preliminary 2000 data for numbers and carrying capacities of purse seinersand baitboats that fished for tunas in the EPO are shown in Tables 2a and 2b. The EPO tunafleet was dominated by vessels operating under the Mexican and Ecuadorian flags during 2000.The Mexican fleet has been the largest fleet since 1987, with about 27 percent of the total capac-ity during 2000, while vessels registered in Ecuador, Venezuela, Vanuatu, and Spain comprised25, 15, 8, and 6 percent of the total capacity, respectively.
Class-6 purse seiners make up the majority of the total capacity of the fleet of vessels thatfish at the surface for tunas in the EPO. This group of vessels comprised 89 percent of the totalfishing capacity operating in the EPO during 2000.
The monthly average, minimum, and maximum capacities at sea (CAS), in thousands ofmetric tons, of vessels that fished at the surface for tunas in the EPO during 1990-1999, and the2000 values, are shown in Figure 2. The monthly values are averages of the CAS estimated atweekly intervals by the IATTC staff. The fishery for yellowfin was regulated after November 25,1998, and after October 14, 1999 (see the section entitled MEASURES FOR THE CONSER-VATION OF TUNAS), so the CAS values for December of 1998 and October, November, andDecember of 1999 are not comparable to the CAS values for those months of 1990-1997. Overall,the 2000 CAS values are greater than the 1990-1999 averages, although the percentage of thefleet capacity at sea, 57 percent, was the same. During the 1990-1999 period the average CASvalue was 66 thousand mt, but during 2000 it was 87 thousand mt.
The catches
Tunas
Estimates of the catches of tunas come from several sources, including logbooks kept bythe fishermen, data recorded by observers, and unloading data provided by the canneries. Theword “catch” in the text of this subsection, Figures 3-5, and Tables 4-6 and 8-9 refers to the re-
14 TUNA COMMISSION

tained catches, unless otherwise noted. The principal source of this information is unloadingdata. Some of the tunas caught are, for various reasons, discarded at sea. Data on fish dis-carded at sea by Class-6 vessels have been collected by observers since 1993. Annual estimatesof the catches and discards of the various species of tunas landed by vessels of the EPO fleet thatfish for tunas with surface gear are shown in Table 3. Recreational catches landed in Californiaare included in the landings. In the case of bluefin, these landings have become an increasinglyimportant component of the catch in recent years.
The statistics for 2000 are compared to those for 1985-1999. There were no restrictionson fishing for tunas in the EPO during the 1980-1997 period. However, there were restrictionson fishing for yellowfin in the Commission’s Yellowfin Regulatory Area (CYRA) (Figure 1) fromNovember 26 through December 31, 1998, from October 14 through December 31, 1999, andfrom December 1 to 31, 2000. In addition, fishing for tunas associated with fish-aggregatingdevices (FADs) was prohibited in the EPO from November 9 through December 31, 1999, andfrom September 15 through December 15, 2000. Furthermore, regulations placed on purse-seine vessels directing their effort at tunas associated with dolphins have probably affected theway these vessels operate, especially during the late 1980s and the 1990s. As mentioned in theprevious subsection, there was a major El Niño event during 1982-1983, which made the fishless vulnerable to capture and reduced the numbers of vessels in the EPO. The fishing effort re-mained relatively low during 1984-1986. During the 1997-1998 period another major El Niñoevent occurred in the EPO, and the effects of this on the vulnerability of the fish to capture arecurrently being studied.
The average annual catch of yellowfin by surface gear in the CYRA during the 1985-1999period was 226 thousand mt (range: 192 to 264 thousand mt). The preliminary estimate of the2000 yellowfin catch in the CYRA is 220 thousand mt. During the 1985-1999 period the annualyellowfin catch by surface gear in the area between the CYRA boundary and 150°W averaged29 thousand mt (range: 19 to 44 thousand mt). The preliminary estimate of the 2000 yellowfincatch from that area is 51 thousand mt. The estimated 2000 yellowfin catch from the EPO, 272thousand mt, was less than the 1999 estimated catch, but greater than that of any of the otherprevious years and about 6 percent greater than the 1985-1999 average of 256 thousand mt(Table 4). The average amount of yellowfin discarded at sea during the 1993-2000 period was5.7 thousand mt.
During the 1985-1999 period the annual catch of skipjack in the EPO averaged 104 thou-sand mt (range: 49 to 268 thousand mt). The preliminary estimate of the 2000 skipjack catchin the EPO, 210 thousand mt, is less than that of 1999, but nearly twice the average of theannual catches for the last 15 years. The average estimated amount of skipjack discarded at seaduring the 1993-2000 period was 21.3 thousand mt.
Prior to 1994 the average catch of bigeye in the EPO by surface gear was about 5 thou-sand mt (range: <1 to 15 thousand mt). Since 1993 the catch increased from 29 thousand mt in1994 to 41 thousand mt in 1999. The preliminary estimate of the 2000 bigeye catch in the EPOis 70 thousand mt. These increasing catches of bigeye resulted from the discovery, made duringthe early 1990s, that tunas, principally skipjack, associated with floating objects, but well belowthe surface, can be detected with sonar and caught with purse seines. Many of these floatingobjects are FADs placed in the water by the fishermen. The average amount of bigeye discardedat sea during the 1993-2000 period was 3.9 thousand mt.
While yellowfin, skipjack, and bigeye comprise the most significant portion of the catchmade by vessels fishing for tunas at the surface in the EPO, Pacific bluefin, albacore (Thunnusalalunga), black skipjack (Euthynnus lineatus), bonito (Sarda orientalis), and other species con-
ANNUAL REPORT 2000 15

tribute to the overall harvest in this area. The total catch of these other species in the EPO wasjust over 5 thousand mt in both 1999 and 2000, well below the 1984-1998 average of 9 thousandmt (range: 3 to 17 thousand mt). The estimated discarded catches of these species for the 1993to 2000 period are presented in Table 3. Estimates of the discards of other species, in numbersof individuals, can be found in Tables 40 and 41 of the IATTC Annual Report for 1998.
The 1999 catches in the EPO, by flag, and the landings of tunas caught by surface gearin the EPO, by country, are given in Table 4a, and preliminary estimates of the 2000 catchesand landings are given in Table 4b. The estimated catch of all species in the EPO during 2000was about 557 thousand mt, which is less than the 1999 estimate of 611 thousand mt, but muchgreater than the previous record total catch of 475 thousand mt, taken in 1997. Ecuadorian-,Mexican-, and Venezuelan-flag vessels harvested 32, 22, and 14 percent, respectively, of the to-tal EPO catch. The landings are fish unloaded during a calendar year, regardless of the year ofcatch. The country of landing is that in which the fish were unloaded from the fishing vessel or,in the case of transshipments, the country that received the transshipped fish. Preliminarylandings data (Table 4b) indicate that, of the 547 thousand mt of tunas landed in 2000, 218 thou-sand mt (40 percent) was landed in Ecuador. The landings in Mexico (116 thousand mt; 21 per-cent) and Colombia (60 thousand mt; 11 percent) were next in terms of magnitude. Othercountries with significant landings of tunas caught in the EPO included Venezuela (6 percent),Spain (5 percent), Costa Rica (4 percent), and the United States (3 percent). It is important tonote that when final information is available, the landings currently assigned to various coun-tries may change due to exports from storage facilities to processors in other nations.
Tunas are caught by surface gear in three types of schools, those in which the fish are as-sociated with dolphins, those in which the fish are associated with floating objects, such as flot-sam or FADs, and those in which the fish are associated only with other fish (unassociatedschools). Estimates of the numbers of purse-seine sets of each type in the EPO during the 1987-2000 period, and the catches of these sets, are listed in Table 5. The estimates for Class-1 to -5vessels were calculated from logbook data in the IATTC statistical data base, and those forClass-6 vessels were calculated from logbook data and from the observer data bases of theIATTC, the Programa Nacional de Aprovechamiento del Atún y de Protección de Delfines(PNAAPD) of Mexico, the Programa Nacional de Observadores de Venezuela (PNOV), the Pro-grama de Observadores Pesqueros de Ecuador (PROBECUADOR), and the U.S. National Ma-rine Fisheries Service. The greatest numbers of sets on schools associated with floating objectsand on unassociated schools of tuna were made during the period from the mid-1970s to theearly 1980s. Despite opposition to fishing for tunas associated with dolphins and the refusal ofU.S. canners to accept tunas caught during trips during which sets were made on dolphin-asso-ciated fish, the numbers of sets made on fish associated with dolphins decreased only mod-erately during the mid-1990s, and in 1998 were the greatest since 1990.
There are two types of floating objects, flotsam and FADs. The occurrence of the formeris fortuitous, whereas the latter are constructed by fishermen specifically for the purpose ofattracting fish. FADs have been in use for only a few years, but their importance has increasedduring that period while that of flotsam has decreased, as shown by the data on numbers andpercentages of the sets made on floating objects by Class-6 vessels with IATTC observersaboard.
16 TUNA COMMISSION

Flotsam FADs Unknown TotalNumber Percent Number Percent Number Percent1992 945 63.3 521 34.9 26 1.7 1,4921993 1,118 57.7 811 41.8 9 0.5 1,9381994 709 27.6 1,830 71.3 28 1.1 2,5671995 579 17.8 2,647 81.6 19 0.6 3,2451996 520 12.9 3,523 87.1 0 0.0 4,0431997 718 12.8 4,859 86.9 16 0.3 5,5931998 663 12.5 4,588 86.6 46 0.9 5,2971999 778 17.3 3,719 82.5 10 0.2 4,5072000 378 10.3 3,285 89.3 16 0.4 3,679
The average annual distributions of the logged catches of yellowfin and skipjack by purseseiners in the EPO during the 1985-1999 period are shown in Figures 3a, 3c, 3e, 4a, and 4c andpreliminary estimates for 2000 are shown in Figures 3b, 3d, 3f, 4b, and 4d. During 2000 thecatches of yellowfin were relatively greater north of about 5°N and west of about 85°W. Thoseof skipjack were relatively greater offshore between 5°S and 5°N between about 80°W and125°W, and relatively less in waters off Baja California and off Central America and northernSouth America.
Bigeye are not often caught by surface gear north of about 7°N. The catches of bigeye bypurse seiners during the 1994-1999 period were made in two principal areas, (1) between about6°N and 16°S from about 93°W to 140°W, and (2) between about 3°N and 3°S from about 82°Wto 88°W (Figure 5a). A preliminary estimate of these catches in 2000 shows that the most ofthem were made between about 16°S and 6°N from the coast of South America to about 140°W(Figure 5b). With the development of the fishery for tunas associated with floating objects, de-scribed above, the relative importance of the nearshore areas has decreased, while that of theoffshore areas has increased.
Billfishes
Swordfish (Xiphias gladius) are fished in the EPO with longline gear and gillnets, andoccasionally with recreational gear. Most of those caught with commercial gear are retained.Marlins (Makaira nigricans, M. indica, and Tetrapturus audax), shortbill spearfish (T. angusti-rostris), and sailfish (Istiophorus platypterus) are fished with longline and recreational gear, andthey comprise a small part of the bycatches of purse-seine vessels. Most of the longline-caughtmarlins, spearfish, and sailfish are retained, and most of those caught with commercial surfacegear are discarded at sea. Information on the commercial catches and bycatches of billfishes inthe EPO is given in Table 7.
____________________
Under the terms of the convention that established the IATTC, the primary objective ofthe IATTC staff ’s research is monitoring the condition of the stocks of tunas and other speciestaken in the EPO by tuna fisheries. Taking into consideration the extensive movements of thetunas, the mobility of the vessels of the tuna fleets of various nations, and the internationalnature of the tuna trade, statistics on the catch and effort from the EPO must be viewed in thelight of global statistics. Statistics of the global catches of tunas during 1991-1999, by oceans,appear in Tables 8 and 9.
ANNUAL REPORT 2000 17

Discards and bycatches in the purse-seine fishery for tunas
IATTC observers began to collect information on discards and bycatches during purse-seine fishing operations in late 1992, and this program continued through 2000. In this subsec-tion “catches” refers to fish that are retained aboard the fishing vessel, “discards” tocommercially-important tunas (yellowfin, skipjack, bigeye, bluefin, and albacore) that are dis-carded dead at sea, “bycatches” to fish or other animals, other than commercially-importanttunas, that are discarded dead at sea, and “total catches” to the sums of the first three cate-gories. During 2000 the data collected during previous years were reviewed and revised whenappropriate. Information on the coverage of sets on tunas associated with dolphins and withfloating objects and on unassociated tunas is given in Table 10. Column 3 of this table lists thenumbers of sets in the IATTC data base for which bycatch and discard data were recorded andColumn 4 the numbers of sets in the IATTC Tuna-Dolphin data base, plus equivalent data col-lected by the Programa Nacional de Aprovechamiento del Atún y Protección de Delfines(PNAAPD) of Mexico, the Programa Nacional de Observadores de Venezuela (PNOV), and thePrograma Nacional de Observadores de Ecuador (PROBECUADOR). (The numbers of sets for1998-2000 in Column 4 of this table match those for Class-6 vessels in Table 5 because therewere no observers on smaller vessels during those years. There were observers on some Class-5 vessels during 1995-1997, so the values for those years in Table 10 are greater than the cor-responding values in the Class-6 columns of Table 5.) The coverage of vessels with observers isincomplete, but adequate for most statistical purposes.
The discards and bycatches on trips of vessels with observers aboard were estimated by
DISCARDS = (discard/set) x SETSand
BYCATCHES = (bycatch/set) x SETS
where DISCARDS and BYCATCHES = discards and bycatches for all trips with observersaboard, discard/set and bycatch/set = discards and bycatches per set for all sets for which IATTCobservers collected discard and bycatch data, and SETS = all sets for trips with observers aboard(Table 10, Column 4). These estimates are less than they would be if data for smaller vessels,which fish almost entirely on unassociated schools and floating objects, were included.
Discards and bycatches of tunas
Estimates of the discards of commercially-important tunas and the bycatches of blackskipjack tuna, bullet tuna, and bonito by vessels with observers are shown in Table 11a. Dis-cards are always wasteful, as they reduce the recruitment of catchable-size fish to the fisheryand/or the yield per recruit. Catching small yellowfin and bigeye, even if they are retained, re-duces the yields per recruit of these species.
Bycatches of other species
Estimates of the bycatches of animals other than commercially-important tunas areshown in Tables 11b and 11c. The bycatches of nearly all species except dolphins are greatestin sets on floating objects, intermediate in sets on free-swimming schools, and least in sets ondolphins. Billfishes, mahi mahi (Coryphaena spp.), wahoo (Acanthocybium solandri), rainbowrunners (Elagatis bipinnulata), yellowtail (Seriola lalandi), and some species of sharks and raysare the objects of commercial and recreational fisheries in the EPO. The sea turtles caught by
18 TUNA COMMISSION

purse-seine vessels include olive ridley (Lepidochelys olivacea), green (Chelonia mydas),leatherback (Dermochelys coriacea), hawksbill (Eretmochelys imbricata), and loggerhead(Caretta caretta) turtles, all of which are considered to be endangered. (Most of these arereleased in viable condition; Table 11c includes only the turtles that were killed or had sus-tained injuries that were judged likely to lead to death.) The information available on thebiology of the species of fish listed in Table 11c is insufficient to determine the effects of theircapture by the purse-seine fishery.
SIZE COMPOSITIONS OF THE CATCHES OF TUNASLength-frequency samples are the basic source of data used for estimating the size and
age compositions of the various species of fish in the landings. This information is necessary toobtain age-structured estimates of the population for various purposes, including age-structuredpopulation modeling. The results of age-structured population modeling can be used to estimaterecruitment, which can be compared to spawning biomass and oceanographic conditions. Also,the estimates of mortality obtained from age-structured population modeling can be used, inconjunction with growth estimates, for yield-per-recruit modeling. The results of such studieshave been described in several IATTC Bulletins and in all of its Annual Reports since that for1954.
Length-frequency samples of yellowfin, skipjack, bigeye, Pacific bluefin, and occasionallyblack skipjack from purse-seine, baitboat, and recreational catches made in the eastern PacificOcean (EPO) are collected by IATTC personnel at ports of landing in Ecuador, Mexico, Panama,the USA (California and Puerto Rico), and Venezuela. The catches of yellowfin and skipjackwere first sampled in 1954, and sampling has continued to the present.
Beginning on January 1, 2000, the methods for sampling the catches of tunas werechanged. Previously, the fish in the wells of purse seiners and baitboats could be selected forsampling if (1) all the fish in the well were caught during the same calendar month and (2) allthe fish in the well were caught in the same sampling area (formerly known as market-mea-surement area) (IATTC Annual Report for 1999: Figure 6). A third criterion has now beenadopted; all the fish in the well must have been caught in the same type of set (floating-object,unassociated school, or dolphin). In addition, a species composition sample is taken from eachwell selected for sampling. For each selected well, 30 to 50 randomly-selected fish of eachspecies are measured, and an additional 100 to 400 randomly-selected fish are identified tospecies and counted. The species composition and length data are used to estimate the totalcatches and size compositions of each species taken by purse seiners and baitboats in the EPO.
In accordance with the sampling changes, the length-frequency data for the current yearwill henceforth be presented differently. Previously, the length-frequency histograms showeddata by species and area. Currently, the length-frequency data are categorized by fishery(Figure 6), based on the staff ’s most recent stock assessments. These fisheries are defined byspecies (yellowfin, skipjack, bigeye, or bluefin), gear type (purse seine or baitboat), purse-seineset type (floating object, unassociated school, or dolphin), and area (combinations of samplingareas 1-13). Samples from 845 wells were taken, as described above, during 2000.
In this report, two length-frequency histograms are presented for each species. The firstshows the data by stratum (gear type, set type, and area) for 2000 and the second, which is simi-lar to those of previous years, shows the catch for the current year and the previous five years.
There are ten yellowfin surface fisheries defined for stock assessments: four floating-object, two unassociated school, three dolphin, and one baitboat (Figure 6). Of the 845 wellssampled, 600 contained yellowfin. The estimated size compositions of the fish caught during
ANNUAL REPORT 2000 19

2000 are shown in Figure 7a. The majority of the yellowfin catch was taken in unassociatedschool sets and by dolphin sets. The average weight of the fish caught in association with dol-phins was more than twice that of those caught in association with floating objects or in unas-sociated school sets.
The estimated size compositions of the yellowfin caught by all fisheries combined during1995-2000 are shown in Figure 7b. Generally, yellowfin caught in the fishery range from about40 to 160 cm in length, but the size distributions differed among years. The average weight ofthe yellowfin caught during 2000 was slightly greater than those of the fish caught during pre-vious four years.
There are eight skipjack fisheries defined for stock assessments: four floating-object, twounassociated school, one dolphin, and one baitboat. The last two fisheries include all 13 sam-pling areas. Of the 845 wells sampled, 455 contained skipjack. The estimated size compositionsof the fish caught during 2000 are shown in Figure 8a. The majority of the fish was taken byunassociated school sets in the Southern area and in floating-object sets in the Galapagos area.On average, the largest skipjack were caught in those two areas. Negligible amounts of skip-jack were caught by baitboats and in dolphin sets.
The estimated size compositions of the skipjack caught by all fisheries combined during1995-2000 are shown in Figure 8b. The average weight of the fish caught during 2000 wasgreater than those of the fish caught during any of the previous years.
There are seven bigeye surface fisheries defined for stock assessments: four floating-object, one unassociated school, one dolphin, and one baitboat. The last three fisheries includeall 13 sampling areas. Of the 845 wells sampled, 154 contained bigeye. The estimated size com-positions of the fish caught during 2000 are shown in Figure 9a. The majority of the bigeye wascaught in sets made on floating objects in the Galapagos area. A small amount of bigeye wascaught in unassociated school sets. There were no recorded catches of bigeye in dolphin sets orby baitboats.
The estimated size compositions of the bigeye caught by all fisheries combined during1995-2000 are shown in Figure 9b. The average weight of the fish caught during 2000 was con-siderably greater than those of the fish caught during any of the previous years.
Pacific bluefin are caught by surface gear by both commercial and sport-fishing vessels offCalifornia and Baja California from about 23°N to 35°N, with most of the catch being takenduring May through October. During 2000 bluefin were caught between 27°N and 37°N, andmost of the catch was taken during June, July, and August. Bluefin are normally sampled fromboth commercial and recreational catches, and previously these data were combined prior toanalysis. In this report, however, they are presented separately. Histograms showing the es-timated commercial and recreational catches of bluefin during each year of the 1995-2000 periodappear in Figures 10a and 10b, respectively.
The numbers of samples of bluefin obtained from the commercial and recreational catchesduring recent years were as follows:
20 TUNA COMMISSION

Year Commercial Recreational1990 14 01991 4 01992 1 11993 4 351994 2 111995 6 161996 67 51997 17 91998 23 221999 51 122000 20 58
The greatest number of samples from the commercial fleet was taken in 1996, a year of unusu-ally high catches. The large numbers of samples taken from the commercial fleet during 1999and from the recreational fleet during 2000 were due to greater sampling effort, rather than togreater catches of fish.
Black skipjack are caught incidentally by fishermen who are directing their effort towardyellowfin, skipjack, and bigeye tuna. The demand for this species is low, so most of the catch isdiscarded at sea, but small amounts, mixed with the more desirable species, are sometimes re-tained. Because only four samples of black skipjack were taken from the 845 wells sampled dur-ing 2000, length-frequency histograms for this species are not presented in this report.
OBSERVER PROGRAMThe IATTC employs observers, who keep counts of dolphin mortalities during fishing
operations, and these data are used by the IATTC staff to make its annual estimates of dolphinmortality. The observers also record data on herds of dolphins sighted that may be used to makeestimates of the relative abundance of dolphins. Information recorded on the conditions coinci-dent with mortality of dolphins is used to study the causes of dolphin mortality, and the knowl-edge gained from those studies is shared with the fishermen through the IATTC’s educationalactivities, such as seminars for tuna boat captains and crew members and analyses of the per-formances of individual captains. In addition, since late 1992, the observers have recorded dataon fish and other animals discarded at sea.
Coverage
The design for placement of observers during 2000 called for 100-percent coverage offishing trips in the eastern Pacific Ocean (EPO) by all Class-6 purse seiners (carrying capacitygreater than 363 metric tons). Both Venezuela and Ecuador began their own national observerprograms during the year. Venezuela’s Programa Nacional de Observadores de Venezuela(PNOV) began the year sampling approximately 25 percent of trips by its fleet and increased itssampling toward a goal of 50 percent coverage by mid-year. Ecuador’s Programa Nacional deObservadores Pesqueros de Ecuador (PROBECUADOR) started sampling trips by its fleet inNovember, with the intention of increasing its coverage to 50 percent in 2001. Mexico’s nationalprogram (Programa Nacional de Aprovechamiento del Atún y Protección de Delfines (PNAAPD))continued to sample half of the trips by its fleet. The IATTC Tuna-Dolphin Program sampledthe remainder of the trips by the fleets of Ecuador, Mexico, and Venezuela, plus all trips by ves-sels of other fleets, except as noted below. The IATTC's international observer program and the
ANNUAL REPORT 2000 21

national observer programs of Ecuador, Mexico, and Venezuela are part of the On-BoardObserver Program of the Agreement on the International Dolphin Conservation Program(AIDCP).
During 2000 observers from the On-Board Observer Program departed on 689 fishingtrips. In addition, 33 vessels whose last trip of 1999 carried over into 2000 had observersaboard, bringing the total to 722 trips sampled in 2000 by the Program. The Program sampledvessels operating under the jurisdictions of Belize, Bolivia, Colombia, Ecuador, the EuropeanUnion, Guatemala, Honduras, Mexico, Nicaragua, Panama, the United States, Vanuatu, andVenezuela.
An IATTC observer departed on one additional fishing trip during 2000 on a Bolivian-flagvessel, but the trip was only partially sampled due to the vessel’s departure, after a mid-tripport visit, without the observer on board. That trip is not considered as an observed trip forsampling purposes. A Vanuatu-flag vessel did not have an observer on board during one entiretrip.
During 2000 there were 44 trips on vessels that, at the time of their departures, wereflying the flags of nations that were not parties to the AIDCP.
The sampling coverage of vessels of the international fleet by On-Board ObserverProgram is summarized in Table 12. The Program sampled 99.7 percent of all trips by Class-6vessels, and the IATTC program sampled over 82 percent of all trips by Class-6 vessels.
Observer training
There were no IATTC observer training courses during 2000.
Ecuadorian national observer program
Two IATTC staff members spent the period of September 18-October 5, 2000, inGuayaquil, Ecuador, where they participated in the training of personnel for the newEcuadorian observer program, described above.
At-sea reporting by observers
Article V.2 of the AIDCP calls for the establishment of per-stock per-year dolphin mor-tality limits. In order to monitor that mortality on a current basis, and also to better monitorthe cumulative catch of the principal tuna species in the EPO, the observers from the IATTCand the national observer programs complete an at-sea reporting form each week and send theinformation from their vessels to their respective offices by e-mail, fax, or radio.
RESEARCH
REPRODUCTIVE BIOLOGY OF BIGEYE TUNALittle is known about the size and age at sexual maturity, spawning distribution, and fe-
cundity of bigeye in the eastern Pacific Ocean (EPO). A 2-year program to sample gonads ofbigeye tuna, carried out by IATTC observers aboard purse-seine vessels fishing in the EPO, wasinitiated in January 2000. The National Research Institute of Far Seas Fisheries of Japan wasconcurrently sampling gonads of bigeye caught in the EPO by longline vessels. The objective ofthis collaborative project is to obtain a comprehensive understanding of the reproductive biologyof bigeye in the EPO, which is necessary for stock assessment.
As of the end of 2000, samples had been taken on nine purse-seine trips, producing 369
22 TUNA COMMISSION

females with ovarian tissues suitable for histological processing and examination. Those tissuesamples were to be processed at the Achotines Laboratory during early 2001, and microscopeslides of them would then be prepared by a company in San Diego. These slides would then beexamined to identify the stages of oogenesis, providing an accurate assessment of the reproduc-tive status of each fish. Ovaries would also be selected to use to estimate the fecundity of the fish.
TUNA TAGGING
Tropical tunas
The IATTC has conducted numerous tagging experiments, releasing large numbers oftagged skipjack and yellowfin in the eastern Pacific Ocean (EPO), mostly during the 1950s,1960s, and 1970s. A great deal of information about the movements, growth, and mortality ofthe fish has been obtained from these experiments.
Phase 1 of a proposed multi-year bigeye tuna-tagging project was conducted from March1 to May 29, 2000, on the chartered baitboat Her Grace. The primary objective was to establishwhether live-bait, pole-and-line fishing is a practical technique for tagging, using conventionalplastic dart tags, of large numbers of small bigeye (<100 cm) associated with fish-aggregatingdevices (FADs) in the EPO. The secondary objective was to tag bigeye with archival tags. (Anarchival tag is essentially a miniature computer, imbedded in epoxy resin, with a stalk about 30cm long extending from it. The main part of the tag is surgically implanted into the bodycavity of the fish, and the stalk, which collects ambient temperature and light data, protrudesfrom it. The tag has four data channels, pressure, which is indicative of depth, ambient tem-perature, body temperature, and light. The locations of the fish are estimated from the lightdata, adjusted for depth. These tags were set to record the data at 4-minute intervals. At thissampling rate the tag is capable of collecting and storing data for each parameter for approxi-mately 4 years, and will retain the data in its memory for up to 25 years.)
Pole-and-line and handline fishing techniques were used to catch tunas for tagging withconventional and archival tags. Unfortunately, small bigeye were not located in significantnumbers. The scarcity of small bigeye in the area of operation was confirmed by radio reportsfrom purse-seine vessels operating in the area and the size compositions of the fish landed bythose vessels.
Information, as of the end of 2000, on the recoveries of tagged tunas is as follows:
Species Tag type Released Returned Percent returnedBigeye conventional 101 17 16.8Bigeye archival 96 24 25.0Skipjack conventional 1,238 258 20.8Yellowfin conventional 71 7 9.9
All of the returns to date of recaptured bigeye are from fish caught by purse-seine vessels duringsets on FADs in the equatorial EPO, except for one fish with an archival tag caught by a long-line vessel. Nearly all of the returns to date of recaptured skipjack are from fish caught bypurse-seine vessels during sets on FADs in the equatorial EPO, the exceptions being 26 fishcaught in sets on unassociated schools and 1 fish caught by a gillnet vessel about 50 nauticalmiles (nm) west of Guayaquil, Ecuador. The high percentage of conventional tags returned thusfar from recaptured skipjack is partially attributable to a single purse-seine set on a FAD inwhich 148 tagged skipjack were recaptured; 126 of these had been tagged and released together,
ANNUAL REPORT 2000 23

18 days previously, about 47 nm from the recapture location.About 85 percent of the skipjack were at liberty less than 1 month, whereas only about
24 percent of the bigeye were at liberty less than 1 month, and about 16 percent of them wereat liberty for 6 to 10 months.
The linear displacements and days at liberty are positively correlated for both bigeye andskipjack. Although some bigeye and skipjack at liberty for more than 60 days had moved dis-tances in excess of several hundred nautical miles from the locations of release, about 95 per-cent of the locations of recapture have been within 1,000 nm of the locations of release.
The displacements of the bigeye tagged with conventional tags, inferred from the posi-tions of release and recapture, are plotted in Figure 11a. All of the returns were from fish recap-tured to the west of the location of release, except for one fish recaptured east of the GalapagosIslands.
The displacements of the skipjack tagged with conventional tags, inferred from the posi-tions of release and recapture, are plotted in Figure 11b. Most of the returns were from fish re-captured to the west and southwest of the location of release, although several fish wererecaptured to the east, including two relatively close to the coast of South America.
Criteria developed for filtering (accepting or rejecting) the daily location estimates fromarchival tags were based on the uncertainty associated with estimates of latitude for the daysof recapture of 18 bigeye that were at liberty for 30 or more days and the distances between loca-tion estimates for consecutive days. This filtering procedure resulted in retention of an averageof 53 percent of the daily location estimates. This procedure provided data sets of location esti-mates throughout the period of time at liberty for each fish, for which there is a high level ofconfidence, based on the expected accuracy and precision of the data. The accuracy of the loca-tion estimates for latitude and longitude has been evaluated by calculating the differencesbetween the known recapture positions for the 18 bigeye and the corresponding location esti-mates immediately preceding recapture. The mean differences for the latitude and longitudeare 2.0° and 0.5°, respectively.
Release and recapture locations, and filtered locations for the periods between releaseand recapture, derived from the archival tags recovered from 18 bigeye at liberty for 30 or moredays are shown in Figure 12. The minimum convex polygons indicating the areas of dispersalof the fish based on the release and recapture positions (1,031,816 km2) versus the archival tagdata (4,953,054 km2) illustrates one of the major advantages of utilizing archival tags forassessing the movements and potential mixing of the fish. (The other major advantage, ofcourse, is that archival tags provide information on the depths, body temperatures, and ambienttemperatures at frequent intervals between a fish’s release and recapture, whereas such dataare not provided by conventional tags.)
Exploratory data analyses were conducted on the complete time-depth data set for eachbigeye with an archival tag, one day at a time, to elucidate the behavioral patterns.Quantitative criteria were developed for discrimination and classification of behavioral types.The data for the 18 recaptured bigeye at liberty for 30 or more days, a total of 1,770 days, wereexamined. The depth and temperature records for bigeye carrying archival tags shortly afterrelease and shortly before recapture at FADs are shown in Figure 13. Data sets obtained fromrecovered archival tags carried by bigeye, for each of those periods, were statistically evaluatedto select criteria for discrimination and classification of FAD-associated behavior. The fishremained at depths of less than about 50 m for about 2.5 days after release at a FAD until theFAD was removed from the ocean (Figure 13A). The fish then exhibited erratic behaviorfor about 12 hours, and then settled into a pattern of normal behavior commonly exhibited by
24 TUNA COMMISSION

bigeye not associated with FADs. The behavior is considered to be normal when the fish occu-pies primarily the mixed layer during the night, descends below the thermocline to depthsbetween 200 to 300 meters at dawn, remains there throughout the day, except for vertical foraysinto the mixed layer, and then ascends to the mixed layer at dusk. In Figure 13B the fish beganto associate with a FAD about five days before recapture, at which time it changed from normalto FAD behavior, remaining primarily at depths of less than about 50 m, except for excursionsto depths of about 300 m for a few hours at about 6:00 p.m. for four consecutive days beforerecapture. The classification of the 1,770 days of behavioral data indicates that the behavior wasnormal on 58 percent of the days, abnormal on 23 percent of them, and FAD-associated on 19percent of them.
Bluefin tuna
By the end of 2000 the IATTC staff had received 12 returns from 57 bluefin tagged withIATTC tags off Baja California in July 1999 by personnel of the Monterey Bay Aquarium. Eightof the fish were recaptured off Baja California, four during 1999 and four during 2000. Theother four were recaptured by Japanese purse seiners in the western Pacific Ocean (WPO)during 2000, after 323 to 406 days at liberty. Previously no tagged fish that had traveled fromthe eastern Pacific Ocean (EPO) to the WPO had been at liberty for less than 681 days (IATTCBull., 20 (1): Table 9).
Personnel of the Monterey Bay Aquarium tagged nine more bluefin off Baja California inAugust 2000, again using IATTC tags.
A bluefin released with an archival tag in the WPO was recaptured in the EPO in 2000.The fish was released at 34°49'N-129°13'E on November 26, 1998, when it was 53.5 cm long. Itwas recaptured by the purse seiner Barbara H. at 35°26'N-121°32'W on September 24, 2000, atwhich time it was 92.5 cm long. Information on another bluefin with an archival tag that wasreleased in the WPO in 1996 and recaptured in the EPO in 1998 is given on page 40 of theIATTC Annual Report for 1998.
ECOLOGICAL STUDIESEvaluation of the impacts of fisheries on marine ecosystems is now recognized as an
important aspect of fisheries science. The staff of the IATTC has been developing a model toinvestigate the ecological implications of the different fishing strategies used to catch tunas inthe tropical eastern Pacific Ocean (EPO). The terms of reference for the IATTC Purse-SeineBycatch Working Group, established at the 58th meeting of the IATTC, provided the initialmotivation for the work. One of the objectives, as stated in the terms of reference, is “to definethe relationships among bycatch and target species with special reference to the sustainabilityof the catches of all such species.”
The top levels of the food web in the pelagic EPO include large tunas, dolphins, sharks,billfishes, and other species. The purse-seine fishery in the EPO is directed at yellowfin, bigeye,and skipjack tunas, but substantial catches of other upper-level predators and of juvenile tunasalso occur. Fishing directed at top-level predators can impart profound changes to the structureof food webs from the top down.
Marine pelagic food webs are structured jointly by top-down and bottom-up processes,and top-down responses to fishing cannot be adequately understood without considering the roleof bottom-up physical processes on ecosystem dynamics. The tropical EPO is strongly influ-enced by the El Niño-Southern Oscillation (ENSO). Several studies have documented a closeconnection between ENSO and primary production in the tropical EPO; the production rate and
ANNUAL REPORT 2000 25

phytoplankton biomass are often reduced during warm El Niño periods and increased duringcold La Niña periods. Previous studies of the Peruvian upwelling system (e.g. Nature, 319(6051): 279-285) have shown that ENSO’s effects can also extend to the distribution and abun-dance of animals at middle and high trophic levels.
The staff of the IATTC has developed a model of the pelagic ecosystem in the tropical EPOto explore how climate variation and fishing might affect the animals at the middle and uppertrophic levels. The ecosystem model has 36 components (IATTC Annual Report for 1999: Table15a). These include the principal exploited species (e.g. tunas), functional groups (e.g. sharksand flyingfishes), and sensitive species (e.g. sea turtles). Some taxa are further separated intoontogenetic categories (e.g. large and small marlins). In general, the model has finer taxonomicresolution at the upper trophic levels, but most of the system’s biomass is contained in themiddle and lower trophic levels. The model arena is considered to be the area circumscribed by20ºN, 20ºS, the coast of the Americas, and 150ºW. Fisheries landings and discards were esti-mated for five fishing “gears,” baitboats, longliners, and three types of purse-seine sets: on dol-phins, on floating-objects, and on unassociated schools. The model focuses on the pelagicregions; localized, coastal ecosystems are not adequately described by the model.
The ecosystem model was developed using Ecopath with Ecosim (EwE). The informationrequired to parameterize the model includes, for each component of the ecosystem, estimates ofdiet composition, biomass, production-to-biomass ratio (P/B), consumption-to-biomass ratio,ecotrophic efficiency, and various parameters that determine the rates at which animals growand reproduce. EwE provides a tool to explore hypothesized changes in fishery exploitation bymeans of dynamic simulations. The model for the EPO was tuned by fitting it to catches perunit of effort (CPUEs) of yellowfin and bigeye tunas taken by the fisheries. The fit was achievedby specifying historical time series of fishing effort and estimating the rates at which animalsbecome vulnerable or invulnerable to predation. In general, the CPUEs of yellowfin were wellfitted, but those of bigeye were not.
Physical forcing
To explore the effects of bottom-up forcing on the pelagic ecosystem in the tropical EPO,predetermined time series of producer biomasses were inputted into the model, and thedynamics of the remaining components of the ecosystem were simulated. The inputted trajec-tories of producer biomass were intended to be representative of ENSO-scale forcing. To createENSO-scale variations in producer biomass, an empirical model that relates sea-surface tem-perature (SST) anomalies to surface chlorophyll concentrations, an index of phytoplanktonbiomass, was constructed. This model was developed from NIÑO3 SST anomalies and three setsof shipboard and satellite phytoplankton-pigment data collected during recent warm and coldevents. (NIÑO3 SST is the monthly mean sea-surface temperature in the eastern equatorialPacific, 5ºN-5ºS, 150º-90ºW, obtained from the U.S. National Weather Service’s ClimatePrediction Center.) These anomalies and data suggest that, on average, log-pigment concen-tration (mg m-3) changes by about -0.047 per degree Celsius, equivalent to a change of about11 percent. The equation
Relative biomass of producers = 10(-0.047 x NIÑO3 anomaly)
was used to model how producer biomass might change as a function of NIÑO3 SST anomalies.Time series of SST anomalies were used to create trajectories of producer biomass for the sim-ulations. Two sets of simulations were conducted to examine various aspects of bottom-up phys-ical forcing.
26 TUNA COMMISSION

In the first set of simulations, single positive and negative pulses of producer biomasswere created, using single ±2ºC SST anomalies in the above equation. These anomalies werechosen because they span the dynamic range of most anomalies that are commonly observed inthe NIÑO3 time series. A pulse was specified to occur for one year, starting at year 5, during a50-year simulation.
In the second set of simulations, regular climate cycles (corresponding to regular ±2ºCSST anomalies) were specified to examine the effects of different ENSO patterns. ENSO-scalecycles with 2-, 4-, and 6-year periods were considered. This set of simulations was structuredso that the net change in producer biomass over a single warm-cold cycle was equal to zero (i.e.cold events always followed warm events).
The simulations of single pulses and regular, cyclic forcing were designed to providesimple illustrations of how bottom-up effects might manifest themselves in the pelagic EPO.Single, bottom-up pulses of producer biomass (in both the positive and negative directions), cor-responding to ±2ºC anomalies, affected the model ecosystem up to the top trophic level. Pulsescaused oscillatory dynamics in the relative biomasses of most ecosystem components, and theseoscillations lasted for years after the pulse. The pulse-induced variations in relative biomasswere greatest for animals at middle trophic levels (e.g. flyingfishes, Auxis spp., and smallmahimahi). This variation was typically greater than the input variation in producer biomass.After a pulse, the time of peak response lagged with increasing trophic level, except for themammals that were not predicted to react to changes in producer biomass. Pulses of producerbiomass had similar effects on ecosystem components that occupy approximately equivalenttrophic levels.
During regular, cyclic forcing from the bottom up, the behavior of the modeled ecosystemwas sensitive to the periodicity of warm and cold events. Changes in the period of warm-coldcycles had non-linear effects on both the mean levels and amounts of variability in the relativebiomasses of various ecosystem components. Decreasing the period of warm-cold cyclesincreased the relative biomasses of forage species (e.g. flyingfishes, Auxis spp., and smallmahimahi) and decreased the relative biomasses of components at higher trophic levels (e.g.large sharks, large marlins, and large yellowfin tuna). The model indicated that cyclic forcingmay induce greater biomass variation at middle trophic levels than the input variation in pro-ducer biomass for all forcing periods. The opposite was predicted for the top predators; their rel-ative biomasses varied less than that of the producers group. Compared to simulationsconducted with cycles that had periods longer than 6 years, cyclic forcing with periods of 2 to 4years had the greatest impact on the model ecosystem.
Despite the ecosystem’s predicted sensitivity to changes in the period of ENSO forcing,none of the cyclic-forcing experiments caused the ecosystem to become completely restructureddue to the extinction or explosion of any ecosystem component in the model.
In summary, this work demonstrated that applying realistic physical forcing to a modelof a complex ecosystem provided insight into the behavior of the ecosystem and the effects ofbottom-up processes on the middle and upper trophic levels. Frequent ENSO events were pre-dicted to increase the transfer efficiency of energy from the producers to animals occupyingmiddle trophic levels, with an opposite, but lesser, effect on the apex predators. Bottom-up pro-cesses appear to affect the entire food web. The productivity of the system’s components and thetemporal scales at which variability is transmitted up the food web appear to be important instructuring pelagic food webs.
ANNUAL REPORT 2000 27

Interactive effects of fishing and the environment
A third set of simulations was run to predict the relative contributions of fishing and theenvironment in shaping ecosystem structure in the tropical pelagic EPO. These simulationswere driven with historical NIÑO3 SST anomalies for 1950-1999 in the above equation. Threeseries of simulations were run for each gear type. In the first series, it was assumed that thefishing mortality rate acting on each component of the ecosystem would remain constant at alevel equal to the average fishing mortality that was estimated to act upon that componentduring 1993-1997 (hereafter called “average F ”). In the second series of simulations, it wasassumed that the fishing mortality rate acting on each component would gradually decreasefrom the average F to one-tenth of the average over the 50-year simulation (called “decreasingF ”). In the final series of simulations, it was assumed that the fishing mortality rate acting oneach component would gradually increase from the average F to 10 times the average over the50-year simulation (called “increasing F ”). For various components of the ecosystem, predictedbiomass trajectories under each fishing scenario were then analyzed with wavelets (Bull. Am.Met. Soc. 79 (1): 61-78). Wavelet analysis is a way to decouple the effects of the environmentalsignal from the long-term effects of fishing in the model predictions.
This set of simulations was designed to predict which components of the ecosystem mightbe susceptible to top-down effects of fishing, given the importance of environmental variabilityin structuring the ecosystem. The time-averaged wavelet spectra (for 1950-1999) of the biomasstrajectories predicted by the model under three fishing scenarios displayed two general features.First, the power spectra of many of the components at both top and middle trophic levels werecharacterized by significantly higher power at periods of about 2 to 12 years. This result indi-cates that these animals were sensitive to ENSO-scale forcing, as noted for the previous simu-lations. For some ecosystem components, however, this feature depended upon whether fishingwas maintained at average F or was changed. The predicted biomasses of some of the upper-level predators, such as large marlins, reacted to ENSO-scale periodicities only in the simula-tion in which fishing mortality was kept at average F. When the fishing mortality wassubstantially decreased or increased from the average for these components, the power spectrawere not significant at ENSO-scale periodicities. This result applied only to the ecosystem com-ponents with relatively low turnover rates (P/B < 2.0). These animals were predicted to be moresensitive to top-down influences of fishing than to bottom-up physical forces. This trend wassensitive to the type of fishing gear simulated; the effect was strongest for the gears that havethe greatest impact on the upper-level predators. The predicted biomass time series for theforage species, such as Auxis, also showed significantly high power at ENSO-scale periodicities,but, in contrast to the upper-level predators, this characterization did not change when fishingmortality was decreased or increased. This pattern was typical of spectra for ecosystem compo-nents with relatively high P/B ratios (≥ 2.0). Typically, the top-down effects of fishing did notreach the components at middle trophic levels, and the variation caused by ENSO dominatedthe response of the animals at these trophic levels.
The second feature identified in the global wavelet power spectra for some componentswas a steady increase in power with increasing period. This feature was associated with theupper-level predators under fishing scenarios with decreasing and increasing fishing mortality,and underscores the importance of the long-term trend caused by changes in fishing pressure,depending on the gear type.
28 TUNA COMMISSION

EARLY LIFE HISTORY STUDIESFor many years fisheries scientists have believed that the abundance of a population of
fish is determined principally during its early life history (egg, larval, and/or early-juvenile)stages. Although decades of research have provided considerable information on the popula-tions of adult tunas, relatively little is known about the early life history stages and the factorsthat affect their recruitment to the exploitable stocks. These considerations motivated theIATTC to establish a research facility at Achotines Bay in the Republic of Panama for the pur-pose of studying the early life histories of tunas.
Achotines Bay is located on the southern coast of the Azuero Peninsula in the Los Santosprovince of Panama (Figure 14). The continental shelf is quite narrow at this location; the 200-m depth contour occurs only 6 to 10 km (3 to 5 nm) from shore. This provides the scientistsworking at the Achotines Laboratory with ready access to oceanic waters where spawning oftunas occurs during every month of the year. The annual range of sea-surface temperature inthese waters is approximately 21° to 29°C. Seawater pumped from Achotines Bay is suitable formaintaining live tunas in the laboratory. The proximity of the research station to the study areaprovides a low-cost alternative to a large research vessel, and improves sampling flexibility.
The IATTC’s early life history research program involves laboratory and field studiesaimed at gaining insight into the recruitment process and the factors that affect it. Previous re-search on recruitment of fishes suggests that abiotic factors, such as temperature and salinity,and biological factors, such as feeding and predation, can affect recruitment. As the survival ofpre-recruit fishes is probably controlled by a combination of these factors, the research programaddresses the interaction between the biological system and the physical environment (IATTC,Data Report 9).
Joint OFCF-Panama-IATTC project
In December 1993 an agreement was reached by the Overseas Fishery CooperationFoundation (OFCF) of Japan, the government of the Republic of Panama, and the IATTC to un-dertake a joint 5-year project, funded mostly by the OFCF, at the Achotines Laboratory. In 1998the joint project was extended for an additional two years, and in 1999 it was agreed that itwould be funded through March 2001. The objectives of the project are: (1) to culture adult yel-lowfin tuna to supply larvae and juveniles for research on its early life history; (2) to producefood organisms for the larval and juvenile tunas; and (3) to culture broodstock snappers(Lutjanidae), corvina-like fishes (Sciaenidae), and food organisms for their larvae and juveniles.
Expansion of and improvements to the infrastructure of the Laboratory were necessary tocarry out the objectives of the project. Six in-ground, concrete tanks were built during the dura-tion of the project. The dimensions and capacities of the tanks are as follows:
Tank Diameter (meters) Depth (meters) Capacity (liters)1 17.0 6.0 1,361,9002 8.5 3.0 170,2003 8.5 1.5 85,1004 8.5 1.5 85,1005 8.5 1.5 85,1006 8.5 3.0 170,200
ANNUAL REPORT 2000 29

Yellowfin broodstock
Yellowfin in the size range of 2 to 7 kg were collected by hook and line in nearshore wa-ters adjacent to the Achotines Laboratory to establish a broodstock population in the laboratory.Standard procedures, developed during previous years, were used to transport, handle, tag,weigh, and measure the newly-captured yellowfin. Each fish was tagged with a microchip im-plant tag in the dorsal musculature and injected with oxytetracycline (OTC) to establish a tem-poral mark in the otoliths and vertebrae. The tag allows each fish to be identified throughoutits life in captivity, and injection with OTC facilitates studies of the growth of the fish. All fishwere immersed in dilute solutions of formalin and sodium nifurstyrenate (NFS), an antimicro-bial agent, for several hours to treat any skin infections caused by capture and handling.
Yellowfin were stocked in the large broodstock tank (Tank 1) and in the reserve brood-stock tank (Tank 2) during 1996 and maintained there from 1997 through 2000. The diet of theyellowfin broodstock in Tank 1 was monitored to ensure that it provided enough energy to fuelhigh growth rates and spawning, but did not cause excess fat deposition. The feeding behaviorof the fish and estimates of their biomass were used as guidelines for determining the dailyration schedules. The information on the proximate composition (protein, moisture, fat, andash) of the food organisms and the broodstock fish (obtained from fish which occasionally diedor were sacrificed) were used to adjust the feeding. The food organisms included squid (Loligospp. or Illex argentinus), anchovetas (Cetengraulis mysticetus), thread herring (Opisthonemaspp.), and big-scale anchovy (Anchovia macrolepidota), and the diet was supplemented withvitamin and bile powders. Several specimens of each food taxon were dried, homogenized, andanalyzed for proximate composition by a laboratory in Aguadulce, Panama. On average, theanchovetas contained about 64 percent more calories and the thread herring about 116 percentmore calories than the squid. By adjusting the quantities and proportions of squid and fish inthe diet, the amount of food was kept high enough to avoid frenzied feeding activity, while notgreatly exceeding the requirements for metabolism, growth, reproduction, and waste losses.The brood-stock in Tank 1 were fed at approximately 2.0 to 4.5 percent of their body weight perday during 2000.
During the year 19 younger fish were transferred to Tank 1 to restock the spawning popu-lation. They were identified by their tag numbers, measured, weighed, and injected with oxytet-racycline before being placed into the tank. Their lengths ranged from 58 to 71 cm and theirweights from 4 to 14 kg. At the time of their introduction into Tank 1 there were older fish re-maining from the groups of yellowfin stocked in the tank during 1996 and 1999. At the end ofthe year, there were 21 yellowfin in Tank 1. This group consisted of 1 fish from the initial groupstocked in the tank during 1996, 6 fish stocked in August 1999, and 14 fish stocked during 2000.Fourteen mortalities occurred during the year. The mortalities were due to starvation (1 fish),infection (1 fish), and wall strikes (12 fish). Growth models were fitted to the length and weightdata of the yellowfin at the time of placement into the tank and at the time the fish were sacri-ficed or died. Daily estimates of lengths and weights were calculated from the growth models.The estimated lengths and weights of the fish at the end of the year in Tank 1 were as follows:
Number Length range (cm) Weight range (kg)Large 1 153 59Medium 6 117-125 34-45Small 14 87-104 14-25
30 TUNA COMMISSION

At the end of the year the biomass in the broodstock tank was estimated to be 0.39 kg per cubicmeter, which is somewhat less than the original target stocking density of 0.50 kg per cubic me-ter for the broodstock population.
The yellowfin in Tanks 2 and 6 were held in reserve to augment the broodstock popula-tion in Tank 1, should that become necessary. During 2000 the collection of small yellowfin wascontinued in coastal waters near the Laboratory. The fish were used in an experiment that com-pared different types of food for broodstock fish (see Yellowfin diet comparison). Yellowfin inthe size range of 49 to 73 cm and 2.5 to 6.5 kg were collected by hook and line at sea and trans-ported to the Laboratory. Each fish was measured, weighed, injected with OTC, and taggedwith a microchip implant tag. Then, after a holding period, the fish were moved to Tanks 2 and6. They were fed a diet of squid and herring at approximately 5- to 8-percent body weight per day.
Yellowfin spawning
During 2000 the yellowfin in Tank 1 spawned daily during January and from Maythrough December. Spawning was intermittent during February and March, when offshore up-welling, induced by northerly winds of the dry season, brought cooler water temperatures nearshore and into the rearing tanks. During April spawning took place nearly every day. Thewater temperatures in the tank ranged from 22.2° to 28.8°C during the year, and spawningoccurred at temperatures of 23.5° to 28.8°C. Spawning occurred between 12:20 p.m. and 7:15p.m. The spawning events were usually preceded by courtship behavior (paired swimming and chasing).
The numbers of fertilized eggs collected after each spawning event in Tank 1 ranged fromabout 150 to 1,709,000. The eggs were collected by several methods, including siphoning anddipnetting at the surface and seining with a fine-mesh surface egg seine.
The following parameters were recorded for each spawning event: time of spawning, eggdiameter, duration of egg stage, hatching rate, lengths of hatched larvae, and duration of yolk-sac stage. The weights of the eggs, yolk-sac larvae, and first-feeding larvae and the lengths andselected morphometrics of the first-feeding larvae were periodically measured. These data areentered into a data base for analysis of spawning parameters and the physical or biological fac-tors that may influence spawning (e.g. water temperature, salinity, lunar cycle, average size ofthe spawning fish, and average daily ration of the spawning fish).
Yellowfin diet comparison
An experiment to compare the diets of yellowfin in captivity was initiated in November2000. Two diets, (1) 50-percent thread herring and 50-percent squid and (2) dry pellet feed, werecompared. Twenty-two yellowfin were randomly assigned to either Tank 2 (12 fish) or Tank 6(10 fish). The fish ranged in length from 55 to 83 cm and in weight from 4.5 to 13.4 kg. The fishin Tank 2 were fed the herring-squid diet at approximately 3.0-percent body weight per day.The fish in Tank 6 were fed dry pellet feed daily until they were satiated (approximately 1.0-percent body weight per day). The experiment was to be continued until early March 2001. Atthe end of the experiment, the fish would be measured, weighed, and sampled for proximatecomposition, and the survival of the two groups would be compared.
Laboratory studies of the growth and feeding of yellowfin larvae and juveniles
Several experiments designed to examine the effects of larval stocking density, microtur-bulence, light intensity, and prey density on feeding incidence, survival, and growth of yellowfinlarvae were conducted during 2000.
ANNUAL REPORT 2000 31

A 7-day experiment to determine the combined effects of microturbulence and larval den-sity on the survival, growth, and production of yellowfin larvae was completed. (The “produc-tion” for a tank is the total weight of fish in the tank at the end of the experiment, multipliedby the survival rate of the fish during the experiment.) The experiment was similar to other ex-periments conducted during 1998 and 1999. In the earlier experiments, microturbulence andlarval density effects were studied separately, and it was determined that (1) there was anoptimal range of turbulence for the survival of larval yellowfin, with the highest survival occur-ring at medium to semi-high levels of turbulence, and (2) yellowfin larvae exhibit pronounceddensity-dependent growth during the first week of feeding. In the current study, yellowfinlarvae were exposed to different combinations of turbulence and larval density to study theinteractive effects of these factors on the growth and survival of yellowfin larvae. The turbu-lence levels that were used in the current study were either low or medium, and the larval den-sities used were either low or high. All four combinations of these factors were used, and eachcombination was replicated, so eight tanks were used. Each of the tanks was 1.2 m in diameter,and nested within a 1.5-m diameter tank to control the ambient water temperatures within the1.2-m tanks. The turbulence in each tank was controlled by the level of aeration, and daily mea-surements of the water velocities were made in each tank with a micro acoustic Doppler currentmeter, which measures the water velocities in three dimensions simultaneously. The larvaewere initially fed enriched rotifers (300-2,000 per liter), and enriched brine shrimp nauplii (200-500 per liter) were introduced into the diet on the sixth day of feeding. The water temperaturesranged from 26.7° to 27.9°C during the experiment. Larvae from each tank were sampled every2 days, some to obtain length measurements and dry weights from fresh specimens and othersto preserve in formalin for use in examining the feeding parameters. The latter were to be mea-sured, their stomachs dissected, and the contents enumerated and measured. The number ofsurvivors in each tank after 7 days of feeding was calculated. The survival, growth, and pro-duction of the larvae were to be analyzed relative to the turbulence levels and larval densitiesin the tanks, and the results were to be compared to those of the turbulence and density exper-iments conducted during 1998 and 1999.
It has been assumed, from the results of a few published studies, that tuna larvae feedonly during daylight hours. To test this assumption, a 7-day experiment to examine the dielfeeding abilities of yellowfin larvae was conducted during July. The larvae were reared in a 1.2-m diameter tank nested within a 1.5-m diameter tank. The larvae were exposed to asimulated daily natural photoperiod, using fluorescent lighting. Stepped levels of light werepresented daily from 8:15 a.m. to 6:00 p.m., while no lighting was present from 6:00 p.m. to 8:15a.m. The larvae were initially fed enriched rotifers (300-2,000 per liter), and enriched brineshrimp nauplii (200-500 per liter) were introduced on the sixth day of feeding. The water tem-peratures in the tank ranged from 26.3° to 27.9°C during the experiment. Larvae were sampledover two 36-hour periods. The first and second samplings took place on Days 1 and 2 and onDays 6 and 7 of feeding, respectively. During each 36-hour sampling period, larvae were sam-pled from the tank at intervals of 1 to 4 hours. At each sampling interval, light measurementswere recorded within the tank. The samples were preserved in formalin, and were to be ana-lyzed to determine the incidence of feeding and the gastric evacuation rates under simulatednatural photoperiod conditions.
Several groups of yellowfin larvae were reared beyond juvenile metamorphosis. Thegreatest time that a yellowfin was reared during the year was 7 weeks after hatching. InOctober a diet comparison trial was conducted with two groups of early juveniles, ranging in agefrom 24 to 29 days after hatching (DAH) (16 to 24 mm SL), each in a 2.4-m diameter, 4,800-L
32 TUNA COMMISSION

capacity tank. The fish of one group were fed freeze-dried thread herring and squid, and thoseof the other were fed minced, previously-frozen thread herring and squid, supplemented with asmall amount of freeze-dried copepods. The experiment was conducted for 12 days. Samples of2 to 4 fish were taken from each tank at intervals of 4 or 5 days for measuring their growth. Thesurvival after 12 days of feeding was similar for the two groups, but the growth in weight of thegroup fed minced herring and squid was approximately twice that of the group fed the freeze-dried diet.
Mr. Masahiko Koiso, a staff scientist of the Japan Sea Farming Association, worked withthe OFCF counterpart, Mr. Yukiyasu Niwa, and staff members of the Achotines Laboratory ona rearing study of yellowfin larvae and juveniles. Over 100,000 early larvae were stocked in one3.7-m diameter, 12,000-L capacity tank. The larvae were reared in water with dense phyto-plankton blooms (green water), and were fed a sequential diet of cultured rotifers (5 to 10 perml) from 3 to 20 DAH, brine shrimp nauplii (500 per liter) from 14 to 22 DAH, and newly-hatched yellowfin larvae (10 per liter) from 14 to 26 DAH. At 29 DAH the survival in the tankwas about 2.5 percent, and the average length of the fish (then early juveniles) was 24.9 mm(average growth rate of 0.85 mm per day). Of the survivors at 29 DAH, 1,500 were transferredto a 8.5-m diameter, 85,100-L capacity tank, and 500 were placed in each of two 3.7 m-diameter,12,000-L capacity tanks. After transfer the fish were fed a diet of minced thread herring andminced squid. The juveniles fed well for the first week after transfer, but then the feeding ratedecreased and starvation mortality increased. The last of the juveniles in the 3.7-m tanks diedat 40 DAH and the final survivor in the 8.5-m tank died at 48 DAH. The length range of thejuveniles at the end of the culture trial was 30 to 37 mm (growth rate of ~0.7 to 1.3 mm per day)except for one exceptional individual that attained a length of 83 mm (~2.1 mm per day).
Genetic studies of captive yellowfin
The genetic studies at the Achotines Laboratory have been conducted mainly by Mr. Yu-kiyasu Niwa, the OFCF counterpart, working in collaboration with Dr. Naritashi Chow of theNational Research Institute of Far Seas Fisheries, Shimizu, Japan, and IATTC scientists. Ge-netic samples have been taken from broodstock yellowfin and their eggs and larvae to determinethe amount of genetic variation in the adults and their offspring. Any new broodstock fish thatare introduced to the captive population are sampled for genetic analysis. An analysis of geno-typic variation was conducted on samples that had been taken from broodstock, eggs, and larvaeduring December 1999 and January 2000. The analysis identified six genotypes common tobroodstock females, and to the eggs and larvae. These results suggest that during that periodsix females (out of 21 fish total) were participating in spawning. Genetic sampling of the brood-stock, eggs, and larvae would continue in 2001.
Spawning and rearing of corvinas and spotted rose snappers
The work on corvinas and polla drum has been carried out by Mr. Amado Cano of theAutoridad Marítima de Panamá, working in collaboration with Japanese scientists supported bythe OFCF and with the IATTC staff.
Polla drum (Umbrina xanti) and spotted rose snappers (Lutjanus guttatus) were collectedduring 1996 to establish broodstock populations in captivity.
During 1999 the last polla drum broodstock fish were released into Achotines Bay. Onegroup of juvenile polla drum that had hatched in captivity in July 1999 was maintained in a12,000-L tank during the year. These fish, which were about 24 cm long and weighed about 160g, on average, at the end of the year, were to be reared to the adult stage.
ANNUAL REPORT 2000 33

During 2000 efforts were continued to replace the polla drum with broodstock of a larger,more commercially-valuable, species of corvina. Individuals of two species, white corvina (Cy-noscion albus) and Stolzmann’s weakfish (C. stolzmani), were captured and stocked in a 85,100-L tank., and at the end of the year there were 10 fish in the tank. Additional broodstock of bothspecies were to be collected during 2001. The species that appeared to do best in captivity wouldbe used for spawning and rearing studies.
The spotted rose snapper broodstock began to spawn at the end of May and continued tospawn through November and intermittently in December. A group of 70 fish, hatched in cap-tivity in October 1998, was being held in two 12,000-L tanks. On average, these fish were about40 cm long and weighed about 800 g at the end of the year. These fish were being reared in anattempt to complete the life cycle of this species in captivity and to study the growth patternsand feeding requirements of the juveniles.
Pier inauguration
On February 14, 2000, a ceremony was held to inaugurate the recently-completed pierand boat ramp in Achotines Bay. Presentations were made by the President of Panama, Mrs.Mireya Moscoso Rodríguez, the Japanese Ambassador to Panama, Mr. Yasuyuki Hujishima, thePresident of the OFCF, Mr. Junji Kawai, and the IATTC Director, Dr. Robin Allen. Numerousother Panamanian governmental and research institutions were represented, and more than200 people were in attendance. Mr. Akio Nakazawa, the OFCF counterpart to the joint projectat the Achotines Laboratory, received a plaque from the Autoridad Marítima de Panamá inrecognition of his contributions to the project during the previous six and a half years.
OCEANOGRAPHY AND METEOROLOGYDuring the 46 years from 1955 to 2000 there have been 10 significant anti-El Niño events
in the eastern tropical Pacific (ETP), each of which developed within 1 to 3 years after the termi-nation of a moderate to strong El Niño episode. These events are characterized by stronger-than-normal easterly winds over the ETP, which cause marked increases in upwelling of cool,nutrient-rich subsurface water along the equator east of 160ºW, in the coastal areas of Ecuadorand Peru, and in offshore areas off Mexico and Central America. As a result, below-normal sea-surface temperatures (SSTs) and sea levels and shallower-than-normal thermoclines prevailover much of the ETP. In addition, the Southern Oscillation Indices (SOIs) are positive duringanti-El Niño episodes. (The SOI is the difference between the anomalies of sea-level atmo-spheric pressure at Tahiti, French Polynesia, and Darwin, Australia, and it is a measure of thestrength of easterly surface winds, especially in the tropical Pacific in the SouthernHemisphere.) Anti-El Niño episodes have not received as much publicity as their opposite, ElNiño episodes, which have usually been associated with unfavorable oceanic and weather con-ditions for fishing for surface-dwelling fish. Anti-El Niño episodes are important events, how-ever, because they contribute to maintaining food supplies, through upwelling, for pelagicorganisms, including those which are of direct commercial value. In addition, various species offish, including yellowfin and skipjack tuna, are more vulnerable to capture when the thermo-cline is closer to the surface and strong (rapid decrease in temperature with depth) during anti-El Niño episodes.
Anti-El Niño conditions prevailed in the ETP from May 1998 through the end of 1999, andcontinued during the first quarter of 2000. They were especially pronounced in the equatorialregion west of 100°W and off the coast of Ecuador, where the SSTs were more than 1°C belownormal (Figure 15a). The high positive SOI values (0.7 in January, 1.6 in February, and 1.0 in
34 TUNA COMMISSION

March) were consistent with anti-El Niño conditions. However, the strengths of the easterlywinds east of 100°W were below normal, and the SSTs east of 110°W from the equator to 10°Swere slightly above normal. During the second quarter it appeared that the anti-El Niñoepisode was coming to an end. The SSTs were near normal over most of the EPO (Figure 15b),and the SOI values decreased from 1.2 in April to 0.2 in May to -0.6 in June. During the thirdquarter the SSTs remained nearly normal in the ETP (Figure 15c), but the SOIs increased from-0.4 in July to 0.4 in August to 1.0 in September, which was not consistent with the weaker-than-normal easterly winds during the quarter. The increase was consistent, however, with theincrease in the strength of the surface winds in the central tropical Pacific, where weak anti-ElNiño conditions had set in. During October the easterly winds and SSTs were nearly normalover most of the ETP. During November and December, however, the strengths of the easterlywinds increased, especially in the central equatorial Pacific, which probably contributed to theincrease in size of the areas with SSTs more than 1.0°C below normal off the coasts of Ecuadorand Peru (Figure 15d). This was consistent with the SOIs, which were 1.0, 2.0, and 0.7 duringOctober, November, and December, respectively. The thermocline in the CYRA during thefourth quarter remained at depths of 40 to 60 m, which was about 10 m closer to the sea surfacethan normal, whereas in the central and western Pacific it was at depths of 160 to 200 m, whichwas about 10 to 20 m deeper than normal. These changes indicated that a weak anti-El Niñoepisode was developing in the ETP, and it appeared that this condition might persist until atleast mid-2001.
STOCK ASSESSMENT OF TUNAS AND BILLFISHESBackground Papers describing stock assessments of yellowfin, skipjack, bigeye, bluefin,
albacore, and swordfish conducted by the IATTC staff during 2000 were to be presented at the68th meeting of the IATTC in June 2001. These, plus a paper on sampling to estimate the sizecompositions of tunas caught by the surface fisheries of the EPO, were to be published as StockAssessment Report 2 of the IATTC in late 2001.
DOLPHINSYellowfin tuna in the size range of about 10 to 40 kg frequently associate with marine
mammals, especially spotted dolphins (Stenella attenuata), spinner dolphins (S. longirostris),and common dolphins (Delphinus delphis and, to a lesser extent, D. capensis) in the eastern Pa-cific Ocean (EPO). The spatial distributions of the various stocks of these four species are shownin Figure 16. (D. capensis probably occurs only within the range of the northern stock ofcommon dolphins.) Purse-seine fishermen have found that their catches of yellowfin in the EPOcan be maximized by searching for herds of dolphins or flocks of seabirds which frequently occurwith dolphins and tunas, setting their nets around the dolphins and tunas, retrieving most ofthe net, “backing down” to enable the dolphins to escape over the corkline of the net, andfinally retrieving the rest of the net and bringing the fish aboard the vessel. Unfortunately,particularly during the 1960s and 1970s, many dolphins became entangled in the nets andsuffocated.
Estimates of the mortality of dolphins due to fishing
The incidental mortality of dolphins amounted to 1,636 animals in 2000 (Table 13), a 21-percent increase relative to the mortality of 1,348 animals in 1999. The mortalities for 1979-2000, by species and stock, and the standard errors of these estimates for 1979-1994, are shown
ANNUAL REPORT 2000 35

in Tables 14a and 14b, respectively. The mortalities of the principal species affected by thefishery show declines in the last decade (Figure 17) similar to that for the mortalities of all dol-phins combined (Figure 18). Estimates of the abundances of the various stocks of dolphins for1986-1990 and the relative mortalities (mortality/abundance) are also shown in Table 13. Thehighest levels of relative mortality occurred for northeastern spotted dolphins and easternspinner dolphins (0.04-0.05 percent), and the central stock of common dolphins (0.06 percent).The upper bounds of the approximate 95-percent confidence intervals were less than 0.10 per-cent for all stocks except for the central stock of common dolphins, for which the upper boundwas 0.108 percent. Aside from the central stock of common dolphins, the highest upper boundswere those for northeastern spotted dolphins (0.051 percent) and eastern spinner dolphins(0.066 percent). In 2000 one complete trip and part of another trip by Class-6 vessels werewithout observers. If the vessels fished on dolphin-associated schools of tunas during thosetrips, and if their mortality rate per day at sea was similar to the average for all Class-6 vesselsthat fished on dolphins, the total fleet mortality for 2000 would be increased by about 9 dol-phins.
The number of sets by Class-6 vessels on dolphin-associated schools of tuna increased by7 percent, from 8,648 in 1999 to 9,235 in 2000, and the proportion of the total sets made thatwere made on dolphins increased from 44.6 percent in 1999 to 49.6 percent in 2000 (Table 5).The average mortality per set increased from 0.16 dolphin in 1999 to 0.18 dolphin in 2000. Theestimated spatial distribution of the average mortalities per set during 2000 is shown in Figure19. Patches of relatively high mortalities per set occurred throughout the fishing area. Thetrends in the numbers of sets on dolphin-associated fish, mortality per set, and total mortalityin recent years are shown in Figure 18.
The above figures are based on data from trips by tuna vessels covered by observers fromthe programs of the IATTC, the Programa Nacional de Aprovechamiento del Atún y Protecciónde Delfines of Mexico, the Programa Nacional de Observadores de Venezuela, and the ProgramaNacional de Observadores Pesqueros de Ecuador. The comparisons in the next two paragraphsare based only on the IATTC data bases for 1986 through 2000.
Performance of fishermen
The performance of fishermen in reducing dolphin mortality has been measured usingvariables such as the average mortality per set, their success in releasing all dolphins encircled(sets with zero mortality, number of dolphins left in the net after the backdown maneuver), andtheir success in reducing factors that cause high mortality (sets with major malfunctions, netcanopies, net collapses, etc.). Data on these variables for 1986-2000 are shown in Figure 20 andTable 15. The data clearly indicate that there has been steady improvement since 1986, whichhas reduced the mortality per set.
The performances of individual captains are also evaluated annually. The vesselsoperate in different areas, and set on different stocks of dolphins, so it would be unfair to judgeall captains on the basis of a single measure, such as the average mortality per set. Accordingly,the data are stratified by fishing area and by the stock of dolphins involved. A standardized per-formance measure is computed for each stock-area combination, and measures from each catenumber of sets in each category. The captains are then ranked in accordance with their overallperformance measures. These rankings are used as part of the AIDCP captain training andqualification program.
36 TUNA COMMISSION

Trends in relative abundance based on tuna vessel observer data
Despite dramatic reductions in the mortality of dolphins associated with this fishery sincethe early 1970s, the indices of relative abundance of the major dolphin species affected by thefishery have not shown any clear increase in the last two decades (Table 16). Data collected byobservers of the U.S. National Marine Fisheries Service (NMFS) and the IATTC aboard tunavessels had been used to estimate indices of relative abundance of dolphins because they repre-sent a large number of sightings collected at low cost relative to data collected on research sur-veys. However, the use of these data has posed serious problems for estimation because ofbiases introduced through the opportunistic structure of the data. If there were no trends inthese biases, it would be possible to estimate trends in relative abundance from these data.However, changes in modes of search and fishing strategies could impart temporal trends to thebiases that could, in turn, produce spurious trends in the indices of relative abundance. In lightof the proposed use of the indices of relative abundance in population dynamics models, severalissues have been raised regarding the ability of these indices to accurately capture trends in thetrue abundance of dolphins. The IATTC staff has finished the first part of a major review andre-analysis of the different sources of bias and their impacts on the indices to determine if theexisting methodologies should be modified to take into account, and adjust for, changes in biasesin recent years.
In collaboration with the Research Unit for Wildlife Population Assessment at theUniversity of St. Andrews, Scotland, the staff has re-examined the data for 1977-2000, and sev-eral potential sources of bias that have developed in the last decade have been identified.During the early 1980s the distributions of the perpendicular distances of herds of dolphins fromthe vessel showed an excess of sightings within 0.5 nautical miles (nm) of the track line due tothe vessel turning toward the herd before the observer was aware of the sighting. Since the late1980s, distributions of perpendicular distances began to show a deficit of sightings near thetrack line, with the deficit extending the furthest off the track line for sightings made by heli-copters. The lack of sightings close to the track line was not expected, and is only partiallyexplained by rounding error in the sighting angles. To remove the influence of these sightingson estimation of relative abundance, cruises with an average sighting angle of less than 20°were excluded from previous analyses. However, excess sightings near the track line notremoved by this procedure exert considerable influence on the fit of the hazard-rate model to thedistribution of perpendicular distances. Thus, in early years any spike in the distribution of theperpendicular distances near the track line would lead to an inflated estimate of relative abun-dance. With the development of a deficit in sightings near the track line during the 1990s, thetendency for inflated estimates of relative abundance would be diminished, imparting a tem-poral trend in bias.
Differences in the percentages of sightings that led to sets and in average total herd size,by sighting method, suggest that the degree of under-reporting of crew sightings to the observervaries in accordance with the type of gear used to make the sighting. An analysis of sightingsof offshore spotted dolphins within the northeastern offshore spotted dolphin area (north of 5ºNand east of 120ºW) shows that helicopter sightings were more likely to lead to sets than binoc-ular sightings, and that the percentage of helicopter sightings that led to sets increased over26 percent of these during 2000. On average, 79 percent of the helicopter sightings, 72 percentof the radar sightings, and 62 percent of the binocular sightings led to sets. A maximum dif-ference of 28 percent between percentages of sightings that led to sets was found, occurringbetween helicopter and binocular sightings in 2000. In addition, helicopter sightings tended to
ANNUAL REPORT 2000 37

involve larger dolphin herds than either binocular or radar sightings. Average herd size hasbeen shown to be correlated with catch per set of yellowfin tuna, suggesting that dolphin herdsnot associated with tunas that are detected by helicopters are less likely to be reported to theobserver than such herds detected by binoculars or radar. The increasing trend in the per-centage of sightings that were made by helicopters and radar, combined with the difference inunder-reporting, will produce biased estimates if the indices from different search methods arenot comparable.
To explore the effect of changes in the relative proportion of sightings near the tracklineon estimated abundance of northeastern offshore spotted dolphins and eastern spinner dol-phins, previously published methods were modified by fitting a half-normal model, rather thana hazard-rate model, to the perpendicular distance data. The hazard-rate model is more flex-ible, and thus can model the spike in sightings near the track line, an undesirable property ifthe excess sightings are the result of a spurious process. The half-normal model is more robustto high proportions of detections near the trackline, and thus comparison of estimates of rela-tive abundance obtained from the two different models provides a means of assessing the influ-ence of excess sightings near the track line on trends. Smearing of the sighting data used toreduce spikes resulting from rounding off of angles was also excluded from the estimation pro-cedures to avoid arbitrary redistribution of excess sightings near the track line into perpendic-ular distance intervals where they may not belong.
In a separate analysis, the effect of changes in the dominant searching gear and under-reporting was explored for the northeastern offshore spotted dolphin by stratifying the sightingsdata by categories of gear aboard the vessels. Four categories were used: (1) neither helicopternor radar aboard; (2) helicopter; but no radar, aboard; (3) radar, but no helicopter, aboard, and(4) both helicopter and radar aboard. Estimates of relative abundance were computed for eachcategory, and the trends in the estimates were compared.
From comparison of estimates of relative abundance based on the hazard-rate model withthose based on the half-normal model, it appears that the overall decreasing trend in relativeabundance from 1977 through approximately 1992 is at least partially dependent on the treat-ment of the spike in the distribution of perpendicular distances near the trackline (Table 16;Figure 21). If the spike is spurious, then much of the decreasing trend over this time period mayalso be spurious. For example, the 1989-1991 average of the estimates of relative abundance fornortheastern spotted dolphins based on the hazard-rate model shows a decrease of 17 percentrelative to the 1977-1979 average, whereas comparable estimates based on the half-normalmodel show a decrease of only 6 percent. A similar, but smaller, effect was seen for the easternspinner dolphin (Table 16).
Some differences in indices of relative abundance were seen by mode of search. Estimatesfor the northeastern offshore spotted dolphin based on data collected aboard vessels with nohelicopter and no radar suggest a decrease in the index from the late 1970s through the early1980s, and an increase beginning during the mid-1980s. However, because of the high degreeof variability in the estimates, there is no clear evidence for any long-term pattern between 1977and 1990 (Figure 22). Estimates based on data collected aboard vessels with helicopters but noradar are generally less variable over the same time period, and the index generally increasessuggest an increase in the index in the mid-1980s. During the last decade, estimates based ondata from trips by vessels with radar but no helicopter, and with both helicopter and radar,show decreasing trends, although the rate of decrease varies by mode of search (Figure 22). Theindex based on data for vessels with radar but no helicopter shows a decreasing trend beginningin the early 1990s. On the other hand, the index based on data from vessels with both radar
38 TUNA COMMISSION

and helicopter did not begin to decrease until the late 1990s, perhaps due to the 1997-1998 ElNiño; similar decrease in the index occurred in1983, when there was another strong El Niñoevent (Table 16, Figure 21).
Comparison of estimates of the effective width of the transect strip (the width over whichall animals would have been detected if detection were always certain) and the encounter ratefor modes of search with and without helicopters showed patterns consistent with an increasedlevel of under-reporting with the use of a helicopter. Estimates of the effective width of the tran-sect strip for vessels with helicopters are generally greater than those for vessels without heli-copters. However, the encounter rates for vessels with helicopters are generally less than thosefor vessels without helicopters. In the absence of changes in true abundance, this pattern wouldbe consistent with an increased level of under-reporting of sightings on vessels with helicoptersrelative to vessels without helicopters. (The current methodology includes the assumption thatdetection on the trackline is certain.) This is also consistent with the fact that a higher per-centage of reported helicopter sightings led to sets.
To quantify the effects of changes in data quality and under-reporting in the last decadeon the index for northeastern offshore spotted dolphins, a weighted average index from theindices for modes of search was computed. The index based on data of vessels with radar, butno helicopter, was excluded because that the data seem to exhibit a temporal trend in bias as aresult of under-reporting, coupled with changes in fishing strategies. The data prior to 1984were also excluded because of issues relating to under-reporting, and the likelihood of poor dataquality. It is assumed that the average difference between the other indices largely reflectsunder-reporting, and thus it is possible to adjust the indices for vessels with helicopters upwardby a factor that corrects for the additional level of under-reporting that likely occurs with theuse of a helicopter. A weighted average index (Table 16) was then computed as a weightedaverage of the indices for the three modes of search, with weights equal to the inverse of thesquared coefficient of variation. Comparison of the weighted average index to the previously-published index shows that the majority of the decline in the previously-published indexbetween the late 1980s to the early 1990s, and the mid-1990s, may be attributable to the choiceof detection function (hazard-rate versus half-normal) and the presence of different levels ofunder-reporting, coupled with changes in fishing strategies by part of the fleet. For example,the average of previously-published estimates from 1993-1997 shows a decrease of 20 percentrelative to the 1987-1991 average. In contrast, the average of weighted average index estimatesfrom 1993-1997 shows a decrease of 4 percent relative to 1981-1991 (Table 16).
These preliminary results suggest that a significant percentage of the previously-pub-lished long-term decreasing trend in the index of relative abundance for northeastern spotteddolphins is likely due to changes in data quality, fishing strategies, and levels of under-reporting. In fact, the weighted average index for the northeastern spotted dolphin hasremained relatively constant from about 1985 to 1997. The continued decrease of the indexthrough 2000 raises questions about the effects of changes in ocean climate on geographically-defined stocks and the effects of continued changes in under-reporting biases, both of which aretopics for future study. There may, of course, be other undetected trends in biases in the dataanalyses on these topics will be conducted.
Trends in absolute abundance
Ideally, all data available would be used to answer the question: are the dolphin popula-tions recovering from the high mortalities of past years? Data by scientists on research vessels and observers on tuna vessels would be combined to maximize the information available.
ANNUAL REPORT 2000 39

However, given the difficulties noted above with the use of observer data from tuna vessels toestimate the changes in dolphin abundance over the years, the IATTC staff believes that thesebiases are not completely understood or removed. However, the scientifically-designed surveysconducted by the U.S. NMFS should not suffer from these problems.
The IATTC staff has previously estimated the population growth rates for easternspinner and northeastern spotted dolphins by fitting a simple exponential population model tothe U.S. NMFS marine mammal survey data for 1979-1998 (IATTC Annual Report for 1999).This analysis has been updated with the addition of preliminary estimates for the 1999 NMFSsurveys.
The population model is given as N(t+1) = exp(r(t)) [N(t)-C(t)]
in which N(t) is the population abundance in year t, r(t) is the population growth rate in year t,and C(t) is the total dolphin mortality in the purse-seine fishery in year t, as estimated by theIATTC staff. The relationship between dolphin abundance, as measured by the NMFS survey,and true abundance is assumed to be:
x(t) = ln[N(t)] + e(t) + d(t)in which x(t) is the logarithmic transformation of the survey estimate of abundance in year t, e(t)is the survey measurement error as characterized by the sample variance reported by theNMFS, and d(t) is an additional unreported survey error (“process error”) due to sources otherthan sample variance. The first error term, e(t), is assumed to be normally distributed, withstandard deviation equal to the survey sample coefficient of variation reported by the NMFS;the second error term, d(t), is assumed to be normally distributed with unknown variance V,which is an additional parameter to be estimated. A Bayesian statistical estimation procedure,the MCMC algorithm, was applied to calculate posterior probability intervals for the net growthrate of the population and annual abundance. Prior distributions were chosen as uniform dis-tributions on r(t), ln[N(1979)], and ln(V) because of the nearly linear structure of the problemunder a logarithm transformation. The bounds of the uniform priors were chosen well beyondthe appreciable density of the likelihood function.
The above population model was fitted on the assumption that the growth rate was con-stant during 1979-1999. The growth rates of northeastern spotted dolphins (3.2 percent + 3.1percent) and eastern spinner dolphins (3.7 percent + 2.4 percent) are nearly the same (Figures23a and 23b). The eastern spinner dolphin sample variance accounts for all the variance aboutthe fitted line, so there is no need for an additional variance component, as there is for the north-eastern spotted dolphins. The net cumulative growth rate during 1979-1999 is given byln[N(1999)/N(1979)]. The results indicate that the probability that the population has grownduring those years is greater than 65 percent for the northeastern spotted dolphin and greaterthan 85 percent for the eastern spinner dolphin (Figures 24a and 24b). This model indicatesnorth-eastern spotted dolphins and from about 435,000 to 745,000 for eastern spinner dolphins.
GEAR PROGRAMThe purpose of the IATTC's gear program is to find ways to minimize or eliminate the
mortality of dolphins during fishing operations.
40 TUNA COMMISSION

DOLPHIN SAFETY PANEL ALIGNMENTSDuring 2000 the IATTC staff conducted alignments of dolphin safety panels (DSPs) and
inspections of dolphin rescue gear aboard 29 vessels, 27 registered in Mexico, 1 in Ecuador, and1 in the United States. A trial set, during which an IATTC employee observes the performanceof the net from an inflatable raft during backdown, is made to check the alignment of the DSP.The IATTC employee transmits his observations, comments, and suggestions to the captain ofthe vessel, and attempts are made to resolve any problems that may arise. Afterward a reportis prepared for the vessel owner or manager. This report contains a summary of the IATTCemployee’s observations and, if necessary, suggestions for improving the vessel’s dolphin-safetygear and/or procedures.
TRAINING AND CERTIFICATION OF FISHING CAPTAINSThe IATTC has conducted dolphin mortality reduction seminars for tuna fishermen since
1980. Article V of the Agreement on the International Dolphin Conservation Program (AIDCP)calls for the establishment, within the framework of the IATTC, of a system of both technicaltraining and certification of fishing captains. Under the system, the IATTC staff is responsiblefor maintaining a list of all captains qualified to fish for tunas associated with dolphins in theeastern Pacific Ocean. The names of the captains who meet the requirements are to be suppliedto the International Review Panel for approval and circulation to the Parties to the AIDCP.
The requirements for new captains include (1) attending a training seminar organized bythe IATTC staff or by the pertinent national program in coordination with the IATTC staff, (2)participation in a trial set that includes direct observations of the backdown channel, and (3) apractical training component, consisting of a trip during which it is intended to fish for tunaassociated with dolphins aboard a vessel with a Dolphin Mortality Limit, accompanied by eithera qualified captain or an approved technical advisor. These workshops are intended not only forcaptains, who are directly in charge of fishing operations, but also for other crew members andfor administrative personnel responsible for vessel equipment and maintenance. The fishermenand others who attend the workshops are presented with certificates of attendance. No work-shops were held during 2000.
OTHER SERVICESThe IATTC also offers other services to help governments and fleet managers and opera-
tors of individual vessels to reduce dolphin mortality. Publications and video tapes on the sub-ject are available at IATTC field offices. Trip Analyses, detailed reports of observed fishingtrips, are prepared upon request and, after the required authorizations are obtained, providedto allow performance assessments of vessels and captains.
MEASURES FOR THE CONSERVATION OF TUNASThe IATTC has the responsibility for conducting studies of the biology of the tunas and
them, and recommending appropriate conservation measures when necessary so that the stocksof fish can be maintained at levels that will yield the maximum sustainable catches.
If such measures are adopted, it is the responsibility of the states in which the vessels areregistered to enforce them.
ANNUAL REPORT 2000 41

YELLOWFIN TUNA
The Director first recommended that an annual quota be set on the catch of yellowfin inthe Commission’s Yellowfin Regulatory Area (CYRA; Figure 1) in 1962. However, the membergovernments could not reach agreement on a yellowfin quota until 1966. Agreement wasreached on a quota for every year from 1966 through 1986 and 1988 through 2000. The Directordid not recommend a quota for 1987 because, due primarily to exceptionally high levels of re-cruitment in 1984 and 1985, the abundance of yellowfin appeared to be at its greatest level inrecent years. The regulations were implemented during each year of the 1966-1979 period andduring 1998, 1999, and 2000.
At the IATTC’s 66th meeting (June 12 and 14-15, 2000) the Commission agreed on regu-lations to restrict the catch of yellowfin in the CYRA for 2000. When the catch reached 240,000mt purse seiners and baitboats would be required to refrain from fishing in two areas, one offnorthern Mexico and the other off northern South America. On December 1, or when the catchof yellowfin in the CYRA reached 265,000 mt, whichever came first, purse seiners with observ-ers aboard would be required to refrain from fishing for yellowfin in the CYRA until January 1,2001. Vessels without observers aboard that commenced fishing trips during December 2000would be required to refrain from fishing for yellowfin in the CYRA during the remainder ofDecember and after that until they returned to port to unload. In either case the vessels wouldbe permitted incidental catches of yellowfin up to a maximum of 15 percent of their total land-ings. (Persons requiring detailed information of this and other regulations can examine the res-olutions on the IATTC’s web site, www.iattc.org.) There was a difference of opinion about theinterpretation of the resolution, and, as the catch of yellowfin in the CYRA did not reach 240,000mt, not all members of the IATTC required their vessels to limit their fishing for yellowfin inthe CYRA.
BIGEYE TUNAThe rapidly increasing catches of bigeye by surface gear during the mid-1990s is obvi-
ously a matter of concern. The possible effects of the purse-seine fishery on the longline fisherywere discussed on pages 25-26 of the IATTC Annual Report for 1997. At the time that that re-port was written there was insufficient information, particularly on natural mortality rates, tocome to definite conclusions. Nevertheless, a resolution was passed at the 61st meeting of theIATTC (June 10-12, 1998) calling for cessation of making purse-seine sets on schools of tunasassociated with floating objects during 1998 after 45,000 mt of bigeye had been caught in theEPO by surface gear. The catch of bigeye by the surface fishery during 1998 was less than45,000 mt, so there were no restrictions on the catch of that species during that year. A similarresolution was passed for 1999, but the amount of bigeye to be caught by surface gear was re-duced to 40,000 mt. The catches of bigeye were greater during 1999 than during 1998, and thevessels were required to refrain from making sets on fish associated with floating objects nearthe end of that year.
In 2000, in accordance with a resolution adopted at the 66th meeting of the IATTC (June12 and 14-15, 2000), a similar ban was imposed from September 15 through December 15.
BYCATCHESAt the 66th meeting of the IATTC (June 12 and 14-15, 2000) a resolution was adopted to
“implement, as of 1 January 2001, a one-year pilot program to require all purse-seine vessels tofirst retain on board and then land all bigeye, skipjack, and yellowfin tuna caught, except fish
42 TUNA COMMISSION

onsidered unfit for human consumption for reasons other than size, in order to provide a disin-centive to the capture of these small fish.”
THE INTERNATIONAL DOLPHIN CONSERVATION PROGRAMIn 2000 the governments or regional economic integration organizations that had ratified
or were provisionally applying the Agreement on the International Dolphin ConservationProgram (AIDCP) were Colombia, Costa Rica, Ecuador, El Salvador, the European Union,Honduras, Mexico, Nicaragua, Panama, Peru, the United States, Vanuatu, and Venezuela. TheIATTC provides the Secretariat for the IDCP.
The overall dolphin mortality limit (DML) established for the international fleet in 2000was 5,000 animals, and the unreserved portion of 4,900 was allocated to 109 vessels thatrequested and were qualified to receive DMLs. The average individual vessel DML was 44.55.Twenty-four of those vessels did not utilize their DMLs prior to April 1; 11 of those forfeitedtheir DMLs, and the other 13 were allowed, due to extenuating circumstances, to keep them forthe remainder of the year. A total of 89 vessels utilized their DMLs during the year. Seven ves-sels were allocated second-semester DMLs of 14 animals each, but none of these utilized itsDML. The distribution of the mortality caused in 2000 by vessels with full-year DMLs is shownin Figure 25. The estimate of the total mortality of dolphins caused by the fishery in 2000 is1,636 animals.
SYSTEM FOR TRACKING AND VERIFYING TUNAArticle V(1)f of the AIDCP calls for the establishment of a system for the tracking and ver-
ification of tuna caught with and without mortality or serious injury of dolphins. The Parties tothe AIDCP developed a general tracking and verification system, and a tuna-tracking form(TTF) to be completed at sea by IATTC and national program observers. There are two versionsof the TTF, which, except for the headings, are identical; Form “A” documents tuna caught insets without mortality or serious injury of dolphins (“dolphin safe”), and Form “B” documentstuna caught in sets with mortality or serious injury of dolphins (“non-dolphin safe”). TheSecretariat is responsible for producing the TTFs to be used throughout the Agreement Area byall the Parties. Each Party is to designate a national authority to be responsible for imple-menting and operating the tracking and verification program, and to provide the Secretariatwith a report detailing the tracking and verification program established by that Party underits national laws and regulations. These programs are to include periodic audits and spotchecks for caught landed, and processed tuna products, mechanisms for communication andcooperation between and among national authorities, and timely access to relevant data. Thetuna-tracking system began in 2000, and TTFs were completed for all observed trips by Partyvessels that departed during the year for which there were catches of tuna.
AT-SEA REPORTING BY OBSERVERSThe AIDCP mandated that the Parties “establish a system, based on real-time observer
reporting, to ensure effective implementation and compliance with the per-stock, per-year dol-phin mortality cap.” This system was implemented by requiring observers aboard all tuna purse-seiners with DMLs to report on a weekly basis via e-mail, fax, or radio. The reporting rate wasdisappointing, in part due to lack of the necessary equipment. This lack of reporting had littlepractical effect, as the dolphin mortalities were much lower than the Stock Mortality Limits(SMLs).
ANNUAL REPORT 2000 43

PUBLICATIONSThe prompt and complete publication of research results is one of the most important ele-
ments of the IATTC’s program of scientific investigations. By this means the member govern-ments, the scientific community, and the public at large are currently informed of the researchfindings of the IATTC staff. The publication of basic data, methods of analysis, and conclusionsafford the opportunity for critical review by other scientists, ensuring the soundness of the con-clusions reached by the IATTC staff and enlisting the interest of other scientists in the IATTC’sresearch. By the end of 2000 IATTC staff members had published 145 Bulletins, 49 Annual Re-ports, 11 Special Reports, 10 Data Reports, 9 books, and 507 chapters, papers, and articles inbooks and outside journals. The contributions by staff members published during 2000 arelisted in Appendix 3 of this report.
WEB SITEThe IATTC maintains a web site, www.iattc.org, in English and Spanish, which permits
the public to obtain current information on its work. The web site includes, among other things,documents relating to the IATTC and the Agreement on the International Dolphin ConservationProgram (AIDCP), a list of the member nations and Commissioners of the IATTC, a list of themembers of the IATTC staff, a list of recent and future meetings of the IATTC, the AIDCP, andtheir working groups, Background Papers, agendas, and minutes or reports of recent meetingsof these, provisional agendas of future meetings, recent resolutions of the IATTC and theAIDCP, statistics for the fisheries for tunas in the eastern Pacific Ocean, up-to-date informationon measures for the conservation of tunas, recent Quarterly Reports of the IATTC, and infor-mation on IATTC publications.
44 TUNA COMMISSION

FIGURE 1. The eastern Pacific Ocean (EPO), as defined by the Agreement on the InternationalDolphin Conservation Program (area inside the heavy line), and the Commission's YellowfinRegulatory Area (CYRA).FIGURA 1. El Océano Pacífico oriental (OPO), definido por el Acuerdo sobre el Programa In-ternacional para la Comisión de los Delfines (área encerrada con línea gruesa), y el Area Regla-mentaria de la Comisión para el Aleta Amarilla (ARCAA).
ANNUAL REPORT 2000 45

FIGU
RE 2
.Av
erag
e, mi
nimu
m, an
d max
imum
valu
es fo
r mon
thly
capa
city o
f pur
se se
iner
s and
baitb
oats
at se
a in
the E
PO du
ring 1
989-1
999,
and
the 2
000 m
onth
ly va
lues
.FI
GURA
2.
Valor
es m
ensu
ales m
edios
, mín
imos
, y m
áxim
os d
e la
capa
cidad
de b
arco
s cer
quer
os y
de ca
rnad
a en
el m
ar en
el O
PO d
uran
te 19
89-
1999
, y lo
s valo
res m
ensu
ales d
e 200
0.
46 TUNA COMMISSION

FIGU
RE 3
a.Av
erag
e ann
ual c
atch
es of
yello
wfin
in th
e EPO
dur
ing 1
985-1
999 f
or se
ts on
fish
asso
ciated
with
dolp
hins
on al
l pur
se-se
ine t
rips f
orwh
ich us
able
logbo
ok da
ta w
ere o
btain
ed. T
he av
erag
e cat
ches
and e
ffort
were
calcu
lated
only
for 1-
degr
ee ar
eas f
or w
hich
thre
e or m
ore y
ears
of da
tawe
re av
ailab
le.FI
GURA
3a.C
aptu
ras m
edias
anua
les de
aleta
amar
illa e
n el O
PO du
rant
e 198
5-199
9 en l
ance
s sob
re pe
ces a
socia
dos c
on de
lfine
s de t
odos
los v
iajes
de b
uque
s cer
quer
os d
e los
que
se ob
tuvie
ron
datos
de b
itáco
ra u
tiliza
bles.
Se c
alcul
aron
pro
medio
s de c
aptu
ra y
esfu
erzo
solam
ente
para
las á
reas
de 1°
para
las c
uales
se di
spon
ía de
tres
años
o má
s de d
atos
.
ANNUAL REPORT 2000 47

FIGU
RE 3b
.Ave
rage
annu
al ca
tches
of ye
llowf
in in
the E
PO du
ring 2
000 f
or se
ts on
fish
asso
ciated
with
dolph
ins o
n all
purs
e-sein
e trip
s for
whi
chus
able
logbo
ok da
ta w
ere o
btain
ed.
FIGU
RA 3
b.Ca
ptur
as m
edias
anua
les de
aleta
amar
illa e
n el
OPO
dura
nte 2
000 e
n lan
ces s
obre
pece
s aso
ciado
s con
delfi
nes d
e tod
os lo
s viaj
es de
buqu
es ce
rque
ros d
e los
que s
e obt
uvier
on da
tos de
bitá
cora
util
izable
s.
48 TUNA COMMISSION
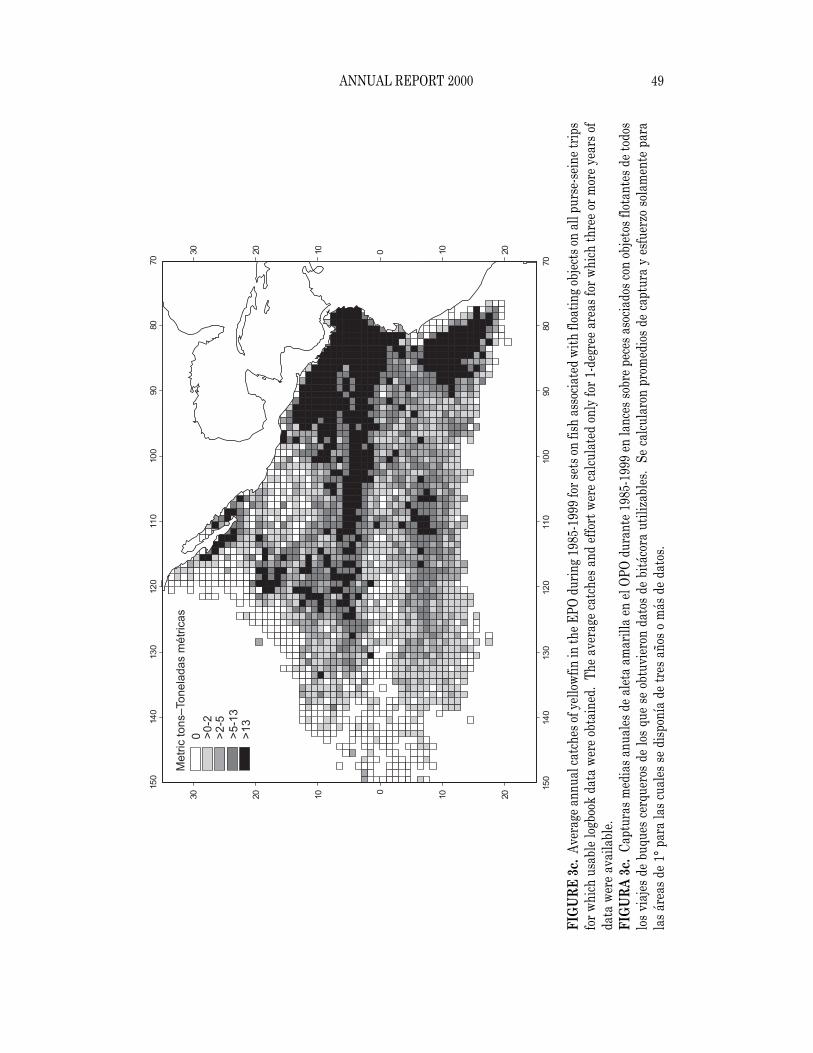
FIGU
RE 3c
.Ave
rage
annu
al ca
tches
of ye
llowf
in in
the E
PO du
ring 1
985-1
999 f
or se
ts on
fish
asso
ciated
with
floa
ting o
bjects
on al
l pur
se-se
ine t
rips
for w
hich
usa
ble lo
gboo
k dat
a wer
e obt
ained
. The
aver
age c
atch
es an
d effo
rt we
re ca
lculat
ed on
ly for
1-de
gree
area
s for
whi
ch th
ree o
r mor
e yea
rs of
data
wer
e ava
ilable
.FI
GURA
3c.C
aptu
ras m
edias
anua
les de
aleta
amar
illa e
n el
OPO
dura
nte 1
985-1
999 e
n lan
ces s
obre
pece
s aso
ciado
s con
objet
os fl
otant
es de
todo
slos
viaje
s de b
uque
s cer
quer
os d
e los
que s
e obt
uvier
on d
atos
de b
itáco
ra u
tiliza
bles.
Se c
alcul
aron
pro
medio
s de c
aptu
ra y
esfu
erzo
solam
ente
para
las ár
eas d
e 1° p
ara l
as cu
ales s
e disp
onía
de tr
es añ
os o
más d
e dat
os.
ANNUAL REPORT 2000 49

FIGU
RE 3d
.Ave
rage
annu
al ca
tches
of ye
llowf
in in
the E
PO du
ring 2
000 f
or se
ts on
fish
asso
ciated
with
floa
ting o
bjects
on al
l pur
se-se
ine t
rips f
orwh
ich u
sable
logb
ook
data
wer
e obt
ained
.FI
GURA
3d.
Cap
tura
s med
ias an
uales
de a
leta a
maril
la en
el O
PO d
uran
te 20
00 en
lanc
es so
bre p
eces
asoc
iados
con
objet
os fl
otant
es d
e tod
os lo
svia
jes de
buqu
es ce
rque
ros d
e los
que s
e obt
uvier
on da
tos de
bitá
cora
util
izable
s.
50 TUNA COMMISSION

FIGU
RE 3e
.Ave
rage
annu
al ca
tches
of ye
llowf
in in
the E
PO du
ring 1
985-1
999 f
or set
s on u
nasso
ciated
fish o
n all p
urse-
seine
trips
for w
hich u
sable
logb
ook d
ata w
ereob
taine
d. Th
e ave
rage
catch
es an
d effo
rt we
re ca
lculat
ed on
ly for
1-de
gree a
reas f
or wh
ich th
ree or
more
year
s of d
ata w
ere av
ailab
le.FI
GURA
3e. C
aptu
ras m
edias
anua
les de
aleta
amar
illa e
n el O
PO du
rant
e 198
5-199
9 en l
ance
s sob
re pe
ces n
o aso
ciado
s de t
odos
los v
iajes
de bu
ques
cerq
uero
s de l
os qu
e se o
btuv
ieron
dat
os d
e bitá
cora
util
izable
s. S
e calc
ular
on p
rome
dios d
e cap
tura
y es
fuer
zo so
lamen
te pa
ra la
s áre
as d
e 1° p
ara
las cu
ales s
e disp
onía
de tr
es añ
os o
más d
e dat
os.
ANNUAL REPORT 2000 51

FIGU
RE 3
f.Av
erag
e ann
ual c
atch
es of
yello
wfin
in th
e EPO
durin
g 200
0 for
sets
on u
nass
ociat
ed fi
sh on
all p
urse
-sein
e trip
s for
whi
ch u
sable
log-
book
data
wer
e obt
ained
.FI
GURA
3f. C
aptu
ras m
edias
anua
les de
aleta
amar
illa e
n el O
PO du
rant
e 200
0 en l
ance
s sob
re pe
ces n
o aso
ciado
s de t
odos
los v
iajes
de bu
ques
cer-
quer
os de
los q
ue se
obtu
viero
n da
tos de
bitá
cora
util
izable
s.
52 TUNA COMMISSION

FIGU
RE 4a
.Ave
rage
annu
al ca
tches
of sk
ipjac
k in t
he E
PO du
ring 1
985-1
999 f
or se
ts on
fish
asso
ciated
with
floa
ting o
bjects
on al
l pur
se-se
ine t
rips
for w
hich
usa
ble lo
gboo
k dat
a wer
e obt
ained
. The
aver
age c
atch
es an
d effo
rt we
re ca
lculat
ed on
ly for
1-de
gree
area
s for
whi
ch th
ree o
r mor
e yea
rs of
data
wer
e ava
ilable
.FI
GURA
4a.
Cap
tura
s med
ias an
uales
de b
arril
ete en
el O
PO d
uran
te 19
85-19
99 en
lanc
es so
bre p
eces
asoc
iados
con
objet
os fl
otant
es d
e tod
os lo
svia
jes d
e buq
ues c
erqu
eros
de l
os qu
e se o
btuv
ieron
dat
os d
e bitá
cora
util
izable
s. S
e calc
ular
on p
rome
dios d
e cap
tura
y es
fuer
zo so
lamen
te pa
ra la
sár
eas d
e 1° p
ara l
as cu
ales s
e disp
onía
de tr
es añ
os o
más d
e dat
os.
ANNUAL REPORT 2000 53

FIGU
RE 4
b. A
vera
ge an
nual
catch
es of
skipj
ack
in th
e EPO
durin
g 200
0 for
sets
on fi
sh as
socia
ted w
ith fl
oatin
g obje
cts on
all p
urse
-sein
e trip
s for
which
usa
ble lo
gboo
k da
ta w
ere o
btain
ed.
FIGU
RA 4
b.Ca
ptur
as m
edias
anua
les de
barri
lete e
n el
OPO
dura
nte 2
000 e
n lan
ces s
obre
pece
s aso
ciado
s con
objet
os fl
otant
es de
todo
s los
viaje
sde
buqu
es ce
rque
ros d
e los
que s
e obt
uvier
on da
tos de
bitá
cora
util
izable
s.
54 TUNA COMMISSION

FIGU
RE 4c
.Ave
rage
annu
al ca
tches
of sk
ipjac
k in t
he E
PO du
ring 1
985-1
999 f
or set
s on u
nasso
ciated
fish o
n all p
urse-
seine
trips
for w
hich u
sable
logb
ook d
ata w
ereob
taine
d. Th
e ave
rage
catch
es an
d effo
rt we
re ca
lculat
ed on
ly for
1-de
gree a
reas f
or wh
ich th
ree or
more
year
s of d
ata w
ere av
ailab
le.FI
GURA
4c.
Capt
uras
med
ias a
nuale
s de b
arril
ete en
el O
PO d
uran
te 19
85-19
99 en
lanc
es so
bre p
eces
no a
socia
dos d
e tod
os lo
s viaj
es d
e buq
ues
cerq
uero
s de l
os qu
e se o
btuv
ieron
dat
os d
e bitá
cora
util
izable
s. S
e calc
ular
on p
rome
dios d
e cap
tura
y es
fuer
zo so
lamen
te pa
ra la
s áre
as d
e 1° p
ara
las cu
ales s
e disp
onía
de tr
es añ
os o
más d
e dat
os.
ANNUAL REPORT 2000 55

FIGU
RE 4
d. A
vera
ge an
nual
catch
es of
skipj
ack
in th
e EPO
durin
g 200
0 for
sets
on u
nass
ociat
ed fi
sh on
all p
urse
-sein
e trip
s for
whi
ch u
sable
log-
book
data
wer
e obt
ained
.FI
GURA
4d.C
aptu
ras m
edias
anua
les de
barri
lete e
n el O
PO du
rant
e 200
0 en l
ance
s sob
re pe
ces n
o aso
ciado
s de t
odos
los v
iajes
de bu
ques
cerq
uero
sde
los q
ue se
obtu
viero
n da
tos de
bitá
cora
util
izable
s.
56 TUNA COMMISSION

FIGU
RE 5
a. A
vera
ge an
nual
catch
es of
bige
ye in
the E
PO du
ring 1
994-1
999 f
or se
ts on
fish
asso
ciated
with
floa
ting o
bjects
on al
l pur
se-se
ine t
rips
for w
hich
usa
ble lo
gboo
k da
ta w
ere o
btain
ed.
The a
vera
ge ca
tches
and
effor
t wer
e calc
ulat
ed on
ly for
1-de
gree
area
s for
whi
ch tw
o or m
ore y
ears
ofda
ta w
ere a
vaila
ble.
FIGU
RA 5
a. C
aptu
ras m
edias
anu
ales d
e pat
udo e
n el
OPO
dura
nte 1
994-1
999
en la
nces
sobr
e pec
es a
socia
dos c
on ob
jetos
flota
ntes
de t
odos
los
viajes
de b
uque
s cer
quer
os d
e los
que s
e obt
uvier
on d
atos
de b
itáco
ra u
tiliza
bles.
Se c
alcul
aron
pro
medio
s de c
aptu
ra y
esfu
erzo
solam
ente
para
las
área
s de 1
° par
a las
cuale
s se d
ispon
ía de
dos a
ños o
más
de da
tos.
ANNUAL REPORT 2000 57

FIGU
RE 5
b.Av
erag
e ann
ual c
atch
es of
bige
ye in
the E
PO d
urin
g 200
0 for
sets
on fi
sh a
ssoc
iated
with
floa
ting o
bjects
on a
ll pu
rse-s
eine t
rips f
orwh
ich u
sable
logb
ook
data
wer
e obt
ained
.FI
GURA
5b. C
aptu
ras m
edias
anua
les de
patu
do en
el O
PO du
rant
e 200
0 en
lance
s sob
re pe
ces a
socia
dos c
on ob
jetos
flota
ntes
de to
dos l
os vi
ajes d
ebu
ques
cerq
uero
s de l
os qu
e se o
btuv
ieron
datos
de bi
táco
ra u
tiliza
bles.
58 TUNA COMMISSION

FIGURE 6. Areas used for sampling lengths of surface-caught tunas in the eastern PacificOcean (EPO).FIGURA 6. Zonas usadas para el muestreo de tallas de atunes capturados con artes de superfi-cie en el Océano Pacífico oriental (OPO).
ANNUAL REPORT 2000 59

FIGURE 7a. Estimated size compositions of the yellowfin caught in each fishery of the EPOduring 2000. The average weights of the fish in the samples are given at the tops of the panels.FIGURA 7a. Composición por tallas estimada para el aleta amarilla capturado en cada pes-quería del OPO en 2000. En cada recuadro se detalla el peso promedio de los peces en las mues-tras.
60 TUNA COMMISSION

FIGURE 7b. Estimated size compositions of the yellowfin caught in the EPO during 1995-2000. The average weights of the fish in the samples are given at the tops of the panels.FIGURA 7b. Composición por tallas estimada para el aleta amarilla capturado en el OPO du-rante 1995-2000. En cada recuadro se detalla el peso promedio de los peces en las muestras.
ANNUAL REPORT 2000 61
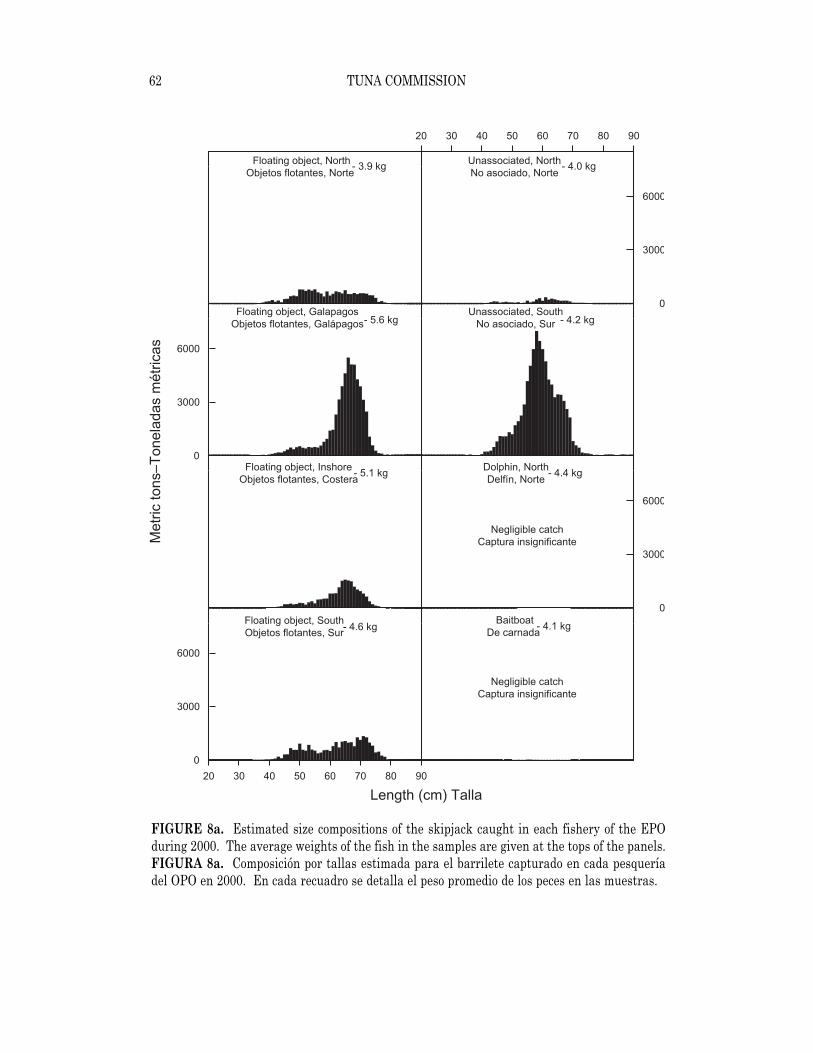
FIGURE 8a. Estimated size compositions of the skipjack caught in each fishery of the EPOduring 2000. The average weights of the fish in the samples are given at the tops of the panels.FIGURA 8a. Composición por tallas estimada para el barrilete capturado en cada pesqueríadel OPO en 2000. En cada recuadro se detalla el peso promedio de los peces en las muestras.
62 TUNA COMMISSION

FIGURE 8b. Estimated size compositions of the skipjack caught in the EPO during 1995-2000.The average weights of the fish in the samples are given at the tops of the panels.FIGURA 8b. Composición por tallas estimada para el barrilete capturado en el OPO durante1995-2000. En cada recuadro se detalla el peso promedio de los peces en las muestras.
ANNUAL REPORT 2000 63

FIGURE 9a. Estimated size compositions of the bigeye caught in each fishery of the EPOduring 2000. The average weights of the fish in the samples are given at the tops of the panels.FIGURA 9a. Composición por tallas estimada para el patudo capturado en cada pesquería delOPO en 2000. En cada recuadro se detalla el peso promedio de los peces en las muestras.
64 TUNA COMMISSION

FIGURE 9b. Estimated size compositions of the bigeye caught in the EPO during 1995-2000.The average weights of the fish in the samples are given at the tops of the panels.FIGURA 9b. Composición por tallas estimada para el patudo capturado en el OPO durante1995-2000. En cada recuadro se detalla el peso promedio de los peces en las muestras.
ANNUAL REPORT 2000 65

FIGURE 10a. Estimated catches of Pacific bluefin by purse-seine gear in the EPO during 1995-2000. The values at the tops of the panels are the average weights.FIGURA 10a. Captura estimada de aleta azul del Pacífico por buques cerqueros en el OPOdurante 1995-2000. El valor en cada recuadro representa el peso promedio.
66 TUNA COMMISSION

FIGURE 10b. Estimated catches of Pacific bluefin by recreational gear in the EPO during1995-2000. The values at the tops of the panels are the average weights.FIGURA 10b. Captura estimada de aleta azul del Pacífico por artes deportivas en el OPO du-rante 1995-2000. El valor en cada recuadro representa el peso promedio.
ANNUAL REPORT 2000 67
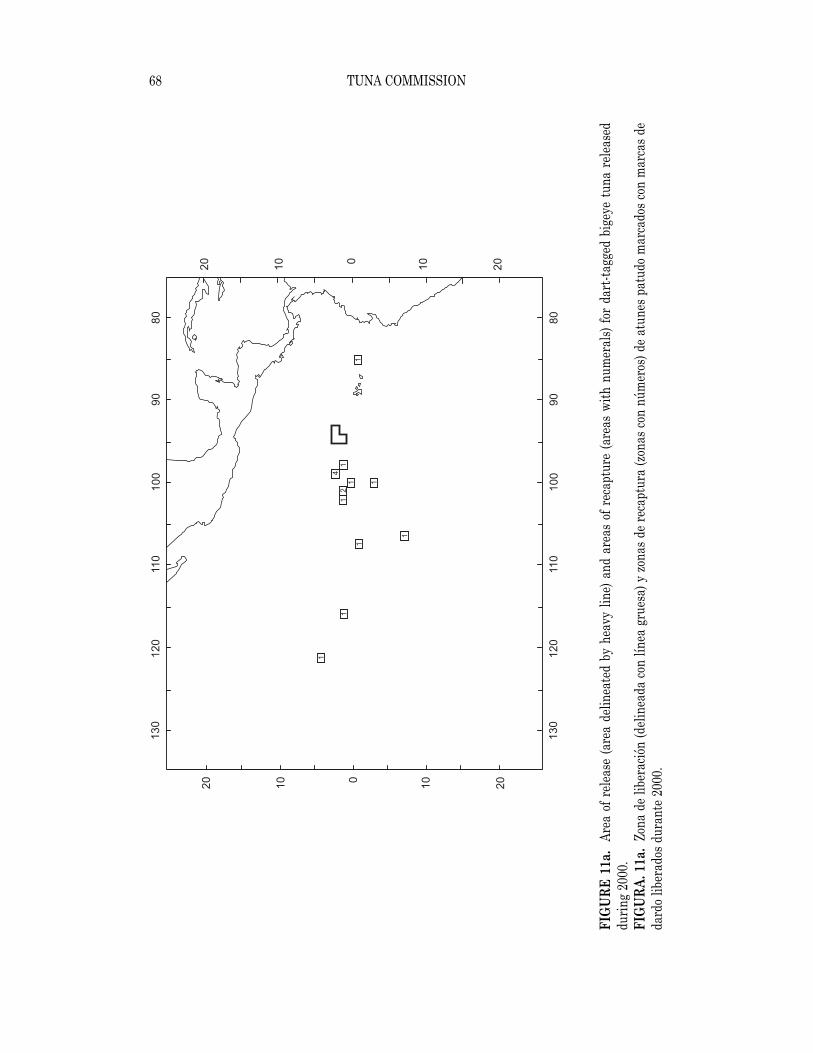
FIGU
RE 1
1a.
Area
of re
lease
(are
a de
linea
ted b
y he
avy
line)
and
area
s of r
ecap
ture
(are
as w
ith n
umer
als) f
or d
art-t
agge
d big
eye t
una
relea
sed
durin
g 200
0.FI
GURA
. 11a
.Zo
na de
libe
ració
n (d
eline
ada c
on lí
nea g
rues
a) y z
onas
de re
capt
ura (
zona
s con
núm
eros
) de a
tune
s pat
udo m
arca
dos c
on m
arca
s de
dard
o libe
rado
s dur
ante
2000
.
68 TUNA COMMISSION

FIGU
RE 1
1b.
Area
of re
lease
(are
a de
linea
ted b
y hea
vy li
ne) a
nd a
reas
of re
capt
ure (
area
s with
num
erals
) for
dar
t-tag
ged
skipj
ack
tuna
relea
sed
durin
g 200
0.FI
GURA
11b.
Zona
de li
bera
ción
(deli
nead
a con
líne
a gru
esa)
y zon
as de
reca
ptur
a (zo
nas c
on n
úmer
os) d
e atu
nes b
arril
ete m
arca
dos c
on m
arca
s de
dard
o libe
rado
s dur
ante
2000
.
ANNUAL REPORT 2000 69

FIGU
RE 12
.Min
imum
conv
ex po
lygon
s, ba
sed o
n dist
ribut
ions o
f arch
ival (
open
circl
es) a
nd da
rt (so
lid ci
rcles
) tag
data
, fro
m 18
bige
ye at
libe
rty fo
r30
days
or m
ore.
The
open
squa
res a
re th
e rele
ase l
ocat
ions.
FIGU
RA 12
.Polí
gono
s con
vexo
s mín
imos
, bas
ados
en la
distr
ibució
n de d
atos
de m
arca
s arch
ivado
ras (
círcu
los ab
iertos
) y de
dard
o (cír
culos
sólid
os),
de 18
patu
dos e
n lib
erta
d 30 o
más
días
. Lo
s cua
dros
abier
tos re
pres
enta
n pu
ntos
de li
bera
ción.
70 TUNA COMMISSION

FIGURE 13. One-week segments of the depth and temperature records from bigeye carryingarchival tags (A) after release and (B) before recapture at drifting fish-aggregating devices(FADs). The arrows indicate the times the FADs were (A) removed and (B) set on by the purse-seine vessel.FIGURA 13. Segmentos de una semana de los registros de profundidad y temperatura de patu-dos con marcas archivadoras (A) después de la liberación y (B) antes de la recaptura en planta-dos a la deriva. Las flechas indican la hora en que el buque cerquero sacó el plantado del agua(A) y realizó lance sobre el mismo (B).
ANNUAL REPORT 2000 71

FIGURE 14. Location of Achotines Bay, Panama. The Achotines Laboratory is located on theeast side of the bay. The dots on the transects represent sampling stations.FIGURA 14. Situación de la Bahía de Achotines, Panamá. El laboratorio está situado al bordeeste de la bahía. Los puntos en los transectos representan estaciones de muestreo.
72 TUNA COMMISSION

FIGU
RE 1
5a.
Sea-s
urfac
e tem
pera
ture
(SST
) ano
malie
s (de
partu
res f
rom
long-t
erm
norm
als) f
or F
ebru
ary 2
000,
base
d on
dat
a fro
m fis
hing
boa
tsan
d oth
er ty
pes o
f com
merci
al ve
ssels
. Th
e are
as w
ith S
STs f
rom
1° to
2°C
belo
w no
rmal
are h
atch
ed, a
nd th
ose m
ore t
han
2°C
below
nor
mal a
recro
ss h
atch
ed.
The c
ontou
rs ar
e das
hed i
n ar
eas o
f spa
rse d
ata.
FIGU
RA 15
a.An
omalí
as (v
ariac
iones
de lo
s nive
les no
rmale
s a la
rgo p
lazo)
de la
temp
erat
ura s
uper
ficial
del m
ar (T
SM) e
n feb
erer
o de 2
000,
basa
das
en d
atos
toma
dos p
or b
arco
s pes
quer
os y
otro
s buq
ues c
omer
ciales
. La
s TSM
en la
s zon
as so
mbre
adas
fuer
on d
e 1° a
2°C
infer
iores
a lo
nor
mal,
yaq
uélla
s en
las zo
nas c
on so
mbre
ado d
oble
más d
e 2°C
infer
iores
a lo
norm
al. C
ontor
nos d
e tra
zos s
ignifi
can
que l
os da
tos pa
ra es
a zon
a son
esca
sos.
ANNUAL REPORT 2000 73

FIGU
RE 1
5b.
Sea-s
urfac
e tem
pera
ture
(SST
) ano
malie
s (de
partu
res f
rom
long-t
erm
norm
als) f
or M
ay 2
000,
base
d on
dat
a fro
m fis
hing
boa
ts an
doth
er ty
pes o
f com
merci
al ve
ssels
. Th
e are
as w
ith S
STs f
rom
1° to
2°C
below
nor
mal a
re h
atch
ed, a
nd th
ose m
ore t
han
2°C
below
nor
mal a
re cr
oss
hatch
ed.
The c
ontou
rs ar
e das
hed i
n ar
eas o
f spa
rse d
ata.
FIGU
RA 15
b.An
omalí
as (v
ariac
iones
de lo
s nive
les n
orma
les a
largo
plaz
o) de
la te
mper
atur
a sup
erfic
ial de
l mar
(TSM
) en
mayo
de 20
00, b
asad
asen
dat
os to
mado
s por
bar
cos p
esqu
eros
y ot
ros b
uque
s com
ercia
les.
Las T
SM en
las z
onas
somb
read
as fu
eron
de 1
° a 2
°C in
ferior
es a
lo n
orma
l, y
aqué
llas e
n las
zona
s con
somb
read
o dob
le má
s de 2
°C in
ferior
es a
lo no
rmal.
Con
torno
s de t
razo
s sign
ifica
n qu
e los
datos
para
esa z
ona s
on es
caso
s.
74 TUNA COMMISSION

FIGU
RE 15
c.Se
a-su
rface
temp
erat
ure (
SST)
anom
alies
(dep
artu
res f
rom
long-t
erm
norm
als) f
or A
ugus
t 200
0, ba
sed o
n da
ta fr
om fi
shin
g boa
ts an
doth
er ty
pes o
f com
merci
al ve
ssels
. Th
e are
as w
ith S
STs f
rom
1° to
2°C
below
nor
mal a
re h
atch
ed, a
nd th
ose m
ore t
han
2°C
below
nor
mal a
re cr
oss
hatch
ed.
The c
ontou
rs ar
e das
hed i
n ar
eas o
f spa
rse d
ata.
FIGU
RA 15
c.An
omalí
as (v
ariac
iones
de lo
s nive
les n
orma
les a
largo
plaz
o) de
la te
mper
atur
a sup
erfic
ial de
l mar
(TSM
) en
agos
to de
2000
, bas
adas
en d
atos
toma
dos p
or b
arco
s pes
quer
os y
otro
s buq
ues c
omer
ciales
. La
s TSM
en la
s zon
as so
mbre
adas
fuer
on d
e 1° a
2°C
infer
iores
a lo
nor
mal,
yaq
uélla
s en
las zo
nas c
on so
mbre
ado d
oble
más d
e 2°C
infer
iores
a lo
norm
al. C
ontor
nos d
e tra
zos s
ignifi
can
que l
os da
tos pa
ra es
a zon
a son
esca
sos.
ANNUAL REPORT 2000 75

FIGU
RE 1
5d.
Sea-s
urfac
e tem
pera
ture
(SST
) ano
malie
s (de
partu
res f
rom
long-t
erm
norm
als) f
or D
ecem
ber 2
000,
base
d on
dat
a fro
m fis
hing
boat
san
d oth
er ty
pes o
f com
merci
al ve
ssels
. Th
e are
as w
ith S
STs f
rom
1° to
2°C
belo
w no
rmal
are h
atch
ed, a
nd th
ose m
ore t
han
2°C
below
nor
mal a
recro
ss h
atch
ed.
The c
ontou
rs ar
e das
hed i
n ar
eas o
f spa
rse d
ata.
FIGU
RA 1
5d.
Anom
alías
(var
iacion
es d
e los
nive
les n
orma
les a
larg
o pla
zo) d
e la
tempe
ratu
ra su
perfi
cial d
el ma
r (TS
M) e
n dic
iembr
e de
200
0,ba
sada
s en
datos
toma
dos p
or b
arco
s pes
quer
os y
otro
s buq
ues c
omer
ciales
. La
s TSM
en la
s zon
as so
mbre
adas
fuer
on d
e 1° a
2°C
infer
iores
a lo
norm
al, y
aqué
llas e
n las
zona
s con
somb
read
o dob
le má
s de 2
°C in
ferior
es a
lo n
orma
l. C
ontor
nos d
e tra
zos s
ignifi
can
que l
os d
atos
par
a es
a zo
naso
n es
caso
s.
76 TUNA COMMISSION

FIGURE 16. Average distributions of the stocks of spotted, spinner, and common dolphins inthe eastern Pacific Ocean (EPO).FIGURA 16. Distribuciones medias de los stocks de delfines manchado, tornillo, y común en elOcéano Pacífico oriental (OPO).
ANNUAL REPORT 2000 77

FIGURE 17. Estimated numbers of mortalities for the stocks of spotted and spinner dolphinsin the EPO. Each vertical line represents one positive and one negative standard error.FIGURA 17. Número estimado de mortalidades para los stocks de delfines manchado y tornilloen el OPO. Cada línea vertical representa un error estándar positivo y un error estándar neg-ativo.
78 TUNA COMMISSION

FIGURE 18. Estimated numbers of mortalities for all dolphins in the EPO. Each vertical linerepresents one positive and one negative standard error. FIGURA 18. Número estimado de mortalidades para todos delfines en el OPO. Cada línea ver-tical representa un error estándar positivo y un error estándar negativo.
ANNUAL REPORT 2000 79

FIGU
RE 1
9.Sp
atial
distr
ibutio
ns of
the a
vera
ge m
orta
lities
per s
et for
all d
olphi
ns co
mbin
ed du
ring 2
000.
FIGU
RA 1
9. Di
stribu
cione
s de l
as m
orta
lidad
es m
edias
por l
ance
para
todo
s los
delfi
nes c
ombin
ados
dura
nte 2
000.
80 TUNA COMMISSION

FIGURE 20a. Trends in indicators of performance in releasing dolphins alive.FIGURA 20a. Tendencias en los indicadores de desempeño en la liberación de delfines vivos.
FIGURE 20b. Trends in the malfunctions that can cause dolphin mortalities.FIGURA 20b. Tendencias enaverías de las red que pueden causar mortalidad de delfines.
ANNUAL REPORT 2000 81

FIGU
RE 21
.Esti
mates
of in
dices
of re
lative
abun
danc
e for
the n
orth
easte
rn st
ock o
f spo
tted d
olphi
n usin
g the
haza
rd-ra
te mo
del a
nd th
e half
-nor
mal
mode
l (Ta
ble 16
). T
he "m
odes
of se
arch
" ind
ex (T
able
16) i
s bas
ed on
a we
ighted
aver
age o
f ind
ices b
y mod
e of s
earch
.FI
GURA
21.
Estim
acion
es d
e los
índic
es d
e abu
ndan
cia re
lativa
par
a el
delfí
n ma
ncha
do n
oror
ienta
l usa
ndo l
os m
odelo
s de t
asa
de ri
esgo
y h
alfno
rmal
(Tab
la 16
). E
l índ
ice de
"mod
alida
d be b
úsqu
eda"
(Tab
la 16
) se b
asa e
n un
prom
edio
pond
erad
o de l
os ín
dices
por m
odali
dad d
e bús
qued
a.
82 TUNA COMMISSION

FIGU
RE 2
2.Ap
prox
imat
e poin
twise
95-p
erce
nt co
nfide
nce b
ands
comp
uted
for a
smoo
thin
g of
the t
ime s
eries
of in
dices
of re
lative
abu
ndan
ce of
north
easte
rn sp
otted
dolph
ins b
y mod
e of s
earch
(smo
othin
g bas
ed on
a loc
ally-w
eight
ed m
ovin
g lin
e with
a sm
ooth
ing p
aram
eter o
f 1.0)
.FI
GURA
22. B
anda
s de c
onfia
nza p
untu
ales d
e 95%
apro
ximad
as ca
lculad
as pa
ra un
a sua
vizac
ión de
la se
rie de
tiem
po de
los í
ndice
s de a
bund
ancia
relat
iva d
el de
lfín
manc
hado
nor
orien
tal p
or m
odali
dad
de b
úsqu
eda
(suav
izació
n ba
sada
en u
na lí
nea
móvil
con
pond
erac
ión lo
cal c
on u
n pr
ámetr
ode
suav
izació
n de
1,0).
ANNUAL REPORT 2000 83
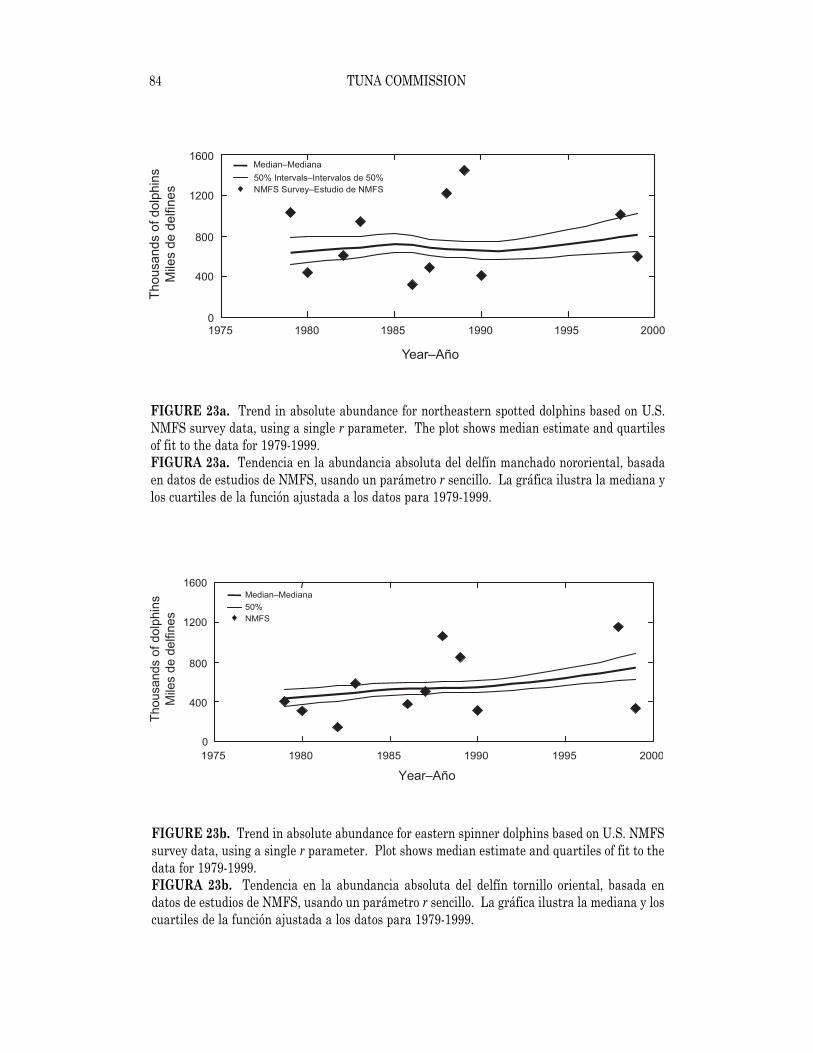
FIGURE 23a. Trend in absolute abundance for northeastern spotted dolphins based on U.S.NMFS survey data, using a single r parameter. The plot shows median estimate and quartilesof fit to the data for 1979-1999.FIGURA 23a. Tendencia en la abundancia absoluta del delfín manchado nororiental, basadaen datos de estudios de NMFS, usando un parámetro r sencillo. La gráfica ilustra la mediana ylos cuartiles de la función ajustada a los datos para 1979-1999.
FIGURE 23b. Trend in absolute abundance for eastern spinner dolphins based on U.S. NMFSsurvey data, using a single r parameter. Plot shows median estimate and quartiles of fit to thedata for 1979-1999.FIGURA 23b. Tendencia en la abundancia absoluta del delfín tornillo oriental, basada endatos de estudios de NMFS, usando un parámetro r sencillo. La gráfica ilustra la mediana y loscuartiles de la función ajustada a los datos para 1979-1999.
84 TUNA COMMISSION

FIGURE 24a. Cumulative distribution function of the net growth rate of northeastern spotteddolphins for 1979-1999 (single r parameter).FIGURA 24a. Función acumulativa de la distribución de la tasa neta de crecimiento del delfínmanchado nororiental, 1979-1999 (parámetro r sencillo).
FIGURE 24b. Cumulative distribution function of the net growth rate of eastern spinner dol-phins for 1979-1999 (single r parameter).FIGURA 24b. Función acumulativa de la distribución de la tasa neta de crecimiento del delfíntornillo oriental, 1979-1999 (parámetro r sencillo).
ANNUAL REPORT 2000 85

FIGU
RE 2
5.Di
stribu
tion
of do
lphin
mor
talit
y ca
used
by
vess
els w
ith fu
ll-ye
ar D
MLs
dur
ing
2000
. ? i
ndica
tes th
at on
e par
tially
-obse
rved
trip
isin
clude
d; ??
indic
ates
that
one t
rip w
ithou
t an
obse
rver
is in
clude
d.FI
GURA
25.
Distr
ibució
n de
la m
orta
lidad
de d
elfin
es ca
usad
a po
r buq
ues c
on L
MD
de a
ño co
mplet
o dur
ante
2000
. ? i
ndica
que
inclu
ye u
n via
jepa
rcialm
ente
obse
rvad
o; ??
indic
a que
inclu
ye u
n via
je sin
obse
rvad
or.
86 TUNA COMMISSION
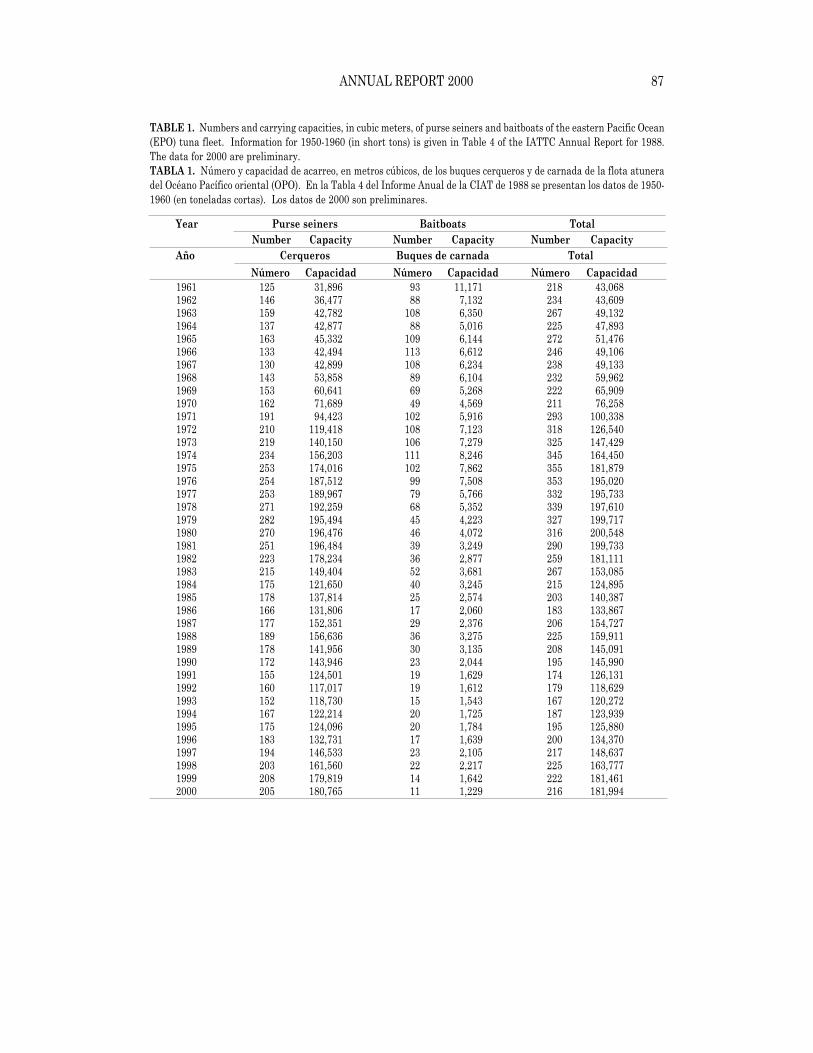
TABLE 1. Numbers and carrying capacities, in cubic meters, of purse seiners and baitboats of the eastern Pacific Ocean(EPO) tuna fleet. Information for 1950-1960 (in short tons) is given in Table 4 of the IATTC Annual Report for 1988.The data for 2000 are preliminary.TABLA 1. Número y capacidad de acarreo, en metros cúbicos, de los buques cerqueros y de carnada de la flota atuneradel Océano Pacífico oriental (OPO). En la Tabla 4 del Informe Anual de la CIAT de 1988 se presentan los datos de 1950-1960 (en toneladas cortas). Los datos de 2000 son preliminares.
Year Purse seiners Baitboats TotalNumber Capacity Number Capacity Number Capacity
Año Cerqueros Buques de carnada TotalNúmero Capacidad Número Capacidad Número Capacidad
1961 125 31,896 93 11,171 218 43,0681962 146 36,477 88 7,132 234 43,6091963 159 42,782 108 6,350 267 49,1321964 137 42,877 88 5,016 225 47,8931965 163 45,332 109 6,144 272 51,4761966 133 42,494 113 6,612 246 49,1061967 130 42,899 108 6,234 238 49,1331968 143 53,858 89 6,104 232 59,9621969 153 60,641 69 5,268 222 65,9091970 162 71,689 49 4,569 211 76,2581971 191 94,423 102 5,916 293 100,3381972 210 119,418 108 7,123 318 126,5401973 219 140,150 106 7,279 325 147,4291974 234 156,203 111 8,246 345 164,4501975 253 174,016 102 7,862 355 181,8791976 254 187,512 99 7,508 353 195,0201977 253 189,967 79 5,766 332 195,7331978 271 192,259 68 5,352 339 197,6101979 282 195,494 45 4,223 327 199,7171980 270 196,476 46 4,072 316 200,5481981 251 196,484 39 3,249 290 199,7331982 223 178,234 36 2,877 259 181,1111983 215 149,404 52 3,681 267 153,0851984 175 121,650 40 3,245 215 124,8951985 178 137,814 25 2,574 203 140,3871986 166 131,806 17 2,060 183 133,8671987 177 152,351 29 2,376 206 154,7271988 189 156,636 36 3,275 225 159,9111989 178 141,956 30 3,135 208 145,0911990 172 143,946 23 2,044 195 145,9901991 155 124,501 19 1,629 174 126,1311992 160 117,017 19 1,612 179 118,6291993 152 118,730 15 1,543 167 120,2721994 167 122,214 20 1,725 187 123,9391995 175 124,096 20 1,784 195 125,8801996 183 132,731 17 1,639 200 134,3701997 194 146,533 23 2,105 217 148,6371998 203 161,560 22 2,217 225 163,7771999 208 179,819 14 1,642 222 181,4612000 205 180,765 11 1,229 216 181,994
ANNUAL REPORT 2000 87

TABLE 2a. Estimates of the numbers and carrying capacities, in cubic meters, of the purse seiners and baitboats ofthe EPO tuna fleet in 1999 by flag, gear, and size class. Each vessel is included in the totals for each flag under whichit fished during the year, but is included only once in "Grand total." Therefore the grand totals may not equal the sumsof the individual flag entries. PS = purse seiner; BB = baitboat.TABLA 2a. Estimaciones del número y capacidad de acarreo, en metros cúbicos, de buques cerqueros y de carnada dela flota atunera en el OPO en 1999, por bandera, arte de pesca, y clase de arqueo. Se incluye cada buque en los totalesde cada bandera bajo la cual pescó durante el año, pero solamente una vez en el "Total general"; por consiguiente, lostotales generales no equivalen necesariamente a las sumas de las banderas individuales. PS = cerquero; BB = barcode carnada.
Flag Gear Size class−−Clase de arqueo CapacityBandera Arte 1 2 3 4 5 6 Total Capacidad
Number−−NúmeroBelize−Belice PS - - 1 1 1 3 6 3,691Colombia PS - - 2 - 2 5 9 7,130Ecuador PS - 7 14 11 5 36 73 44,558España−Spain PS - - - - - 5 5 11,466Guatemala PS - - - - - 4 4 7,640Honduras PS - - - - - 2 2 1,926México PS - - 8 3 3 40 54 47,411
BB 1 4 7 - - - 12 1,501Nicaragua PS - - - - - 1 1 1,229Panamá PS - - 2 3 - 4 9 8,082El Salvador PS - - - - - 2 2 1,523USA−EE.UU. PS - 4 3 - 2 5 14 8,039
BB 1 1 - - - - 2 141Venezuela PS - - - - - 23 23 27,733Vanuatu PS - - - - - 11 11 13,355
Grand total PS - 11 29 18 13 137 208Total general BB 2 5 7 - - - 14
PS+BB 2 16 36 18 13 137 222Capacity−−Capacidad
Grand total PS - 1,184 4,939 5,117 6,280 162,299 179,819Total general BB 95 482 1,065 - - - 1,642
PS+BB 95 1,666 6,004 5,117 6,280 162,299 181,461
88 TUNA COMMISSION

TABLE 2b. Preliminary estimates of the numbers and carrying capacities, in cubic meters, of the purse seiners andbaitboats of the EPO tuna fleet in 2000 by flag, gear, and size class. Each vessel is included in the totals for each flagunder which it fished during the year, but is included only once in "Grand total." Therefore the grand totals may notequal the sums of the individual flag entries. PS = purse seiner; BB = baitboat.TABLA 2b. Estimaciones preliminares del número y capacidad de acarreo, en metros cúbicos, de buques cerqueros yde carnada de la flota atunera en el OPO en 2000, por bandera, arte de pesca, y clase de arqueo. Se incluye cada buqueen los totales de cada bandera bajo la cual pescó durante el año, pero solamente una vez en el "Total general"; por con-siguiente, los totales generales no equivalen necesariamente a las sumas de las banderas individuales. PS = cerquero;BB = barco de carnada.
Flag Gear Size class−−Clase de arqueo CapacityBandera Arte 1 2 3 4 5 6 Total Capacidad
Number−−NúmeroBelize−Belice PS - - - 1 1 2 4 2,249Bolivia PS - - - - - 3 3 3,956Colombia PS - - 2 - 2 5 9 7,130Ecuador PS 7 13 13 6 36 75 45,814
BB 1 - - - - - 1 32España−Spain PS - - - - - 5 5 11,466Guatemala PS - - - - - 4 4 7,640Honduras PS - - - - - 1 1 628México PS - - 7 3 4 40 54 48,358
BB 1 4 5 - - - 10 1,197Nicaragua PS - - - - - 1 1 1,229Panamá PS - - 2 2 - 5 9 8,413USA−EE.UU. PS - 3 2 - 2 6 13 9,229Venezuela PS - - - - - 22 22 28,025Vanuatu PS - - - - - 11 11 13,668
Grand total PS - 10 26 19 15 135 205Total general BB 2 4 5 - - - 11
PS+BB 2 14 31 19 15 135 216Capacity−−Capacidad
Grand total PS - 984 4,654 5,470 7,118 162,539 180,765Total general BB 85 383 761 - - - 1,229
PS+BB 85 1,367 5,415 5,470 7,118 162,539 181,994
ANNUAL REPORT 2000 89

TABL
E 3.
Estim
ated
reta
ined
and
disc
arde
d ca
tches
by
surfa
ce g
ear,
in m
etric
tons,
of th
e EPO
tuna
flee
t. "O
ther
s" in
clude
s sha
rks,
other
tuna
s, an
d mi
scell
aneo
us fi
shes
; CYR
A =
Comm
ission
's Ye
llowf
in R
egul
ator
y Are
a; Ou
tside
= ar
ea be
twee
n th
e CYR
A an
d 15
0°W
. Th
e 199
9 and
2000
dat
a are
pre
limin
ary.
Add
ition
al in
forma
tion
conc
erni
ng th
is ta
ble is
give
nin
the t
ext.
TABL
A 3.
Estim
acion
es de
capt
uras
reten
idas y
desc
arta
das,
en to
nelad
as m
étrica
s, po
r arte
s de s
uper
ficie
de la
flota
atun
era d
el OP
O. "
Otro
s" in
cluye
tibu
rone
s, otr
os at
unes
, y pe
ces
diver
sos;
ARCA
A =
Area
de R
egul
ación
de l
a Co
misió
n pa
ra el
Alet
a Am
arill
a; Ex
terior
= zo
na en
tre el
ARC
AA y
150°
O. L
os d
atos
de 1
999
y 200
0 so
n pr
elimi
nare
s. En
el te
xto s
e pre
-se
nta i
nfor
mació
n ad
icion
al so
bre e
sta ta
bla.
Yello
wfin
Skip
jack
Bige
yeBl
uefin
Year
Re
tain
edDi
scar
ded
Tota
lRe
tain
edDi
scar
ded
Tota
lRe
tain
edDi
scar
ded
Tota
lRe
tain
edDi
scar
ded
Tota
lCY
RAOu
tsid
eTo
tal
Alet
a am
arill
aBa
rrile
tePa
tudo
Al
eta
azul
Año
Rete
nido
Desc
arta
doTo
tal
Rete
nido
Desc
arta
doTo
tal
Rete
nido
Desc
arta
doTo
tal
Rete
nido
Desc
arta
doTo
tal
ARCA
AAf
uera
Tota
l19
70
127,7
9327
,833
155,6
2615
5,626
56,02
056
,020
1,332
1,332
3,966
3,9
6619
7110
2,194
20,64
512
2,839
122,8
3910
4,721
104,7
212,5
662,5
668,3
608,3
6019
7213
6,515
40,61
217
7,127
177,1
2733
,409
33,40
92,2
382,2
3813
,347
13,34
719
7316
0,341
44,91
220
5,253
205,2
5343
,954
43,95
41,9
791,9
7910
,744
10,74
419
7417
3,180
37,18
421
0,364
210,3
6478
,803
78,80
389
089
05,6
175,6
1719
7515
8,843
43,29
920
2,142
202,1
4212
3,868
123,8
683,7
233,7
239,5
839,5
8319
7619
0,216
46,11
123
6,327
236,3
2712
6,161
126,1
6110
,186
10,18
610
,645
10,64
519
7718
2,676
16,14
019
8,816
198,8
1686
,337
86,33
77,0
557,0
555,4
735,4
7319
7816
5,985
14,54
918
0,534
180,5
3416
9,810
169,8
1011
,714
11,71
45,3
975,3
9719
7917
5,906
13,76
818
9,674
189,6
7413
2,024
132,0
247,5
327,5
326,1
176,1
1719
8013
1,998
27,42
715
9,425
159,4
2513
0,671
130,6
7115
,421
15,42
12,9
392,9
3919
8115
7,733
24,08
018
1,813
181,8
1311
9,606
119,6
0610
,091
10,09
11,0
891,0
8919
8210
6,868
18,21
612
5,084
125,0
8498
,757
98,75
74,1
024,1
023,1
503,1
5019
8382
,026
12,23
094
,256
94,25
658
,142
58,14
23,2
603,2
6085
385
319
8412
8,559
16,50
214
5,061
145,0
6160
,551
60,55
15,9
365,9
3688
188
119
8519
2,543
24,44
921
6,992
216,9
9249
,460
49,46
04,5
324,5
324,0
554,0
5519
8622
8,125
40,14
926
8,274
268,2
7463
,552
63,55
21,9
391,9
395,0
855,0
8519
8724
8,153
24,09
427
2,247
272,2
4762
,345
62,34
577
677
61,0
051,0
0519
8826
7,263
20,81
128
8,074
288,0
7485
,326
85,32
61,0
531,0
531,4
241,4
2419
8924
2,342
47,03
328
9,375
289,3
7592
,374
92,37
41,4
701,4
701,1
701,1
7019
9022
6,465
46,86
427
3,329
273,3
2972
,575
72,57
54,7
124,7
121,5
421,5
4219
9121
9,525
19,59
623
9,121
239,1
2163
,260
63,26
03,7
403,7
4046
146
119
9222
1,309
18,54
023
9,849
239,8
4983
,964
83,96
45,4
975,4
971,9
991,9
9919
9321
3,258
18,81
323
2,071
5,040
237,1
1187
,357
10,58
997
,946
8,069
585
8,654
879
087
919
9419
7,064
22,19
721
9,261
4,614
223,8
7574
,534
10,31
484
,848
29,37
52,3
0431
,679
1,062
01,0
6219
9519
6,220
27,55
622
3,776
5,344
229,1
2013
8,239
16,61
415
4,853
37,32
83,2
6040
,588
874
087
419
9621
8,114
32,05
625
0,170
6,660
256,8
3011
2,205
24,97
013
7,175
51,35
35,7
8657
,139
8,259
08,2
5919
9721
4,277
43,55
425
7,831
5,631
263,4
6216
1,809
31,86
719
3,676
51,61
95,6
2757
,246
2,807
32,8
1019
9823
6,503
29,21
626
5,719
4,718
270,4
3714
5,000
22,85
616
7,856
35,15
52,8
5338
,008
2,223
02,2
2319
9926
4,739
32,17
629
6,915
6,628
303,5
4326
8,021
26,81
329
4,834
41,16
35,1
6646
,329
3,091
553,1
4620
0022
0,545
51,47
427
2,019
6,796
278,8
1520
9,968
26,29
823
6,266
69,74
55,6
2475
,639
4,098
04,0
98
90 TUNA COMMISSION

TABL
E 3.
(cont
inue
d)TA
BLA
3.(co
ntin
uació
n)Al
baco
reBo
nito
Blac
k sk
ipja
ckOt
hers
Al
l spe
cies
com
bine
dYe
arRe
tain
ed
Disc
arde
dTo
tal
Reta
ined
Disc
arde
dTo
tal
Reta
ined
Disc
arde
dTo
tal
Reta
ined
Disc
arde
d To
tal
Reta
ined
Di
scar
ded
To
tal
Alba
cora
Bo
nito
Barr
ilete
neg
roOt
ros
Toda
s las
esp
ecie
sAñ
o Re
teni
do
Desc
arta
doTo
tal
Rete
nido
Des
cart
ado
Tota
l Re
teni
do D
esca
rtad
oTo
tal
Rete
nido
Desc
arta
doTo
tal
Rete
nido
Desc
arta
doTo
tal
1970
4,476
4,476
4,738
4,738
00
2727
226,1
8522
6,185
1971
2,490
2,490
9,600
9,600
66
6161
250,6
4325
0,643
1972
4,832
4,832
8,872
8,872
601
601
367
367
240,7
9324
0,793
1973
2,316
2,316
7,864
7,864
1,674
1,674
355
355
274,1
3927
4,139
1974
4,783
4,783
4,436
4,436
3,742
3,742
985
985
309,6
2030
9,620
1975
3,332
3,332
16,83
816
,838
511
511
277
277
360,2
7436
0,274
1976
3,733
3,733
4,370
4,370
1,526
1,526
1,327
1,327
394,2
7539
4,275
1977
1,963
1,963
11,27
511
,275
1,458
1,458
1,950
1,950
314,3
2731
4,327
1978
1,745
1,745
4,837
4,837
2,162
2,162
806
806
377,0
0537
7,005
1979
327
327
1,805
1,805
1,366
1,366
1,249
1,249
340,0
9434
0,094
1980
601
601
6,110
6,110
3,680
3,680
953
953
319,8
0031
9,800
1981
739
739
5,918
5,918
1,911
1,911
1,010
1,010
322,1
7732
2,177
1982
553
553
2,121
2,121
1,338
1,338
783
783
235,8
8823
5,888
1983
456
456
3,829
3,829
1,236
1,236
1,709
1,709
163,7
4116
3,741
1984
5,351
5,351
3,514
3,514
666
666
987
987
222,9
4722
2,947
1985
919
919
3,604
3,604
296
296
536
536
280,3
9428
0,394
1986
133
133
490
490
595
595
1,140
1,140
341,2
0834
1,208
1987
417
417
3,326
3,326
557
557
1,612
1,612
342,2
8534
2,285
1988
288
288
9,550
9,550
1,267
1,267
1,297
1,297
388,2
7938
8,279
1989
11
12,09
512
,095
783
783
1,072
1,072
398,3
4039
8,340
1990
184
184
13,85
613
,856
792
792
944
944
367,9
3436
7,934
1991
834
834
1,288
1,288
446
446
649
649
309,7
9930
9,799
1992
255
255
978
978
104
104
762
762
333,4
0833
3,408
1993
10
159
912
611
104
3,950
4,054
314
1,981
2,295
329,3
9422
,157
351,5
5119
9485
085
8,692
145
8,837
188
805
993
419
522
941
333,6
1618
,704
352,3
2019
9546
52
467
8,009
558,0
6418
71,4
151,6
0217
266
884
040
9,050
27,35
843
6,408
1996
830
8365
51
656
704
2,417
3,121
219
1,052
1,271
423,6
4840
,886
464,5
3419
9760
060
1,104
41,1
0810
12,5
822,6
8314
83,4
073,5
5547
5,479
49,12
152
4,600
1998
124
012
41,3
374
1,341
527
1,857
2,384
168
1,233
1,401
450,2
5333
,521
483,7
7419
9927
60
276
1,597
01,5
9717
83,4
123,5
9024
03,0
963,3
3661
1,481
45,17
065
6,651
2000
151
015
160
50
605
244
1,870
2,144
374
1,846
1,860
557,2
0442
,074
599,2
78
ANNUAL REPORT 2000 91

TABL
E 4a
.Es
timat
es of
the c
atch
es a
nd la
ndin
gs, i
n me
tric t
ons,
of tu
nas c
augh
t by s
urfac
e gea
r in
the E
PO in
199
9, by
spec
ies a
nd ve
ssel
flag (
uppe
r pan
el) a
nd lo
catio
n wh
ere p
ro-
cess
ed (l
ower
pane
l). Y
FT =
yello
wfin
; SKJ
= sk
ipjac
k; BE
T =
bigey
e; PB
F =
Pacif
ic blu
efin;
BEP
= bo
nito;
ALB
= al
baco
re; B
KJ =
blac
k sk
ipjac
k; M
isc. =
othe
r spe
cies,
inclu
ding s
hark
s,oth
er tu
nas,
and m
iscell
aneo
us fi
shes
.TA
BLA
4a.E
stima
cione
s de l
as ca
ptur
as y
desc
arga
s de a
tún
capt
urad
o con
artes
de su
perfi
cie en
el O
PO en
1999
, por
espe
cie y
band
era d
el bu
que (
pane
l sup
erior
) y lo
calid
ad do
nde f
uepr
oces
ado (
pane
l inf
erior
), en t
onela
das m
étrica
s. Y
FT =
aleta
amar
illa;
SKJ =
barri
lete;
BET
= pat
udo;
PBF
= alet
a azu
l del
Pacíf
ico; B
EP =
boni
to; A
LB =
albac
ora;
BKJ =
barri
lete n
egro
;M
isc. =
otra
s esp
ecies
, inc
luye
ndo t
iburo
nes,
otros
túni
dos,
y pec
es di
vers
os.
Flag
YFT
% of
tota
lSK
JBE
TPB
FBE
PAL
BBS
JM
isc.
Tota
lBa
nder
aCY
RA−− A
RCAA
Outs
ide−−
Exte
rior
% de
l tot
alCa
tche
s−−Ca
ptur
asCo
lombia
12,61
729
411
,766
1,416
--
--
8626
,179
4.3Co
sta R
ica30
-96
20-
--
--
146
0.0Ec
uado
r55
,686
4,197
126,8
7019
,047
--
-6
7520
5,881
33.7
Espa
ña−S
pain
4,8
624,2
7335
,201
10,63
2-
--
-20
54,98
89.0
Méx
ico10
0,136
14,88
819
,773
365
2,373
1,573
2372
5713
9,260
22.8
Pana
má6,1
78-
5,023
961
--
--
-12
,162
2.0U.
S.A.
−EE.
UU.
3,958
371
13,80
41,7
5771
824
253
642
20,95
13.4
Vene
zuela
52,01
56,0
0114
,582
7-
--
35-
72,64
011
.9Va
nuat
u18
,043
1,277
21,91
44,3
87-
--
--
45,62
17.5
Othe
r−Ot
ros1
11,21
487
518
,992
2,571
--
-1
-33
,653
5.5To
tal
264,7
3932
,176
268,0
2141
,163
3,091
1,597
276
178
240
611,4
81La
ndin
gs−− D
esca
rgas
Colom
bia34
,456
2,724
30,12
14,2
75-
--
36
71,58
511
.3Co
sta R
ica24
,429
1,992
11,06
188
5-
--
25-
38,39
26.1
Ecua
dor
69,59
46,8
2517
2,720
27,13
3-
--
1015
027
6,432
43.7
Espa
ña−S
pain
3,2
8788
110
,342
4,978
--
--
1319
,501
3.1M
éxico
86,23
012
,639
18,01
416
81,3
031,5
7223
7256
120,0
7719
.0U.
S.A.
−EE.
UU.
3,573
187
15,09
42,5
0253
424
252
631
22,23
03.5
Vene
zuela
24,80
43,1
087,5
724
--
-78
-35
,566
5.6Ot
her−
Otro
s220
,271
5,408
16,87
64,2
691,2
52-
--
-48
,076
7.2To
tal
266,6
4433
,764
281,8
0044
,214
3,089
1,596
275
251
226
631,8
59
1 Inc
lude
s Beli
ze, E
l Salv
ador
, Gua
temala
, Hon
dura
s, an
d Nica
ragu
a. T
his c
ateg
ory i
s use
d to a
void
reve
aling
the o
pera
tions
of in
dividu
al ve
ssels
or co
mpan
ies.
1 Inc
luye
Beli
ce, E
l Salv
ador
, Gua
temala
, Hon
dura
s, y N
icara
gua.
Se u
sa es
ta ca
tegor
ía pa
ra n
o rev
elar i
nfor
mació
n so
bre l
as ac
tivida
des d
e buq
ues o
empr
esas
indiv
iduale
s.2 I
nclu
des A
lgeria
, Ita
ly, Ja
pan,
Liby
a, Th
ailan
d, an
d Tur
key.
Thi
s cat
egor
y is u
sed t
o avo
id re
veali
ng th
e ope
ratio
ns of
indiv
idua
l ves
sels
or co
mpan
ies.
2 Inc
luye
Arg
elia,
Italia
, Jap
ón, L
ibia,
Taila
ndia,
y Tu
rquí
a. S
e usa
esta
categ
oría
para
no r
evela
r inf
orma
ción
sobr
e las
activ
idade
s de b
uque
s o em
pres
as in
dividu
ales.
92 TUNA COMMISSION

TABL
E 4b
. Pr
elimi
nary
estim
ates
of th
e cat
ches
and
landin
gs, i
n me
tric t
ons,
of tu
nas c
augh
t by s
urfac
e gea
r in
the E
PO in
2000
, by s
pecie
s and
vess
el fla
g (up
per p
anel)
and
locat
ionwh
ere p
roce
ssed
(low
er pa
nel).
YFT
= ye
llowf
in; S
KJ =
skipj
ack;
BET
= bige
ye; P
BF =
Pacif
ic blu
efin;
BEP
= bon
ito; A
LB =
albac
ore;
BKJ =
blac
k ski
pjack
; Misc
. = ot
her s
pecie
s, in
cludin
gsh
arks
, oth
er tu
nas,
and m
iscell
aneo
us fi
shes
TABL
A 4b
.Esti
macio
nes p
relim
inar
es de
las c
aptu
ras y
desc
arga
s de a
tún
capt
urad
o con
artes
de su
perfi
cie en
el O
PO en
2000
, por
espe
cie y
band
era d
el bu
que (
pane
l sup
erior
) y lo
cal-
idad d
onde
fue p
roce
sado
(pan
el in
ferior
), en
tone
ladas
métr
icas.
YFT
= al
eta am
arill
a; SK
J = ba
rrilet
e; BE
T =
patu
do; P
BT =
aleta
azul
del P
acífi
co; B
EP =
boni
to; A
LB =
alba
cora
; BKJ
= ba
rrilet
e neg
ro; M
isc. =
otra
s esp
ecies
, inc
luye
ndo t
iburo
nes,
otros
túni
dos,
y pec
es di
vers
os
Flag
YFT
% of
tota
lSK
JBE
TPB
FBE
PAL
BBS
JM
isc.
Tota
lBa
nder
aCY
RA−− A
RCAA
Outs
ide−−
Exte
rior
% de
l tot
alCa
tche
s−−Ca
ptur
asCo
lombia
13,14
63,5
086,2
021,0
22-
--
--
23,87
84.3
Ecua
dor
33,77
14,5
3710
9,601
27,66
9-
--
220
9517
5,893
31.6
Espa
ña−S
pain
3,219
2,655
16,48
117
,268
--
--
-39
,623
7.1M
éxico
78,68
523
,163
16,37
282
3,091
428
922
221
122,1
3621
.9Pa
namá
5,604
466
12,22
53,9
26-
--
1029
22,26
04.0
U.S.
A.−E
E.UU
.3,1
011,0
7810
,665
2,067
1,007
177
59-
2918
,183
3.3Ve
nezu
ela58
,483
11,27
25,1
3920
6-
--
12-
75,11
213
.5Va
nuat
u11
,326
2,742
10,98
06,2
83-
--
--
31,33
15.6
Othe
r−Ot
ros1
13,21
02,0
5322
,303
11,22
2-
--
--
48,78
88.8
Tota
l22
0,545
51,47
420
9,968
69,74
54,0
9860
515
124
437
455
7,204
Land
ings
−− Des
carg
asCo
lombia
30,30
38,6
7315
,865
5,356
--
-10
-60
,207
11.0
Costa
Rica
15,06
425
83,9
4280
5-
--
--
20,06
93.7
Ecua
dor
43,96
46,8
8113
1,638
34,81
1-
--
219
135
217,6
4839
.8Es
paña
−Spa
in4,4
032,3
439,4
0112
,608
--
5-
-28
,760
5.2M
éxico
73,72
422
,581
14,93
294
43,0
3042
786
622
111
5,951
21.2
Peru
608
-1;6
90-
--
--
-2,2
98.4
U.S.
A.−E
E.UU
2,430
1,178
6,946
1,958
677
176
592
2413
,450
2.5Ve
nezu
ela24
,797
3,204
3,391
52-
--
6-
31,45
05.7
Othe
r−Ot
ros2
20,42
53,3
1318
,669
14,75
869
0-
--
-57
,555
10.5
Tota
l21
5,718
48,43
120
6,474
71,29
24,0
9760
315
024
338
054
7,388
1 Inc
lude
s Beli
ze, B
olivia
, Gua
temala
, Hon
dura
s, Ni
cara
gua,
and u
nide
ntifi
ed.
This
categ
ory i
s use
d to a
void
reve
aling
the o
pera
tions
of in
dividu
al ve
ssels
or co
mpan
ies.
1 Inc
luye
Beli
ce, B
olivia
, Gua
temala
, Hon
dura
s, Ni
cara
gua,
y no i
dent
ifica
dos.
Se u
sa es
ta ca
tegor
ía pa
ra n
o rev
elar i
nfor
mació
n so
bre l
as ac
tivida
des d
e buq
ues o
empr
esas
indiv
iduale
s.2 I
nclu
des G
hana
, Ita
ly, L
ibya,
and T
urke
y, T
his c
ateg
ory i
s use
d to a
void
reve
aling
the o
pera
tions
of in
dividu
al ve
ssels
or co
mpan
ies.
2 Inc
luye
Gha
na, I
talia
, Libi
a, y T
urqu
ía. S
e usa
esta
categ
oría
para
no r
evela
r inf
orma
ción
sobr
e las
activ
idade
s de b
uque
s o em
pres
as in
dividu
ales.
ANNUAL REPORT 2000 93

TABLE 5. Estimated numbers of sets by set type and vessel size class, and estimated catches, in metric tons, for yel-lowfin, skipjack, and bigeye tuna in the EPO, by purse-seine vessels. The data for 2000 are preliminary.TABLA 5. Números estimados de lances, por tipo de lance y clase de arqueo de los buques, y capturas estimadas, entoneladas métricas, de atunes aleta amarilla, barrilete, y patudo en el OPO. Los datos de 2000 son preliminares.
Sets on fish associated with dolphinsYear Number of sets Catch
Classes 1-5 Class 6 Total Yellowfin Skipjack BigeyeLances sobre peces asociados con delfines
Año Número de lances CapturaClases 1-5 Clase 6 Total Aleta amarilla Barrilete Patudo
1987 33 13,286 13,319 190,434 138 241988 40 11,160 11,200 157,274 4,860 01989 29 12,827 12,856 195,043 1,502 01990 29 10,997 11,026 179,523 601 01991 0 9,661 9,661 159,265 717 01992 25 10,398 10,423 169,430 734 01993 34 6,953 6,987 110,405 697 981994 3 7,804 7,807 124,955 437 01995 0 7,185 7,185 131,499 938 01996 2 7,472 7,474 135,608 736 01997 35 8,977 9,012 153,654 6,222 351998 0 10,645 10,645 149,892 2,991 641999 0 8,648 8,648 142,056 1,116 02000 1 9,235 9,236 152,658 499 0
Sets on fish associated with floating objectsYear Number of sets Catch
Classes 1-5 Class 6 Total Yellowfin Skipjack BigeyeLances sobre peces asociados con objetos flotantes
Año Número de lances CapturaClases 1-5 Clase 6 Total Aleta amarilla Barrilete Patudo
1987 1,311 1,813 3,124 27,232 32,049 4741988 775 2,281 3,056 23,573 35,355 7501989 953 2,339 3,292 28,220 41,269 1,2311990 721 2,558 3,279 34,244 35,080 3,4661991 795 2,165 2,960 23,642 37,821 1,9711992 877 1,763 2,640 13,168 45,583 1,1891993 491 2,063 2,554 16,389 47,812 4,4981994 621 2,770 3,391 17,743 47,804 27,3911995 671 3,521 4,192 21,540 80,705 32,6341996 1194 4,007 5,201 34,343 73,702 48,2211997 1685 5,652 7,337 31,115 122,299 50,2331998 1204 5,481 6,685 35,192 114,532 31,3281999 624 4,620 5,244 42,368 182,423 36,5162000 621 3,916 4,537 53,617 127,229 62,968
94 TUNA COMMISSION

TABLE 5. (continued)TABLA 5. (continuación)
Sets on fish in unassociated schoolsYear Number of sets Catch
Classes 1-5 Class 6 Total Yellowfin Skipjack BigeyeLances sobre peces en cardúmenes no asociados
Año Número de lances CapturaClases 1-5 Clase 6 Total Aleta amarilla Barrilete Patudo
1987 1,799 3,981 5,780 49,350 26,606 2751988 3,978 7,536 11,514 101,967 40,166 2981989 2,925 5,878 8,803 60,168 46,456 2381990 3,665 5,397 9,062 56,279 35,954 1,2421991 3,932 3,612 7,544 52,875 22,858 1,7431992 4,148 4,079 8,227 53,312 35,437 4,3061993 5,755 6,267 12,022 100,186 35,212 3,4701994 5,404 5,064 10,468 72,767 23,130 1,9271995 6,021 4,782 10,803 69,490 51,310 4,6901996 5,721 5,118 10,839 76,487 35,186 3,1331997 5,299 4,694 9,993 68,677 29,997 1,3481998 5,617 4,631 10,248 75,506 25,834 3,7641999 5,519 6,143 11,662 110,504 82,469 4,6262000 5,838 5,482 11,320 71,873 82,347 6,777
Sets on all types of schoolsYear Number of sets Catch
Classes 1-5 Class 6 Total Yellowfin Skipjack BigeyeLances sobre todos tipos de cardumen
Año Número de lances CapturaClases 1-5 Clase 6 Total Aleta amarilla Barrilete Patudo
1987 3,143 19,080 22,223 267,016 58,793 7731988 4,793 20,977 25,770 282,814 80,381 1,0481989 3,907 21,044 24,951 283,431 89,227 1,4691990 4,415 18,952 23,367 270,046 71,635 4,7081991 4,727 15,438 20,165 235,782 61,396 3,7141992 5,050 16,240 21,290 235,910 81,754 5,4951993 6,280 15,283 21,563 226,980 83,721 8,0661994 6,028 15,638 21,666 215,465 71,371 29,3181995 6,692 15,488 22,180 222,529 132,953 37,3241996 6,917 16,597 23,514 246,438 109,624 51,3541997 7,019 19,323 26,342 253,446 158,518 51,6161998 6,821 20,757 27,578 260,590 143,357 35,1561999 6,143 19,411 25,554 294,928 266,007 41,1422000 6,460 18,633 25,093 278,148 210,075 69,745
ANNUAL REPORT 2000 95

TABLE 6. Catches per cubic meter of carrying capacity for the EPO purse-seine fleet, by species and vessel size group,in the EPO and in all ocean fishing areas. YFT = yellowfin; SKJ = skipjack; BET = bigeye; All = all species reported.TABLA 6. Capturas por metro cúbico de capacidad de acarreo por de la flota cerquera del OPO, por especie y clase dearqueo, en el OPO y en todas las áreas oceánicas de pesca. YFT = aleta amarilla; SKJ = barrilete; BET = patudo; EPO= OPO; All = todas las especies reportadas.
Year Species <401 m3 401-800 m3 801-1100 m3 1101-1300 m3 1301-1500 m3 1501-1800 m3 1801-2100 m3 >2100 m3 TotalAño Especie EPO All EPO All EPO All EPO All EPO All EPO All EPO All EPO All EPO All1990 YFT 1.9 1.9 1.3 1.3 1.3 1.3 2.2 2.2 2.2 2.2 1.4 1.5 0.8 0.9 0.0 0.0 1.8 1.9
SKJ 1.9 1.9 0.7 0.7 0.3 0.3 0.4 0.5 0.2 0.4 0.3 0.5 0.1 0.2 0.0 0.0 0.5 0.5BET 0.0 0.0 0.1 0.1 0.0 0.0 0.0 0.0 0.0 0.0 0.0 0.0 0.0 0.0 0.0 0.0 0.0 0.0All 4.9 4.9 2.4 2.4 1.9 1.9 2.6 2.7 2.4 2.6 1.7 2.0 0.9 1.1 0.0 0.0 2.5 2.6
1991 YFT 2.1 2.1 1.6 1.6 1.4 1.4 2.3 2.3 1.2 1.2 1.3 1.5 1.9 1.9 0.0 0.0 1.9 1.9SKJ 1.4 1.4 0.7 0.8 0.4 0.5 0.4 0.4 0.3 0.3 0.4 0.5 0.0 0.0 0.0 0.0 0.5 0.5BET 0.1 0.1 0.1 0.1 0.0 0.0 0.0 0.0 0.0 0.0 0.0 0.0 0.0 0.0 0.0 0.0 0.0 0.0All 3.8 3.8 2.4 2.5 1.8 1.9 2.6 2.7 1.5 1.5 1.7 2.0 1.9 1.9 0.0 0.0 2.4 2.5
1992 YFT 1.4 1.4 1.5 1.5 1.6 1.6 2.5 2.5 2.0 2.0 1.1 1.2 1.0 1.0 0.0 0.0 2.0 2.0SKJ 1.7 1.7 1.0 1.0 0.6 0.6 0.5 0.5 0.5 0.5 0.8 0.8 0.0 0.0 0.0 0.0 0.7 0.7BET 0.0 0.0 0.1 0.1 0.1 0.1 0.0 0.0 0.0 0.0 0.1 0.1 0.0 0.0 0.0 0.0 0.0 0.0All 3.4 3.4 2.6 2.6 2.2 2.2 3.0 3.1 2.5 2.5 2.1 2.1 1.0 1.0 0.0 0.0 2.7 2.8
1993 YFT 2.4 2.4 1.6 1.6 1.8 1.8 1.9 1.9 2.1 2.1 1.3 1.5 1.4 1.4 0.0 0.0 1.8 1.9SKJ 1.6 1.6 1.0 1.0 0.7 0.7 0.4 0.5 0.7 0.7 0.9 1.1 0.0 0.0 0.0 0.0 0.7 0.7BET 0.0 0.0 0.1 0.1 0.1 0.1 0.1 0.1 0.1 0.1 0.1 0.1 0.0 0.0 0.0 0.0 0.1 0.1All 4.2 4.2 2.7 2.7 2.6 2.6 2.4 2.5 2.8 2.8 2.3 2.7 1.4 1.4 0.0 0.0 2.6 2.7
1994 YFT 2.2 2.2 1.2 1.2 1.4 1.4 2.0 2.1 1.8 1.8 1.6 1.9 0.3 0.3 0.0 0.0 1.7 1.8SKJ 1.0 1.0 0.8 0.8 0.4 0.4 0.4 0.5 0.7 0.7 0.5 0.7 0.5 0.5 0.0 0.0 0.6 0.6BET 0.0 0.0 0.2 0.2 0.2 0.2 0.2 0.2 0.2 0.2 0.4 0.4 0.7 0.7 0.0 0.0 0.2 0.2All 3.7 3.7 2.2 2.2 2.1 2.1 2.6 2.8 2.7 2.7 2.4 3.0 1.6 1.6 0.0 0.0 2.6 2.7
1995 YFT 1.6 1.6 1.2 1.2 1.3 1.4 2.1 2.2 1.6 1.6 1.6 1.6 0.2 0.2 0.0 0.0 1.7 1.7SKJ 2.0 2.0 1.3 1.3 1.1 1.2 0.7 0.7 1.0 1.0 0.5 0.5 1.5 1.5 0.0 0.0 1.0 1.0BET 0.1 0.1 0.2 0.2 0.3 0.3 0.3 0.3 0.3 0.3 0.4 0.4 1.2 1.2 0.0 0.0 0.3 0.3All 4.3 4.3 2.8 2.8 2.8 2.8 3.1 3.1 3.0 3.0 2.5 2.5 2.9 2.9 0.0 0.0 3.1 3.1
1996 YFT 1.9 1.9 1.2 1.2 1.5 1.5 2.2 2.2 1.5 1.5 1.7 1.9 0.9 0.9 0.0 0.0 1.8 1.8SKJ 1.9 1.9 1.0 1.0 0.8 0.8 0.6 0.6 0.7 0.7 0.5 0.7 0.8 0.8 0.0 0.0 0.8 0.8BET 0.2 0.2 0.5 0.5 0.7 0.7 0.3 0.3 0.3 0.3 0.2 0.2 0.7 0.7 0.0 0.0 0.4 0.4All 4.4 4.4 2.9 2.9 3.0 3.1 3.1 3.1 2.5 2.5 2.4 2.8 2.3 2.3 0.0 0.0 3.0 3.1
1997 YFT 1.9 1.9 1.2 1.2 1.2 1.2 2.2 2.2 1.4 1.4 1.1 1.2 0.7 0.7 0.0 0.0 1.6 1.7SKJ 2.3 2.3 1.5 1.6 1.0 1.0 0.7 0.8 1.0 1.0 0.6 0.7 1.1 1.1 0.0 0.0 1.0 1.1BET 0.4 0.4 0.6 0.6 0.6 0.6 0.2 0.2 0.4 0.4 0.1 0.2 0.4 0.4 0.0 0.0 0.3 0.3All 4.8 4.8 3.4 3.4 2.8 2.8 3.1 3.2 2.8 2.8 1.9 2.1 2.2 2.2 0.0 0.0 3.0 3.1
1998 YFT 1.8 1.8 1.1 1.1 1.2 1.2 2.1 2.2 1.3 1.4 1.7 1.8 0.5 0.5 0.4 0.4 1.6 1.6SKJ 1.3 1.3 1.2 1.2 1.0 1.0 0.5 0.6 1.0 1.1 0.7 0.9 1.2 1.2 1.5 1.5 0.9 0.9BET 0.2 0.2 0.3 0.3 0.2 0.2 0.1 0.1 0.3 0.3 0.2 0.2 0.3 0.3 0.5 0.5 0.2 0.2All 3.5 3.5 2.6 2.6 2.4 2.4 2.8 2.8 2.6 2.8 2.6 2.9 2.1 2.1 2.5 2.5 2.7 2.7
1999 YFT 3.2 3.2 1.5 1.5 1.2 1.3 2.0 2.0 1.3 1.3 2.2 2.2 0.5 0.5 0.4 0.4 1.6 1.6SKJ 1.9 1.9 2.1 2.1 1.7 1.8 0.9 1.0 1.9 1.9 1.1 1.1 1.5 1.7 2.2 2.5 1.5 1.5BET 0.2 0.2 0.3 0.3 0.2 0.2 0.1 0.1 0.3 0.3 0.2 0.2 0.4 0.4 0.8 0.9 0.2 0.2All 5.4 5.4 3.9 3.9 3.2 3.3 3.0 3.1 3.5 3.5 3.5 3.5 2.4 2.7 3.5 3.8 3.3 3.4
2000 YFT 1.8 1.8 0.9 0.9 1.0 1.0 2.2 2.3 1.3 1.4 1.5 1.6 0.6 0.8 0.5 0.5 1.5 1.5SKJ 2.5 2.5 1.7 1.7 1.8 1.8 0.5 0.6 1.1 1.2 0.8 0.9 1.5 1.8 1.4 1.6 1.2 1.2BET 0.1 0.1 0.4 0.4 0.5 0.5 0.1 0.1 0.4 0.4 0.2 0.2 1.2 1.3 1.5 1.6 0.4 0.4All 4.5 4.5 2.9 3.0 3.4 3.4 2.9 3.0 2.8 2.9 2.6 2.7 3.3 4.0 3.4 3.7 3.1 3.2
96 TUNA COMMISSION

TABL
E 7.
Preli
mina
ry es
timat
es of
comm
ercia
l cat
ches
, in m
etric
tons
, of b
illfis
hes i
n th
e eas
tern
Pac
ific O
cean
. Mos
t of t
he lo
nglin
e-cau
ght f
ish w
ere r
etain
ed, a
nd m
ost o
f tho
se ca
ught
by su
rface
gear
wer
e disc
arde
d.TA
BLA
7. Es
timac
iones
preli
mina
res d
e las
capt
uras
come
rciale
s, en
tone
ladas
métr
icas,
de pe
ces p
icudo
s en
el Oc
éano
Pac
ífico
orien
tal.
La m
ayor
ía de
l pes
cado
capt
urad
o con
palan
gre
fue r
eteni
da, y
la m
ayor
ía de
la ca
ptur
a de s
uper
ficie
dese
chad
a.
Swor
dfish
Blue
mar
linBl
ack
mar
linSt
ripe
d m
arlin
Shor
tbill
spea
rfish
Sailf
ishYe
arLo
nglin
eSu
rfac
eLo
nglin
eSu
rfac
eLo
nglin
eSu
rfac
eLo
nglin
eSu
rfac
eLo
nglin
eSu
rfac
eLo
nglin
eSu
rfac
ePe
z esp
ada
Mar
lín a
zul
Mar
lín n
egro
Mar
lín ra
yado
Mar
lín tr
ompa
cort
aPe
z vel
aAñ
oPa
lang
reSu
perf
icie
Pala
ngre
Supe
rfic
iePa
lang
reSu
perf
icie
Pala
ngre
Supe
rfic
iePa
lang
reSu
perf
icie
Pala
ngre
Supe
rfic
ie19
709,2
944,1
2627
510
,976
1971
4,844
2,832
308
10,11
819
722,8
472,6
5345
57,1
0619
735,1
053,8
2530
75,2
7719
745,0
142,8
2624
95,4
0219
753,0
652,2
8118
25,4
2955
419
762,7
003,2
7128
56,4
7349
419
774,2
583,1
0618
83,0
8675
319
786,5
553,6
3028
32,4
9687
819
794,7
224,5
0029
14,1
2325
119
804,2
094,0
3018
24,8
7924
319
816,5
724,4
5316
94,8
7037
919
825,9
184,7
1714
34,6
821,0
8319
835,0
084,4
3220
94,4
5588
919
846,6
045,1
6312
12,6
5234
519
856,5
573,5
7419
41,5
9239
219
865,7
175,2
6831
33,5
345
529
1987
7,357
7,232
199
7,282
1560
419
8810
,393
5,190
135
5,130
1364
219
8912
,159
5,064
151
3,311
017
119
9013
,797
4,925
112
2,959
02
1991
15,68
317
5,780
8114
558
2,594
171
040
1992
15,23
44
6,391
5920
895
2,674
801
198
041
1993
12,69
54
6,831
8517
885
3,354
673
01,9
6347
1994
10,21
73
9,278
112
170
893,2
9563
143
01,5
1624
1995
8,483
77,1
6012
495
111
3,082
3515
61
1,297
3819
969,6
553
3,426
140
112
139
2,834
4112
71
704
2919
9713
,318
135,5
3122
018
315
43,9
3240
164
11,1
8632
1998
14,10
44,4
5152
2,229
142
1,023
1999
15,83
92,8
296
1,536
174
1,135
ANNUAL REPORT 2000 97

TABLE 8a. Annual catches of yellowfin tuna, in thousands of metric tons. JPN: Japan; KOR: Republic of Korea; TWN:Taiwan; WCPO = western and central Pacific Ocean.TABLA 8a. Capturas anuales de atún aleta amarilla, en miles de toneladas métricas. JPN: Japón; KOR: República deCorea; TWN: Taiwan; OPOC = Océano Pacífico occidental y central.
Pacific OceanEastern Atlantic Indian
Year TotalLongline2 WCPO3 Total4 Ocean5 Ocean6Surface1 Total
JPN KOR TWN Others TotalOcéano Pacífico
Oriental Oceáno OceánoAño TotalPalangre2 OPOC3 Total4 Atlántico5 Indico6
Superficie1 TotalJPN KOR TWN Otros Total
1970 155.6 13.8 * 0.1 0.0 13.9 169.5 94.9 264.5 74.3 37.2 376.01971 122.8 7.4 * 0.3 0.0 7.7 130.5 86.7 217.2 73.8 41.6 332.61972 177.1 16.0 * 0.5 0.0 16.5 193.6 114.7 308.4 94.1 43.6 446.11973 205.3 11.4 * 0.3 0.0 11.7 217.0 137.9 355.0 95.1 34.5 484.61974 210.4 6.9 * 0.3 0.0 7.2 217.6 143.7 361.3 107.1 37.8 506.21975 202.1 10.3 0.2 0.3 0.0 10.8 212.9 145.2 358.1 124.8 37.3 520.21976 236.3 15.0 0.4 0.2 0.0 15.6 251.9 153.0 404.9 125.0 37.5 567.41977 198.8 11.2 0.8 0.1 0.0 12.1 210.9 177.4 388.3 131.0 61.4 580.71978 180.5 9.2 0.8 0.1 0.0 10.1 190.6 193.9 384.5 134.0 46.1 564.61979 189.7 10.9 0.4 0.1 0.0 11.4 201.1 201.2 402.3 127.5 39.9 569.71980 159.4 11.5 1.9 0.1 0.0 13.5 172.9 217.4 390.3 131.0 35.1 556.51981 181.8 7.1 0.8 0.1 0.0 8.0 189.8 217.2 407.0 155.8 37.6 600.41982 125.1 9.8 1.1 0.1 0.0 11.0 136.1 244.5 380.5 165.0 51.9 597.41983 94.3 9.4 1.4 0.0 0.1 10.9 105.2 279.5 384.7 165.4 60.9 611.11984 145.1 9.1 1.2 0.0 0.0 10.3 155.4 255.5 410.9 113.9 102.6 627.41985 217.0 10.6 2.5 0.0 0.0 13.1 230.1 243.6 473.7 156.5 116.9 747.21986 268.3 17.8 4.8 0.1 0.1 22.7 291.0 243.3 534.3 146.5 132.8 813.61987 272.2 13.5 4.1 0.1 0.3 18.0 290.2 308.3 598.5 144.4 145.1 888.01988 288.1 12.5 0.5 0.0 0.3 13.3 301.4 294.0 595.4 135.2 205.9 936.61989 289.4 15.3 0.3 0.2 0.0 15.8 305.2 344.5 649.7 161.3 202.5 1013.41990 273.3 29.3 0.9 0.3 0.0 30.5 303.8 401.2 705.0 192.5 258.3 1155.81991 239.1 23.7 1.6 0.3 0.2 25.8 264.9 404.2 669.1 166.1 245.4 1080.61992 239.8 15.3 0.8 0.0 0.1 16.2 256.0 470.9 727.0 162.2 317.4 1206.51993 232.1 20.3 3.6 0.1 0.2 24.2 256.3 432.4 688.8 158.6 397.7 1245.01994 219.3 26.0 2.3 0.2 0.8 29.4 248.7 464.2 712.8 169.5 310.8 1193.21995 223.8 17.0 2.0 0.0 0.7 19.8 243.6 410.4 653.9 149.7 319.2 1122.81996 250.2 12.6 1.8 0.0 0.6 15.0 265.2 356.8 622.0 150.0 311.4 1083.41997 257.8 13.6 2.8 0.1 1.0 17.5 275.3 509.8 785.1 133.5 290.3 1208.91998** 265.7 10.5 * 0.1 1.5 12.2 277.9 541.4 819.2 143.2 274.6 1237.01999** 296.9 7.3 * * 1.7 9.0 305.9 510.9 816.8 138.2 * 955.02000** 272.0 * * * * * * * * * * *1 Source: Table 3−Fuente: Tabla 32 Sources: published and unpublished data from the National Research Institute of Far Seas Fisheries (NRIFSF),
Shimizu, Japan, Institute of Oceanography, National Taiwan University, Taipei, Taiwan, and National Fisheries Research and Development Agency, Republic of Korea. The data were converted from numbers of fish to weight in metric tons with average weight data estimated by the IATTC staff.
2 Fuentes: datos publicados e inéditos del Instituto Nacional de Investigación de Pesquerías de Ultramar (NRIFSF) en Shimizu (Japón), el Instituto de Oceanografía de la Universidad Nacional de Taiwan en Taipei, y la Agencia Nacional de Investigación y Desarrollo Pesquero de Corea. Se convirtieron los datos de números de peces a peso en toneladas métricas usando datos de peso promedio estimados por el personal de la CIAT.
3 Source: Column 10 - Column 8−Fuente: Columna 10 - Columna 84 Source: FAO data set for Fishstat+−Fuente: datos de FAO para Fishstat+5 Source: ICCAT data set for Fishstat+−Fuente: datos de CICAA para Fishstat+6 Source: IOTC data set for Fishstat+− Fuente: datos de CTOI para Fishstat+* not available−no disponible**preliminary−preliminares
98 TUNA COMMISSION

TABLE 8b. Annual catches of skipjack tuna, in thousands of metric tons. WCPO = western and central Pacific Ocean.TABLA 8b. Capturas anuales de atún barrilete, en miles de toneladas metricas. OPOC = Océano Pacífico occidentaly central.
Year EasternPacific1 WCPO2 Total Pacific3 Atlantic4 Indian5 TotalAño Pacífico oriental1 OPOC2 Pacífico total3 Atlántico4 Indico5 Total1970 56.0 258.5 314.5 50.3 41.5 406.21971 104.7 246.6 351.3 78.4 41.1 470.81972 33.4 311.1 344.5 77.4 35.7 457.61973 44.0 402.2 446.2 78.4 34.1 558.61974 78.8 445.9 524.7 117.3 39.5 681.51975 123.9 344.5 468.4 56.0 35.2 559.61976 126.2 432.5 558.7 69.3 38.6 666.71977 86.3 420.1 506.4 110.6 30.3 647.31978 169.8 531.4 701.2 108.1 34.3 843.61979 132.0 469.6 601.6 89.7 41.2 732.51980 130.7 502.8 633.5 111.4 49.8 794.71981 119.6 455.7 575.3 131.1 50.6 757.01982 98.8 469.8 568.6 154.9 54.0 777.51983 58.1 651.1 709.2 135.0 64.3 908.51984 60.6 770.8 831.4 126.8 107.0 1,065.21985 49.5 611.3 660.8 118.7 133.5 912.91986 63.6 753.3 816.9 122.2 138.3 1,077.41987 62.3 687.1 749.4 114.6 154.3 1,018.21988 85.3 853.7 939.0 140.0 209.2 1,288.11989 92.4 773.7 866.1 116.1 256.1 1,238.31990 72.6 869.0 941.6 138.7 230.4 1,310.61991 63.3 1,195.6 1,258.9 213.8 242.6 1,715.21992 84.0 925.3 1,009.3 161.4 268.2 1,438.91993 87.4 922.3 1,009.7 193.6 284.3 1,487.61994 74.5 986.5 1,061.0 175.8 319.7 1,556.51995 138.2 1,047.6 1,185.8 163.0 314.2 1,663.11996 112.2 1,038.8 1,151.0 149.8 281.1 1,582.01997 161.8 1,008.2 1,170.0 144.8 290.3 1,605.21998** 144.0 1,281.8 1,425.8 147.6 304.7 1,878.11999** 268.0 1,161.0 1,429.0 166.2 * 1,595.22000** 210.0 * * * * *
1 Source: Table 3−Fuente: Tabla 32 Column 4 - Column 2−Columna 4 - Columna 23 Source: FAO data set for Fishstat+−Fuente: datos de FAO para Fishstat+4 Source: ICCAT data set for Fishstat+−Fuente: datos de ICCAT para Fishstat+5 Source: IOTC data set for Fishstat+−Fuente: datos de IOTC para Fishstat+* not available−no disponible**preliminary−preliminares
ANNUAL REPORT 2000 99

TABLE 8c. Annual catches of bigeye tuna, in thousands of metric tons. JPN: Japan; KOR: Republic of Korea; TWN:Taiwan; WCPO = western and central Pacific Ocean.TABLA 8c. Capturas anuales de atún patudo, en miles de toneladas métricas. JPN: Japón; KOR: República de Corea;TWN: Taiwan; OPOC = Océano Pacífico occidental y central.
Pacific OceanEastern Atlantic Indian
Year TotalLongline2 WCPO3 Total4 Ocean5 Ocean6
Surface1 TotalJPN KOR TWN Others Total
Océano PacíficoOriental Oceáno Oceáno
Año TotalPalangre2 OPOC3 Total4 Atlántico5 Indico6
Superficie1 TotalJPN KOR TWN Otros Total
1970 1.3 31.8 0.7 * 0.4 32.9 34.2 50.0 84.2 42.3 22.3 148.81971 2.6 28.9 1.7 * 0.3 30.9 33.5 32.4 66.0 55.8 21.0 142.81972 2.2 35.1 2.4 * 0.8 38.3 40.5 47.2 87.7 47.2 19.4 154.31973 2.0 49.7 1.2 * 1.3 52.2 54.2 36.2 90.4 57.0 15.5 162.91974 0.9 36.0 0.9 * 0.6 37.5 38.4 49.5 87.9 64.1 28.2 180.21975 3.7 40.7 0.5 0.6 0.4 42.2 45.9 57.2 103.1 61.3 39.4 203.81976 10.2 52.8 0.4 1.2 0.2 54.6 64.8 64.2 129.0 45.3 30.5 204.81977 7.1 70.0 0.4 3.5 0.2 74.1 81.2 63.8 145.0 54.9 37.5 237.31978 11.7 67.2 0.3 3.0 0.2 70.7 82.4 39.2 121.6 52.7 48.3 222.61979 7.5 54.4 0.8 0.8 0.1 56.2 63.7 65.3 129.0 46.0 32.9 207.91980 15.4 62.0 1.3 2.2 0.6 66.1 81.5 51.1 132.5 63.6 33.8 229.91981 10.1 50.0 0.6 3.0 0.4 54.0 64.1 40.1 104.2 67.8 34.5 206.51982 4.1 50.2 0.4 3.0 0.1 53.7 57.8 51.6 109.4 73.5 43.2 226.21983 3.3 57.2 0.2 2.6 0.1 60.1 63.4 48.0 111.4 59.4 48.0 218.81984 5.9 44.6 0.2 1.6 0.0 46.5 52.4 51.5 103.8 71.1 40.5 215.41985 4.5 61.6 0.2 4.5 0.0 66.3 70.8 53.9 124.7 78.2 47.8 250.71986 1.9 92.0 0.1 10.2 0.1 102.4 104.3 46.2 150.5 65.4 54.0 269.91987 0.8 87.9 0.6 9.8 0.4 98.6 99.4 49.5 149.0 56.0 59.2 264.21988 1.1 66.0 0.4 1.6 0.4 68.5 69.6 50.3 119.9 65.8 67.2 252.91989 1.5 67.5 0.1 1.1 0.5 69.2 70.7 54.9 125.6 78.1 59.7 263.31990 4.7 86.1 0.1 4.2 0.3 90.7 95.4 67.2 162.6 84.3 63.7 310.61991 3.7 85.0 0.0 4.5 0.2 89.8 93.5 50.1 143.6 95.9 68.1 307.61992 5.5 74.5 0.0 2.5 0.1 77.1 82.6 75.8 158.4 99.0 64.3 321.81993 8.1 63.2 0.1 10.7 0.2 74.2 82.3 47.5 129.9 112.9 92.5 335.31994 29.4 61.5 0.4 7.3 0.3 69.4 98.8 45.9 144.7 132.9 95.5 373.11995 37.3 49.0 0.4 6.6 0.0 56.0 93.3 46.6 140.0 127.1 115.6 382.61996 51.4 36.7 0.5 5.4 0.1 42.7 94.1 39.1 133.2 121.8 123.0 377.91997 51.6 32.9 0.3 6.8 0.1 40.1 91.7 70.1 161.8 107.6 131.6 401.01998** 35.2 36.8 0.2 * 0.2 37.2 72.4 80.2 152.6 110.8 143.0 406.41999** 41.2 22.8 * * * 22.8 64.0 85.3 149.3 123.2 * 272.52000** 69.7 * * * * * * * * * * *1 Source: Table 3−Fuente: Tabla 32 Sources: published and unpublished data from the National Research Institute of Far Seas Fisheries (NRIFSF),
Shimizu, Japan, Institute of Oceanography, National Taiwan University, Taipei, Taiwan, and National Fisheries Research and Development Agency, Republic of Korea. The data were converted from numbers of fish to weight inmetric tons with average weight data estimated by the IATTC staff.
2 Fuentes: datos publicados e inéditos del Instituto Nacional de Investigación de Pesquerías de Ultramar (NRIFSF) en Shimizu (Japón), el Instituto de Oceanografía de la Universidad Nacional de Taiwan en Taipei, y la Agencia Nacional de Investigación y Desarrollo Pesquero de Corea. Se convirtieron los datos de números de peces a peso en toneladas métricas usando datos de peso promedio estimados por el per-sonal de la CIAT.
3 Source: Column 10 - Column 8−Fuente: Columna 10 - Columna 84 Source: FAO data set for Fishstat+−Fuente: datos de FAO para Fishstat+5 Source: ICCAT data set for Fishstat+−Fuente: datos de CICAA para Fishstat+6 Source: IOTC data set for Fishstat+− Fuente: datos de CTOI para Fishstat+* not available−no disponible**preliminary−preliminares
100 TUNA COMMISSION

TABLE 8d. Annual catches of Pacific bluefin, in metric tons.TABLA 8d. Capturas anuales de aleta azul del Pacífico, en toneladas métricas.
Western Pacific nations1 Eastern Pacific nationsYear Surface Total
Surface Longline Subtotal Longline4 SubtotalCommercial2 Recreational3
Naciones de Pacífico occidental1 Naciones de Pacífico orientalAño Superficie Total
Superficie Palangre Subtotal Palangre4 SubtotalComercial2 Deportiva3
1970 7,505 1,123 8,629 3,951 15 3,966 12,5951971 8,672 757 9,428 8,354 6 8,360 17,7881972 7,951 724 8,674 13,335 12 13,347 22,0211973 8,798 1,158 9,956 10,700 44 10,744 20,7001974 14,762 3,533 18,295 5,570 47 5,617 23,9121975 10,770 1,558 12,328 9,556 27 9,583 21,9111976 9,185 520 9,705 10,628 17 10,645 20,3501977 12,618 712 13,330 5,458 15 5,473 18,8031978 21,285 1,049 22,334 5,393 4 5,397 27,7311979 25,311 1,223 26,534 6,108 9 6,117 32,6511980 18,372 1,170 19,542 2,933 6 2,939 22,4811981 29,576 975 30,551 1,084 5 1,089 31,6401982 24,095 1,056 25,151 3,145 5 3,150 28,3011983 18,047 8,634 18,911 837 16 853 19,7641984 10,564 831 11,395 858 23 881 12,2761985 11,985 706 12,691 4,014 41 4,055 16,7461986 14,496 319 14,815 5,079 6 5,085 19,9001987 13,315 711 14,026 990 15 1,005 15,0311988 7,331 349 7,680 1,421 3 1,424 9,1041989 9,099 645 9,744 1,117 53 1,170 10,9141990 6,294 585 6,879 1,511 31 1,542 8,4211991 14,084 627 14,711 418 43 461 15,1721992 10,221 1,037 11,258 1,929 70 1 2,000 13,2581993 7,818 1,328 9,146 581 298 45 924 10,0701994 11,052 1,521 12,573 974 88 24 1,086 13,6591995 22,825 920 23,745 629 245 27 901 24,6461996 10,148 1,873 12,021 8,222 37 53 8,312 20,3331997 14,757 2,823 17,580 2,657 150 52 2,859 20,4391998** 7,389 3,134 10,523 1,826 397 56 2,279 12,8021999** 16,868 3,490 20,358 2,644 447 39 3,130 23,4882000** * * * 3,873 225 * 4,098 *
1 Sources: The data for Japan were obtained from the National Research Institute of Far Seas Fisheries of Japan. The data for Taiwan and the Republic of Korea were obtained from FAO yearbooks of fisheries statistics and data pub-lished by the Institute of Oceanography, National Taiwan University, Taipei, Taiwan, and the National FisheriesResearch and Development Agency of Korea.
1 Fuentes: Los datos de Japón provienen del Instituto Nacional de Investigación de Pesquerías de Ultramar del Japón.Los datos de Taiwan y la República de Corea provienen de compendios anuales de estadísticas pesqueras de la FAOy datos publicados por el Instituto de Oceanografía de la Universidad Nacional de Taiwan en Taipei y la AgenciaNacional de Investigación y Desarrollo Pesquero de Corea.
2 Source: Table 3 minus recreational catch−Fuente: Tabla 3, menos la captura deportiva.3 Sources: 1970-1990, California's Living Marine Resources and their Utilization, published by the California Depart-
ment of Fish and Game; 1991-1992, California Department of Fish and Game, unpublished data; 1993-1999, Calif.Coop. Ocean. Fish. Inves., Rep., 35-41.
3 Fuentes: 1970-1990, California's Living Marine Resources and their Utilization, publicado por el California Depart-ment of Fish and Game; 1991-1992, California Department of Fish and Game, datos inéditos; 1993-1998, Calif. Coop.Ocean. Fish. Inves., Rep., 35-41.
4 Sources: NOAA Tech. Rep. NMFS 142: page 149, and Pelagic Fisheries of the Western Pacific Region, 1998 AnnualReport, Western Pacific Fishery Management Council, Honolulu, Hawaii: page 3-57.
4 Fuentes: NOAA Tech. Rep. NMFS 142: página 149, y Pesquerías Pelágicas de la Región del Pacífico Occidental, Infor-me Anual de 1998, Western Pacific Fishery Management Council, Honolulu, Hawaii: página 3-57.
* not available−no disponible**preliminary−preliminares
ANNUAL REPORT 2000 101

TABLE 9a. World catches of the principal market species of tunas, in thousands of metric tons (from FAO, ICCAT, andIOTC data set for Fishstat+). Data for 1971-1990 are given in Table 9a of the IATTC Annual Report for 1999.TABLA 9a. Capturas mundiales de las principales especies comerciales de atunes, en miles de toneladas métricas (deFAO, CICAA, y CTOI datos para Fishstat+). En la Tabla 9a del Informe Anual de la CIAT de 1999 se presentan datosde 1971-1990.
1991 1992 1993 1994 1995 1996 1997 1998 1999Pacific Ocean−−Océano Pacífico
Skipjack−Barrilete 1259 1009 1010 1061 1186 1151 1170 1426 1429Yellowfin−Aleta amarilla 669 727 689 713 654 622 785 819 817Bigeye−Patudo 144 158 130 145 140 133 162 153 149Albacore−Albacora 95 114 96 114 104 111 134 131 146Northern bluefin−Aleta azul del norte 6 7 7 9 7 15 11 8 16Southern bluefin−Aleta azul del sur 2 5 5 4 3 2 2 2 2Total 2174 2021 1936 2045 2094 2034 2264 2539 2560
Atlantic Ocean−−Océano AtlánticoSkipjack−Barrilete 214 161 192 176 162 150 144 148 166Yellowfin−Aleta amarilla 166 162 160 171 152 153 138 148 144Bigeye−Patudo 96 99 112 132 126 122 107 110 124Albacore−Albacora 56 70 72 71 68 60 59 59 67Northern bluefin−Aleta azul del norte 29 34 38 49 50 55 50 40 36Southern bluefin−Aleta azul del sur 1 1 2 1 2 1 0 1 1Total 563 527 577 599 559 542 498 506 538
Indian Ocean−−Océano IndicoSkipjack−Barrilete 243 268 284 320 314 280 288 309 399Yellowfin−Aleta amarilla 245 317 398 311 319 311 285 272 302Bigeye−Patudo 68 64 92 95 115 123 133 141 144Albacore−Albacora 29 19 17 21 20 29 27 41 41Southern bluefin−Aleta azul del sur 7 8 8 8 10 14 14 14 16Total 592 677 799 755 778 756 747 778 901
All oceans−−Todos océanosSkipjack−Barrilete 1715 1439 1486 1556 1661 1581 1603 1883 1995Yellowfin−Aleta amarilla 1081 1207 1247 1194 1125 1086 1208 1240 1263Bigeye−Patudo 308 322 335 372 382 378 401 403 417Albacore−Albacora 180 203 185 205 191 200 221 231 254Northern bluefin−Aleta azul de norte 35 41 45 58 58 71 60 48 53Southern bluefin−Aleta azul del sur 11 14 15 13 14 17 17 18 19Total 3330 3225 3312 3399 3431 3333 3509 3823 4000
102 TUNA COMMISSION

TABLE 9b. World catches of the principal species of billfishes, in thousands of metric tons (from FAO, ICCAT, andIOTC data set for Fishstat+). Data for 1971-1990 are given in Table 9b of the IATTC Annual Report for 1999.TABLA 9b. Captures mundiales de las especies principales de picudos, en miles de toneladas métricas (de FAO, CI-CAA, y CTOI datos para Fishstat+). En la Tabla 9b del Informe Anual de la CIAT de 1999 se presentan datos de 1971-1990.
1991 1992 1993 1994 1995 1996 1997 1998 1999Pacific Ocean−−Océano Pacífico
Swordfish−Pez espada 24 30 28 25 20 19 23 26 24Blue marlin−Marlín azul 20 19 18 23 22 19 17 18 17Black marlin−Marlín negro 3 4 2 3 1 1 1 2 2Striped marlin−Marlín rayado 10 11 11 11 10 8 8 9 7Indo-Pacific sailfish−Pez vela del Indopacifico 5 7 5 4 3 3 5 6 5Unidentified billfishes−Picudos no identificados 8 9 10 7 11 10 10 16 17Total 70 79 74 72 67 62 64 78 71
Atlantic Ocean−−Océano AtlánticoSwordfish−Pez espada 41 44 46 51 51 45 46 40 41Blue marlin−Marlín azul 4 3 3 4 4 4 5 4 4White marlin−Marlín blanco 2 1 2 2 2 2 1 1 1Atlantic sailfish−Pez vela del Atlántico 2 3 4 2 2 3 2 2 2Unidentifed billfishes−Picudos no identificados <1 <1 <1 <1 <1 <1 <1 <1 <1Total 49 51 54 60 59 55 54 48 48
Indian Ocean−−Océano IndicoSwordfish−Pez espada 7 12 23 19 26 29 29 38 34Blue marlin−Marlín azul 8 7 6 9 3 4 6 8 7Black marlin−Marlín negro 1 2 3 1 1 1 1 1 1Striped marlin−Marlín rayado 2 2 5 3 4 4 3 4 3Indo-Pacific sailfish−Pez vela del Indopacifico 5 4 5 8 9 10 11 12 12Unidentified billfishes−Picudos no identificados 11 13 15 16 15 19 21 20 16Total 34 40 56 56 59 68 70 83 73
All oceans−−Todos océanosSwordfish−Pez espada 71 86 97 95 96 93 98 105 99Blue marlin−Marlín azul 32 29 27 36 29 28 28 30 28Black marlin−Marlín negro 5 6 5 3 2 2 2 3 3Striped marlin−Marlín rayado 13 13 16 14 14 12 11 13 10White marlin−Marlín blanco 2 1 2 2 2 2 1 1 1Indo-Pacific sailfish−Pez vela del Indopacifico 10 10 10 12 12 14 16 17 16Atlantic sailfish−Pez vela del Atlántico 2 3 4 2 2 3 2 2 2Unidentified billfishes−Picudos no identificados 18 22 25 23 27 30 30 37 34Total 153 170 185 188 185 184 188 209 192
ANNUAL REPORT 2000 103

TABLE 9c. World catches of tunas and tuna-like fishes other than the principal market species of tunas and billfishes,in thousands of metric tons (from FAO, ICCAT, and IOTC data set for Fishstat+). "Others" includes wahoo,Acanthocybium solandri, blackfin tuna, Thunnus atlanticus, plain bonito, Orcynopsis unicolor, unidentified tunas, andunidentified tuna-like fishes. Data for 1971-1990 are given in Table 9c of the IATTC Annual Report for 1999.TABLA 9c. Capturas mundiales de atunes y especies afines aparte de las principales especies comerciales de atunes ypeces picudos, en miles de toneladas métricas (de datos de FAO, CICAA, e IOTC para Fishstat+). "Otros" incluye peto(Acanthocybium solandri), atún aleta negra (Thunnus atlanticus), tasarte (Orcynopsis unicolor), y atunes y especiesafines no identificados. En la Tabla 9c del Informe Anual de la CIAT de 1999 se presentan datos de 1971-1990.
1991 1992 1993 1994 1995 1996 1997 1998 1999Pacific Ocean−−Océano Pacífico
Scomberomorus spp. 367 289 291 336 373 417 488 674 723Auxis spp. 147 188 167 172 145 133 169 154 213Euthynnus spp. 114 115 96 97 85 85 99 96 107Thunnus tonggol 104 90 61 49 44 37 32 36 38Sarda spp. 27 37 38 38 35 24 19 7 3Others−Otros 149 163 161 170 207 212 226 269 250Total 909 882 814 862 889 908 1034 1235 1334
Atlantic Ocean−−Océano AtlánticoScomberomorus spp. 41 37 41 38 38 45 46 26 26Auxis spp. 18 10 8 12 11 18 17 14 14Euthynnus spp. 24 23 13 13 13 16 15 15 14Sarda spp. 34 22 31 22 21 25 26 24 26Others−Otros 23 31 13 10 12 16 13 9 10Total 139 122 105 94 94 120 115 90 91
Indian Ocean−−Océano IndicoScomberomorus spp. 110 114 121 122 143 134 143 159 140Auxis spp. 20 20 21 27 27 32 28 29 33Euthynnus spp. 41 49 49 45 64 58 67 64 68Thunnus tonggol 40 34 51 69 72 63 64 62 62Others−Otros 38 43 50 40 40 52 54 65 56Total 250 261 292 302 346 340 356 379 359
All oceans−−Todos océanosScomberomorus spp. 518 441 453 495 555 596 676 859 889Auxis spp. 186 218 196 210 183 184 214 197 260Euthynnus spp. 178 186 158 155 161 159 181 176 189Thunnus tonggol 144 124 112 118 116 100 96 97 100Sarda spp. 61 59 69 60 56 49 45 32 29Others−Otros 210 237 223 220 258 280 293 343 316Total 1298 1265 1211 1259 1329 1367 1505 1704 1784
104 TUNA COMMISSION

TABLE 10. Coverage of the bycatch data base. The sources of the data are described in the text. Equivalent data for1993 and 1994 are given in Table 38 of the IATTC Annual Report for 1998.TABLA 10. Cobertura de la base de datos de capturas incidentales. En el texto se describen las fuentes de los datos.En la Tabla 38 del Informe Anual de la CIAT de 1998 se presentan datos equivalentes para 1993 y 1994.
Sets Percent coverageYear Set type IATTC bycatch data Four tuna-dolphin((Col. 3/Col. 4) x 100)base data bases
Lances Porcentaje de Año Tipo de lance Base de datos CIAT Cuatro bases de datos cobertura
((Col. 3/Col. 4) x 100)sobre captura incidental atún-delfín1995 Dolphin−Delfín 5,583 7,187 77.7
Floating object−Objeto flotante 3,249 3,568 91.1Unassociated−No asociado 3,360 5,124 65.6Total 12,192 15,879 76.8
1996 Dolphin−Delfín 5,842 7,483 78.1Floating object−Objeto flotante 4,062 4,160 97.6Unassociated−No asociado 3,225 5,387 59.9Total 13,129 17,030 77.1
1997 Dolphin−Delfín 6,339 8,995 70.5Floating object−Objeto flotante 5,614 5,828 96.3Unassociated−No asociado 2,881 4,977 57.9Total 14,834 19,800 74.9
1998 Dolphin−Delfín 8,018 10,645 75.3Floating object−Objeto flotante 5,346 5,481 97.5Unassociated−No asociado 3,217 4,631 69.5Total 16,581 20,757 79.9
1999 Dolphin−Delfín 6,536 8,648 75.6Floating object−Objeto flotante 4,513 4,620 97.7Unassociated−No asociado 4,633 6,143 75.4Total 15,682 19,411 80.8
2000 Dolphin−Delfín 6,087 9,235 65.9Floating object−Objeto flotante 3,701 3,916 94.5Unassociated−No asociado 3,926 5,482 71.6Total 13,714 18,633 73.6
ANNUAL REPORT 2000 105

TABLE 11a. Estimated discards and bycatches of tunas and bonito in the EPO on fishing trips with observers aboard,in metric tons. Equivalent data for 1993 and 1994 are given in Table 39 of the IATTC Annual Report for 1998.TABLA 11a. Descartes y capturas incidentales estimadas de atunes y bonitos en el OPO en viajes de pesca con obser-vador a bordo, en toneladas métricas. En la Tabla 39 del Informe Anual de la CIAT de 1998 se presentan datos equiv-alentes para 1993 y 1994.
Set typeYear Species Dolphin Floating object Unassociated Total
Tipo de lanceAño Especie Delfín Objeto flotante No asociado Total1995 Yellowfin−Aleta amarilla 2,509 2,657 178 5,344
Skipjack−Barrilete 356 15,019 1,240 16,614Bigeye−Patudo 0 3,247 14 3,260Black skipjack−Barrilete negro 40 646 730 1,415Bullet−Melva 6 543 119 668Other tunas−Otros atunes - 21 - 21Bonito - 40 15 55Total 2,911 22,154 2,295 27,359
1996 Yellowfin−Aleta amarilla 879 4,742 1,039 6,660Skipjack−Barrilete 204 23,903 864 24,970Bigeye−Patudo 0 5,760 26 5,786Black skipjack−Barrilete negro 20 2,308 89 2,417Bullet−Melva 33 781 239 1,052Other tunas−Otros atunes - - - -Bonito 1 - - 1Total 1,136 37,494 2,257 40,886
1997 Yellowfin−Aleta amarilla 620 4,594 417 5,631Skipjack−Barrilete 127 30,718 1,022 31,867Bigeye−Patudo 0 5,620 8 5,627Black skipjack−Barrilete negro 84 2,109 389 2,582Bullet−Melva 25 2,756 626 3,407Other tunas−Otros atunes - - 32 32Bonito - 4 - 4Total 856 45,801 2,464 49,121
1998 Yellowfin−Aleta amarilla 709 3,203 806 4,718Skipjack−Barrilete 34 21,091 1,731 22,856Bigeye−Patudo 0 2,839 14 2,853Black skipjack−Barrilete negro 91 1,593 173 1,857Bullet−Melva 32 1,033 168 1,233Other tunas−Otros atunes - - - -Bonito 0 2 3 4Total 866 29,760 2,894 33,521
1999 Yellowfin−Aleta amarilla 471 5,363 794 6,628Skipjack−Barrilete 125 23,321 3,367 26,813Bigeye−Patudo 0 5,158 8 5,166Black skipjack−Barrilete negro 2 3,049 361 3,412Bullet−Melva 29 2,594 473 3,096Other tunas−Otros atunes 0 0 542 542Bonito 0 0 0 0Total 628 39,485 5,058 45,170
106 TUNA COMMISSION

TABLE 11a. (continued)TABLA 11a. (continuación)
Set typeYear Species Dolphin Floating object Unassociated Total
Tipo de lanceAño Especie Delfín Objeto flotante No asociado Total2000 Yellowfin−Aleta amarilla 427 5,570 799 6,796
Skipjack−Barrilete 16 20,052 5,780 26,298Bigeye−Patudo 0 5,571 52 5,624Black skipjack−Barrilete negro 156 1,659 55 1,870Bullet−Melva 21 1,280 185 1,486Other tunas−Otros atunes - - - -Bonito - - - -Total 620 34,583 6,871 42,074
1 albacore−albacora2 bluefin−aleta azul
ANNUAL REPORT 2000 107

TABLE 11b. Estimated bycatches of billfishes in the EPO on fishing trips with observers aboard, in numbers of indi-viduals. Equivalent data for 1993 and 1994 are given in Table 40 of the IATTC Annual Report for 1998.TABLA 11b. Capturas incidentales estimadas de peces picudos en el OPO en viajes de pesca con observador a bordo,en número de individuos. En la Tabla 40 del Informe Anual de la CIAT de 1998 se presentan datos equiva-lentes para1993 y 1994.
Set typeYear Species Dolphin Floating object Unassociated Total
Tipo de lanceAño Especie Delfín Objeto flotante No asociado Total1995 Swordfish−Pez espada 3 24 31 59
Blue marlin−Marlín azul 56 526 83 666Black marlin−Marlín negro 65 378 81 524Striped marlin−Marlín rayado 60 121 110 291Shortbill spearfish−Marlín trompa corta 15 6 2 24Sailfish−Pez vela 390 58 501 950Unidentified marlin−Marlín no identificado 14 73 22 109Unidentified billfish−Picudo no identificado 5 46 8 59Total 609 1,233 839 2,681
1996 Swordfish−Pez espada 10 3 6 19Blue marlin−Marlín azul 57 592 85 734Black marlin−Marlín negro 71 448 91 610Striped marlin−Marlín rayado 118 78 161 357Shortbill spearfish−Marlín trompa corta 9 17 2 28Sailfish−Pez vela 452 56 300 808Unidentified marlin−Marlín no identificado 85 56 32 173Unidentified billfish−Picudo no identificado 4 159 4 167Total 806 1,409 681 2,896
1997 Swordfish−Pez espada 14 16 21 51Blue marlin−Marlín azul 88 926 173 1,188Black marlin−Marlín negro 45 726 74 845Striped marlin−Marlín rayado 73 120 151 345Shortbill spearfish−Marlín trompa corta 7 12 0 19Sailfish−Pez vela 325 112 438 875Unidentified marlin−Marlín no identificado 6 54 8 68Unidentified billfish−Picudo no identificado 2 10 4 16Total 560 1,977 871 3,407
1998 Swordfish−Pez espada 11 3 11 25Blue marlin−Marlín azul 76 1,094 73 1,243Black marlin−Marlín negro 61 698 81 840Striped marlin−Marlín rayado 99 102 55 256Shortbill spearfish−Marlín trompa corta 1 12 1 14Sailfish−Pez vela 1,011 14 461 1,486Unidentified marlin−Marlín no identificado 13 54 9 76Unidentified billfish−Picudo no identificado 336 19 4 359Total 1,608 1,996 695 4,299
1999 Swordfish−Pez espada 21 5 19 44Blue marlin−Marlín azul 82 1,578 144 1,804Black marlin−Marlín negro 73 936 149 1,158Striped marlin−Marlín rayado 67 280 75 422Shortbill spearfish−Marlín trompa corta 4 13 6 23Sailfish−Pez vela 713 89 583 1,385Unidentified marlin−Marlín no identificado 13 114 20 148Unidentified billfish−Picudo no identificado 21 5 4 30Total 994 3,020 1,001 5,014
108 TUNA COMMISSION

TABLE 11b. (continued)TABLA 11b. (continuación)
Set typeYear Species Dolphin Floating object Unassociated Total
Tipo de lanceAño Especie Delfín Objeto flotante No asociado Total2000 Swordfish−Pez espada 19 3 22 45
Blue marlin−Marlín azul 81 903 207 1,191Black marlin−Marlín negro 87 459 180 726Striped marlin−Marlín rayado 54 88 86 229Shortbill spearfish−Marlín trompa corta 13 10 6 30Sailfish−Pez vela 786 124 904 1,813Unidentified marlin−Marlín no identificado 17 23 9 50Unidentified billfish−Picudo no identificado 1 4 4 9Total 1,060 1,613 1,419 4,092
ANNUAL REPORT 2000 109

TABLE 11c. Estimated bycatches of animals other than tunas and billfishes in the EPO on fishing trips with ob-servers aboard, in numbers of individuals. Equivalent data for 1993 and 1994 are given in Table 41 of the IATTCAnnual Report for 1998.TABLA 11c. Capturas incidentales estimadas de animales aparte de atunes y picudos en el OPO en viajes de pesca conobservador a bordo, en número de individuos. En la Tabla 41 del Informe Anual de la CIAT de 1998 se presentan datosequivalentes para 1993 y 1994.
Set typeYear Species Dolphin Floating Un- Total
object associatedTipo de lance
Año Especie Delfín Objeto No Totalflotante asociado
1995 Marine mammals−Mamíferos marinos 3,268 0 6 3,274Mahi mahi−Dorado 392 549,339 31,831 581,562Wahoo−Peto 83 242,542 282 242,907Rainbow runner−Salmón 7 8,634 12 8,653Yellowtail−Jurel 0 21,800 12,489 34,289Other large teleost fish−Otros peces teleósteos grandes 11 2,010 10,581 12,602Trigger fish−Peces ballesta 1,109 768,925 13,066 783,099Other small teleost fish−Otros peces teleósteos pequeños 38,580 1,966,743 41,634 2,046,957Sharks and rays−Tiburones y rayas 8,962 36,829 8,880 54,671Sea turtles−Tortugas marinas 18 100 34 152Unidentified fish−Peces no identificados 2 1,087 918 2,007Other fauna−Otra fauna 0 2 2 4
1996 Marine mammals−Mamíferos marinos 2,547 0 0 2,547Mahi mahi−Dorado 525 626,233 7,723 634,480Wahoo−peto 23 156,239 330 156,591Rainbow runner−Salmón 1 25,812 7,350 33,163Yellowtail−Jurel 0 17,194 98,344 115,537Other large teleost fish−Otros peces teleósteos grandes 12 7,649 126,653 134,314Trigger fish−Peces ballesta 1,498 374,124 5,465 381,087Other small teleost fish−Otros peces teleósteos pequeños 141,487 460,820 65,838 668,145Sharks and rays−tiburones y rayas 7,266 38,263 6,903 52,432Sea turtles−Tortugas marinas 13 98 24 135Unidentified fish−peces no identificados 4 1,402 17 1,423Other fauna−Otra fauna 9 1 94 104
1997 Marine mammals−Mamíferos marinos 2,981 20 4 3,005Mahi mahi−Dorado 64 470,768 6,178 477,010Wahoo−Peto 3,125 474,399 774 478,298Rainbow runner−Salmón 1 54,969 2,044 57,014Yellowtail−Jurel 9,136 118,636 4,275 132,046Other large teleost fish−Otros peces teleósteos grandes 68 28,467 14,684 43,219Trigger fish−Peces ballesta 321 725,714 752 726,788Other small teleost fish−Otros peces teleósteos pequeños 16,217 1,216,287 65,011 1,297,515Sharks and rays−Tiburones y rayas 3,813 61,828 10,965 76,607Sea turtles−Tortugas marinas 12 90 68 170Unidentified fish−Peces no identificados 0 5,725 1,381 7,106Other fauna−Otros animales 0 0 0 0
110 TUNA COMMISSION

TABLE 11c. (continued)TABLA 11c. (continuación)
Set typeYear Species Dolphin Floating Un- Total
object associatedTipo de lance
Año Especie Delfín Objeto No Totalflotante asociado
1998 Marine mammals−Mamíferos marinos 1,837 0 40 1,877Mahi mahi−Dorado 225 346,268 4,774 351,267Wahoo−Peto 418 211,143 316 211,877Rainbow runner−Salmón 18 130,935 136 131,089Yellowtail−Jurel 8 116,555 5,038 121,601Other large teleost fish−Otros peces teleósteos grandes 44 75,095 27,796 102,935Trigger fish−Peces ballesta 2,352 2,011,658 5,652 2,019,662Other small teleost fish−Otros peces teleósteos pequeños 16,239 655,865 73,994 746,098Sharks and rays−Tiburones y rayas 7,129 58,615 5,488 71,232Sea turtles−Tortugas marinas 28 103 31 162Unidentified fish−Peces no identificados 87 2,950 50 3,087Other fauna−Otros animales 2 5 0 7
1999 Marine mammals-Mamíferos marinos 1,346 0 3 1,349Mahi mahi-Dorado 210 658,250 1,803 660,263Wahoo-Peto 35 304,433 268 304,736Rainbow runner-Salmón 3 136,234 202 136,439Yellowtail−Jurel 0 45,149 29,692 74,841Other large teleost fish−Otros peces teleósteos grandes 20 10,983 5,330 16,333Trigger fish−Peces ballesta 292 1,468,734 9,540 1,478,567Other small teleost fish−Otros peces teleósteos pequeños 5,944 549,074 9,654 564,672Sharks and rays−Tiburones y rayas 3,634 46,842 7,301 57,777Sea turtles−Tortugas marinas 17 128 27 172Unidentified fish−Peces no identificados 22 4,842 1,466 6,331Other fauna−Otros animales 5 0 136 141
2000 Marine mammals−Mamíferos marinos 1,607 1 28 1,636Mahi mahi−Dorado 673 558,170 18,583 577,426Wahoo−Peto 122 179,894 501 180,517Rainbow runner−Salmón 63 78,280 2,197 80,540Yellowtail−Jurel 10 14,527 11,236 25,773Other large teleost fish−Otros peces teleósteos grandes 24 6,019 3,637 9,680Trigger fish−Peces ballesta 32,140 405,913 699 438,752Other small teleost fish−Otros peces teleósteos pequeños 20,558 440,903 26,757 488,218Sharks and rays−Tiburones y rayas 2,085 28,912 8,093 39,091Sea turtles−Tortugas marinas 17 72 41 130Unidentified fish−Peces no identificados 2 551 143 695Other fauna−Otra fauna 0 0 0 0
ANNUAL REPORT 2000 111

TABLE 12. Sampling coverage of the IATTC and national programs during 2000 of trips by Class-6 vessels (capacity>363 metric tons).TABLA 12. Cobertura de muestreo del los programas de la CIAT y nacionales en 2000 de viajes de bar-cos de la clase6 (capacidad >363 toneladas métricas).
Number of Trips sampled by program Percent National fleet trips IATTC National Total sampledNúmero de Viajes muestreados por programa Porcentaje Flota nacional viajes CIAT Nacional Total muestreado
Belize−Belice 8 8 - 8 100.0Bolivia 6 51 - 5 83.3Colombia 21 21 - 21 100.0Ecuador 240 234 6 240 100.0España−Spain 35 35 - 35 100.0Guatemala 35 35 - 35 100.0Honduras 8 8 - 8 100.0México 181 92 89 181 100.0Nicaragua 6 6 - 6 100.0Panamá 24 24 - 24 100.0USA−EE.UU. 21 21 - 21 100.0Venezuela 93 60 33 93 100.0Vanuatu 46 45 - 45 97.8Total 724 5942 1283 722 99.71 Does not include a partially-sampled trip−No incluye un viaje parcialmente muestreado2 Includes 33 trips that began in late 1999 and ended in 2000, and 561 trips that began in 2000−Incluye 33 viajes ini-
ciados a fines de 1999 y terminados en 2000, y 561 viajes iniciados durante 20003 All trips began in 2000. −Todos viajes iniciados durante 2000.
112 TUNA COMMISSION

TABLE 13. Incidental mortalities of dolphins in 2000, estimates of population abundance pooled for 1986-1990 (fromReport of the International Whaling Commission, 43: 477-493), and estimates of relative mortality (with approximate95-percent confidence intervals), by stock.TABLA 13. Mortalidades incidentales de delfines en 2000, estimaciones de abundancia de poblaciones agrupadas para1986-1990 (del Informe de la Comisión Ballenera Internacional, 43: 477-493), y estimaciones de abundancia relativa(con intervalos de confianza de 95% aproximados), por stock.
Incidental Population Relative mortalitymortality abundance (percent)Stock
Mortalidad Abundancia de Mortalidad relativaincidental la población (porcentaje)
Offshore spotted−Manchado de altamarNortheastern−Nororiental 295 730,900 0.04 (0.031, 0.051)Western-southern−Occidental y sureño 435 1,298,400 0.03 (0.026, 0.047)
Spinner dolphin−TornilloEastern−Oriental 275 631,800 0.05 (0.027, 0.066)Whitebelly−Panza blanca 262 1,019,300 0.03 (0.016, 0.034)
Common dolphin−ComúnNorthern−Norteño 54 476,300 0.01 (0.006, 0.024)Central 223 406,100 0.06 (0.029, 0.108)Southern−Sureño 10 2,210,900 <0.01 (<0.001,<0.001)
Other dolphins−Otros delfines1 82 2,802,300 <0.01 (0.002, 0.003)Total 1,636 9,576,000 0.02 (0.015, 0.019)1 “Other dolphins” includes the following species and stocks, whose observed mortalities were as follows: striped dol-
phins (Stenella coeruleoalba), 11; bottlenose dolphins (Tursiops truncatus), 4; Central American spinner dolphins(Stenella longirostris centroamericana), 2; rough-toothed dolphin (Steno bredanensis), 27; short-finned pilot whale (Globicephala macrorhynchus), 1; and unidentified dolphins, 37.
1 “Otros delfines” incluye las siguientes especies y stocks, con las mortalidades observadas correspondientes: delfín listado (Stenella coeruleoalba), 11; tonina (Tursiops truncatus), 4; delfín tornillo centroamericano (Stenella longirostriscentroamericana), 2; delfín de dientes rugosos (Steno bredanensis), 27; ballenas piloto (Globicephala macrorhynchus),1; y delfines no identificados, 37.
ANNUAL REPORT 2000 113

TABLE 14a. Annual estimates of dolphin mortality, by species and stock. All the data for 2000 are preliminary. Theestimates for 1979-1992 are based on a mortality-per-set ratio. The estimates for 1993-1994 are based on the sums ofthe IATTC species and stock tallies and the PNAAPD total dolphin mortalities, prorated to species and stock. The mor-talities for 1995-2000 represent the sums of the observed species and stock tallies recorded by the IATTC, PNAAPD,PNOV, and PROBECUADOR programs. The standard errors for 1979-1994 are shown in Table 4. The sums of the esti-mated mortalities for the northeastern and western-southern stocks of offshore spotted dolphins do not necessarilyequal those for the previous stocks of northern and southern offshore spotted dolphins because the estimates for the twostock groups are based on different areal strata, and the mortalities per set and the total numbers of sets vary spatially.TABLA 14a. Estimaciones anuales de la mortalidad de delfines, por especie y stock. Todos los datos para 2000 sonpreliminares. Las estimaciones para 1979-1992 se basan en una razón de mortalidad por lance. Las estimaciones para1993-1994 se basan en las sumas de las mortalidades por especie y stock registradas por la CIAT y las mortalidadestotales registradas por el PNAAPD, prorrateadas a especies y stocks. Las mortalidades para 1995-2000 son las sumasde las mortalidades por especie y stock registradas por las programas de la CIAT, PNAAPD, PNOV y PROBECUADOR.En la Tabla 4 se detallan los errores estándar para 1979-1994. Las sumas de las mortalidades estimadas para los stocksnororiental y occidental y sureño del delfín manchado de altamar no equivalen necesariamente a las sumas de aquéllaspara los antiguos stocks de delfín manchado de altamar norteño y sureño porque las estimaciones para los dos gruposde stocks se basan en estratos espaciales diferentes, y las mortalidades por lance y el número total de lances varían espacialmente.
Offshore spotted Spinner CommonYearNorth- Western- Eastern White- Northern Central Southern Others Totaleastern southern bellyManchado de altamar Tornillo ComúnAño
Nor- Occiden- Oriental Panza Norteño Central Sureño Otros Totaloriental tal y sureño blanca
1979 4,828 6,254 1,460 1,312 4,161 2,342 94 880 21,3311980 6,468 11,200 1,108 8,132 1,060 963 188 633 29,7521981 8,096 12,512 2,261 6,412 2,629 372 348 367 32,9971982 9,254 9,869 2,606 3,716 989 487 28 1,347 28,2961983 2,430 4,587 745 4,337 845 191 0 353 13,4881984 7,836 10,018 6,033 7,132 0 7,403 6 156 38,5841985 25,975 8,089 8,853 6,979 0 6,839 304 1,777 58,8161986 52,035 20,074 19,526 11,042 13,289 10,884 134 5,185 132,1691987 35,366 19,298 10,358 6,026 8,216 9,659 6,759 3,200 98,8821988 26,625 13,916 18,793 3,545 4,829 7,128 4,219 2,074 81,1291989 28,898 28,530 15,245 8,302 1,066 12,711 576 3,123 98,4511990 22,616 12,578 5,378 6,952 704 4,053 272 1,321 53,8741991 9,005 4,821 5,879 2,974 161 3,182 115 990 27,1271992 4,657 1,874 2,794 2,044 1,773 1,815 64 518 15,5391993 1,139 757 821 412 81 230 0 161 3,6011994 935 1,226 743 619 101 151 0 321 4,0961995 952 859 654 445 9 192 0 163 3,2741996 818 545 450 447 77 51 30 129 2,5471997 721 1,044 391 498 9 114 58 170 3,0051998 298 341 422 249 261 172 33 101 1,8771999 358 253 363 192 85 34 1 62 1,3482000 295 435 275 262 54 223 10 82 1,636
114 TUNA COMMISSION

TABLE 14b. Standard errors of annual estimates of dolphin species and stock mortality for 1979-1994. There are nostandard errors for 1995-2000 because the coverage was at or nearly at 100% during those years (Table 12).TABLA 14b. Errores estándar de las estimaciones anuales de la mortalidad de delfines por especie y stock para 1979-1994. No hay errores estándar para 1995-2000 porque la cobertura fue de 100%, o casi, en esos años (Tabla 12).
Offshore spotted Spinner CommonYear OthersNortheastern Western-Southern Eastern Whitebelly Northern Central Southern
Manchado de altamar Tornillo ComúnAño OtrosNororiental Occidental y sureño Oriental Panza blanca Norteño Central Sureño
1979 817 1,229 276 255 1,432 560 115 2041980 962 2,430 187 3,239 438 567 140 2171981 1,508 2,629 616 1,477 645 167 230 761982 1,529 1,146 692 831 495 168 16 5121983 659 928 284 1,043 349 87 - 1711984 1,493 2,614 2,421 3,773 - 5,093 3 721985 3,210 951 1,362 1,882 - 2,776 247 5701986 8,134 2,187 3,404 2,454 5,107 3,062 111 1,7221987 4,272 2,899 1,199 1,589 4,954 2,507 3,323 1,1401988 2,744 1,741 1,749 668 1,020 1,224 1,354 3991989 3,108 2,675 1,674 883 325 4,168 295 4301990 2,575 1,015 949 640 192 1,223 95 4051991 956 454 771 598 57 442 30 1821992 321 288 168 297 329 157 8 951993 89 52 98 33 27 - - 291994 69 55 84 41 35 8 - 20
ANNUAL REPORT 2000 115

TABL
E 15
. Pe
rcent
ages
of se
ts wi
th n
o dolp
hin
morta
lities
, with
majo
r gea
r malf
uncti
ons,
with
net
colla
pses
, with
net
cano
pies,
aver
age t
imes
of b
ackd
own
(in m
inut
es),
and
aver
age
numb
er of
live
dolph
ins l
eft in
the n
et at
the e
nd of
back
down
. TA
BLA
15. P
orce
ntaje
s de l
ance
s sin
mor
talid
ad de
delfi
nes,
con
aver
ías m
ayor
es, c
on co
lapso
de la
red,
con
abul
tami
ento
de la
red,
dura
ción
media
del r
etroc
eso (
en m
inut
os),
y núm
ero
medio
de de
lfine
s vivo
s en
la re
d des
pués
del r
etroc
eso.
Aver
age
Aver
age
num
ber
Sets
with
zero
Sets
with
maj
orSe
ts w
ith n
etSe
ts w
ith n
etdu
ratio
n of
of li
ve d
olph
ins
Year
mor
talit
ym
alfu
nctio
nsco
llaps
eca
nopy
back
down
le
ft in
net
afte
r(p
erce
nt)
(per
cent
)(p
erce
nt)
(per
cent
)(m
inut
es)
back
down
Lanc
es co
nLa
nces
con
Núm
ero
med
io d
e La
nces
sin
Lanc
es co
nDu
raci
ón m
edia
cola
pso
de la
abul
tam
ient
ode
lfine
s viv
os e
n la
Año
mor
talid
adav
ería
s may
ores
del r
etro
ceso
red
de la
red
red
desp
ués
(por
cent
aje)
(por
cent
aje)
(min
utos
)(p
orce
ntaj
e)(p
orce
ntaj
e)de
l ret
roce
so19
8638
.19.5
29.0
22.2
15.3
6.019
8746
.110
.932
.918
.914
.64.4
1988
45.1
11.6
31.6
22.7
14.3
5.519
8944
.910
.329
.718
.315
.15.0
1990
54.2
9.830
.116
.714
.32.4
1991
61.9
10.6
25.2
13.2
14.2
1.619
9273
.48.9
22.0
7.313
.01.3
1993
84.3
9.412
.95.7
13.2
0.719
9483
.48.2
10.9
6.515
.10.3
1995
85.0
7.710
.36.0
14.0
0.419
9687
.67.1
7.34.9
13.6
0.219
9787
.76.6
6.14.6
14.3
0.219
9890
.36.3
4.93.7
13.2
0.219
9991
.06.6
5.94.6
14.0
0.120
0090
.85.6
4.35.0
14.9
0.2
116 TUNA COMMISSION

TABLE 16. Estimates of indices of relative abundance for northeastern offshore spotted dolphins and eastern spinnerdolphins, in thousands of animals, for the hazard-rate model (previously-published time series) and the half-normalmodel. Bootstrap standard errors shown in parentheses. Also shown for the northeastern offshore spotted dolphin is apreliminary revised index computed from indices based on different modes of search.TABLA 16. Estimaciones de los índices de abundancia relativa de los delfines manchado de altamar nororiental ytornillo oriental, en miles de animales, para el modelo de tasa de riesgo (serie de tiempo publicada previamente) y elmodelo half-normal. Errores estándar de bootstrap en paréntesis. Para el delfín manchado de altamar nororiental sepresenta también un índice revisado preliminar calculado a partir de índices basados en distintas modalidades de búsqueda.
Northeastern offshore spotted Eastern spinnerHazard-rate Half-normal Revised Hazard-rate Half-normal
Manchado de altamar nororiental Tornillo orientalTasa de riesgo Half-normal Revisado Tasa de riesgo Half-normal
1977 1,523 (257) 1,281 (268) 494 (137) 399 (127)1978 1,187 (227) 965 (154) 428 (153) 277 (94)1979 1,432 (282) 1,092 (181) 323 (184) 289 (146)1980 1,348 (252) 1,063 (159) 381 (117) 293 (72)1981 976 (117) 804 (98) 222 (120) 275 (83)1982 1,054 (143) 887 (99) 212 (102) 222 (58)1983 532 (116) 641 (96) 410 (133) 377 (97)1984 1,027 (238) 914 (187) 846 (196) 375 (139) 329 (105)1985 1,394 (183) 1,097 (115) 1,121 (165) 587 (136) 513 (98)1986 1,401 (188) 1,122 (109) 1,147 (176) 590 (118) 476 (87)1987 1,067 (68) 910 (61) 1,022 (146) 363 (100) 336 (71)1988 1,159 (135) 1,046 (91) 1,171 (150) 717 (110) 630 (99)1989 1,188 (129) 1,063 (84) 1,159 (166) 389 (71) 340 (63)1990 1,072 (79) 952 (67) 1,103 (156) 358 (76) 305 (76)1991 1,174 (94) 1,094 (87) 1,097 (191) 358 (65) 316 (67)1992 1,282 (92) 1,226 (78) 1,393 (221) 410 (91) 456 (103)1993 911 (68) 965 (77) 1,063 (178) 295 (54) 275 (54)1994 895 (63) 894 (81) 1,023 (174) 408 (85) 336 (66)1995 913 (61) 1,003 (87) 1,124 (182) 538 (83) 517 (93)1996 910 (56) 913 (76) 1,053 (166) 483 (139) 436 (158)1997 927 (54) 976 (57) 1,083 (168) 439 (127) 437 (110)1998 579 (63) 613 (64) 685 (125) 275 (56) 309 (46)1999 693 (57) 735 (61) 818 (144) 427 (75) 408 (59)2000 603 (57) 599 (57) 688 (118) 288 (68) 325 (63)
ANNUAL REPORT 2000 117

118 COMISION DEL ATUN

INFORME ANUAL DE LACOMISION INTERAMERICANA DEL ATUN TROPICAL, 2000
INTRODUCCION
La Comisión Interamericana del Atún Tropical (CIAT) funciona bajo la autoridad y direc-ción de una convención suscrita originalmente por Costa Rica y los Estados Unidos de América.La convención, vigente desde 1950, está abierta a la afiliación de cualquier país cuyos ciu-dadanos pesquen atunes tropicales y especies afines en el Océano Pacífico oriental (OPO). Bajoesta estipulación, la República de Panamá se afilió en 1953, Ecuador en 1961, México en 1964,Canadá en 1968, Japón en 1970, Francia y Nicaragua en 1973, Vanuatu en 1990, Venezuela en1992, El Salvador en 1997, y Guatemala en 2000. Canadá se retiró de la CIAT en 1984.
La CIAT cumple su mandato mediante dos programas, el Programa Atún-Picudo y elPrograma Atún-Delfín.
Las responsabilidades principales del Programa Atún-Picudo detalladas en la Convenciónde la CIAT son (1) estudiar la biología de los atunes y especies afines en el OPO para evaluarlos efectos de la pesca y los factores naturales sobre su abundancia, y (2) recomendar lasmedidas de conservación apropiadas para que los stocks de peces puedan mantenerse a nivelesque permitan las capturas máximas sostenibles. Posteriormente fue asignado la responsabil-idad de reunir información sobre el cumplimiento de las resoluciones de la Comisión.
En 1976 se ampliaron las responsabilidades de la CIAT para abarcar los problemas oca-sionados por la mortalidad incidental en las redes de cerco de delfines asociados con atunes aletaamarilla en el OPO. La Comisión acordó trabajar para mantener la producción atunera a unalto nivel y al mismo tiempo mantener a los stocks de delfines a, o por encima de, niveles quegarantizaran su supervivencia a perpetuidad, haciendo todos los esfuerzos razonablemente posi-bles por evitar la muerte innecesaria o por descuido de delfines (Actas de la 33ª reunión de laCIAT; página 9). El resultado fue la creación del Programa Atún-Delfín de la CIAT, cuyasresponsabilidades principales son (1) dar seguimiento a la abundancia de los delfines y su mor-talidad incidental a la pesca con red de cerco en el OPO, (2) estudiar las causas de la mortalidadde delfines en las faenas de pesca y promover el uso de técnicas y aparejos de pesca que reduzcandicha mortalidad al mínimo posible, (3) estudiar los efectos de las distintas modalidades depesca sobre las poblaciones de peces y otros animales del ecosistema pelágico, y (4) proporcionarla secretaría para el Programa Internacional para la Conservación de los Delfines, descrito acontinuación.
El 17 de junio de 1992 se adoptó el Acuerdo para la Conservación de Delfines (“el Acuerdode La Jolla de 1992”), mediante el cual se creó el Programa Internacional para la Conservaciónde Delfines (PICD). El objetivo principal del Acuerdo fue reducir la mortalidad de delfines en lapesquería cerquera sin perjudicar los recursos atuneros de la región y las pesquerías quedependen de los mismos. El 21 de mayo de 1998 se firmó el Acuerdo sobre el ProgramaInternacional para la Conservación de los Delfines (APICD), que amplía y formaliza las disposi-ciones del Acuerdo de La Jolla, y el 15 de febrero de 1999 entró en vigor. Las Partes de esteAcuerdo se comprometieron a “asegurar la sostenibilidad de las poblaciones de atún en elOcéano Pacífico Oriental y a reducir progresivamente la mortalidad incidental de delfines en lapesquería de atún del Océano Pacífico Oriental a niveles cercanos a cero; a evitar, reducir y min-imizar la captura incidental y los descartes de atunes juveniles y la captura incidental de lasespecies no objetivo, considerando la interrelación entre especies en el ecosistema.”
Para llevar a cabo estas misiones, la CIAT realiza una amplia investigación en el mar, en
INFORME ANUAL 2000 119

120 COMISION DEL ATUN
los puertos donde se desembarca el atún, y en sus laboratorios. Estos estudios son llevados acabo por un equipo internacional permanente de investigadores y técnicos (Anexo 1), selecciona-dos por el Director, quien responde directamente ante la Comisión.
El programa científico se encuentra en su 50º año. Los resultados de las investigacionesdel personal de la CIAT son publicados en la serie de Boletines e Informes de Evaluación deStocks de la CIAT en inglés y español, los dos idiomas oficiales, en su serie de Informes Espe-ciales e Informes de Datos, y en libros, revistas científicas externas, y revistas comerciales. Enun Informe Anual, asimismo bilingüe, se resumen las actividades realizadas en el año en cues-tión.
REUNIONESSe pueden obtener las actas o informes de las varias reuniones descritas a continuación
en el sitio de internet de la CIAT, www.iattc.org.
REUNIONES DE LA CIAT66ª reunión de la CIAT
La 66ª reunión de la CIAT fue celebrada en San José de Costa Rica el 12 y 14-15 de juniode 2000. Se tomaron las acciones siguientes:
(1) Se adoptó una resolución sobre una cuota de captura para el aleta amarilla. La reso-lución estableció un “período de restricción,” durante el cual los buques cerqueros y de carnadano podrían pescar atún aleta amarilla en dos zonas, una frente a México y la otra frente a Ecua-dor, y una “fecha de veda,” después de la cual esa misma prohibición abarcaría toda el Area deRegulación de la Comisión para el Aleta Amarilla (Figura 1).
(2) Se adoptó una resolución sobre la conservación del atún patudo, mediante la cual serestringió la pesca con red de cerco de atunes asociados con objetos flotantes.
(3) Se adoptó una resolución sobre la captura incidental. Entre otros, estableció un pro-grama piloto de un año para 2001, durante el cual todo atún aleta amarilla, patudo, y barriletecapturado, independientemente de su tamaño, sería retenido a bordo del buque.
(4) Se adoptó una resolución sobre un registro regional de buques, instando a las Partesde la CIAT y a gobiernos no miembros con jurisdicción sobre buques participantes en la pesque-ría a proporcionar información sobre dichos buques al personal de la CIAT.
(5) Se adoptó una resolución sobre el cumplimiento, estableciendo obligaciones con res-pecto al cumplimiento de las resoluciones de la CIAT para las Partes y para las no Partes cuyasflotas operan en el OPO.
(6) Se adoptó una resolución sobre el financiamiento de la CIAT, estableciendo las con-tribuciones de las Partes de la CIAT al presupuesto de la misma para el año fiscal 2000-2001.
(7) Se adoptó una resolución sobre la pesca por buques bajo la jurisdicción de estados oentidades pesqueras no miembros de la CIAT.
(8) Se adoptó una resolución sobre estudios de la abundancia de delfines en el Pacífico ori-ental, pertinente principalmente a estudios realizados por el Servicio Nacional de PesqueríasMarinas de Estados Unidos.
(9) Se eligió al Embajador Jean-François Pulvenis, de Venezuela, Presidente de la CIATde junio de 2000 hasta junio de 2001.
67ª reunión de la CIAT
La 67ª reunión de la CIAT tuvo lugar en La Jolla el 26 de octubre de 2000. El Dr. Robin

Allen, Director de la CIAT, presentó informes informales sobre los reuniones recientes del grupode trabajo científico sobre el atún patudo, la revisión científica de los métodos usados para esti-mar la abundancia de delfines, y las capturas hasta la fecha de atún aleta amarilla en el OPO.
Simposio sobre las pesquerías de atún del mundo
Para marcar el 50 aniversario de la CIAT, se celebró un simposio sobre las pesquerías deatún del mundo en San José de Costa Rica el 13 de junio de 2000, bajo la presidencia del M. enC. Herbert Nanne, de Costa Rica. Presentaron ponencias el Sr. John F. Caddy (ImperialCollege, Londres); Sr. Campbell McGregor (Comisión para la Conservación del Aleta Azul delSur); Dr. Robin L. Allen (CIAT); Sr. Adolfo Ribeiro Lima (Comisión Internacional para laConservación del Atún Atlántico); Sr. Alejandro A. Anganuzzi (Comisión del Atún del OcéanoIndico); Sr. Michael Lodge (Autoridad Internacional de los Fondos Marinos); y Dr. James Joseph(CIAT). Se publicarán estos discursos en 2001 como Informe Especial de la CIAT.
Revisión científica de los métodos para estimar la abundancia de delfines
El 19 y 20 de octubre tuvo lugar en La Jolla una revisión científica de los métodos paraestimar la abundancia de delfines. El material cubierto durante la reunión incluyó el diseño yresultados de los estudios de delfines realizados por el Servicio Nacional de Pesquerías Marinasde EE.UU. durante 1998 y 1999, las diferencias entre los estudios de los dos años, las distribu-ciones de los distintos stocks de delfines, la oceanografía relacionada con la distribución de losdelfines en el OPO, un cambio potencial de régimen en el OPO, la variabilidad interanual de losresultados de los estudios y la oceanografía, y otros factores que potencialmente afecten la va-riabilidad de los estudios.
REUNIONES DE GRUPOS DE TRABAJO DE LA CIAT
Tercera reunión del Grupo de Trabajo Permanente sobre la Capacidad de la Flota
La 3ª reunión del Grupo de Trabajo Permanente sobre la Capacidad de la Flota tuvo lugaren San José de Costa Rica del 26 al 28 de enero de 2000. El grupo formuló una serie de reco-mendaciones que fueron subsecuentemente distribuidas a los miembros de la CIAT y adoptadascomo resolución el 17 de febrero de 2000.
Cuarta reunión del Grupo de Trabajo Permanente sobre la Capacidad de la Flota
La cuarta reunión del Grupo de Trabajo Permanente sobre la Capacidad de la Flota fuecelebrada en Panamá, R.P., del 31 de julio al 2 de agosto de 2000. El grupo consideró variaspropuestas para la gestión de la capacidad de la flota cerquera en el OPO. El 19 de agosto seaprobó por correspondencia una resolución reconociendo el compromiso a establecer un límitesobre la capacidad de la flota.
Quinta reunión del Grupo de Trabajo Permanente sobre la Capacidad de la Flota
Se celebró la quinta reunión del Grupo de Trabajo Permanente sobre la Capacidad de laFlota en La Jolla el 25 y 26 de octubre. Se discutió un proyecto de resolución sobre la capacidadde la flota atunera operando en el OPO, pero no se llegó a un acuerdo sobre el mismo.
Segunda reunión del Grupo de Trabajo sobre Financiamiento
El Grupo de Trabajo sobre Financiamiento se reunió en la Ciudad de México el 9 y 10 de
INFORME ANUAL 2000 121

febrero de 2000. El mandato del grupo de trabajo es (a) desarrollar un sistema para determinarlas obligaciones de las Partes para financiar la CIAT en el futuro y (b) determinar las contribu-ciones de Partes para el año financiero (AF) 2001 (1 de octubre de 2000-30 de septiembre de2001). Se acordó que es necesario un sistema basado en una fórmula para que los Comisionadosy administradores de cada Parte puedan explicar a sus entidades legislativas y financieras elsistema y la lógica usados para determinar las contribuciones nacionales. Se presentaron y dis-cutieron varios sistemas posibles, y se acordó que el que obtuviese la mayor aprobación seríapresentado a la próxima sesión plenaria de la CIAT.
Segunda reunión del Grupo de Trabajo sobre Captura Incidental
La segunda reunión del Grupo de Trabajo sobre Captura Incidental fue celebrada en LaJolla, California (EE.UU.), del 4 al 6 de abril de 2000. Se presentaron y discutieron los informesde los subgrupos sobre estudios y modelado ecológicos y tecnología y técnicas de pesca, y secomentaron opciones para reducir las capturas incidentales.
Primera reunión del Grupo de Trabajo Científico
El Grupo de Trabajo Científico se reunió en La Jolla, California (EE.UU.), del 10 al 13 deabril de 2000. Los miembros del grupo analizaron las evaluaciones de los stocks de aleta amar-illa, barrilete, patudo, aleta azul, albacora, y marlín azul preparadas por el personal de la CIAT.
Reunión del Grupo de Trabajo Científico sobre el Atún Patudo
Se celebró una reunión del grupo de trabajo científico sobre el atún patudo en La Jolla,California (EE.UU.) el 23 y 24 de octubre de 2000. Los temas principales tratados en la reuniónfueron los acontecimientos recientes en la pesquerías, una actualización de la evaluación destocks del patudo en el OPO, un informe sobre un modelado del patudo a escala del Pacífico en-tero, los resultados de un programa piloto de marcado realizado por la CIAT a principios de2000, métodos alternativos para reducir las capturas de patudo juvenil, y la precisión de las cap-turas estimadas de patudo.
Cuarta reunión del Grupo de Trabajo sobre la Convención de la CIAT
La cuarta reunión del Grupo de Trabajo sobre la Convención de la CIAT fue celebrada enLa Jolla del 22 al 25 de mayo de 2000.
Quinta reunión del Grupo de Trabajo sobre la Convención de la CIAT
La quinta reunión del Grupo de Trabajo sobre la Convención de la CIAT fue celebrada enLa Jolla del 11 al 16 de septiembre de 2000. El grupo continuó su discusión del texto delPresidente revisado de la Convención y de ciertos temas que quedaron pendientes de susreuniones previas; se presentaron también algunas propuestas nuevas. Los miembros delGrupo acordaron volver a reunirse en marzo de 2001, y fijaron junio de 2001 como fecha obje-tivo para presentar un proyecto de texto acordado a la Comisión.
Primera reunión del Grupo de Trabajo sobre Cumplimiento
La primera reunión del Grupo de Trabajo sobre Cumplimiento fue celebrada en San Joséde Costa Rica el 9 y 10 de junio de 2000. Se discutieron los problemas de asegurar el cumpli-miento de las resoluciones de la CIAT, y métodos, inclusive sistemas de seguimiento de buques,para superar faltas de cumplimiento.
122 COMISION DEL ATUN

REUNIONES DE LAS PARTES DEL ACUERDO SOBRE EL PROGRAMA INTERNA-CIONAL PARA LA CONSERVACION DE LOS DELFINES (APICD)
Tercera reunión de las Partes del APICD
La tercera reunión de las Partes del APICD fue celebrada en San José de Costa Rica el 17de junio de 2000, Se decidió modificar el Sistema de Seguimiento de Atún.
Cuarta reunión de las Partes del APICD
Se celebró la 4ª Reunión de las Partes del APICD en La Jolla el 28 y 29 de octubre. Lostemas discutidos incluyeron el informe de la 25ª reunión del Panel Internacional de Revisión, laasignación de LMD a buques individuales, normas sobre el uso de técnicas o aparejos de pescaexperimentales, el informe del grupo de trabajo sobre límites anuales de mortalidad de delfinespor población, un sistema de informes en tiempo real sobre la mortalidad de delfines, y la situa-ción con respecto a un estado que no cooperaba con el APICD.
REUNIONES DE GRUPOS DE TRABAJO DEL APICD23ª reunión del Panel Internacional de Revisión
La 23ª reunión del Panel Internacional de Revisión tuvo lugar en San José de Costa Ricael 24 y 25 de enero de 2000. El Panel analizó las posibles infracciones del APICD reportadas porlos observadores, aprobó una lista de capitanes calificados para pescar atunes asociados con del-fines, repasó la asignación inicial de LMD para 2000, discutió el sistema de seguimiento y veri-ficación de atún, y discutió procedimientos de rescate de delfines alternativos al retroceso.
24ª reunión del Panel Internacional de Revisión
La 24ª reunión del Panel Internacional de Revisión tuvo lugar en San José de Costa Ricael 7 y 8 de junio de 2000. El Panel analizó las posibles infracciones del APICD reportadas porlos observadores, revisó los LMD de 1999 y 2000, discutió criterios para otorgar a los buques laexención de fuerza mayor o circunstancias extraordinarias, y discutió el sistema de seguimientoy verificación de atún.
25ª reunión del Panel Internacional de Revisión
El Panel Internacional de Revisión celebró su 25ª reunión en La Jolla el 27 de octubre de2000. El Panel revisó las posibles infracciones del APICD reportadas por los observadores,aprobó un procedimiento propuesto para añadir capitanes de pesca a la lista de capitanes califi-cados, discutió el informe de la Presidente del Grupo de Trabajo Permanente sobre el Segui-miento del Atún, y revisó lo siguiente: límites de mortalidad de delfines (LMD) para 2000 y2001, la lista de buques calificados para recibir LMD para 2001, lineamientos para determinarposibles infracciones del APICD, y las acciones de las Partes en respuesta a posibles infraccio-nes reportadas por el Panel.
Quinta reunión del Grupo de Trabajo Permanente sobre el Seguimiento del Atún
Se celebró la quinta reunión del Grupo de Trabajo Permanente sobre el Seguimiento delAtún en La Jolla el 27 de octubre. Se discutieron mecanismos para el seguimiento del atún.
INFORME ANUAL 2000 123

Tercera reunión del grupo de trabajo sobre límites anuales de mortalidad de delfinespor población
El 28 de octubre tuvo lugar en La Jolla la tercera reunión del grupo de trabajo sobre lími-tes anuales de mortalidad de delfines por población. Se discutió un sistema para 2001, y la ma-yoría de los participantes concurrió en que se debería aplicar estos límites sobre una base global,al igual que durante 2000.
ADMINISTRACION
PRESUPUESTOEn su 61ª reunión, celebrada del 10 al 12 de junio de 1998 en La Jolla, California
(EE.UU.), la Comisión aprobó unánimemente el presupuesto de US$4.701.333 presentado por elDirector para el año fiscal 1999-2000. Sin embargo, la cantidad aportada por los estados miem-bros en dicho año fue US$4.392.475, o US$308.858 menos que la suma recomendada y aproba-da para el presupuesto regular. Como consecuencia se tuvo que limitar algunos proyectosprogramados. Además de su presupuesto regular, durante el año fiscal 1999-2000 la CIATrecibió US$1.497.891 de armadores de barcos para sufragar parte de los costos de proveer obser-vadores para sus embarcaciones, conforme a las disposiciones del Acuerdo sobre el ProgramaInternacional para la Conservación de los Delfines, y US$112.543 por concepto de intereses y deotras fuentes.
INFORME FINANCIEROEl estado de cuentas de la Comisión para el año fiscal 1999-2000 fue verificado por KPMG
LLP. En el Anexo 2 del presente informe se presentan las tablas compendiadas de su informe.
COLABORACION CON ENTIDADES AFINESDurante 2000 el equipo de investigadores de la CIAT continuó desarrollando vínculos es-
trechos con organizaciones e instituciones de investigación internacionales, gubernamentales,universitarias, y privadas. Esta reciprocidad permite a los investigadores mantenerse al corri-ente de los avances más actuales en la investigación pesquera y oceanográfica a nivel mundial.A continuación se describen algunos aspectos de estas relaciones.
Las oficinas principales de la CIAT se encuentran situadas en los terrenos del ScrippsInstitution of Oceanography (SIO) de la Universidad de California en La Jolla, California, unode los principales centros mundiales de ciencias marinas y sede de varias agencias gubernamen-tales federales y estatales de pesca, oceanografía, y ciencias afines. Esta situación fomenta uncontacto frecuente entre los investigadores de la CIAT y los científicos de estas entidades. ElDr. Richard B. Deriso fue catedrático del SIO durante 2000.
El Dr. Deriso fue también miembro de la cátedra en la Universidad de Washington enSeattle, Washington (EE.UU.), el Dr. Martín A. Hall en la Universidad de Columbia Británicaen Vancouver (Canadá), el Dr. Michael G. Hinton en la Universidad de San Diego, California(EE.UU.), y el Dr. Pablo R. Arenas en el Centro Interdisciplinario de Ciencias Marinas(CICIMAR) del Instituto Politécnico Nacional en La Paz (México). Los Dres. Arenas, Deriso,Hall, Hinton y Robert J. Olson sirvieron en comités supervisores de las investigaciones de estu-diantes de postgraduado en varias universidades durante 2000.
Durante muchos años se han mantenido relaciones cordiales y productivas con la Comi-sión para la Conservación del Atún Aleta Azul del Sur (CCSBT), la Comisión Internacional para
124 COMISION DEL ATUN

la Conservación del Atún Atlántico (ICCAT), la Comisión Permanente del Pacífico Sur, la Or-ganización de las Naciones Unidas para la Agricultura y la Alimentación (FAO), la Comisión delAtún del Océano Indico (IOTC), la Organización Latinoamericana de Desarrollo Pesquero (OLD-EPESCA), el Secretariado de la Comunidad de Pacífico (SPC), y otros organismos interna-cionales. La CIAT se hizo miembro del Grupo de Trabajo Coordinador sobre Estadísticas dePesca de FAO en diciembre de 2000. El Dr. Robin Allen fue miembro del comité directivo paraun simposio sobre la variabilidad climática y su impacto ecológico sobre la biota del Océano Pa-cífico, celebrado a principios de 2000 y patrocinado por el North Pacific Marine Science Orga-nization (PICES), la CIAT, la International Pacific Halibut Commission, y el Comité CientíficoProvisional para Atunes y Especies Afines en el Océano Pacífico Norte. El Dr. Allen presidió lareunión en marzo de 2000 del comité directivo para la Consulta Experta sobre las Implicacionesdel Enfoque Precautorio: Investigación Biológica y Tecnológica de los Atunes, patrocinado por laCCSBT, FAO, la CIAT, ICCAT, la IOTC, y el SPC. El Dr. Hinton presidió el Grupo de Trabajosobre estadística y colección de datos para la consulta. Los Dres. Mark N. Maunder y George M.Watters participaron, con científicos del Instituto Nacional de Investigación de Pesquerías deUltramar del Japón y la SPC, en un proyecto cooperativo para evaluar la condición de los stocksde atún patudo en el Océano Pacífico. Este programa es financiado por el Programa deInvestigación de Pesquerías Pelágicas de la Universidad de Hawaii.
Asimismo durante 2000, el personal de la CIAT continuó su estrecha colaboración conagencias pesqueras de naciones afiliadas a la CIAT y con organismos similares de diversos paí-ses no afiliados. El Dr. Richard B. Deriso fue miembro del Comité Científico y Estadístico delConsejo de Administración de Pesquerías del Pacífico Occidental de Estados Unidos. Dr. AshleyJ. Mullen fue Editor Asociado de Natural Resource Modeling, revista publicada por el RockyMountain Mathematics Consortium en asociación con la Resource Modeling Association. El Dr.Michael D. Scott fue Presidente del Pacific Scientific Review Group, responsable de revisar lasnormas de ordenación y programas de investigación de EE.UU. de mamíferos marinos en elOcéano Pacífico. Además, el Dr. Scott participó en una investigación conjunta del delfínTursiops del Atlántico con científicos del Servicio Nacional de Pesquerías Marinas de EE.UU.,la Universidad de Carolina del Norte en Wilmington, y el Instituto Oceanográfico de WoodsHole. El Dr. Naozumi Miyabe, del Instituto Nacional de Investigación de Pesquerías deUltramar en Shimizu (Japón), y el Sr. Kurt M. Schaefer, de la CIAT, realizaron investigacionesconjuntas de la biología reproductora del atún patudo en el OPO. Los Dres. Felipe GalvánMagaña, de CICIMAR, y Robert J. Olson, de la CIAT, continuaron su estudio conjunto de lasinteracciones tróficas de atunes aleta amarilla, delfines, y depredadores asociados en el OcéanoPacífico oriental, descrito en la página 238 del Informe Anual de 1995. El Dr. Olson y el Dr.James F. Kitchell, de la Universidad de Wisconsin, coordinaron el Grupo de Trabajo sobre lasImplicaciones Ecológicas de Estrategias Alternativas de Pesca de Depredadores Tope, patroci-nado por el Centro Nacional para Análisis y Síntesis Ecológicos (NCEAS), subvencionado por laFundación Nacional de Ciencia de EE.UU. y el Estado de California. La beca otorgada por elNCEAS paga una serie de reuniones técnicas para desarrollar y evaluar un modelo de la red tró-fica para el Océano Pacífico oriental pelágico. El Dr. George M. Watters fue también miembrodel grupo de trabajo. La Dra. Cleridy E. Lennert-Cody trabajó con el Dr. Stephen T. Buckland,antiguo empleado de la CIAT y entonces catedrático de la Universidad de St. Andrews (Escocia),y la Sra. Fernanda F. C. Marques, estudiante de posgraduado en dicha universidad, en unarevisión de la metodología actual de la CIAT para estimar la abundancia relativa de las especiesy poblaciones de delfines en el OPO. Durante 1999 y 2000 investigadores del Monterey BayAquarium, que estaban capturando atunes aleta azul frente a Baja California para varios estu-
INFORME ANUAL 2000 125

dios científicos, colocaron marcas de dardo de la CIAT en peces demasiado pequeños para suspropósitos y los liberaron. Las marcas en los peces recapturados fueron devueltas al personalde la CIAT, y la información sobre las mismas fue añadida a la base de datos de marcado de laCIAT.
Desde 1977 los investigadores de la CIAT capacitan observadores para la toma, a bordode barcos atuneros, de datos sobre la abundancia, mortalidad, y otros aspectos de la biología delos delfines. Además, estos observadores colectan contenidos estomacales y muestras de góna-das y otros tejidos de atún, reúnen datos sobre las capturas incidentales de especies además deatunes y delfines, registran información sobre objetos flotantes y la flora y fauna con ellos aso-ciadas, etcétera. Diversas organizaciones gubernamentales e instituciones educativas, así comorepresentantes del sector industrial, han colaborado activamente en el entrenamiento yembarque de estos observadores. México establació su proprio programa de observadores en1991, y Ecuador y Venezuela establecieron sus propios programas de observadores en 2000. LosSres. Ernesto Altamirano Nieto y Marlon Román Verdesoto ayudaron con el entrenamiento delos observadores ecuatorianos, y el Sr. Nickolas W. Vogel trabajó con miembros del programavenezolano en la incorporación de programas de computadora para la captura y edición de datosy el establecimiento de bases de datos similares a las que usa el personal de la CIAT, y a prin-cipios de 2001 hará lo mismo con el programa ecuatoriano. De esta forma se posibilitará elintercambio eficaz de datos entre los programas.
A través de los años, científicos y estudiantes de muchos países han realizado visitas dedistintas duraciones a la oficina principal y el Laboratorio de Achotines de la CIAT, para infor-marse sobre métodos de investigación o utilizar las instalaciones y datos de la CIAT para sus es-tudios. En el Anexo 1 se detallan aquéllos cuyas visitas duraron más de 2 semanas. Asimismo,científicos de la CIAT que viajan a otros países por razones profesionales con frecuencia ayudana los científicos de aquellos países con sus investigaciones relacionadas a la pesca del atún, y devez en cuando viajan con el propósito específico de enseñar o prestar ayuda en programas de in-vestigación.
El laboratorio de investigación de la CIAT en Achotines (República de Panamá) permiteuna colaboración más estrecha entre los investigadores de la CIAT y el personal de las agenciaspesqueras panameñas. Los investigadores de la CIAT han ayudado a científicos locales con pro-yectos de investigación fuera del campo de los túnidos, sobre corvinas y especies afines (Sciae-nidae) y pargos (Lutjanidae), por ejemplo, analizados en la subsección titulada Desove y críade corvinas y pargos de la mancha.
Hacia fines de 1993, la Overseas Fishery Cooperation Foundation (OFCF) del Japón, elgobierno de la República de Panamá, y la CIAT acordaron emprender un proyecto conjunto decinco años de duración, subvencionado principalmente por la OFCF, en el Laboratorio de Acho-tines. El proyecto, cuya fase inicial comenzó en 1994, abarca la investigación de la viabilidad decriar atunes aleta amarilla adultos, corvinas y especies afines, y pargos para suministrar larvaspara la investigación, y la producción de organismos de alimento para sus larvas y juveniles. Enla sección titulada Estudios del ciclo vital temprano se describe este proyecto. En noviembrede 1999 se recomendó extender el proyecto un año más, hasta marzo de 2001.
A través de los años, técnicos de la CIAT han colectado muestras de tejido y partes durasde atunes y peces picudos para usar en estudios de genética llevados a cabo por científicos deotras entidades. Durante 2000 fueron tomadas muestras de otolitos de atún aleta azul para elDepartamento de Biología Marina de la Texas A & M University en Galveston, Texas (EE.UU.)
Miembros del personal de la CIAT son también activos en sociedades profesionales. Du-rante 2000 el Dr. Martín A. Hall fue miembro de la Junta Directiva del Centro Nacional de Con-
126 COMISION DEL ATUN

servación de Pesquerías, el Dr. Michael G. Hinton fue Director del Distrito de California del Surdel American Institute of Fishery Research Biologists, y el Dr. Daniel Margulies sirvió de Repre-sentante Regional del Oeste de la Sección del Ciclo Vital Temprano de la American FisheriesSociety.
TOMA DE DATOS
La zona de interés principal para el personal de la CIAT es el Océano Pacífico oriental(OPO; Figura 1), definido como la zona delimitada por el litoral de las Américas, el paralelo de40°N, el meridiano de 150°O, y el paralelo de 40°S.
Durante 2000 la CIAT contó con científicos y técnicos en La Jolla y en sus oficinas re-gionales en Las Playas y Manta (Ecuador); Mayagüez, Puerto Rico (EE.UU); Ensenada y Maza-tlán (México); Panamá (República de Panamá); y Cumaná (Venezuela). El personal de la CIATobtiene datos de las descargas, recopila las bitácoras de los barcos atuneros para obtener datosde captura y esfuerzo, toma medidas y demás datos biológicos de los peces, y colabora en lacapacitación y embarque de los observadores que acompañan a los buques que participan en elPrograma Internacional para la Conservación de los Delfines (PICD). Este trabajo se lleva acabo no sólo en los puertos arriba nombrados, sino que también en otros puertos de California,Colombia, Costa Rica, Ecuador, México, Panamá, Perú, Puerto Rico, y Venezuela visitados regu-larmente por el personal de la CIAT. Durante 2000 el personal de la CIAT recopiló los datos decuadernos de bitácora de 1.486 viajes de buques pesqueros comerciales, tomó muestras del con-tenido de 845 bodegas de estos buques (obteniendo a menudo datos de frecuencia de talla de másde una especie de pescado en la bodega), y muestreó 58 descargas de aleta azul capturado porbuques de pesca deportiva. Además, el personal de las oficinas regionales tramitó el embarquede observadores de la CIAT en 562 viajes de pesca por buques participantes en el PICD, y revisólos datos tomados por los observadores en los 552 viajes completados durante el año.
LA PESQUERIA DE ATUNES Y ESPECIES AFINES EN EL OCEANO PACIFICO ORIENTAL
La flota
El personal de la CIAT mantiene registros detallados del arte de pesca, bandera, y capa-cidad de acarreo de la mayoría de los buques que pescan atunes aleta amarilla (Thunnus albaca-res), barrilete (Katsuwonus pelamis), patudo (Thunnus obesus), o aleta azul (T. orientalis) conartes de superficie en el Océano Pacífico oriental (OPO; Figura 1). No se mantienen registrosdetallados de la mayoría de los buques palangreros, ni de barcos de pesca deportiva ni embarca-ciones pequeñas tales como canoas y lanchas, pero se obtienen de varias fuentes y se incluyenen la base de datos de la CIAT datos de captura para la mayoría de los buques palangrerosgrandes y para barcos de pesco deportiva de EE.UU. y ciertos otros buques. La flota aquídescrita incluye buques cerqueros y de carnada que pescaron estas cuatro especies de atunes enel OPO durante el año entero o parte del mismo.
Se usan las estimaciones de capacidad de acarreo del buque suministradas por el armadoro astillero a menos que los registros de descarga indiquen que sea conveniente revisarlas. Paralos registros se clasifican los buques de acuerdo a su capacidad en las siguientes clases: Clase 1,menos de 46 toneladas métricas (denominadas “toneladas” a secas de ahora en adelante) (51 to-neladas cortas (tc); Clase 2, 46-91 toneladas (51-100 tc); Clase 3, 92-181 toneladas (101-200 tc);Clase 4, 182-272 toneladas (201-300 tc); Clase 5, 273-363 toneladas (301-400 tc); y Clase 6, más
INFORME ANUAL 2000 127

de 363 toneladas (400 tc). Hasta aproximadamente 1960 predominaron en la pesca atunera en el OPO los buques de
carnada, que faenaban en las zonas costeras y cerca de islas de alta mar. Hacia fines de los años1950 y a principios de los 1960, la mayoría de los buques de carnada grandes fue convertida aarte de cerco, y para 1961 este arte predominaba en la flota de superficie del OPO. Entre 1961y 2000 el número de buques de carnada se redujo de unos 93 a 11, y su capacidad de acarreototal disminuyó de unos 11 mil a unos mil metros cúbicos (m3). En el mismo período el númerode cerqueros aumentó de 125 a 205, y su capacidad de unas 32 mil a 176 mil m3. Tanto elnúmero como la capacidad alcanzaron su nivel máximo entre fines de la década de los 1970 yprincipios de la de los 1980, cuando llegó a haber 282 buques, y la capacidad alcanzó unos 196mil m3 (Tabla 1).
La construcción de nuevos buques cerqueros, comenzada a mediados de los años 1960,resultó en un aumento en la capacidad total de la flota de superficie de unos 49 mil m3 en 1966a unos 195 mil m3 en 1976. Entre 1977 y 1981 la capacidad permaneció bastante estable.Continuó la construcción de buques nuevos durante este período, pero la capacidad adicional sevio compensada por pérdidas ocasionadas por buques hundidos o que abandonaron la pesquería.Un evento mayor de El Niño comenzó a mediados de 1982 y persistió hasta fines de 1983. Lastasas de captura en el OPO fueron bajas durante 1978-1981 debido a la concentración delesfuerzo de pesca sobre peces pequeños, y la situación se vio agravada por el Niño, que hizo quelos peces fueran menos vulnerables a la captura. En 1982 ocurrió una reducción de 19 mil m3
en la capacidad total, debido al retiro de buques o a su traslado a otras zonas de pesca, princi-palmente el Pacífico occidental. Esta tendencia continuó en 1983 a medida que disminuían lastasas de captura en el OPO, y durante 1983 y 1984 la capacidad se redujo en 56 mil m3; en 1984alcanzó el nivel más bajo desde 1971, unas 125 mil m3. No obstante, en 1985 aumentó a unos140 mil m3, debido principalmente al regreso de buques del Pacífico occidental, pero en 1986volvió a reducirse ligeramente a unos 134 mil m3. Durante 1987 ingresaron a la flota variosbuques nuevos, y otros regresaron del Pacífico occidental al OPO a pescar, lo cual resultó en unaumento en la capacidad a unos 155 mil m3. Esta tendencia continuó en 1988, resultando enuna capacidad total de 160 mil m3, la mayor desde 1982. En la primavera de 1990 la industriaenlatadora de los Estados Unidos decidió no comprar más atún capturado en viajes en los cualesse realizaran lances sobre atunes asociados con delfines. Esto llevó a que muchas de las embar-caciones de bandera de Estados Unidos que pescaban en el OPO se fueran a pescar en elAtlántico o el Pacífico occidental, y una disminución consecuente en la flota del OPO a 119 milm3 en 1992. Con la mayor participación de buques de otras naciones en la pesquería, lacapacidad ha aumentado progresivamente desde 1992, y en 2000 fue de unas 177 mil m3.
En las Tablas 2a y 2b se presentan los datos finales de 1999 y preliminares de 2000 delnúmero y capacidad de acarreo de los buques cerqueros y de carnada que pescaron atunes en elOPO. En 2000 predominaron buques de bandera mexicana y ecuatoriana. Desde 1987 la flotamás grande ha sido la mexicana, con un 27% de la capacidad total en 2000, mientras que buquesde Ecuador, Venezuela, Vanuatu y España formaron el 25, 15, 8, y 6% de la capacidad total, res-pectivamente.
Buques cerqueros de la Clase 6 forman la mayor parte de la capacidad total de la flota debuques que pescan atunes en la superficie en el OPO; buques de esa clase de respondieron del89% de la capacidad total faenando en el OPO durante 2000.
En la Figura 2 se presentan los valores mensuales medios, mínimos, y máximos de capa-cidad en el mar (CEM), en miles de toneladas métricas, de los buques que pescaron atunes en lasuperficie en el OPO durante 1990-1999, junto con los valores de 2000. Los valores mensuales
128 COMISION DEL ATUN

son los promedios de las estimaciones de la CEM calculadas semanalmente por el personal de laCIAT. La pesca de aleta amarilla fue reglamentada en 1998, 1999, y 2000, a partir del 25 de no-viembre, 14 de octubre, y 1 de diciembre, respectivamente (véase la sección titulada MEDIDASPARA LA CONSERVACION DEL ATUN), por lo que los valores de la CEM para diciembrede 1998 y octubre, noviembre y diciembre de 1999 no son comparables con los de meses corres-pondientes durante 1990-1997. En general, los valores de la CEM en 2000 son más altos que lospromedios de 1990-1999, aunque el porcentaje de la capacidad de la flota en el mar fue el mis-mo, 57%. Durante ese período un promedio del 57% de la capacidad de la flota estuvo en el marcada mes; en 2000 el promedio fue de 56%. Durante 1990-1999 el valor medio de la CEM fue 66mil toneladas, pero en 2000 fue 87 mil toneladas.
Las capturas
Atunes
Las estimaciones de captura de atún provienen de varias fuentes, entre ellas los cuader-nos de bitácora mantenidos por los pescadores, datos registrados por los observadores, y datosde descargas proporcionados por las enlatadoras. En esta subsección, en las Figuras 3-5 y lasTablas 4-6 y 8-9 “captura” significa las capturas retenidas, a menos que se indique lo contrario.Los datos de descarga constituyen la fuente principal de esta información. Algunos de losatunes capturados son, por varios motivos, descartados en el mar. Desde 1993 los observadorestoman datos sobre pescado descartado en el mar por buques de la Clase 6. En la Tabla 3 sedetallan las capturas anuales estimadas de las varias especies de atunes y especies afinesdescargadas por buques de la flota atunera del OPO que pescan con artes de superficie. Seincluyen en las descargas capturas deportivas descargadas en California. En el caso del aletaazul, estas descargas han formado un componente cada vez más importante de las capturas enlos últimos años.
Se comparan las estadísticas de 2000 con las de 1985-1999. No se impusieron restric-ciones sobre la pesca del atún en el OPO entre 1980 y 1997, pero se restringió la pesca de aletaamarilla en el Area de Regulación de la Comisión para el Aleta Amarilla (ARCAA) (Figura 1) del26 de noviembre al 31 de diciembre de 1998, del 14 de octubre al 31 de diciembre de 1999, y el1 al 31 de diciembre de 2000, y se prohibió la pesca de atunes asociados con dispositivos agre-gadores de peces en el OPO del 9 de noviembre al 31 de diciembre de 1999 y del 15 de sep-tiembre al 15 de diciembre de 2000. Además, la reglamentación de aquellos cerqueros quedirigen su esfuerzo hacia atunes asociados con delfines afectó probablemente el modo deoperación de esos buques, especialmente a fines de los años 1980 y principios de los 1990. Talcomo se comentó en la subsección anterior, durante 1982-1983 ocurrió un evento importante deEl Niño que redujo la vulnerabilidad de los peces a la captura y el número de buques en el OPO.El esfuerzo de pesca permaneció relativamente bajo durante 1984-1986. Durante 1997-1998ocurrió otro evento importante de El Niño en el OPO, y se están estudiando sus efectos.
En el ARCAA la captura anual media de aleta amarilla durante 1985-1999 fue 226 miltoneladas (rango: 192 a 264 mil), y la estimación preliminar de la captura en dicha área en 2000es de 220 mil toneladas. Las cifras correspondientes para la zona entre el límite del ARCAA y150°O son 29 mil toneladas (rango: 19 a 44 mil) y 51 mil toneladas. La captura estimada de laespecie en el OPO en 2000, 272 mil toneladas, es inferior a la captura estimada de 1999 perosuperior a la de los demás años anteriores, y es un 6% superior al promedio de 1985-1999 de 256mil toneladas (Tabla 4). Los descartes medios anuales de aleta amarilla en el mar durante1993-2000 se cifraron en 5,7 mil toneladas.
INFORME ANUAL 2000 129

Durante 1985-1999 la captura media anual de barrilete en el OPO fue de 104 mil tonela-das (rango: 49 a 268 mil). La estimación preliminar de la captura de la especie en el OPO en2000, 210 mil toneladas, es menor que en 1999 pero casi el doble del promedio de las capturasanuales en los últimos 15 años. Los descartes medios anuales de barrilete en el mar durante1993-2000 se cifraron en 21,3 mil toneladas.
Antes de 1994 la captura promedio de patudo en el OPO por artes de superficie fue alre-dedor de 4 mil toneladas (rango: <1 a 15 mil). Luego aumentaron a 29 mil toneladas en 1994,37 mil toneladas en 1995, y 51 mil toneladas en 1996 y 1997; la estimación preliminar para 2000es de 70 mil toneladas. Estos aumentos resultaron del descubrimiento, hecho a principios de ladécada, de que atunes asociados con objetos flotantes, pero a bastante profundidad, pueden serdetectados con equipo de sonar y capturados con red de cerco. Muchos de estos objetos flotantesson colocados en el agua por los pescadores para agregar peces. Los descartes medios anuales depatudo en el mar durante 1993-2000 se cifraron en 3,9 mil toneladas.
El aleta amarilla, barrilete, y patudo forman la mayor parte de la captura total de los bu-ques que pescan atunes en la superficie en el OPO, pero el aleta azul, albacora (Thunnus alalun-ga), barrilete negro (Euthynnus lineatus), bonito (Sarda orientalis), y otras especies contribuyentambién. La captura total de estas otras especies en el OPO fue un poco más de 5 mil toneladasen 1999 y 2000, cantidad bien inferior al promedio de 1984-1998 de 9 mil toneladas (rango: 2 a17 mil). En la Tabla 3 se presentan estimaciones de las capturas de estas especies descartadasdurante 1993-2000. En las Tablas 40 y 41 del Informe Anual de la CIAT de 1998 se presentanestimaciones de los descartes de otras especies, en número de peces.
En la Tabla 4a se detallan las capturas, clasificadas por bandera, y las descargas de atu-nes capturados con artes de superficie, clasificadas por país, en el OPO en 1999, y en la Tabla4b las estimaciones preliminares correspondientes para 2000. La captura estimada de todas lasespecies en el OPO en 2000 fue unas 557 mil toneladas, cantidad inferior a las 611 mil toneladasestimadas para 1999 pero mucho mayor al récord anterior de 475 mil toneladas, establecido en1997. Buques de Ecuador, México, y Venezuela respondieron del 32, 22, y 14%, respectivamen-te, de este total. Las descargas representan pescado descargado en el año correspondiente, sintener en cuenta el año de captura. El país de descarga es aquél en el cual el pescado fue descar-gado del buque pesquero o, en el caso de transbordos, el que recibió el pescado transbordado.Datos de descarga preliminares (Tabla 4b) señalan que de las 547 mil toneladas descargadas en2000, 218 mil (40%) fueron descargadas en Ecuador; le siguen México (116 mil toneladas; 21%)y Colombia (60 mil toneladas; 11%). Otros países con descargas importantes de atunes del OPOincluyeron Venezuela (6%), España (5%), Costa Rica (4%), y Estados Unidos (3%). Es impor-tante notar que cuando se disponga de información final los países a los que se asignan actual-mente algunas descargas podrían cambiar debido a la exportación de pescado almacenado aprocesadoras en otros países.
Los atunes son capturados con redes de cerco en tres tipos de cardúmenes: asociados condelfines, con objetos flotantes (naturales y plantados), y no asociados con nada excepto otros pe-ces. En la Tabla 5 se presentan estimaciones del número de lances cerqueros de cada tipo en elOPO durante 1987-2000. Se calcularon las estimaciones para los buques de las Clases 1 a 5 condatos de bitácora en la base de datos estadística de la CIAT, y aquéllas para los buques de laClase 6 a partir de las bases de datos de observadores de la CIAT, el Programa Nacional deAprovechamiento del Atún y de Protección de Delfines (PNAAPD) de México, el ProgramaNacional de Observadores de Venezuela (PNOV), el Programa de Observadores Pesqueros deEcuador (PROBECUADOR), y el Servicio Nacional de Pesquerías Marinas de EE.UU. Elnúmero de lances sobre atunes asociados con objetos flotantes y no asociados fue máximo entre
130 COMISION DEL ATUN

mediados de los años 1970 y principios de los 1980. A pesar de la oposición a la pesca de atunesasociados con delfines, y de la decisión de las enlatadoras de EE.UU. de no comprar atún cap-turado en viajes en los cuales se realizaron lances sobre delfines, el número de lances sobredelfines disminuyó tan sólo moderadamente a mediados de los años 90, y en 1998 fue el mayordesde 1990.
Hay dos tipos de objetos flotantes, los que se encuentran en el mar por casualidad y losque son construidos por pescadores con el propósito específico de atraer peces. Se conocen es-tos últimos como dispositivos agregadores de peces (DAP), plantados, o FAD (del inglés fish-aggregating device). Hace solamente unos pocos años que se usan los plantados, pero suimportancia ha aumentado en ese período mientras que la de los objetos “naturales” (que tam-bién incluyen desperdicios y otros objetos artificiales) ha disminuido, tal como señalan los datossiguientes sobre el número y porcentaje de lances realizados sobre objetos flotantes por buquesde la Clase 6 con observadores de la CIAT a bordo:
Naturales Plantados DesconocidoTotal
Número % Número % Número %1992 945 63,3 521 34,9 26 1,7 1.4921993 1.118 57,7 811 41,8 9 0,5 1.9381994 709 27,6 1.830 71,3 28 1,1 2.5671995 579 17,8 2.647 81,6 19 0,6 3.2451996 520 12,9 3.523 87,1 0 0,0 4.0431997 718 12,8 4.859 86,9 16 0,3 5.5931998 663 12,5 4.588 86,6 46 0,9 5.2971999 778 17,3 3.719 82,5 10 0,2 4.5072000 378 10,3 3.285 89,3 16 0,4 3.679
En las Figuras 3a, 3c, 3e, 4a y 4c se ilustran las distribuciones anuales medias de las cap-turas de aleta amarilla y barrilete por buques cerqueros registradas en el OPO durante 1985-1999, y en las Figuras 3b, 3d, 3f, 4b y 4d estimaciones preliminares para 2000. Durante 2000las capturas de aleta amarilla fueron relativamente mayores al norte de 5°N y al oeste de 85°O,y las de barrilete relativamente mayores en alta mar entre 5°S y 5°N entre 80°O y 125°O y rel-ativamente menores frente a Baja California y Centroamérica y el norte de Sudamérica.
No se captura a menudo patudo con arte de superficie al norte de aproximadamente 7°N.Las capturas cerqueras de patudo durante 1994-1999 provinieron de dos zonas principales: (1)entre 6°N y 16°S desde 93°O hasta 140°O, y (2) entre 3°S y 3°N desde 82°O hasta 88°O (Figura5a). Una estimación preliminar de estas capturas en 2000 señala que la mayoría provino deentre 16°S y 6°N entre el litoral de América del Sur y 140°O (Figura 5b). Con el desarrollo dela pesquería sobre objetos flotantes, arriba descrita, la importancia relativa de las zonas cercade la costa ha disminuido, mientras que la de las zonas de altura ha aumentado.
Peces picudos
El pez espada (Xiphias gladius) es pescado en el OPO con palangre y red agallera, y devez en cuando con artes deportivas. La mayor parte de la captura comercial es retenida. Losmarlines (Makaira nigricans, M. indica, Tetrapturus audax, y T. angustirostris), y el pez vela(Istiophorus platypterus) son pescados con palangre y artes deportivas, y forman una pequeñaparte de las capturas incidentales de los buques cerqueros. La mayor parte de la captura palan-grera de estas especies es retenida, y la mayor parte de la captura de superficie comercial es des-
INFORME ANUAL 2000 131
cartada en el mar. En la Tabla 7 se presenta información sobre las capturas comerciales e inci-dentales de peces picudos en el OPO.
____________________Bajo las disposiciones de la Convención que estableció la CIAT, el objetivo principal de las
investigaciones del personal de la Comisión es estudiar la condición de los stocks de atunes yotras especies capturadas por la pesca atunera del OPO. Tomando en cuenta los desplazamien-tos extensos de los atunes, la movilidad de los buques de las flotas atuneras de los distintos paí-ses, y el carácter internacional del comercio del atún, las estadísticas de captura y esfuerzo delOPO deben ser vistas a la luz de las estadísticas mundiales. En las Tablas 8 y 9 se presentanestadísticas de captura de atunes durante 1991-1999, por océano.
Descartes y capturas incidentales en la pesquería atunera con red de cerco
A fines de 1992 los observadores de la CIAT comenzaron a reunir información sobre losdescartes y las capturas incidentales en las operaciones de pesca con red de cerco, y el programacontinuó en 2000. En esta sección “capturas” significa pescado retenido a bordo del buque pes-quero, “descartes” los atunes de importancia comercial (aleta amarilla, barrilete, patudo, aletaazul, y albacora) desechados muertos en el mar, “capturas incidentales” los peces u otros anima-les, aparte de los atunes de importancia comercial, desechados muertos en el mar, y “capturastotales” la suma de estas tres categorías. Durante 2000 se revisaron los datos reunidos en losaños anteriores y se modificaron en casos apropiados. En la Tabla 10 se presenta informaciónsobre la cobertura de lances sobre atunes asociados con delfines y con objetos flotantes y sobrecardúmenes de atunes no asociados. La Columna 3 de esta tabla detalla el número de lances enla base de datos de la CIAT para los cuales se registraron datos de capturas incidentales ydescartes, y la Columna 4 el número de lances en la base de datos Atún-Delfín de la CIAT, másdatos equivalentes recabados por el Programa Nacional de Aprovechamiento del Atún yProtección de Delfines (PNAAPD) de México, el Programa Nacional de Observadores deVenezuela (PNOV), y el Programa Nacional de Observadores de Ecuador (PROBECUADOR).(El número de lances para 1998-2000 en la Columna 4 de esta tabla concuerda con los valorescorrespondientes a buques de la Clase 6 en la Tabla 5 porque los buques menores no llevaronobservadores en esos años. Algunos buques de la Clase 5 llevaron observadores en 1995-1997,por lo que algunos de los valores de esos años en la Tabla 10 son mayores que los valores corre-spondientes en las columnas de Clase 6 en la Tabla 5.) La cobertura de buques con observadoreses incompleta, pero suficiente para la mayoría de los fines estadísticos.
Se estimaron los descartes y capturas incidentales en viajes acompañados por obser-vadores como sigue:
DESCARTES = (descarte/lance) x LANCESy
CAPTURAS INCIDENTALES = (captura incidental/lance) x LANCES,
donde DESCARTES y CAPTURAS INCIDENTALES = descartes y capturas incidentales en to-dos los viajes con observador a bordo, descarte/lance y captura incidental/lance = descartes ycapturas incidentales por lance en todos los lances en los que observadores de la CIAT tomarondatos sobre descartes y captura incidental, y LANCES = todos los lances en viajes con observa-dor a bordo (Tabla 10, Columna 4). Estas estimaciones son más bajas de lo que serían si se in-cluyeran datos de buques más pequeños, que pescan casi exclusivamente sobre atunes no
132 COMISION DEL ATUN

asociados y objetos flotantes.
Descartes y capturas incidentales de atunes
En la Tabla 11a se presentan estimaciones de los descartes de atunes de importancia co-mercial y las capturas incidentales de atún barrilete negro, melvas, y bonitos por buques con ob-servador. Las capturas incidentales malgastan siempre un recurso, en el sentido de que reducenel reclutamiento a la pesquería de peces de tamaño capturable y/o el rendimiento por recluta.La captura de aletas amarillas y patudos pequeños, aun si son retenidos, reduce el rendimientopor recluta de la especie.
Capturas incidentales de otras especies
En las Tablas 11b y 11c se presentan estimaciones de las capturas incidentales de anima-les aparte de los atunes de importancia comercial. Las capturas incidentales de todas lasespecies excepto delfines son máximas en los lances sobre objetos flotantes, intermedias en loslances sobre atunes no asociados, y mínimas en los lances sobre delfines. Los peces picudos, eldorado (Coryphaena spp.), peto (Acanthocybium solandri), salmón (Elagatis bipinnulata), jurel(Seriola lalandi), y ciertas especies de tiburones y rayas son objeto de la pesca comercial ydeportiva en el OPO. Las tortugas marinas capturadas por buques cerqueros incluyen tortugasgolfina (Lepidochelys olivacea), verde (Chelonia mydans), laúd (Dermochelys coriacea), carey(Eretmochelys imbricata), y caguama (Caretta caretta), todas de las cuales son consideradas enpeligro. (La mayoría de las tortugas que se capturan son liberadas en condición viable; la Tabla11c incluye solamente aquéllas que murieron o que padecieron heridas que probablementecausarían su muerte.) La información disponible sobre la biología de las especies de peces en laTabla 11c es insuficiente para permitir determinar los efectos de la captura de dichas especiespor la pesquería con red de cerco.
COMPOSICION POR TAMAÑO DE LA CAPTURA DE ATUNESLas muestras de frecuencia de talla son la fuente básica de los datos usados para estimar
la composición por talla y edad de las distintas especies de peces en las descargas. Esta infor-mación es necesaria para obtener estimaciones de la composición de las poblaciones por edad,usadas para varios propósitos, entre ellos el modelado de las poblaciones por edad. Los resulta-dos de dicho modelado pueden ser usados para estimar el reclutamiento, que puede ser compa-rado con la biomasa reproductora y las condiciones oceanográficas. Además, las estimaciones demortalidad obtenidas con estos modelos pueden ser usadas, en conjunto con las estimaciones delcrecimiento, para modelar el rendimiento por recluta. Los resultados de estudios de este tipohan sido descritos en diversos Boletines de la CIAT y en todos los Informes Anuales desde 1954.
Las muestras de frecuencia de talla de aleta amarilla, barrilete, patudo, aleta azul delPacífico, y ocasionalmente barrilete negro capturados por barcos cerqueros, de carnada, ydeportivos en el Océano Pacífico oriental (OPO) son tomadas por el personal de la CIAT enpuertos de descarga en Ecuador, Estados Unidos (California y Puerto Rico), México, Panamá, yVenezuela. El muestreo de las capturas de aleta amarilla y barrilete fue iniciado en 1954, y con-tinúa actualmente.
A partir del 1 de enero de 2000 se cambiaron los métodos de muestreo de las capturas deatún. Anteriormente, se medía pescado de las bodegas de buques cerqueros y barcos de carnadaque satisfacían dos criterios: (1) todo el pescado en la bodega fue capturado durante un solo mesy (2) todo el pescado en la bodega fue capturado en la misma zona de muestreo (Informe Anual
INFORME ANUAL 2000 133

de la CIAT de 1999: Figura 6). El tercer criterio que ahora se exige es que todo el pescado en labodega ha de originar en un solo tipo de lance (delfín, objeto flotante, o no asociado). Además,se toma una muestra de la composición por especies de cada bodega seleccionada para el mues-treo. Se usan los datos de composición por especies y de tallas para estimar la captura total decada especie y para estimar la composición por tamaño de los peces de cada especie capturadapor la flota de superficie (de cerco y carnada) en el OPO.
De conformidad con los cambios en el muestreo, en el futuro se presentarán los datos defrecuencia de tallas de manera distinta. Previamente, los histogramas de frecuencia de tallapresentaban los datos por especie y zona. Ahora se clasifican estos datos por pesquería (Figura6), con base en las evaluaciones más recientes de la pesquería realizadas por el personal de laCIAT. Se definen estas pesquerías por especie (aleta amarilla, barrilete, patudo, o aleta azul),tipo de arte (red de cerco o buque de carnada), tipo de lance cerquero (objeto flotante, cardumenno asociado, o delfín), y zona (combinaciones de la zonas de muestreo 1-13). Se tomaron mues-tras de 845 bodegas, de la forma arriba descrita, durante 2000.
En este informe se presentan dos histogramas de frecuencia de talla para cada especie.El primero presenta los datos por estrato (arte de pesca, tipo de lance, y zona) para 2000, y elsegundo, similar a los de años anteriores, ilustra la captura del año en curso y los cinco años pre-vios.
Para la evaluación de los stocks se definen diez pesquerías de superficie de aleta amari-lla: cuatro de objeto flotante, dos de atunes no asociados, tres de delfines, y una de carnada (Fi-gura 6). De las 845 bodegas muestreadas, 600 contenían aleta amarilla. En la Figura 7a seilustran las composiciones por talla del pescado capturado durante 2000. La mayoría de la cap-tura de aleta amarilla provino de lances sobre atunes no asociados y lances sobre delfines. Elpeso medio de los peces capturados en asociación con delfines fue más del doble del peso de losque se capturaron en los otros dos tipos de lance.
En la Figura 7b se ilustra la composición por talla estimada del aleta amarilla capturadopor todas las pesquerías combinadas durante 1995-2000. Generalmente, la talla del pescado va-rió entre 40 y 160 cm, pero la distribución de las tallas varió entre años. El peso medio del aletaamarilla capturado durante 2000 fue ligeramente superior al promedio correspondiente de loscuatro años anteriores.
Para la evaluación de los stocks se definen ocho pesquerías de barrilete: cuatro de objetoflotante, dos de atunes no asociados, una de delfines, y una de carnada. Las dos últimas abarcantodas las 13 zonas de muestreo. De las 845 bodegas muestreadas, 455 contenían barrilete. En laFigura 8a se ilustran las composiciones por talla estimadas del pescado capturado durante elprimer trimestre de 2000. La mayoría del pescado provino de lances sobre atunes no asociadosen la zona Sur y en lances sobre objetos flotantes en la zona de Galápagos. En promedio, los ba-rriletes más grandes fueron capturados en estas dos zonas. Cantidades insignificantes de ba-rrilete fueron capturadas por buques de carnada y en asociación con delfines.
En la Figura 8b se ilustra la composición por talla estimada del barrilete capturado portodas las pesquerías combinadas durante 1995-2000. El peso medio del pescado capturado du-rante 2000 fue mayor que el promedio correspondiente de cualquiera de los años anteriores.
Para la evaluación de los stocks se definen siete pesquerías de superficie de patudo: cua-tro de objeto flotante, una de atunes no asociados, una de delfines, y una de carnada. Las tresúltimas abarcan todas las 13 zonas de muestreo. De las 845 bodegas muestreadas, 154 con-tenían patudo. En la Figura 9a se ilustran las composiciones por talla estimadas del pescadocapturado durante 2000. La mayoría del patudo provino de lances sobre objetos flotantes en lazona de Galápagos. Se capturó una pequeña cantidad de patudo en lances sobre atunes no aso-
134 COMISION DEL ATUN

ciados. No se registró captura de patudo en lances sobre delfines ni por barcos de carnada.En la Figura 9b se ilustra la composición por talla estimada del patudo capturado por to-
das las pesquerías combinadas durante 1995-2000. El peso medio del pescado capturado durante2000 fue considerablemente mayor que el promedio correspondiente de cualquiera de los añosanteriores.
El aleta azul del norte del Pacífico es capturado con artes de superficie por buques com-erciales y deportivos frente a California y Baja California entre 23°N y 35°N, aproximadamen-te, principalmente entre mayo y octubre. Durante 2000 fue capturado entre 27°N y 37°N,principalmente entre junio y agosto. Normalmente se obtienen muestras de aleta azul tanto delas capturas comerciales como las deportivas, y anteriormente se combinaban estos datos antesde analizarlos, pero en este informe se presentan por separado. En las Figura 10a y 10b se pre-sentan histogramas de las capturas estimadas comerciales y deportivas, respectivamente, dealeta azul en cada año del período de 1995-2000.
Las cantidades de muestras de aleta azul obtenidas de las capturas comerciales y deporti-vas en los últimos años son como sigue:
Año Comercial Deportiva1990 14 01991 4 01992 1 11993 4 351994 2 111995 6 161996 67 51997 17 91998 23 221999 51 122000 20 58
Se consiguió el mayor número de muestras de la flota comercial en 1996, año de capturasextraordinariamente elevadas. El gran número de muestras conseguido de la flota comercialdurante 1999 y de la flota deportiva durante 2000 se debió más a un mayor esfuerzo de muestreoque a mayores capturas.
El barrilete negro es capturado incidentalmente por pescadores que dirigen su esfuerzohacia los atunes aleta amarilla, barrilete, y patudo. La demanda de la especie es baja, y la may-oría de la captura es desechada en el mar, pero a veces se retienen pequeñas cantidades, mezcla-das con las especies más deseadas. Ya que se tomaron solamente cuatro muestras de barriletenegro de las 845 bodegas muestreadas durante 2000, no se presentan en este informe histogra-mas de frecuencia de talla para esta especie.
PROGRAMA DE OBSERVADORESLos observadores empleados por la CIAT registran la mortalidad de delfines durante las
faenas de pesca, y el personal de la CIAT usa estos datos para preparar sus estimacionesanuales de la mortalidad de delfines en la pesquería. Los observadores recaban también datossobre las manadas de delfines observadas, usados para calcular estimaciones de la abundanciarelativa de los delfines. Se usa la información anotada sobre las condiciones coincidentes con lamortalidad de delfines para estudios de las causas de dicha mortalidad, y se comparten losconocimientos obtenidos de estos estudios con los pescadores a través de las actividades educa-
INFORME ANUAL 2000 135

tivas de la CIAT, tales como seminarios para capitanes y tripulantes de barcos atuneros yanálisis del desempeño de capitanes individuales. Además, desde fines de 1992 los observadoresregistran información sobre peces y otros animales descartados en el mar.
Cobertura
El diseño de muestreo del programa de observadores para 2000 contempló una coberturadel 100% de los viajes de pesca realizados en el Océano Pacífico oriental (OPO) por buques cer-queros de la Clase 6 (de más de 363 toneladas de capacidad de acarreo). Venezuela y Ecuadoriniciaron sus propios programas nacionales de observadores durante el año. El Programa Nacio-nal de Observadores de Venezuela (PNOV) comenzó el año muestreando aproximadamente el25% de los viajes de su flota, e incrementó la cobertura hacia la meta del 50% de cobertura amitad de año. El Programa Nacional de Observadores Pesqueros de Ecuador (PROBECUADOR)comenzó a muestrear los viajes de su flota en noviembre, con la intención de incrementar lacobertura al 50% en 2001. El Programa Nacional de Aprovechamiento del Atún y Protección deDelfines (PNAAPD) de México siguió cubriendo el 50% de los viajes de su flota. El ProgramaAtún-Delfín de la CIAT muestreó el resto de los viajes de las flotas de Ecuador, México, yVenezuela, más todos los viajes de los buques de otras flotas, con las excepciones detalladas acontinuación. El programa internacional de observadores de la CIAT y los tres programasnacionales constituyen el Programa de Observadores a Bordo del Acuerdo sobre el ProgramaInternacional para la Conservación de los Delfines (APICD).
Observadores del Programa de Observadores a Bordo zarparon en 689 viajes de pesca enel OPO en 2000, y con los 33 viajes iniciados en 1999 y terminados en 2000 que llevaron obser-vador, en total 722 viajes fueron muestreados en 2000 por el Programa. Buques faenando bajola jurisdicción de Belice, Bolivia, Colombia, Ecuador, Estados Unidos, Guatemala, Honduras,México, Nicaragua, Panamá, la Unión Europea, Vanuatu, y Venezuela llevaron observadores delPrograma.
Un observador de la CIAT zarpó en un viaje de pesca en 2000 a bordo de un buque depabellón boliviano, pero el muestreo del viaje fue solamente parcial porque el buque zarpó des-pués de una escala en puerto durante el viaje sin el observador a bordo. No se considera este via-je como viaje muestreado para los fines de cobertura por observadores. Un buque de pabellónde Vanuatu no llevó observador a bordo durante un viaje entero.
Durante 2000 hubo 44 viajes por buques que en el momento de zarpar enarbolaban pabe-llón de estados no Partes del APICD.
En la Tabla 12 se resume la cobertura de muestreo de los buques de la flota internacionalpor el Programa de Observadores a Bordo. Se muestreó el 99,7% de los viajes de buques de laClase 6, y el programa de la CIAT muestreó más del 82% de éstos.
Capacitación de observadores
No se celebraron cursos de capacitación de observadores de la CIAT durante 2000.
Programa nacional de observadores de Ecuador
Dos miembros del Programa Atún-Delfín pasaron el período del 18 de septiembre al 5 deoctubre de 2000 en Guayaquil (Ecuador), donde participaron en la capacitación del personalpara el nuevo Programa Nacional de Observadores Pesqueros de Ecuador (PROBECUADOR),antes descrito.
136 COMISION DEL ATUN

Informes de observadores desde el mar
En el Artículo V (2) del APICD se dispone que se establezcan límites anuales de mortali-dad de delfines por población. A fin de que el seguimiento de la mortalidad esté al día, y tam-bién para lograr un seguimiento mejor de la captura acumulativa de las principales especies deatún en el OPO, los observadores completan cada semana un Informe Desde el Mar y lo transmi-ten por correo electrónico, fax, o radio desde el buque a la oficina del programa respectivo.
INVESTIGACION
BIOLOGIA REPRODUCTORA DEL ATUN PATUDOSe sabe poco acerca de la talla y edad de madurez sexual, la distribución del desove, y la
fecundidad del atún patudo en el Océano Pacífico oriental (OPO). En enero de 2000 se inició unprograma de 2 años de muestreo de gónadas de patudo por observadores de la CIAT a bordo debuques cerqueros pescando en el OPO. Simultáneamente, el National Research Institute of FarSeas Fisheries de Japón reunió muestras de gónadas de patudo capturado por buques palan-greros en el OPO. El objetivo de este proyecto colaborativo es llegar a un conocimiento completode la biología reproductora del patudo en el OPO, necesario para la evaluación del stock.
Durante 2000 se obtuvieron muestras en nueve viajes de buques cerqueros de 369 hem-bras con tejido ovárico adecuado para examen histológico. Las muestras serán procesadas en elLaboratorio de Achotines a principios de 2001, y una empresa en San Diego las preparará paraexamen con microscopio. Serán examinadas para identificar las etapas de ovogénesis y así eva-luar con precisión la condición reproductora de cada pez. Se seleccionarán también ovarios parausar en la estimación de la fecundidad de los peces.
MARCADO DE ATUNES
Atunes tropicales
La CIAT ha realizado numerosos experimentos de marcado, en los que se marcaron gran-des cantidades de barriletes y aletas amarillas en el Océano Pacífico oriental (OPO), principal-mente entre 1950 y 1980. Estos experimentos han producido una gran cantidad de informaciónsobre los desplazamientos, crecimiento, y mortalidad de los peces.
Del 1 de marzo al 29 de mayo de 2000 se realizó a bordo del Her Grace, un barco de car-nada fletado, la primera fase de un proyecto de marcado de atunes de varios años de duración.El objetivo principal fue determinar si la pesca con caña y anzuelo y carnada viva es una técnicapráctica para el marcado, con marcas de dardo convencionales de plástico, de grandes canti-dades de patudos pequeños (<100 cm) asociados con dispositivos agregadores de peces (“plan-tados”) en el OPO. El objetivo secundario fue marcar patudo con marcas archivadoras. (Lasmarcas archivadoras consisten de una computadora en miniatura, incrustada en resinaepoxídica, con una varilla de unos 30 cm de largo. Se implanta la parte principal de la marcaen la cavidad abdominal del pez, con la varilla afuera. Sensores en la varilla registran infor-mación sobre la temperatura y luz ambientales, y la marca registra también la presión (indica-tiva de la profundidad) y la temperatura del cuerpo. Se estima la posición del pez a partir delos datos de luz, ajustados para la profundidad. Estas marcas registran esta información cada4 minutos; a este paso son capaces de seguir tomando datos durante unos cuatro años, y retenerla información en memoria hasta 25 años.).
Se usaron cañas y anzuelos y líneas de mano para capturar los atunes marcados con los
INFORME ANUAL 2000 137

dos tipos de marca. Desgraciadamente, no se encontraron patudos pequeños en cantidades im-portantes. La escasez de patudo pequeño en al zona de operación fue confirmada por informesde buques cerqueros pescando en la zona y por la composición por talla del pescado descargadopor los mismos.
Para el fin de diciembre de 2000 habían sido devueltas las marcas siguientes:
Especie Tipo marca Liberados Devueltos % devueltoPatudo Convencional 101 17 16,8Patudo Archivadora 96 24 25,0Barrilete Convencional 1.238 258 20,8Aleta amarilla Convencional 71 7 9,9Todas las marcas devueltas de patudos recapturados provinieron de lances cerqueros sobreplantados en el OPO ecuatorial, con la excepción de un pez con marca archivadora capturado conpalangre. Casi todas las marcas devueltas de barriletes recapturados provinieron de lances cer-queros sobre plantados en el OPO ecuatorial, con la excepción de 26 peces recapturados en car-dúmenes no asociados y uno capturado en una red agallera a unas 50 millas náuticas al oestede Guayaquil (Ecuador). El alto porcentaje de marcas convencionales devueltas de barriletesrecapturados es atribuible parcialmente a un solo lance cerquero sobre un plantado en el que secapturaron 148 barriletes marcados, 126 de los cuales fueron marcados y liberados juntos 18días antes, a unas 47 mn del punto de recaptura.
Un 85% de los barriletes, pero solamente un 24% de los patudos, estuvieron en libertadmenos de 1 mes, mientras que un 16% de los patudos estuvieron en libertad entre 6 y 10 meses.
Para ambas especies, los desplazamientos lineales y los días en libertad están positiva-mente correlacionados. Aunque algunos especímenes en libertad más de 60 días se desplazaronvarios centenares de millas náuticas del punto de liberación, un 95% de los puntos de recapturaestuvieron a menos de 1.000 mn del punto de liberación.
En la Figura 11a se grafican los desplazamientos de los patudos marcados con marcasconvencionales, inferidos de las posiciones de liberación y recaptura. Todas las devolucionesfueron de peces recapturados al oeste del punto de liberación, excepto un pez recapturado al estede las Islas Galápagos.
En la Figura 11b se grafican los desplazamientos de los barriletes marcados con marcasconvencionales, inferidos de las posiciones de liberación y recaptura. La mayoría de las devolu-ciones fueron de peces recapturados al oeste y sudoeste del punto de liberación, aunque variospeces fueron recapturados al este, entre ellos dos relativamente cerca de la costa de América delSur.
Los criterios desarrollados para filtrar (aceptar o rechazar) las posiciones diarias estima-das de las marcas archivadores se basan en la incertidumbre asociada con las estimaciones delatitud para los días de recaptura de 18 patudos que permanecieron en libertad 30 días o más ylas distancias entre las posiciones estimadas en días consecutivos. Este proceso de filtraje resul-tó en la retención de un promedio de 53% de las posiciones diarias estimadas. Este procedi-miento arrojó conjuntos de datos de las posiciones estimadas durante todo el período en libertadpara cada pez, con un alto nivel de confianza, dadas la exactitud y precisión esperadas de los da-tos. Se evaluó la exactitud de la latitud y longitud de las estimaciones de posición mediante elcálculo de las diferencias entre la posición conocida de recaptura de los 18 patudos y la posiciónestimada correspondiente inmediatamente antes de la recaptura. La diferencia media en lat-itud y longitud es 2,0° y 0,5°, respectivamente.
En la Figura 12 se ilustran los puntos de liberación y recaptura, y las posiciones filtradas
138 COMISION DEL ATUN
para los períodos entre liberación y recaptura, derivados de las marcas archivadoras recuper-adas de 18 patudos en libertad 30 días o más. La diferencia entre los polígonos convexos mín-imos señalando las zonas de dispersión de los peces basados en las posiciones de liberación yrecaptura (1.031.816 km2) y basados en los datos de marcas archivadoras (4.953.054 km2)ilustra una de las grandes ventajas de usar este tipo de marca para evaluar los desplazamientosy mezcla potencial de los peces. (La otra gran ventaja es, por supuesto, que proporcionan infor-mación sobre la profundidad y la temperatura interna del pez y la temperatura ambiental aintervalos frecuentes entre la liberación y la recaptura, imposible con las marcas conven-cionales.
Se realizaron análisis exploratorios del conjunto completo de datos de tiempo-profundidadpara cada patudo con marca archivadora, un día a la vez, para elucidar patrones de compor-tamiento. Se desarrollaron criterios cuantitativos para distinguir y clasificar tipos de compor-tamiento. Se examinaron los datos de los 18 patudos en libertad 30 días o más, un total de 1.770días. En la Figura 13 se ilustran las profundidades y temperaturas registradas para patudos conmarcas archivadoras poco después de la liberación y poco antes de la recaptura en plantados. Serealizó una evaluación estadística de los conjuntos de datos obtenidos de los marcasarchivadoras en los patudos, para cada uno de esos períodos, a fin de seleccionar criterios paradistinguir y clasificar el comportamiento asociado con plantados. Los peces permanecieron aprofundidades de menos de unos 50 m durante unos dos días y medio después de ser liberadosen un plantado hasta que éste fue sacado del agua (Figura 13A). A continuación el compor-tamiento de los peces fue errático durante unas 12 horas, tras lo cual mostró un patrón normalcomún en los patudos no asociados con plantados. Se considera normal el comportamientocuando el pez se queda principalmente en la capa de mezcla de noche, desciende por debajo dela termoclina a profundidades de entre 200 y 300 m al amanecer, permanece ahí durante todoel día, aparte de subidas verticales a la capa de mezcla, y luego asciende a la capa de mezcla aloscurecer. En la Figura 13B se ilustra que el pez comenzó a asociarse con un plantado unos cincodías antes de ser recapturado, en cual momento cambió de comportamiento normal a compor-tamiento de plantado, permaneciendo principalmente a profundidades de menos de unos 50 m,aparte de excursiones a profundidades de unos 300 m durante unas horas alrededor de las 6 dela tarde en cuatro días consecutivos antes de ser recapturado. La clasificación de los 1.770 díasde datos de comportamiento indica que fue normal en el 58% de los mismos, anormal en el 23%,y asociado con plantados en el otro 19%.
Atún aleta azul
Al fin de 2000 habían sido devueltas al personal de la CIAT 12 marcas de los 57 aletasazules en los que empleados del Monterey Bay Aquarium colocaron marcas de la CIAT en juliode 1999. Ocho fueron recapturados frente a Baja California, cuatro en 1999 y los demás en 2000.Los otros cuatro fueron recapturados por cerqueros japoneses en el Pacífico occidental durante2000, después de entre 323 y 406 días en libertad. Anteriormente ningún pez marcado quemigró del Pacífico oriental (OPO) al occidental estuvo en libertad menos de 681 días (Boletín dela CIAT, 20 (1): Tabla 9).
Empleados del Monterey Bay Aquarium marcaron nueve aletas azules más frente a BajaCalifornia en agosto de 2000, de nuevo con marcas de la CIAT.
Un aleta azul liberado con una marca archivadora en el Pacífico occidental fue recaptu-rado en el OPO en 2000. Fue liberado en 34°49'N-129°13'E el 26 de noviembre de 1998, cuan-do medía 53,5 cm de talla. Fue recapturado por el cerquero Barbara H. en 35°26'N-121°32'O el24 de septiembre de 2000, en cual momento medía 92,5 cm. En el Informe Anual de la CIAT de
INFORME ANUAL 2000 139

1998, página 246, se presenta información sobre otro aleta azul con marca archivadora liberadoen el Pacífico occidental en 1996 y recapturado en el OPO en 1998.
ESTUDIOS ECOLOGICOS La evaluación de los impactos de la pesca sobre los ecosistemas marinos es ahora reco-
nocida como un aspecto importante de la ciencia pesquera. El personal de la CIAT viene des-arrollando un modelo para investigar las implicaciones ecológicas de las distintas estrategias depesca usadas para capturar atunes en el Océano Pacífico oriental (OPO) tropical. Los términosde referencia del Grupo de Trabajo sobre Capturas Incidentales de la CIAT, establecido en la 58ªreunión de la Comisión, proporcionaron la motivación inicial de la labor. Uno de los objetivos,detallado en los términos de referencia, es “definir las relaciones entre las especies objetivo dela pesca y aquéllas capturadas incidentalmente, con referencia especial a la sustentabilidad delas capturas de todas estas especies.”
Los niveles más altos de la red trófica en el OPO pelágico incluyen atunes grandes, delfi-nes, tiburones, peces picudos, y otras especies. La pesquería cerquera en el OPO está dirigidahacia los atunes aleta amarilla, patudo, y barrilete, pero realiza capturas sustanciales de otrosdepredadores de alto nivel y de atunes juveniles. La pesca dirigida hacia depredadores de altonivel puede causar cambios importantes en la estructura de las redes tróficas forzados desdearriba hacia abajo.
La estructura de las redes tróficas marinas pelágicas consiste de procesos forzados desdearriba y forzados desde abajo. No es posible comprender adecuadamente las reacciones forzadasdesde arriba por la pesca sin considerar la función de los procesos físicos forzados desde abajosobre la dinámica del ecosistema. El OPO tropical es fuertemente afectado por eventos de ElNiño-Oscilación del Sur (ENOS). Varios estudios han documentado una relación estrecha entreel ENOS y la producción primaria en el OPO tropical; la tasa de producción y la biomasa de fi-toplancton disminuyen a menudo durante períodos cálidos de El Niño y aumentan duranteperío-dos fríos de La Niña. Estudios previos del sistema de afloramiento de Perú (por ejemplo,Nature, 319 (6051): 279-285) han demostrado que los efectos del ENOS pueden también exten-derse a la distribución y abundancia de animales en los niveles tróficos medianos y altos.
El personal de la CIAT ha elaborado un modelo del ecosistema pelágico en el OPO tro-pical para explorar cómo la variación climática y la pesca podrían afectar los animales en losniveles tróficos medianos y altos. El modelo contiene 36 componentes (Informe Anual de laCIAT de 1999: Tabla 15b); incluyen las especies principales explotadas (los atunes, por ejem-plo), grupos funcionales (tiburones y peces voladores, por ejemplo), y especies sensibles (tortu-gas marinas, por ejemplo). Algunos grupos taxonómicos son subdivididos en categoríasontogenéticas (marlines grandes y pequeños, por ejemplo). En general, la resolución del modeloes más fina en los niveles tróficos más altos, pero la mayoría de la biomasa del sistema está enlos niveles medianos y bajos. Se considera que la zona del modelo es delineada por 20ºN, 20ºS,el litoral de las Américas, y 150ºO. Se estimaron las descargas y descartes de cinco “artes” depesca: barcos de carnada, buques palangreros, y tres tipos de lances por buques cerqueros, sobredelfines, sobre objetos flotantes, y sobre atunes no asociados. El modelo está enfocado en lasregiones pelágicas; no describe adecuadamente los ecosistemas locales costeros.
El modelo fue desarrollado usando Ecopath with Ecosim (EwE). La información necesa-ria para parametrizar el modelo incluye, para cada componente del ecosistema, estimaciones dela composición de la dieta, biomasa, cociente de producción a biomasa (P/B), cociente de con-sumo a biomasa, eficacia ecotrófica, y varios parámetros que determinan las tasas de crecimien-to y reproducción de los animales. EwE brinda una herramienta con la cual explorar cambios
140 COMISION DEL ATUN

postulados en la explotación pesquera mediante simulaciones dinámicas. Se afinó el modelo delOPO ajustándolo a las capturas por unidad de esfuerzo (CPUE) de los atunes aleta amarilla ypatudo capturados por las pesquerías. Se realizó el ajuste especificando series de tiempo históri-cas de esfuerzo de pesca y estimando las tasas de vulnerabilidad de los animales a la depreda-ción. En general, el ajuste de las CPUE fue bueno en el caso del aleta amarilla, pero no en eldel patudo.
Impulsos físicos
A fin de explorar los efectos de impulsos forzados desde abajo sobre el ecosistema pelá-gico en el OPO tropical, se introdujeron en el modelo series de tiempo predeterminadas de bio-masa de productores, y se simuló la dinámica de los demás componentes del ecosistema. Laintención de las trayectorias de biomasa de productores introducidas era que fuesen represen-tativas de impulsos a escala de ENOS. A fin de crear variaciones a escala de ENOS de labiomasa de productores, se construyó un modelo empírico que relaciona las anomalías de la tem-peratura superficial del mar (TSM) con la concentración de clorofila en la superficie, un índicede la biomasa de fitoplancton. Se desarrolló este modelo a partir de anomalías de las TSMNIÑO3 y tres conjuntos de datos de pigmento de fitoplancton tomados desde buques y porsatélite durante eventos cálidos y fríos recientes. (TSM NIÑO3 es la TSM mensual media en elPacífico oriental ecuatorial, 5ºN-5ºS, 150º-90ºO, obtenido del Centro de Predicción de Clima delServicio Meteorológico Nacional de EE.UU.) Estas anomalías y datos sugieren que, enpromedio, el logaritmo de la concentración de pigmento (mg m-3) cambia aproximadamente -0,047/°C, equivalente a un cambio de un 11%. Se usó la ecuación
Biomasa relativa de productores = 10(-0.047 x anomalía NIÑO3)
para modelar cómo la biomasa de productores podría cambiar como función de las anomalíasTSM NIÑO3. Se usaron series de tiempo de anomalías de TSM para crear trayectorias de bio-masa de productores para las simulaciones. Se realizaron dos conjuntos de simulaciones paraexaminar varios aspectos de la impulsión física de abajo hacia arriba.
En el primer conjunto de simulaciones, se crearon pulsos sencillos positivos y negativosde la biomasa de productores, usando anomalías sencillas de ±2ºC TSM en la ecuación. Se se-leccionaron estas anomalías porque abarcan el alcance dinámico de la mayoría de las anomalíasobservadas comúnmente en la serie de tiempo NIÑO3. Se especificó que ocurriera un pulso poraño, comenzando en el año 5, durante una simulación de 50 años.
En el segundo conjunto de simulaciones, se especificaron ciclos climáticos regulares (co-rrespondientes a anomalías regulares de la TSM de ±2ºC) para examinar los efectos de distintospatrones de ENOS. Se consideraron ciclos a escala de ENOS con períodos de 2, 4, y 6 años. Seestructuró este conjunto de simulaciones para que el cambio neto en la biomasa de productoresdurante un solo ciclo cálido-frío equivaliese a cero (es decir, un evento frío siempre sigue unevento cálido).
Las simulaciones de pulsos sencillos e impulsión cíclica regular fueron diseñadas parabrindar ilustraciones simples de cómo los efectos forzados desde abajo podrían manifestarse enel OPO pelágico. Pulsos sencillos de abajo hacia arriba de la biomasa de productores (tanto endirección positiva como negativa), correspondientes a anomalías de ±2ºC, afectaron el modelo delecosistema hasta el nivel trófico más alto. Los pulsos causaron una dinámica oscilatoria en labiomasa relativa de la mayoría de los componentes del ecosistema, y estas oscilaciones duraronaños después del pulso. Las variaciones inducidas por los pulsos en la biomasa relativa fueron
INFORME ANUAL 2000 141

máximas para los animales en los niveles tróficos medianos (por ejemplo, peces voladores,melvas, y dorados pequeños). Esta variación fue típicamente mayor que la variación introducidaen la biomasa de productores. Después de un pulso, el retraso en el momento de la reacciónmáxima aumentó con el nivel trófico, con la excepción de los mamíferos para los que no se pro-nosticó una reacción a cambios en la biomasa de productores. Los pulsos en la biomasa de pro-ductores ejercieron un efecto similar sobre los componentes del ecosistema que ocupan nivelestróficos aproximadamente equivalentes.
Durante la impulsión cíclica regular desde abajo hacia arriba, el comportamiento del eco-sistema modelado fue sensible a la periodicidad de los eventos cálidos y fríos. Cambios en elperíodo de los ciclos cálido-frío ejercieron efectos no lineales sobre el nivel medio y la cantidadde la variabilidad en la biomasa relativa de los varias componentes del ecosistema. Una reduc-ción del período de los ciclos cálido-frío incrementó la biomasa relativa de las especies de forra-je (por ejemplo, peces voladores, melvas, y dorados pequeños) y redujo la de los componentes enniveles tróficos más altos (por ejemplo, tiburones grandes, marlines grandes, y atunes aletaamarilla grandes). El modelo indicó que los impulsos cíclicos podrían inducir una mayorvariación en la biomasa a niveles tróficos medianos que la variación introducida en la biomasade productores para todos los períodos de impulsión. Se predijo lo contrario para losdepredadores tope; su biomasa relativa varió menos que la del grupo de productores. En com-paración con las simulaciones realizadas con ciclos con períodos de más de 6 años, impulsionescíclicas con períodos de 2 a 4 años ejercieron el mayor efecto sobre el modelo del ecosistema.
A pesar de la sensibilidad predicha del ecosistema a cambios en el período de impulsiónpor ENOS, ninguno de los experimentos de impulsión cíclica causó una reestructuración com-pleta del ecosistema debido a la extinción o explosión de cualquier componente del ecosistemaen el modelo.
En resumen, este trabajo demostró que la aplicación de impulsos físicos realistas a unmodelo de un ecosistema complejo llevó a una mejor comprensión del comportamiento del eco-sistema y los efectos de procesos forzados desde abajo sobre los niveles tróficos medianos y al-tos. Se predijo que eventos de ENOS frecuentes incrementarían la eficacia de la transferenciade energía de los productores a animales que ocupan los niveles tróficos medianos, con un efectocontrario, pero menor, sobre los depredadores tope. Los procesos forzados desde abajo parecenafectar la red trófica entera. La productividad de los componentes del sistema y la escala tempo-ral a la cual la variabilidad es transmitida hacia arriba en la red trófica parecen ser importantesen la estructuración de las redes tróficas pelágicas.
Efectos interactivos de la pesca y el medio ambiente
Se realizó un tercer conjunto de simulaciones para predecir las contribuciones relativasde la pesca y el medio ambiente a la configuración de la estructura del ecosistema en el OPOpelágico tropical. Se impulsaron estas simulaciones con anomalías históricas de las TSMNIÑO3 para 1950-1999 en la ecuación anterior. Se realizaron tres series de simulaciones paracada tipo de arte de pesca. En la primera serie, se supuso que la tasa de mortalidad por pesca(F) que actúa sobre cada componente del ecosistema permanecería constante en un nivel iguala la F media que se estimaba actuó sobre ese componente durante 1993-1997 (denominada “Fpromedio”). En la segunda serie, se supuso que la F que actúa sobre cada componente sereduciría paulatinamente de la F promedio a una décima del promedio a lo largo de la simu-lación de 50 años (denominada “F reducida”), y en la serie final que dicha F se incrementaríapaulatinamente de F promedio a 10 veces el mismo a lo largo de la simulación de 50 años(denominada “F incrementada”). Se analizaron las trayectorias de biomasa predichas para
142 COMISION DEL ATUN

varios componentes del ecosistema bajo cada escenario de pesca con wavelets (olitas) (Bull. Am.Met. Soc. 79 (1): 61-78). El análisis de wavelets es un método para desacoplar los efectos de laseñal ambiental de los efectos a largo plazo de la pesca en las predicciones del modelo.
Se diseñó este conjunto de simulaciones para predecir cuáles componentes del ecosistemapodrían ser susceptibles a efectos forzados desde arriba por la pesca, dada la importancia de lavariabilidad ambiental en la estructuración del ecosistema. Los espectros de wavelets (para1950-1999) promediados por tiempo de las trayectorias de biomasa predichas por el modelo bajotres situaciones de pesca demostraron dos características generales. En primer lugar, los espec-tros de potencia de muchos de los componentes tanto en el nivel trófico alto como en el medianofueron caracterizados por una potencia significativamente mayor con períodos de unos 2 a 12años. Este resultado indica que estos animales son sensibles a impulsos a escala de ENOS, talcomo se señala para las simulaciones previas. Sin embargo, para ciertos componentes del eco-sistema, esta característica dependió de si se mantuvo la pesca en F promedio o si cambió. Labiomasa predicha de algunos de los depredadores de nivel alto, por ejemplo los marlines gran-des, reaccionó a periodicidades a escala de ENOS solamente en la simulación en la que se man-tuvo la mortalidad por pesca en F promedio. Al reducir o incrementar sustancialmente delpromedio la mortalidad por pesca de estos componentes, los espectros de potencia no fueron sig-nificativos a periodicidades a escala de ENOS. Este resultado vale solamente para los compo-nentes del ecosistema con tasas de renovación relativamente bajas (P/B < 2.0). Se predijo queestos animales son más sensibles a influencias forzadas desde arriba por la pesca que a fuerzasfísicas impulsadas desde abajo. Esta tendencia fue sensible al tipo de arte de pesca simulado:el efecto fue máximo para las artes que ejercen el mayor impacto sobre los depredadores de altonivel. Las series de tiempo predichas para la biomasa de las especies de forraje, como las melvas,mostraron también una potencia significativamente alta a periodicidades a escala de ENOS,pero, a diferencia de los depredadores de alto nivel, esta caracterización no cambió al incre-mentar o reducir la mortalidad por pesca. Este patrón fue típico de los espectros de compo-nentes del ecosistema con cocientes P/B relativamente altos (≥2,0). Típicamente, los efectosforzados desde arriba por la pesca no alcanzaron los componentes en niveles tróficos medianos,y la variación causada por ENOS dominó la reacción de los animales en esos niveles tróficos.
La segunda característica identificada en los espectros globales de potencia de waveletpara ciertos componentes fue un aumento constante de la potencia con el aumento del período.Esta característica estuvo asociada con los depredadores de alto nivel en situaciones con incre-mento y disminución de la mortalidad por pesca, y recalca la importancia de la tendencia a largoplazo causada por cambios en la presión de pesca, según el tipo de arte de pesca.
ESTUDIOS DEL CICLO VITAL TEMPRANODesde hace ya muchos años los biólogos pesqueros creen que la fuerza de una clase anual
se ve determinada principalmente durante las etapas tempranas del ciclo vital (huevo, larva, y/ojuvenil temprano). Décadas de investigación han descubierto una cantidad considerable deinformación sobre las poblaciones de atunes adultos, pero se sabe relativamente poco acerca delas etapas tempranas del ciclo vital y los factores que afectan el reclutamiento de los juvenilesa los stocks explotables. Estas consideraciones motivaron a la CIAT a establecer en la Bahía deAchotines, en la República de Panamá, un centro de investigación dedicado al estudio del ciclovital temprano de los atunes.
La Bahía de Achotines está situada en la punta sur de la Península de Azuero en la Pro-vincia de Los Santos, República de Panamá (Figura 14). La plataforma continental es bastanteestrecha en este lugar: el contorno de 200 metros se encuentra a entre solamente 6 y 10 km del
INFORME ANUAL 2000 143

litoral. Esto brinda a los científicos del laboratorio acceso fácil a aguas oceánicas donde ocurredesove de atunes en cada mes del año. La temperatura superficial del mar fluctúa entre 21° y29°C. El agua de la Bahía de Achotines es adecuada para mantener atunes vivos en el laborato-rio. La proximidad del laboratorio a la zona de estudio ofrece una alternativa menos costosa queun buque de investigación, y permite una mayor flexibilidad en el muestreo.
El programa de la CIAT de investigación de las etapas tempranas del ciclo vital abarcaestudios de laboratorio y de campo ideados para obtener un mayor conocimiento de los procesosde reclutamiento y de los factores que lo afectan. Investigaciones anteriores del reclutamientode los peces sugieren que tanto los factores abióticos (temperatura y salinidad, por ejemplo) co-mo los biológicos (alimentación, depredación, etc.) pueden afectar el reclutamiento. Ya que lasupervivencia antes del reclutamiento es controlada probablemente por una combinación de es-tos factores, el programa de investigación toma en cuenta la interacción entre el sistema biológi-co y el ambiente físico (Informe de Datos 9 de la CIAT).
Proyecto conjunto OFCF-Panamá-CIAT
En diciembre de 1993, la Overseas Fishery Cooperation Foundation (OFCF) del Japón, elgobierno de la República de Panamá, y la CIAT acordaron emprender un proyecto conjunto decinco años de duración, subvencionado principalmente por la OFCF, en el Laboratorio de Acho-tines. En 1998 se extendió el proyecto dos años más, y en 1999 se acordó extenderlo hasta mar-zo de 2001. Los objetivos del proyecto son: (1) criar atunes aleta amarilla adultos parasuministrar larvas y juveniles para la investigación de su ciclo vital temprano; (2) producirorganismos de alimento para los atunes larvales y juveniles; y (3) criar pargos (Lutjanidae) ycorvinas y especies afines (Sciaenidae) reproductores y organismos de alimento para sus larvasy juveniles.
Fue necesario ampliar y mejorar la infraestructura del Laboratorio para poder llevar a ca-bo los objetivos del proyecto. Se construyeron los seis tanques siguientes, todos de hormigón yhundidos en la tierra:
Tanque Diámetro (metros) Profundidad (metros) Capacidad (litros)1 17,0 6,0 1.361.9002 8,5 3,0 170.2003 8,5 1,5 85.1004 8,5 1,5 85.1005 8,5 1,5 85.1006 8,5 3,0 170.200
Aletas amarillas reproductores
Se capturaron con anzuelo aletas amarillas de entre 2 y 7 kg en aguas costeras adyacentesal Laboratorio de Achotines para establecer la población de reproductores en el mismo. Se usa-ron protocolos estándar, desarrollados en años previos, para transportar, trasladar, marcar,pesar, y medir los especímenes capturados. Cada uno fue marcado con una marca con micro-procesador implantada en la musculatura dorsal e inyectado con oxitetraciclina (OTC) paraestablecer una marca temporal en los otolitos y vértebras. Las marcas permiten identificar a lospeces individuales durante todo el cautiverio, y la inyección con OTC facilita los estudios delcrecimiento de los peces. Se sumergió a todos los peces en soluciones diluidas de formol y nifure-stirenato de sodio (NFS), un agente antimicrobiano, durante varias horas para tratar cualquierinfección de la piel causada por la captura y traslado.
144 COMISION DEL ATUN

Durante 1997-2000 se mantuvieron los aletas amarillas colocados en los tanques de re-productores grande (Tanque 1) y de reserva (Tanque 2) durante 1996. Se vigiló la dieta de losreproductores en el Tanque 1 para asegurar que proporcionase suficiente energía para soportartasas elevadas de crecimiento y desove, pero sin causar una deposición excesiva de grasa. Se usóel comportamiento de alimentación de los peces y estimaciones de su biomasa como base paradeterminar las raciones diarias. Se usó información de análisis de la cantidad de proteína,humedad, grasa, y ceniza en los organismos alimenticios y en los peces reproductores (obtenidosde peces muertos o sacrificados) para ajustar el alimento. Los organismos alimenticiosincluyeron calamares (Loligo spp. o Illex argentinus), anchovetas (Cetengraulis mysticetus),machuelos (Opisthonema spp.), y anchoas Anchovia macrolepidota, con suplementos de vitam-inas y bilis en polvo. Varios especímenes de cada grupo taxonómico usado de alimento fueronsecados, homogeneizados, y analizados por un laboratorio en Aguadulce (Panamá) para deter-minar las cantidades de estos componentes que contienen. En promedio, las anchovetas contu-vieron un 64% más de calorías, y los machuelos un 116% más, que los calamares. Ajustando lascantidades y proporciones de calamar y pescado en la dieta, se mantiene la cantidad de alimentoen un nivel suficientemente alto para evitar actividad frenética al alimentarse los peces, perosin rebasar demasiado los requisitos para el metabolismo, crecimiento, reproducción, y pérdidaspor desperdicios. Durante 2000 los reproductores en el Tanque 1 fueron alimentados a un nivelde alrededor del 2,0 al 4,5% de su peso por día.
Durante el año fueron transferidos al Tanque 1 19 aletas amarillas jóvenes para reabaste-cer la población reproductora, reducida a cinco peces, todos del grupo inicial en el tanque desde1996. Fueron identificados por su número de marca, medidos, pesados, e inyectados con oxite-traciclina antes de ser introducidos en el tanque. Su talla varió de 58 a 71 cm y su peso de 4 a14 kg. En el momento de ser introducidos en el Tanque 1 había peces que quedaban de losgrupos de aletas amarillas introducidos en el tanque durante 1996 y 1999. Al fin del año había21 aletas amarillas en el tanque, uno del grupo inicial de 1996, 6 introducidos en agosto de 1999,y 14 introducidos en 2000. Durante el año murieron 14 peces, uno a causa de inanición, otrodebido a una infección, y 12 como resultado de golpes con la pared del tanque. Se ajustaron mod-elos de crecimiento a los datos de talla y peso de los aletas amarillas en el momento de ser intro-ducidos en el tanque y al morir o ser sacrificados, y se calcularon estimaciones diarias de la tallay peso a partir de los modelos. La talla y peso estimados de los peces en el Tanque 1 al fin delaño fueron:
Número Rango de talla (cm) Rango de peso (kg)Peces grandes 1 153 59Peces medianos 6 117-125 34-45Peces jóvenes 14 87-104 14-25
Se estimó la biomasa en el Tanque 1 al fin de año en 0,39 kg/m3, algo inferior al nivel objetivooriginal de 0,50 kg/m3 para la población reproductora.
Se mantuvieron los aletas amarillas en los Tanques 2 y 6 en reserva para incrementar lapoblación de reproductores en el Tanque 1 en caso necesario. Durante 2000 se siguió capturandoatunes aletas amarillas pequeños en aguas costeras cerca del Laboratorio. Se usaron los pecesen un experimento que comparó distintos tipos de alimento para los peces reproductores (verComparación de dietas para el aleta amarilla). Aletas amarillas de entre 49 y 73 cm y 2,5y 6,5 kg fueron capturados en el mar con anzuelo y transportados al laboratorio; cada uno fuemedido, pesado, inyectado con oxitetraciclina, y marcado con marca de microprocesador implan-tada. Luego, al cabo de un período de adaptación, se trasladaron los peces al Tanque 2 o al
INFORME ANUAL 2000 145
Tanque 6. Fueron alimentados con una dieta de calamar y arenque a entre el 5 y 8% del pesodel cuerpo por día.
Desove de atún aleta amarilla
Durante 2000 los aletas amarillas en el Tanque 1 desovaron diariamente en enero y demayo a diciembre. El desove fue intermitente durante febrero y marzo, cuando el afloramientoen alta mar causado por los vientos del norte de la temporada seca redujo la temperatura delagua cerca de la costa y en los tanques de cría. En abril el desove fue casi diario. La temper-atura del agua en el tanque varió de 22,2° a 28,8°C durante el año, y el desove tuvo lugar a tem-peraturas entre 23,5° y 28,8ºC. El desove tuvo lugar entre las 1220 y 1915 horas, y fuegeneralmente precedido por comportamiento de cortejo (natación en pareja, persecución).
El número de huevos fertilizados recogido tras cada desove osciló entre unos 150 y1,709,000. Se usaron varios métodos para recoger los huevos, entre ellos sifones y salabardosen la superficie y una red de superficie de malla fina.
Para cada evento de desove se registraron los parámetros siguientes: hora de desove,diámetro de los huevos, duración de la etapa de huevo, tasa de eclosión, talla de las larvas, y du-ración de la etapa de saco vitelino. Periódicamente se registró también el peso de los huevos yde larvas en etapa de saco vitelino y primera alimentación y la talla y morfometría seleccionadade larvas en primera alimentación. Se incorporó esta información en una base de datos para unanálisis de los parámetros de desove y los factores físicos o biológicos que podrían afectar eldesove (por ejemplo, temperatura del agua, salinidad, ciclo lunar, tamaño medio de los peces quedesovan, y la ración media diaria de los mismos).
Comparación de dietas para el aleta amarilla
En noviembre de 2000 se inició un experimento para comparar las dietas de aletas amari-llas en cautiverio. Se compararon dos dietas: (1) 50% arenque y 50% calamar y (2) alimentogranular seco. Se asignaron al azar 22 aletas amarillas, de entre 55 y 83 cm y 4,5 y 13,4 kg, alTanque 2 (12 peces) o al Tanque 6 (10 peces). Se alimentó a los peces en el Tanque 2 con la dietade arenque y calamar a un nivel de aproximadamente 3,0% del peso de cuerpo por día, y a lospeces en el Tanque 6 con el alimento seco hasta saciarlos (aproximadamente 1,0% del peso decuerpo por día). Se continuaría el experimento hasta principios de marzo de 2001, en cualmomento se mediría y pesaría los peces, se tomarían muestras para un análisis de composiciónquímica, y se compararía la supervivencia de los dos grupos.
Estudios de laboratorio del crecimiento y alimentación de aletas amarillas larvales yjuveniles
Durante 2000 se realizaron varios experimentos diseñados para examinar los efectos dedensidad de larvas, microturbulencia, intensidad de luz, y densidad de presas sobre la inci-dencia de alimentación, supervivencia, y crecimiento de las larvas de aleta amarilla.
Se completó un experimento de 7 días para determinar los efectos combinados de la mi-croturbulencia y densidad de las larvas sobre la supervivencia, crecimiento, y producción de lar-vas de aleta amarilla. (La “producción” de un tanque es el peso total de los peces en el tanqueal fin del experimento multiplicado por la tasa de supervivencia de los peces durante el experi-mento.) El experimento fue similar a otros realizados durante 1998 y 1999. En esos experi-mentos se midieron los efectos de la microturbulencia y densidad de las larvas por separado, yse determinó que (1) hay un nivel de turbulencia óptimo para la supervivencia de aletas amar-
146 COMISION DEL ATUN

illas larvales, con la supervivencia más elevada a niveles de turbulencia medianos a semialtos,y (2) el crecimiento de las larvas de aleta amarilla depende marcadamente de la densidad de lasmismas durante la primera semana de alimentación. En el estudio actual, se expuso a las larvasa distintas combinaciones de turbulencia y densidad larval a fin de estudiar los efectos interac-tivos de estos factores sobre el crecimiento y supervivencia de las larvas. El nivel de turbulenciausado en este estudio fue bajo o mediano, y la densidad larval baja o alta. Se usaron las cuatrocombinaciones de estos factores, y se replicó cada combinación, por lo que se usaron ocho tan-ques, de 1,2 m de diámetro, encerrados en tanques de 1,5 m para permitir controlar la temper-atura del agua en los tanques interiores. Se controló la turbulencia en cada tanque mediante elnivel de aeración, y se midió a diario la velocidad del agua en cada tanque con un medidor decorrientes microacústico, que mide la velocidad del agua en tres dimensiones simultáneamente.Se alimentó a las larvas inicialmente con rotíferos enriquecidos (300-2.000/litro), y al sexto díade alimentación se introdujeron nauplios de camarón Artemia spp. enriquecidos (200-500/litro).La temperatura del agua varió entre 26,7° y 27,9°C durante el experimento. Se tomaron cadados días muestras de las larvas de cada tanque, unas para obtener medidas de la talla y pesoseco de especímenes frescos y otras para conservar en formol para análisis de los parámetros dealimentación. Estas últimas serían medidas, se les extraería el estómago, y se enumeraría ymediría el contenido. Se calculó el número de supervivientes en cada tanque al cabo de 7 díasde alimentación. Se analizaría el crecimiento, supervivencia, y producción de las larvas enrelación con los niveles de turbulencia y densidad de larvas en los tanques, y se compararían losresultados con aquéllos de los experimentos de turbulencia y densidad realizados durante 1998y 1999.
Se supuso, con base en los resultados de unos pocos estudios publicados, que las larvas deatún se alimentan solamente de día. A fin de probar este supuesto, en julio se realizó un exper-imento de 7 días para determinar la capacidad de alimentación diurna de los aletas amarillaslarvales. Se criaron las larvas en un tanque de 1,2 m de diámetro encerrado en otro tanque de1,5 m de diámetro. Se expuso a las larvas a un fotoperíodo diario natural simulado, usando luzfluorescente. De las 0815 a las 1800 h se usaron varios niveles de luz, y de 1800 a 0815 ningu-na. Se alimentó a las larvas inicialmente con rotíferos enriquecidos (300-2.000/litro), y al sextodía de alimentación se introdujeron nauplios de camarón Artemia spp. enriquecidos (200-500/litro). La temperatura del agua varió entre 26,3° y 27,9°C durante el experimento. Se toma-ron muestras de las larvas durante dos períodos de 36 horas, en los días 1-2 y 6-7 de laalimentación. Durante cada período de muestreo se tomaron larvas de los tanques a intervalosde 1 a 4 horas, y en cada intervalo se registró el nivel de luz en el tanque. Se conservaron lasmuestras en formol, para luego analizarlas y determinar la incidencia de alimentación y lastasas de evacuación gástrica bajo condiciones de fotoperíodo natural simulado.
Se criaron varios grupos de aletas amarillas más allá de la metamórfosis juvenil. Laduración máxima del período de cría de un aleta amarilla durante el año fue 7 semanas despuésde la eclosión. En octubre se realizó una prueba de comparación de dietas con dos grupos dejuveniles tempranos, de edad entre 24 y 29 días después de la eclosión (DDE) (TE 16 a 24 mm),cada uno en un tanque de 2,4 m de diámetro y 4.800 L de capacidad. Se alimentó a los peces deun grupo con arenque liofilizado y calamar, y a los del otro con arenque congelado picado y cala-mar, suplidos con una pequeña cantidad de copépodos liofilizados. Se realizó el experimentodurante 12 días. Se tomaron muestras de entre 2 y 4 peces de cada tanque a intervalos de 4 ó5 días para medir su crecimiento. La supervivencia al cabo de los 12 días fue similar para losdos grupos, pero el crecimiento en peso del grupo alimentado con arenque y calamar fue aprox-imadamente el doble de aquél del grupo alimentado con la dieta liofilizada.
INFORME ANUAL 2000 147

El Sr. Masahiko Koiso, científico de la Japan Sea Farming Association, trabajó con suhomólogo del OFCF, Sr. Yukiyasu Niwa, y miembros del personal de Achotines en un estudio dela cría de larvas y juveniles de aleta amarilla. Se mantuvieron más de 100.000 larvas tem-pranas un tanque de 3,7 m de diámetro y 12.000 L de capacidad. Las larvas fueron criadas enagua con fitoplancton denso (agua verde), y alimentadas con una dieta secuencial de rotíferoscultivados (5-10/ml) de 3 a 20 DDE, nauplios de camarón Artemia (500/L) de 14 a 22 DDE, ylarvas de aleta amarilla recién eclosionadas (10/L) de 14 a 26 DDE. A los 29 DDE la super-vivencia en el tanque fue aproximadamente 2,5%, y la talla media de los peces (entonces juve-niles tempranos) 24,9 mm (tasa media de crecimiento 0,85 mm/día). De estos supervivientes,1.500 fueron transferidos a un tanque de 8,5 m de diámetro y 85.100 L de capacidad, y 500 acada uno de dos tanques de 3,7 m de diámetro y 12.000 L de capacidad. Subsecuentementefueron alimentados con una dieta de arenque y calamar picados. Los juveniles comieron biendurante la primera semana después de ser trasladados, pero posteriormente la tasa de ali-mentación disminuyó y la mortalidad por inanición aumentó. El último juvenil en los tanquesde 3,7 m murió a los 40 DDE y el último superviviente en el tanque de 8,5 m a los 48 DDE. Alfin del experimento los juveniles medían entre 30 y 37 mm de largo (tasa de crecimiento ~0,7-1,3 mm/día) excepto un individuo excepcional que alcanzó una talla de 83 mm (~2,1 mm/día).
Estudios de genética de aletas amarillas cautivos
Los estudios de genética en el Laboratorio de Achotines han sido realizados principal-mente por el Sr. Yukiyasu Niwa, el homólogo de la OFCF, trabajando en colaboración con el Dr.Naritashi Chow del National Research Institute of Far Seas Fisheries en Shimizu (Japón), ycientíficos de la CIAT. Se han tomado muestras genéticas de los aletas amarillas reproductoresy sus huevos y larvas para determinar el grado de variación genética en los adultos y sus crías.Se toma una muestra para análisis genético de todo pez reproductor nuevo introducido en lapoblación cautiva. Se realizó un análisis de variación genotípica con muestras tomadas de repro-ductores, huevos y larvas en diciembre de 1999 y enero de 2000. El análisis identificó seisgenotipos comunes a las hembras reproductoras, y a los huevos y larvas. Estos resultados sug-ieren que durante ese período seis hembras (de un total de 21 peces) participaron en el desove.Continuará en 2001 el muestreo genético de los reproductores, huevos y larvas.
Desove y cría de corvinas y pargos de la mancha
La investigación de las corvinas es realizada por el Sr. Amado Cano, de la Autoridad Ma-rítima de Panamá, trabajando en colaboración con científicos japoneses y el personal de la CIAT.
Durante 1996 se capturaron corvinas colirrubia (Umbrina xanti) y pargos de la mancha(Lutjanus guttatus) para establecer poblaciones reproductoras en cautiverio.
Durante 1999 las últimas corvinas colirrubia reproductoras fueron liberadas en la Bahíade Achotines. Durante el año se manyuvo en un tanque de 12.000 L un grupo de corvinas coli-rrubia juveniles, criadas en cautiverio en julio de 1999, con el objetivo de que crecieran hasta laetapa adulta. Al fin del año medían unos 24 cm de talla y pesaban unos 160 gramos, en prome-dio.
Durante el año se continuaron los esfuerzos por reemplazar las corvinas colirrubia conreproductores de una especie de corvina de tamaño y valor comercial mayores. Se capturaronespecímenes de dos especies, corvina blanca (Cynoscion albus) y corvinatas de Stolzmann (C.stolzmani), y se mantuvieron en un tanque de 85.100 L. Al fin del año había 10 peces en el tan-que. En 2001 se capturarán reproductores adicionales de ambas especies, y se usará la especieque sobreviva mejor en cautiverio para estudios de desove y cría.
148 COMISION DEL ATUN

Los pargos de la mancha reproductores comenzaron a desovar a fines de mayo y siguie-ron desovando hasta noviembre e intermitentemente en diciembre. Se mantiene en dos tanquesde 12.000 L un grupo de 70 peces criados en cautiverio en octubre de 1998. Al fin del año estospeces medían en promedio unos 40 cm de talla y pesaban unos 800 gramos. Se están criando es-tos peces con la intención de completar el ciclo vital de la especie en cautiverio y estudiar lospatrones de crecimiento y requerimientos alimenticios de los juveniles.
Inauguración del muelle
El 14 de febrero de 200 tuvo lugar una ceremonia para inaugurar el muelle y la rampanuevamente completados en la Bahía de Achotines. Presentaron discursos la Presidenta de Pa-namá, Sra. Mireya Moscoso Rodríguez, el Embajador de Japón en Panamá, Sr. Yasuyuki Hujis-hima, el Presidente de la OFCF, Sr. Junji Kawai, y el Director de la CIAT, Dr. Robin Allen.Asistieron en total más de 200 personas, entre ellas representantes de muchas otras institu-ciones panameñas gubernamentales y de investigación. La Autoridad Marítima de Panamá pre-sentó al Sr. Akio Nakazawa, el homólogo de la OFCF en el proyecto conjunto en el Laboratoriode Achotines, una placa en reconocimiento de sus contribuciones al proyecto en los seis años ymedio previos.
OCEANOGRAFIA Y METEOROLOGIADurante los 46 años desde 1955 hasta 2000 han ocurrido diez eventos significativos de La
Niña en el Pacífico oriental tropical (POT), cada uno de los cuales se desarrolló de 1 a 3 añosdespués de terminar un episodio de El Niño moderado a fuerte. Estos eventos son caracteri-zados por vientos de oriente fuertes sobre el POT, llevando a incrementos notorios en el aflo-ramiento de agua subsuperficial fría y rica en nutrientes a lo largo de la línea ecuatorial al estede 160°O, en las zonas costeras de Ecuador y Perú, y en zonas de alta mar frente a México yCentroamérica. Como consecuencia, prevalecen temperaturas superficiales del mar (TSM)bajas, nivel del mar alto, y termoclinas menos profundas en gran parte del POT. Además, elIndice de Oscilación del Sur (IOS) suele ser positivo. (El IOS es la diferencia entre las anoma-lías en la presión atmosférica a nivel del mar en Tahiti (Polinesia Francesa) y Darwin(Australia) y es una medida de la fuerza de los vientos superficiales de oriente, especialmenteen el Pacífico tropical en el hemisferio sur.) Estos eventos no han atraído la misma atención quelos episodios de El Niño, generalmente asociados con condiciones oceánicas y meteorológicasadversas para la pesca de superficie. No obstante, los episodios de La Niña son eventos impor-tantes, ya que contribuyen a mantener el suministro de alimento, a través del afloramiento,para los organismos pelágicos, inclusive aquéllos de valor comercial directo. Además, variasespecies de peces, entre ellas los atunes aleta amarilla y barrilete, son más vulnerables a la cap-tura cuando la termoclina está más cerca de la superficie y es marcada (con una disminuciónrápida de temperatura con profundidad) durante episodios de La Niña.
Desde mayo de 1998 hasta el fin de 1999 prevalecieron condiciones de La Niña en el POT,y continuaron durante el primer trimestre de 2000. Fueron especialmente pronunciadas en laregión ecuatorial al oeste de 100°O y frente a la costa de Ecuador, donde las TSM fueron más de1°C inferiores al nivel normal (Figura 15a). Los altos valores positivos del IOS (0,7 en enero,1,6 en febrero, y 1,0 en marzo) fueron consistentes con condiciones de La Niña. No obstante, lafuerza de los vientos de oriente al este de 100°O estuvo por debajo de lo normal, y las TSM aleste de 110°O entre la línea ecuatorial y 10°S fueron ligeramente superiores a lo normal.Durante el segundo trimestre pareció que el episodio de La Niña se acercaba a su fin. Las TSMfueron casi normales en la mayor parte del OPO (Figura 15b), y el IOS disminuyó de 1,2 en abril
INFORME ANUAL 2000 149

a 0,2 en mayo y -0,6 en junio. Durante el tercer trimestre las TSM siguieron casi normales enel POT (Figura 15c), pero el IOS aumentó de -0,4 en julio a 0,4 en agosto y 1,0 en septiembre,fenómeno no consistente con la fuerza inferior a lo normal de los vientos de oriente durante eltrimestre. En cambio, sí fue consistente con el aumento en la fuerza de los vientos de superficieen el Pacífico central tropical, donde habían comenzado condiciones débiles de La Niña. Enoctubre los vientos de oriente y las TSM fueron casi normales en la mayor parte del POT. Ennoviembre y diciembre, empero, la fuerza de los vientos de oriente aumentó, especialmente enel Pacífico central ecuatorial, lo cual contribuyó probablemente al aumento en el tamaño de laszonas con TSM más de 1.0°C inferiores a lo normal frente a la costa de Ecuador y Perú (Figura15d). Esto fue consistente con el IOS, que estuvo en 1,0, 2,0, y 0,7 en octubre, noviembre, ydiciembre, respectivamente. La termoclina en el ARCAA durante el cuarto trimestre per-maneció a una profundidad de entre 40 y 60 m, unos 10 m menos que lo normal, mientras queen el Pacífico central y occidental estuvo a una profundidad de entre 160 y 200 m, 10 a 20 m másque lo normal. Estos cambios señalan que se estaba desarrollando un episodio débil de La Niñaen el POT, y parecía que estas condiciones podrían persistir hasta al menos mediados de 2001.
EVALUACION DE LOS STOCKS DE ATUNES Y PECES PICUDOSEn los documentos preparados para la 68ª reunión de la CIAT, prevista para junio de
2001, se describen las evaluaciones de los stocks de aleta amarilla, barrilete, patudo, aleta azul,albacora, y pez espada azul realizadas por el personal de la CIAT en 2000. Dichos documentosserán publicados, junto con un documento sobre el muestreo para estimar la composición portalla de los atunes capturados por las pesquerías de superficie en el OPO, en el Informe de Eva-luación de Stocks 2 de la CIAT a fines de 2001.
DELFINESEn el Océano Pacífico oriental (OPO), los atunes aleta amarilla de entre unos 10 y 40 kg
se asocian frecuentemente con mamíferos marinos, especialmente con delfines manchados (Ste-nella attenuata), tornillos (Stenella longirostris), y comunes (Delphinus delphis y, posiblemente,D. capensis). En la Figura 16 se ilustran las distribuciones espaciales de los distintos stocks deestas especies (D. capensis ocurre probablemente solamente dentro de la zona de distribucióndel stock norteño del delfín común.) Los pescadores descubrieron que la mejor forma de lograrcapturas máximas de aleta amarilla con red de cerco en el OPO era buscar manadas de delfineso bandadas de aves marinas que se encuentran a menudo con delfines y atunes, calar la redalrededor de los delfines y los atunes, cobrar la mayoría de la red, realizar una maniobra deretroceso para permitir a los delfines escapar sobre los corchos de la red, y finalmente cobrar elresto de la red y cargar el pescado a bordo del buque. Desgraciadamente, particularmentedurante los años 1960 y 1970, muchos delfines murieron sofocados tras enmallarse en las redesdurante este proceso.
Estimaciones de la mortalidad de delfines causada por la pesca
En 2000 la mortalidad incidental de delfines se cifró en 1.636 animales (Tabla 13), unaumento de 21% con respecto a la mortalidad de 1.348 animales en 1999. En la Tabla 14a sedetallan las mortalidades en 1979-2000, por especie y stock, y en la Tabla 14b los errores están-dar de estas estimaciones para 1979-1994. Las mortalidades de las principales especies afecta-das por la pesquería muestran reducciones en la última década (Figura 17) similares a las delas mortalidades de todos los delfines combinados (Figura 18). En la Tabla 13 se presentan tam-
150 COMISION DEL ATUN

bién estimaciones de las abundancias de los varios stocks de delfines en 1986-1990 y las mor-talidades relativas (mortalidad/abundancia). Los stocks de delfines con los niveles más altos demortalidad relativa fueron el manchado nororiental y tornillo oriental (0,05%) y el stock centraldel delfín común (0,06%). El límite superior de los intervalos de confianza de 95% aproximadosfue menos de 0,10% para todos los stocks excepto el stock central del delfín común (0,108%). Conla excepción de este último, los valores más altos correspondieron a los delfines manchado noro-riental (0,051%) y tornillo oriental (0,066%). En 2000 un viaje completo y parte de otro por bu-ques de la Clase 6 no llevaron observador. Si se pescó atún asociado con delfines en esos viajes,y si la tasa de mortalidad por día en el mar fue similar al promedio para todos los buques de laClase 6 que pescaron sobre delfines, la mortalidad total ocasionada por la flota en 2000 se in-crementaría en unos 9 delfines.
El número de lances sobre delfines por buques de la Clase 6 aumentó un 7%, de 8.648 en1999 a 9.235 en 2000, y lances de ese tipo constituyeron el 44.6% del número total de lances en1999 y el 49,6% en 2000 (Tabla 5). La mortalidad promedio por lance aumentó de 0,16 delfinesen 1999 a 0,18 delfines en 2000. En la Figura 19 se ilustra la distribución de la mortalidad pro-medio por lance durante 2000. Hubo zonas de mortalidad por lance relativamente alta por todala zona de pesca. En la Figura 18 se ilustran las tendencias en el número de lances sobre delfi-nes, mortalidad por lance, y mortalidad total en años recientes.
Las cifras anteriores se basan en datos de viajes de buques atuneros acompañados por ob-servadores de los programas de la CIAT, el Programa Nacional de Aprovechamiento del Atún yProtección de Delfines de México, el Programa Nacional de Observadores de Venezuela, y elPrograma Nacional de Observadores Pesqueros de Ecuador. Las comparaciones en los dos pá-rrafos siguientes se basan exclusivamente en las bases de datos de la CIAT para 1986-2000.
Desempeño de los pescadores
Se ha medido el desempeño de los pescadores con respecto a la reducción de la mortali-dad de delfines con variables tales como la mortalidad media por lance, el éxito en la liberaciónde todos los delfines cercados (lances con mortalidad nula, número de delfines en la red despuésde la maniobra de retroceso), y el éxito en la reducción de factores que causan mortalidad eleva-da (lances con averías mayores, abultamientos de la red, colapsos de la red, etcétera). En la Fi-gura 20 y la Tabla 15 se presentan datos sobre estas variables en 1986-2000. Los datos señalanuna mejora constante desde 1986, contribuyendo a la reducción de la mortalidad por lance.
El desempeño de capitanes individuales es asimismo evaluado cada año. Los buquespescan en zonas distintas, y sobre stocks de delfines distintos, por lo que sería injusto juzgar atodos los capitanes sobre la base de una sola medida tal como la mortalidad media por lance.Por lo tanto, se estratificaron los datos por zona de pesca y por stock de delfines. Se calcula unamedida estandarizada de desempeño para cada combinación de stock y área, y se combinan lasmedidas de cada categoría en una medida general del desempeño, usando un sistema de ponde-ración basado en el número de lances en cada categoría. A continuación se clasifica el desem-peño de cada capitán de acuerdo a esta medida general, y se usa esta clasificación como partedel sistema del APICD de entrenamiento y calificación de capitanes.
Tendencias en la abundancia basadas en datos de observadores en buques atuneros
A pesar de reducciones dramáticas en la mortalidad de delfines asociados con esta pes-quería desde principios de la década de los 1970, los índices de abundancia relativa de las prin-cipales especies de delfines afectadas por la pesquería no han mostrado un aumento claro en las
INFORME ANUAL 2000 151

dos últimas décadas (Tabla 6). Se usaron datos tomados por observadores del Servicio Nacionalde Pesquerías Marinas (NMFS) de EE.UU. y de la CIAT a bordo de buques atuneros para esti-mar índices de abundancia relativa de delfines porque representan un gran número de observa-ciones obtenidas a costo bajo comparado con datos obtenidos en cruceros de investigación. Sinembargo, el uso de estos datos plantea problemas graves para la estimación a raíz de los sesgosintroducidos por la estructura oportunista de los datos. Si no hubiera tendencias en estos sesgos,sería factible estimar las tendencias en la abundancia relativa a partir de estos datos. Sinembargo, cambios en las modalidades de búsqueda y estrategias de pesca podrían ocasionar ten-dencias temporales en los sesgos que podrían, a su vez, producir tendencias espurias en losíndices de abundancia relativa. A la luz del uso propuesto de los índices de abundancia relativaen los modelos de dinámica de poblaciones, se plantearon varias dudas con respecto a lacapacidad de estos índices de capturar con precisión y de forma confiable las tendencias en laabundancia real de los delfines. El personal de la CIAT terminó la primera parte de unarevisión y análisis de las distintas fuentes de sesgos y su impacto sobre los índices a fin de deter-minar si las metodologías actuales deberían ser modificadas para tomar en cuenta, y ajustarsea, cambios en los sesgos en los últimos años.
El personal de la CIAT, en colaboración con el Research Unit for Wildlife PopulationAssessment en la Universidad de St. Andrews (Escocia), ha examinado de nuevo los datos de1977-2000 e identificado varias fuentes potenciales de sesgo que se han desarrollado en la últi-ma década. A principios de los años 1980, las distribuciones de la distancia perpendicular delbuque a las manadas de delfines demostraba un exceso de avistamientos a menos de 0,5 millasnáuticas de la línea de derrota debido a que el buque virase hacia la manada antes de que el ob-servador se diera cuenta del avistamiento. Desde fines de los años 1980 las distribuciones de ladistancia perpendicular comenzaron a mostrar una falta de avistamientos cerca de la línea dederrota, con el déficit alejándose al máximo de la línea de derrota en el caso de los avistamientosrealizados desde el helicóptero. La falta de avistamientos cerca de la línea de derrota fue inespe-rada, y es explicada sólo parcialmente por el error de redondeo en los ángulos de avistamiento.Para eliminar la influencia de estos avistamientos sobre la estimación de la abundancia rela-tiva, las viajes con un ángulo medio de avistamiento de menos de 20° fueron excluidos de losanálisis previos. Sin embargo, el exceso de avistamientos cerca de la línea de derrota no elimi-nado por este procedimiento ejerce una influencia considerable sobre el ajuste del modelo detasa de riesgo (hazard rate) a la distribución de distancias perpendiculares. Por lo tanto, en losprimeros años, cualquier pico en la distribución de la distancia perpendicular cerca de la líneade derrota llevaría a una estimación inflada de la abundancia relativa. Con el desarrollo de undéficit en los avistamientos cerca de la línea de derrota en los años 1990, disminuiría la ten-dencia hacia estimaciones infladas de abundancia relativa, impartiendo una tendencia temporalen el sesgo.
Las diferencias en el porcentaje de avistamientos que condujeron a lances y en el tamañototal medio de las manadas, por método de avistamiento, sugieren que el porcentaje de avista-mientos realizados por la tripulación que no son reportados al observador varía según el equipocon el que se realizó el avistamiento. Un análisis de los avistamientos de delfines manchadosde altamar dentro de la zona del delfín manchado de altamar nororiental (al norte de 5ºN y estede 120ºO) demuestra que los avistamientos por helicóptero tenían una mayor probabilidad deconducir a un lance que los avistamientos por prismáticos, y que el porcentaje de avistamientospor helicóptero que condujo a lance aumentó con el tiempo. Los avistamientos por prismáticosconstituían más del 73% de los avistamientos antes de 1989, pero solamente el 26% en 2000. Enpromedio, el 79% de los avistamientos por helicóptero, el 72% de los avistamientos por radar, y
152 COMISION DEL ATUN

el 62% de avistamientos por prismáticos condujeron a lances. Se descubrió una diferenciamáxima de 28% en el porcentaje de avistamientos que condujo a un lance, entre los avistamien-tos por helicóptero y por prismáticos en 2000. Además, los avistamientos por helicóptero suelenser de manadas más grandes que los avistamientos por prismáticos o por radar. El tamañomedio de la manada está correlacionado con el tonelaje de atún aleta amarilla capturado porlance, lo cual sugiere la posibilidad de una probabilidad menor de que las manadas de delfinesno asociadas con atunes detectadas desde el helicóptero sean reportadas al observador que lasque se detecten con prismáticos o radar. La tendencia ascendente en el porcentaje de avis-tamientos realizados por helicóptero y radar, combinada con la diferencia en avistamientos noreportados, producirá estimaciones sesgadas si los índices de los distintos métodos de búsquedano son comparables.
A fin de explorar el efecto de cambios en la proporción relativa de avistamientos cerca dela línea de derrota sobre la abundancia estimada de los delfines manchados de altamar noro-rientales y los delfines tornillo oriental, se modificaron métodos previamente publicados ajus-tando un modelo half-normal, en lugar de un modelo de tasa de riesgo, a los datos de distanciaperpendicular. El modelo de tasa de riesgo es más flexible, y puede por lo tanto modelar el picoen los avistamientos cerca de la línea de derrota, característica no deseable si el exceso de avis-tamientos resulta de un proceso espurio. El modelo half-normal es más robusto a altas propor-ciones de detecciones cerca de la línea de derrota, y por lo tanto una comparación de lasestimaciones de abundancia relativa obtenida de los dos modelos brinda una forma de evaluarla influencia del exceso de avistamientos cerca de la línea de derrota sobre las tendencias. Seexcluyó también de los procedimientos de estimación la redistribución (smearing) de los datosde avistamiento usados para reducir los picos que resultan del redondeo de los ángulos a fin deevitar una redistribución arbitraria de los avistamientos excesivos cerca de la línea de derrotaen intervalos de distancia perpendicular donde no pertenezcan.
En un análisis separado, se exploró el efecto de cambios en el equipo de búsqueda pre-dominante y en el porcentaje de avistamientos no reportados para los delfines manchados de al-tamar nororientales mediante una estratificación de los datos de avistamientos por categoría deequipo a bordo del buque. Se usaron cuatro categorías: (1) sin helicóptero ni radar a bordo, (2)con helicóptero, pero sin radar, (3) sin helicóptero, pero con radar, y (4) con helicóptero y radar.Se calcularon estimaciones de abundancia relativa para cada categoría, y se compararon las ten-dencias en las estimaciones.
A partir de una comparación de las estimaciones de abundancia relativa basadas en elmodelo de tasa de riesgo y aquéllas basadas en el modelo half-normal, parece que la tendenciadescendente general en la abundancia relativa desde 1977 hasta aproximadamente 1992depende al menos parcialmente de cómo se trata el pico en la distribución de las distancias per-pendiculares cerca de la línea de derrota (Tabla 16; Figura 21). Si el pico es espurio, entoncesgran parte de la tendencia descendente durante este período podría también ser espuria. Porejemplo, el promedio de 1989-1991 de las estimaciones de abundancia relativa del delfín man-chado de altamar nororiental basadas en el modelo de tasa de riesgo presenta una disminuciónde 17% con respecto al promedio de 1977-1979, mientras que las estimaciones comparablesbasadas en el modelo half-normal presentan una disminución de tan sólo 6%. Se observó unefecto similar, pero menor, para el delfín tornillo oriental (Tabla 16).
Se observaron ciertas diferencias en los índices de abundancia relativa por modalidad debúsqueda. Las estimaciones para el delfín manchado de altamar nororiental basadas en datostomados a bordo de buques sin helicóptero ni radar señalan una disminución en el índice desdefines de los años 1970 hasta principios de los 1980, y un aumento a partir de mediados de los
INFORME ANUAL 2000 153
1980. No obstante, debido al alto grado de variabilidad en las estimaciones, no hay evidenciaclara de un patrón a largo plazo entre 1977 y 1990 (Figura 22). Las estimaciones basadas endatos tomados en buques con helicóptero pero sin radar fueron generalmente menos variablesdurante el mismo período, y el índice aumenta generalmente entre 1980 y 1990 (Figura 22).Pese al alto grado de variabilidad, ambas modalidades de búsqueda sugieren un incremento enel índice a mediados de los años 1980. Durante la última década, las estimaciones basadas endatos de viajes por buques con radar pero sin helicóptero, y con helicóptero y radar, presentantendencias descendentes, aunque la tasa de disminución varía por modalidad de búsqueda(Figura 22). El índice basado en datos de buques con radar pero sin helicóptero presenta unatendencia descendente a partir de principios de la década de los 1990. Por otro lado, el índicebasado en datos de buques con radar y helicóptero no comenzó a disminuir hasta fines de losaños 1990, debido quizá a El Niño de 1997-1998; ocurrió una disminución similar en 1983,cuando hubo otro evento fuerte de El Niño (Tabla 16, Figura 21).
Una comparación de las estimaciones del ancho efectivo de la banda de transecto (el an-cho sobre el cual se hubieran detectado todos los animales si la detección fuese siempre cierta)y la tasa de encuentro para modalidades de búsqueda con y sin helicóptero demostró patronesconsistentes con un nivel incrementado del porcentaje de avistamientos no reportados con el usode un helicóptero. Las estimaciones del ancho efectivo de la banda para los buques conhelicóptero son generalmente mayores que las de los buques sin helicóptero. Sin embargo, lastasas de encuentro de los buques con helicóptero son generalmente menores que las de losbuques sin helicóptero. A falta de cambios en la abundancia real, este patrón sería consistentecon un nivel incrementado del porcentaje no reportado de avistamientos en buques conhelicóptero en comparación con los buques sin helicóptero. (La metodología actual incluye elsupuesto que la detección en la línea de derrota es segura.) Esto es también consistente con elhecho que un mayor porcentaje de avistamientos reportados desde el helicóptero condujo alances.
A fin de cuantificar los efectos de cambios en la calidad de los datos y los avistamientosno reportados en la última década sobre el índice correspondiente al delfín manchado norori-ental de altamar, se calculó un índice medio ponderado a partir de los índices de modalidadesde búsqueda. Se excluyó el índice basado en datos de buques con radar pero sin helicóptero,porque los datos parecen demostrar una tendencia temporal en los sesgos como resultado deavistamientos no reportados, combinada con cambios en las estrategias de pesca. Se excluyerontambién los datos anteriores a 1984 a raíz de problemas relacionados con los avistamientos noreportados, y la probabilidad de mala calidad de los datos. Se supuso que la diferencia mediaentre los otros índices refleja principalmente los avistamientos no reportados, y se puede por lotanto ajustar hacia arriba los índices para los buques con helicóptero por un factor que corrigeel efecto del nivel adicional de avistamientos no reportados que probablemente ocurre con el usode un helicóptero. Se calculó entonces un índice medio ponderado (Tabla 16) en la forma de unpromedio ponderado de los índices para las tres modalidades de búsqueda, con ponderacionesiguales a la inversa del coeficiente de variación cuadrado. Una comparación del índice medioponderado con el índice previamente publicado señala que la mayoría de la reducción en elíndice previamente publicado entre fines de los años 1980 y principios de los 1990, y mediadosde los 1990, podría ser atribuible a la elección de función de detección (tasa de riesgo versus half-normal) y la presencia de distintos niveles de avistamientos no reportados, combinadas con cam-bios en las estrategias de pesca por parte de la flota. Por ejemplo, el promedio de lasestimaciones previamente publicadas para 1993-1997 señala una disminución de 20% conrespecto al promedio para 1987-1991. Por contraste, el promedio de las estimaciones del índice
154 COMISION DEL ATUN

medio ponderado para 1993-1997 señala una disminución de 4% con respecto a 1981-1991(Tabla 16).
Estos resultados preliminares sugieren que un porcentaje importante de la tendencia des-cendente a largo plazo previamente publicada en el índice de abundancia relativa para el delfínmanchado nororiental se debe probablemente a cambios en la calidad de los datos, las estrate-gias de pesca, y los niveles de avistamientos no reportados. De hecho, el índice medio ponderadopara el delfín manchado nororiental ha permanecido relativamente constante desde aproxima-damente 1985 hasta 1997. La disminución continua del índice hasta 2000 da lugar a preguntasacerca de los efectos de cambios en el clima oceánico sobre stocks geográficamente definidos ylos efectos de cambios continuos en los sesgos por avistamientos no reportados; ambos temasserán estudiados en el futuro. Es por supuesto posible que existan otras tendencias no detec-tadas en los sesgos en los datos de los años más recientes que podrían llevar a problemas simi-lares a aquéllos detectados en este estudio. Se continuarán los análisis de estos temas.
Tendencias en la abundancia absoluta
Idealmente, se usarían todos los datos disponibles para determinar si las poblaciones dedelfines se están recuperando de las mortalidades elevadas de años anteriores. Se combinaríanlos datos de los científicos en buques de investigación y de los observadores en buques atunerospara incrementar al máximo la información disponible. No obstante, dadas las dificultadesantes comentadas con respecto al uso de los datos de los observadores en buques atuneros paraestimar los cambios en la abundancia de los delfines a lo largo de los años, el personal de laCIAT cree que no se comprenden del todo ni se eliminan estos sesgos. Sin embargo, los estudiosdiseñados sobre una base científica realizados por el NMFS no deberían padecer estos prob-lemas.
El personal de la CIAT estimó previamente las tasas de crecimiento de las poblaciones dedelfines tornillo oriental y manchado nororiental ajustando un sencillo modelo exponencial depoblación a los datos correspondientes a 1979-1998 de los estudios de mamíferos marinos real-izados por el NMFS de EE.UU. (Informe Anual de la CIAT de 1999). Se actualizó este análisissumando las estimaciones preliminares de los estudios de NMFS de 1999.
Se expresa el modelo de población como
N(t+1) = exp(r(t)) [N(t)-C(t)]
donde N(t) es la abundancia de la población en el año t, r(t) es la tasa de crecimiento de la po-blación en el año t, y C(t) es la mortalidad de delfines en la pesquería cerquera en el año t esti-mada por la CIAT. Se supone que la relación entre la estimación de abundancia de delfinesestimada a partir de los cruceros de investigación y la abundancia real es:
x(t) = ln[N(t)] + e(t) + d(t)
donde x(t) es la transformación logarítmica de la estimación de abundancia de los cruceros deinvestigación en el año t, e(t) es el error de medición del estudio caracterizado por la varianza dela muestra reportada por NMFS, y d(t) es un error adicional no reportado del estudio (denomina-do “error de proceso”) debido a causas aparte de la varianza de la muestra. Se supone que elprimer término de error e(t) está distribuido normalmente con una desviación estándar igual alcoeficiente de variación de la muestra del estudio reportado por NMFS. Se supone que el segun-do término de error d(t) está distribuido normalmente con una varianza desconocida V, un pará-metro adicional por estimar. Se aplicó un procedimiento bayesiano de estimación estadística, el
INFORME ANUAL 2000 155

algoritmo MCMC, para calcular intervalos posteriores de probabilidad para la tasa neta de cre-cimiento de la población y abundancia anual. Se supuso que las distribuciones previas eran uni-formes sobre r(t), ln[N(1979)], y ln(V) debido a la estructura casi lineal del problema contransformación logarítmica. Se seleccionaron los límites de las distribuciones uniformes muyafuera de la densidad apreciable de la función de verosimilitud.
Se ajustó el modelo de poblaciones antes descrito bajo el supuesto que la tasa de creci-miento fue constante durante 1979-1999. Las tasas de crecimiento de los delfines manchado no-roriental (3,2% + 3,1%) y tornillo oriental (3,7% + 2,4%) son casi iguales (Figuras 23a y 23b). Lavarianza de muestreo para el delfín tornillo oriental explica casi toda la varianza alrededor dela línea ajustada, por lo que no hay ninguna necesidad de un componente adicional de varianza,a diferencia del delfín manchado nororiental. Se expresa la tasa de crecimiento neta cumulativadurante 1979-1999 como ln[N(1999)/N(1979)]. Los resultados indican que la probabilidad quela población haya crecido durante esos años es más de 65% para el delfín manchado nororientaly más de 85% para el delfín tornillo oriental (Figuras 24a y 24b). Este modelo indica que la po-blación ha crecido entre 1979 y 1999 de unos 633.000 a 813.000 en el caso del delfín manchadonororiental y de unos 435.000 a 745.000 en el caso de delfín tornillo oriental.
PROGRAMA DE ARTES DE PESCA
El programa de artes de pesca de la CIAT busca formas de reducir al mínimo o eliminarla mortalidad de delfines durante las faenas de pesca.
ALINEACIONES DEL PAÑO DE PROTECCIÓN DE DELFINES
Durante 2000 el personal de la CIAT realizó alineaciones del paño de protección de del-fines y revisiones del equipo de protección de delfines en 29 buques, 27 de México, 1 de Ecua-dor, y 1 de Estados Unidos. Para verificar la alineación del paño de protección se realiza unlance de prueba, durante el cual un técnico de la CIAT observa el funcionamiento de la reddurante el retroceso desde una balsa inflable. El técnico transmite sus observaciones, comen-tarios, y sugerencias al capitán del buque por radio, y se procura resolver cualquier problemaque surja. Posteriormente, se prepara un informe para el armador o administrador del buque,en el cual se resumen los comentarios del técnico de la CIAT y, en caso necesario, las recomen-daciones para mejorar el equipo de protección de delfines del buque y/o la forma de usarlo.
ENTRENAMIENTO Y CERTIFICACIÓN DE CAPITANES DE PESCALa CIAT realiza desde 1980 seminarios para los pescadores sobre la reducción de morta-
lidad de delfines. En el Artículo V del Acuerdo sobre el Programa Internacional para la Conser-vación de los Delfines (APICD) se contempla el establecimiento, en el marco de la CIAT, de unsistema de entrenamiento técnico y certificación para los capitanes de pesca. Bajo este sistema,el personal de la CIAT es responsable de preparar y mantener una lista de todos los capitanescalificados para pescar sobre delfines en el Océano Pacífico oriental. Los nombres de los capi-tanes que satisfacen los requerimientos son proporcionados al Panel Internacional de Revisiónpara aprobación y circulación a las Partes del APICD.
Los requerimientos para capitanes nuevos incluyen (1) asistencia a un seminario de en-trenamiento organizado por el personal científico de la CIAT, o por el programa nacional com-petente en coordinación con dicho personal, (2) participación en un lance de prueba que incluyaobservaciones directas del canal de retroceso, y (3) un componente de entrenamiento práctico, elcual consiste en un viaje durante el cual se tiene la intención de pescar atún asociado con delfi-
156 COMISION DEL ATUN

nes a bordo de un buque con Límite de Mortalidad de Delfines, acompañado por un capitán cali-ficado o un asesor técnico aprobado. Estos cursos están ideados no solamente para los capitanesde pesca, directamente encargados de las faenas de pesca, sino también para otros tripulantesy para el personal administrativo responsable del equipo y mantenimiento de los buques. Sepresentan certificados de asistencia a todos los que asisten a los cursos. No tuvo lugar ningúncurso de este tipo durante 2000.
OTROS SERVICIOSLa CIAT brinda además otros servicios para ayudar a los gobiernos, gerentes de flota, y
operadores de buques individuales a reducir la mortalidad de delfines. En las oficinasregionales de la CIAT se pueden obtener publicaciones y cintas de vídeo sobre el tema. A peti-ción se preparan Análisis de Crucero, informes detallados sobre viajes de pesca observados, quepermiten evaluar el desempeño de buques y capitanes.
MEDIDAS PARA LA CONSERVACION DEL ATUN
La CIAT tiene la responsabilidad de realizar estudios de la biología de los atunes y espe-cies afines que viven en el Océano Pacífico oriental (OPO) y del efecto de la pesca sobre losmismos, y de recomendar medidas de conservación apropiadas cuando sea necesario para permi-tir mantener los stocks de peces a niveles que permitan las capturas máximas sostenibles.
Los estados con jurisdicción sobre los buques son responsables de aplicar las medidas quese adopten.
ATUN ALETA AMARILLASe recomendó una cuota de captura para el aleta amarilla en el Area Reglamentaria de la
Comisión para el Aleta Amarilla (ARCAA; Figura 1) por primera vez en 1962, pero los gobier-nos miembros no se pusieron de acuerdo sobre una cuota hasta 1966. Se acordó una cuota cadaaño entre 1966 y 2000, con la excepción de 1987; no se recomendó una cuota para ese año por-que la abundancia de aleta amarilla parecía estar al nivel más alto de años recientes, debidoprincipalmente al reclutamiento excepcionalmente elevado de 1984 y 1985. Las cuotas fueronpuestas en vigor durante cada año del período de 1966-1979 y durante 1998-2000.
En la 66ª reunión de la CIAT (12 y 14-15 de junio de 2000), la Comisión acordó un re-glamento para restringir la captura de aleta amarilla en el ARCAA para 2000. Cuando la cap-tura alcanzase 240 mil toneladas se requeriría que los buques cerqueros y de carnada cesarande pescar en dos zonas, una frente al norte de México y la otra frente al norte de Sudamérica.El 1° de diciembre, o cuando la captura de aleta amarilla en el ARCAA alcanzase 265 miltoneladas, el que ocurriera primero, se requeriría que los buques cerqueros con observadores abordo cesaran de pescar en el ARCAA hasta el 1° de enero de 2001. Se requeriría que los buquessin observador a bordo que iniciasen viajes de pesca en diciembre de 2000 cesaran de pescaraleta amarilla en el ARCAA durante el resto de diciembre y posteriormente hasta que regre-sasen a puerto para descargar. En ambos casos se permitiría a los buques capturas incidentalesde aleta amarilla de hasta un máximo del 15% de sus descargas totales. (Las resoluciones de laCIAT, con detalles de los reglamentos, se encuentran en el sitio de internet de la CIAT,www.iattc.org.) Hubo una diferencia de opinión acerca de la interpretación de la resolución, y,ya que la captura de aleta amarilla en el ARCAA no alcanzó 240 mil toneladas, no todos losmiembros de la CIAT requirieron que sus buques limitasen la pesca de aleta amarilla en elARCAA.
INFORME ANUAL 2000 157

ATUN PATUDOEl aumento rápido en las capturas de patudo con artes de superficie a mediados de los
años 1990 es naturalmente motivo de inquietud. En el Informe Anual de la CIAT de 1997, pági-nas 220-221, se comentan los posibles efectos de la pesca cerquera sobre la palangrera. En elmomento de preparar dicho informe la información disponible, particularmente sobre las tasasde mortalidad natural, era insuficiente para permitir conclusiones definitivas. No obstante, enla 61ª reunión de la CIAT (10-12 de junio de 1998) se adoptó una resolución prohibiendo los lan-ces sobre atunes asociados con objetos flotantes durante 1998 una vez capturadas 45 mil tonela-das de patudo con artes de superficie en el OPO. La captura total de patudo por la pesquería desuperficie durante 1998 fue menos de 45 mil toneladas, y no se restringió la captura de la especieen ese año. Se aprobó una resolución similar para 1999, pero se redujo el límite de captura depatudo por artes de superficie a 40 mil toneladas. Las capturas de patudo fueron mayores en1999 que en 1998, y se requirió que los buques cesaran de pescar sobre objetos flotantes haciael fin del año.
En 2000, de conformidad con la resolución adoptada en la 66ª reunión de la CIAT (12 y14-15 de junio), se impuso una prohibición igual entre el 15 de septiembre y el 15 de diciembre.
CAPTURAS INCIDENTALESEn la 66ª reunión de la CIAT (12 y 14-15 de junio de 2000) se adoptó una resolución pa-
ra “instrumentar un programa piloto, comenzando el 1 de enero de 2001, de un año de duraciónque requiera que todo buque cerquero retenga a bordo y descargue todo atún patudo, barrilete,y aleta amarilla capturado, excepto pescado considerado no apto para consumo humano porrazones aparte de tamaño, a fin de desincentivar la captura de estos peces pequeños.”
EL PROGRAMA INTERNACIONAL PARA LA CONSERVACION DE LOS DELFINESEn 2000 los gobiernos u organizaciones regionales de integración económica que habían
ratificado o aplicaban provisionalmente el Acuerdo sobre el Programa Internacional para laConservación de los Delfines (APICD) eran Colombia, Costa Rica, Ecuador, El Salvador, EstadosUnidos, Honduras, México, Nicaragua, Panamá, Perú, la Unión Europea, Vanuatu, y Venezuela.La CIAT proporciona el Secretariado para el PICD.
El límite de mortalidad de delfines (LMD) general establecido para la flota internacionalen 2000 fue de 5.000 animales, y la porción no reservada de 4.900 fue asignada a 109 buquesque solicitaron LMD y estaban calificados para recibirlo. El LMD promedio (LMDP) por buquefue 44,55. Se les asignó LMD individuales de 40 animales cada uno a 125 buques. De estos 109,24 no utilizaron su LMD antes del 1º de abril; 11 lo perdieron, pero a los demás se les permitióconservarlos durante el resto del año debido a circunstancias atenuantes. Siete buques fueronasignados LMD de segundo semestre de 14 animales cada uno, pero ninguno lo utilizó. En laFigura 25 se ilustra la distribución de la mortalidad causada en 2000 por buques con LMD deaño completo. Se estima la mortalidad total de delfines ocasionada por la pesca en 2000 en 1.636animales.
SISTEMA DE SEGUIMIENTO Y VERIFICACIÓN DE ATÚNEn el Artículo V(1)f del APICD se dispone que se establezca un sistema de seguimiento y
verificación de atún capturado con y sin mortalidad o heridas graves de delfines. Las Partes delAPICD elaboraron un sistema general y un registro de seguimiento de atún (RSA) que los obser-vadores de los programas de la CIAT y nacionales completarían en el mar. Hay dos versiones
158 COMISION DEL ATUN

del RSA, idénticas aparte del encabezado; en el Formulario “A” se documenta atún capturado enlances sin mortalidad ni heridas graves de delfines (“dolphin safe”), y en el Formulario “B” atúncapturado en lances con mortalidad o heridas graves de delfines (“no dolphin safe”). ElSecretariado es responsable de producir los RSA que usarán en toda el Area de Acuerdo todaslas Partes. Cada Parte asigna a una autoridad nacional la responsabilidad de instrumentar yoperar el programa, y de remitir al Secretariado un informe detallando el programa establecidobajo su legislación y reglamento nacionales. Dichos programas deben incluir auditorías per-iódicas y revisiones para productos atuneros capturados, descargados y procesados, mecanismospara comunicación y cooperación entre autoridades nacionales, y acceso oportuno a datos perti-nentes. El sistema entró en función en 2000, y se completaron RSA para todos los viajes obser-vados de buques de Partes iniciados durante el año en los que se capturó atún.
INFORMES DESDE EL MAR POR LOS OBSERVADORESEl APICD dispone que las Partes “establecerán un sistema, basado en los informes de los
observadores en tiempo real, para asegurar la aplicación y cumplimiento efectivos de los límitesanuales de mortalidad por población de delfines.” Dicho sistema fue ejecutado mediante el re-querimiento que los observadores a bordo de buques atuneros de cerco con LMD enviasen in-formes semanales por correo electrónico, fax, o radio. El porcentaje de informes recibidos fuedecepcionante, debido en parte a la falta del equipo necesario. El efecto práctico de esta situa-ción fue poco importante, ya que la mortalidad de delfines fue muy inferior a los Límites deMortalidad por Stock (LMS).
PUBLICACIONESLa publicación pronta y completa de los resultados de la investigación es uno de los ele-
mentos más importantes del programa científico de la CIAT. Por este medio los gobiernos miem-bros, la comunidad científica, y el público en general se mantienen informados de los resultadosde las investigaciones realizadas por los científicos de la CIAT. La publicación de datos básicos,métodos de análisis, y las conclusiones resultantes permiten que otros investigadores evalúen ycritiquen los estudios, lo que sirve para verificar la validez de los resultados obtenidos por el per-sonal de la CIAT y despertar el interés de otros investigadores en su labor. Al fin de 2000 el per-sonal de la CIAT había publicado 145 boletines, 49 Informes Anuales, 11 Informes Especiales,10 Informes de Datos, 9 libros, y 507 capítulos, trabajos, y artículos en libros y revistas externas.En el Anexo 3 del presente informe se detallan las contribuciones del equipo de investigadorespublicadas durante 2000.
SITIO DE INTERNETLa CIAT mantiene un sitio de internet (www.iattc.org), en español e inglés, a través del
cual el público tiene acceso a información actual sobre las actividades de la Comisión. El sitioincluye, entre otros, documentos relacionados con la CIAT y el Acuerdo sobre el Programa In-ternacional para la Conservación de los Delfines (APICD), una lista de los países miembros y losComisionados de la CIAT, una lista del personal de la CIAT, detalles de reuniones recientes yfuturas de la CIAT y el APICD y sus grupos de trabajo respectivos, los documentos, agendas, yactas o informes de reuniones recientes de las mismas, las agendas provisionales de reunionesfuturas, resoluciones recientes de la CIAT y el APICD, estadísticas pertinentes de las pesqueríasatuneras en el Océano Pacífico oriental, información actualizada sobre medidas para la conser-vación del recurso atunero, Informes Trimestrales recientes de la CIAT, e información sobre laspublicaciones de la CIAT.
INFORME ANUAL 2000 159

APPENDIX 1−−ANEXO 1STAFF−−PERSONAL
HEADQUARTERS−−SEDEDIRECTOR
Robin Allen, Ph.D. (University of British Columbia)
SCIENTIFIC AND TECHNICAL−−CIENTIFICO Y TECNICOChief Scientists−−Científicos Dirigentes
Tuna-Billfish Program−−Programa Atún-PicudoRichard B. Deriso, Ph.D. (University of Washington)
Tuna-Dolphin Program−−Programa Atún-DelfínMartín A. Hall, Ph.D. (University of Washington)
Senior−−Principales
Fishery biology−−Biología pesqueraPablo R. Arenas, Ph.D. (University of Washington)
(from January 15−a partir del 15 de enero)William H. Bayliff, Ph.D. (University of Washington)David A. Bratten, B.S. (San Diego State University)Michael G. Hinton, Ph.D. (University of California at San Diego)Witold L. Klawe (emeritus), M.S. (University of Toronto)Cleridy E. Lennert-Cody, Ph.D. (University of California at San Diego)Daniel Margulies, Ph.D. (University of Maryland)Mark N. Maunder, Ph.D. (University of Washington)Ashley J. Mullen, Ph.D. (University of London)Robert J. Olson, Ph.D. (University of Wisconsin)Kurt M. Schaefer, M.S. (San Diego State University)Michael D. Scott, Ph.D. (University of California at Los Angeles)Patrick K. Tomlinson, B.S. (Humboldt State University)George M. Watters, Ph.D. (University of California at San Diego)
Fishery management−−Ordenación de pesqueríasBrian S. Hallman, M.A. (Johns Hopkins University)
Associate−−Asociados
Fishery biology−−Biología pesqueraErnesto Altamirano Nieto, B.S. (Universidad Autónoma de Baja California)Edward H. Everett, B.A. (San Jose State University)Richard J. Lindsay, B.S. (Long Island University) (to June 15−hasta el 15 de junio)Jenny M. Suter, B.S. (University of California at Davis)Jeanne B. Wexler, B.S. (Humboldt State University)
160 TUNA COMMISSION

Computer systems and data base management−−Administración de sistemas de cómputo y de bases de datos
Milton F. López, B.S. (University of Rhode Island)Robert E. Sarazen, B.S. (California State University, Long Beach)Nickolas W. Vogel, B.A. (University of California at Santa Barbara)
Assistant−−Auxiliares
Fishery biology−−Biología pesqueraDaniel W. Fuller, B.S. (San Diego State University)
(from January 3−a partir del 3 de enero)Jorge B. Párraga Fernandez, Biól. (Universidad de Guayaquil)
(from August 21−a partir del 21 de agosto)Lesly J. Rodríguez, Lic. (Universidad Nacional Autónoma de Nicaragua)Marlon H. Román Verdesoto, Biól. (Universidad de Guayaquil)Enrique Ureña Portales, B.S. (Universidad Autónoma de Baja California)
Fishery management−−Ordenación de pesquerías Marcela Campa Acedo, LL.M. (American University)
(to December 8−hasta el 8 de diciembre)
Technical support−−Apoyo técnicoSharon A. BookerJoanne E. BosterLaura J. BowlingNancy L. HaltofSharon L. Hunt, B.S. (San Francisco State University)
(from February 22−a partir del 22 de febrero) Robert B. Kwan (from June 19−a partir del 19 de junio)JoyDeLee C. Marrow, B.A. (University of California at San Diego)Christine A. Montez, A.A. (Platt College of San Diego)
(from May 1−a partir del 1 de mayo)Mildred D. De los Reyes
ADMINISTRATIVE−−ADMINISTRATIVO
Secretarial−−SecretaríaMónica B. Galván (from October 1−a partir del 1 de octubre)Martha L. Gómez, B.A. (Universidad de los Andes)
(from January 18−a partir del 18 de enero)Berta N. JuárezMaría Teresa Musano (to February 25−hasta 25 de febrero)
Accounting−−ContabilidadDaniel R. Lilly, B.S. (Marquette University)María Teresa Musano (from August 16−a partir de 16 de agosto)Nora Roa-Wade, B.S. (San Diego State University)
ANNUAL REPORT 2000 161

FIELD OFFICES−−OFICINAS REGIONALES
LAS PLAYAS, ECUADOR
Fishery biology−−Biología pesqueraJorge B. Párraga Fernandez, Biól. (Universidad de Guayaquil)
(in charge from January 18 to July 31−encargado del 18 de enero al 31 de julio)William E. Paladines, Biól. (Universidad de Guayaquil)
(in charge from August 1−encargado a partir del 1 de agosto)Aldo X. Basantes Cuesta, Biól. (Universidad de Guayaquil)
(from August 15−a partir del 15 de agosto)William E. Paladines, Biól. (Universidad de Guayaquil)
(from January 18 to July 31−del 18 de enero al 31 de julio)Felix F. Cruz Vargas, Biol. (Universidad de Guayaquil)
(from May 3−a partir del 3 de mayo)
MANTA, ECUADOR
Fishery biology−−Biología pesqueraErick D. Largacha Delgado, Biól. (Universidad de Guayaquil) (in charge−encargado)Aldo X. Basantes Cuesta, Biól. (Universidad de Guayaquil)
(to August 14−hasta el 14 de agosto)Carlos de la A. Florencia, Biól. (Universidad de Guayaquil)Kruger I. Loor Santana, Biól. (Universidad de Guayaquil)Jorge B. Párraga Fernandez, Biól. (Universidad de Guayaquil)
(to January 17−hasta el 17 de enero)
ENSENADA, MEXICO
Fishery biology−−Biología pesqueraEric E. Pedersen, B.S. (Humboldt State University) (in charge−encargado)José M. Lutt Manríquez, B.S. (Universidad Autónoma de Baja California)Alberto Morales Yañez, B.S. (Universidad Autónoma de Baja California)
MAZATLAN, MEXICO
Fishery biology−−Biología pesqueraHector J. Pérez Bojórquez, B.S. (Universidad Autónoma de Sinaloa)
(in charge−encargado)Victor M. Fuentes, B.S. (Universidad Autónoma de Sinaloa)César Maldonado González, B.S. (Universidad Autónoma de Sinaloa)
ACHOTINES, PANAMA
Fishery biology−−Biologia pesqueraVernon P. Scholey, M.S. (University of Washington) (in charge−encargado)Neil A. Bonilla Gaitán, B.S. (Universidad Nacional de Panamá)Luis C. Tejada, B.S. (Universidad Autónoma de Baja California)
162 TUNA COMMISSION

Technical support−−Apoyo técnicoJesús M. Budria García (to November 13−hasta el 13 de noviembre)
PANAMA, PANAMA
Fishery biology−−Biologia pesqueraAndris Purmalis, B.S. (University of Michigan) (in charge−encargado)Julio C. Guevara Quintana, Lic. (Universidad Nacional de Panamá)Ricardo A. López Rodríguez, Lic. (Universidad Nacional de Panamá)
(from October 1−a partir del 1 de octubre)
MAYAGUEZ, PUERTO RICO, USAJuan A. Gracia, J.D. (Universidad Católica de Puerto Rico)
CUMANA, VENEZUELA
Fishery biology−−Biologia pesqueraArmando E. Carrasco Arévalo, B.S. (University of West Florida) (in charge−encargado)Emilio R. Cedeño Pérez, Lic. (Universidad de Oriente)
VISITING SCIENTISTS AND STUDENTS−−CIENTIFICOS Y ESTUDIANTESEN VISITA
HEADQUARTERS−−SEDEDr. Hiroaki Okamoto, National Research Institute of Far Seas Fisheries
(February 1-December 31)Dr. Yukio Takeuchi, National Research Institute of Far Seas Fisheries
(September 5-December 31)ACHOTINES LABORATORY−−LABORATORIO DE ACHOTINES
Mr. Akio Nakazawa, Overseas Fishery Cooperation Foundation, Tokyo, Japan (January 1-March 15)
Mr. Yukiyasu Niwa, Overseas Fishery Cooperation Foundation, Tokyo, Japan (January 1-December 31)
Mr. Masahiko Koiso, Japan Sea Farming Association, Amami, Japan (November 2-December 8)
ANNUAL REPORT 2000 163

APPE
NDIX
2−− A
NEXO
2
FINA
NCIA
L ST
ATEM
ENT−−
DECL
ARAC
ION
FINA
NCIE
RA
INTE
R-AM
ERIC
AN T
ROPI
CAL
TUNA
COM
MIS
SION
−− COM
ISIO
N IN
TERA
MER
ICAN
A DE
L AT
UN T
ROPI
CAL
Stat
emen
t of a
sset
s, lia
bilit
ies,
and
fund
bal
ance
s, Se
ptem
ber 3
0, 20
00−−
Decl
arac
ión
de a
ctiv
o, p
asiv
o, y
bal
ance
s de
los f
ondo
s, 30
de
sept
iem
bre
de 2
000
Asse
ts−− A
ctiv
o
Curre
nt as
sets−
Activ
o circ
ulan
teCa
sh an
d cas
h eq
uiva
lents−
Efec
tivo y
equi
valen
tes$ 1
,583,2
86Ac
coun
ts re
ceiva
ble−C
uent
as po
r cob
rar
29,38
6Em
ploye
e adv
ance
s−An
ticipo
s a lo
s emp
leado
s18
3,233
Depo
sits a
nd pr
epaid
expe
nses
−Dep
ósito
s y ga
stos p
agad
os po
r ade
lanto
11,84
2
Tota
l cur
rent
asse
ts−Ac
tivo t
otal c
ircul
ante
1,807
,747
Inve
stmen
ts (m
arke
t valu
e of $
123,4
97 as
of S
eptem
ber 3
0, 20
00)−I
nver
sione
s (va
lor co
merci
al $1
23.49
7 al 3
0 de s
eptie
mbre
de 20
00)
30,00
0Re
al pr
oper
ty−B
ienes
raíce
s40
0,775
$ 2,23
8,522
Liab
ilitie
s and
fund
bal
ance
s−−Pa
sivo
y ba
lanc
es d
e lo
s fon
dos
Curre
nt li
abili
ties (
accru
ed ex
pens
es an
d oth
er li
abili
ties)−
Pasiv
o circ
ulan
te (co
stos a
cumu
lados
y otr
os pa
sivos
)$ 3
66,65
8
Fund
balan
ces−
Balan
ces d
e los
fond
osGe
nera
l fun
d−Fo
ndo g
ener
al1,4
71,08
9Re
al pr
oper
ty fu
nd−F
ondo
bien
es ra
íces
400,7
75
Tota
l fun
d bala
nces
-Bala
nces
tota
les de
los f
ondo
s1,8
71,86
4$ 2
,238,5
22
164 TUNA COMMISSION

INTE
R-AM
ERIC
AN T
ROPI
CAL
TUNA
COM
MIS
SION
−− COM
ISIO
N IN
TERA
MER
ICAN
A DE
L AT
UN T
ROPI
CAL
Stat
emen
ts o
f rev
enue
s and
exp
ense
s for
the
fisca
l yea
r end
ed S
epte
mbe
r 30,
2000
−−De
clar
ació
n de
ingr
esos
y g
asto
s cor
resp
ondi
ente
al a
ño fi
scal
fina
lizad
o el
30
de se
ptie
mbr
e de
200
0
Reve
nue−
Ingr
esos
Gove
rnme
nt co
ntrib
ution
s for
join
t exp
endit
ures
−Con
tribu
cione
s de l
os go
biern
os a
los ga
stos c
ombin
ados
Unite
d Sta
tes of
Ame
rica−
Esta
dos U
nido
s de A
méric
a2,8
53,55
4M
exico
−Méx
ico1,0
00,00
0Ja
pan−
Japó
n29
8,272
Ecua
dor
150,0
00Co
sta R
ica63
,634
Fran
ce−F
ranc
ia24
,219
El S
alvad
or1,0
74Ni
cara
gua
574
Pana
ma−P
anam
á57
4Va
nuat
u57
4To
tal g
over
nmen
t con
tribu
tions
−Tota
l de c
ontri
bucio
nes p
or lo
s gob
ierno
s4,3
92,47
5
Cont
ract
reve
nue−
Ingr
esos
por c
ontra
toTo
nnag
e ass
essm
ents−
Apor
tes po
r ton
elaje
1,497
,891
Othe
r misc
ellan
eous
cont
ract
reve
nue−
Otro
s ing
reso
s misc
eláne
os po
r con
trato
0To
tal c
ontra
ct re
venu
e−In
gres
os to
tales
por c
ontra
to1,4
97,89
1
Inter
est i
ncom
e−In
gres
os po
r int
eres
es95
,980
Othe
r rev
enue
−Otro
s ing
reso
s16
,653
Tota
l rev
enue
s−In
gres
os to
tales
6,002
,999
ANNUAL REPORT 2000 165

INTE
R-AM
ERIC
AN T
ROPI
CAL
TUNA
COM
MIS
SION
−− COM
ISIO
N IN
TERA
MER
ICAN
A DE
L AT
UN T
ROPI
CAL
Stat
emen
ts o
f rev
enue
s and
exp
ense
s for
the
fisca
l yea
r end
ed S
epte
mbe
r 30,
2000
−−De
clar
ació
n de
ingr
esos
y g
asto
s cor
resp
ondi
ente
al a
ño fi
scal
fina
lizad
o el
30
de se
ptie
mbr
e De
200
0(c
ontin
ued−−
cont
inua
cíon
)
Expe
nditu
res−
Gasto
sSa
laries
−Sue
ldos
2,718
,764
Obse
rver
costs
−Gas
tos pa
ra lo
s obs
erva
dore
s1,2
78,84
9M
ater
ials a
nd su
pplie
s−M
ater
iales
y su
mini
stros
1,050
,729
Cont
ract
expe
nditu
res−
Gasto
s par
a los
cont
ratos
649,4
19Em
ploye
e ben
efits−
Bene
ficios
labo
rales
512,8
83Tr
avel−
Viaje
s42
6,398
Utili
ties−
Serv
icios
públi
cos
115,0
79Pr
intin
g and
posta
ge−I
mpre
nta y
fran
queo
61,19
0In
sura
nce−
Segu
ros
34,95
3Le
gal a
nd pr
ofess
ional−
Lega
les y
profe
siona
les27
,317
Misc
ellan
eous
−Misc
eláne
os21
,813
Tota
l exp
endit
ures
−Gas
tos to
tales
6,8
97,39
4
Exce
ss of
expe
nditu
res o
ver r
even
ue−E
xces
o de g
astos
sobr
e ing
reso
s$ (
894,3
95)
166 TUNA COMMISSION

INTE
R-AM
ERIC
AN T
ROPI
CAL
TUNA
COM
MIS
SION
−− COM
ISIO
N IN
TERA
MER
ICAN
A DE
L AT
UN T
ROPI
CAL
Stat
emen
ts o
f cha
nges
in fu
nd b
alan
ces f
or th
e fis
cal y
ear e
nded
Sep
tem
ber 3
0, 20
00−−
Decl
arac
ión
de ca
mbi
os e
n el
bal
ance
de
los f
ondo
s cor
resp
ondi
ente
al
año
fisca
l fin
aliz
ado
el 3
0 de
sept
iem
bre
de 2
000
Gene
ral f
und
Real
pro
pert
y fu
ndFo
ndo
gene
ral
Fond
o pr
opri
edad
raíz
Tota
l
Balan
ce at
Sep
tembe
r 30,
1998
Balan
ce al
30 de
sept
iembr
e de 1
998
1,533
,468
210,7
751,7
74,24
3
Exce
ss of
reve
nue o
ver e
xpen
ditur
eEx
ceso
de in
gres
os so
bre g
astos
1,022
,016
----
1,022
,016
Tran
sfer o
f fun
ds fo
r pur
chas
e of r
eal p
rope
rtyTr
ansfe
renc
ia de
fond
os pa
ra la
comp
ra de
bien
es ra
íces
(190,0
00)
190,0
00---
-
Balan
ce at
Sep
tembe
r 30,
1999
Balan
ce al
30 de
sept
iembr
e de 1
999
2,365
,484
400,7
752,7
66,25
9
Exce
ss of
expe
nditu
re ov
er re
venu
eEx
ceso
de ga
stos s
obre
ingr
esos
sobr
e(89
4,395
)---
-(89
4,395
)
Balan
ce at
Sep
tembe
r 30,
2000
Balan
ce al
30 de
sept
iembr
e de 2
000
1,471
,089
400,7
751,8
71,86
4
ANNUAL REPORT 2000 167

INTE
R-AM
ERIC
AN T
ROPI
CAL
TUNA
COM
MIS
SION
−− COM
ISIO
N IN
TERA
MER
ICAN
A DE
L AT
UN T
ROPI
CAL
Stat
emen
t of c
ash
flows
for t
he fi
scal
yea
r end
ed S
epte
mbe
r 30,
2000
−−De
clar
ació
n de
fluj
os d
e fo
ndos
corr
espo
ndie
nte
al a
ño fi
scal
fina
lizad
o el
30
de se
ptie
mbr
e de
200
0
Cash
flow
s fro
m op
erat
ing a
ctivit
ies−F
lujos
de fo
ndos
de ac
tivida
des d
e ope
ració
n:Ex
cess
of ex
pend
iture
s ove
r rev
enue
−Exc
eso d
e gas
tos so
bre i
ngre
sos:
$ (89
4,395
)Ad
justm
ents
to re
conc
ile ex
cess
of ex
pend
iture
s ove
r rev
enue
to n
et ca
sh pr
ovide
d by o
pera
ting a
ctivit
ies−
Ajus
tes pa
ra re
conc
iliar
exce
so de
gasto
s sob
re in
gres
os co
n efe
ctivo
neto
prov
isto p
or ac
tivida
des d
e ope
ració
n:De
creas
e in
acco
unts
rece
ivable
−Red
ucció
n en
cuen
tas p
or co
brar
95,14
8 In
creas
e in
emplo
yee a
dvan
ces−
Aume
nto e
n an
ticipo
s a lo
s emp
leado
s(44
,280)
Incre
ase i
n de
posit
s and
prep
aid ex
pens
es−A
umen
to en
depó
sitos
y ga
stos p
agad
os po
r ade
lanta
do(10
,639)
Incre
ase i
n ac
crued
expe
nses
and o
ther
liab
ilitie
s−Au
ment
o en
gasto
s acu
mulad
os y
otro p
asivo
28,97
8Ne
t cas
h us
ed in
oper
atin
g acti
vities
−Efec
tivo n
eto u
sado
en ac
tivida
des o
pera
ciona
les(82
5,188
)
Cash
flow
s fro
m in
vesti
ng ac
tiviti
es−p
urch
ase o
f rea
l pro
perty
−Flu
jos de
fond
os de
activ
idade
s de i
nver
sión-
comp
ra de
bien
es ra
íces
---
Decre
ase i
n ca
sh an
d cas
h eq
uiva
lents−
Redu
cción
en ef
ectiv
o y eq
uiva
lentes
(825,1
88)
Cash
and c
ash
equi
valen
ts at
begin
ning
of ye
ar−E
fectiv
o y eq
uiva
lentes
al pr
incip
io de
año
2,408
,474
Cash
and c
ash
equi
valen
ts at
end o
f yea
r−Ef
ectiv
o y eq
uiva
lentes
al fi
n de
año
$ 1,58
3,286
168 TUNA COMMISSION

INTE
R-AM
ERIC
AN T
ROPI
CAL
TUNA
COM
MIS
SION
−− COM
ISIO
N IN
TERA
MER
ICAN
A DE
L AT
UN T
ROPI
CAL
Sche
dule
of e
xpen
ditu
res b
y pr
ojec
t, Se
ptem
ber 3
0, 20
00−−
Prog
ram
a de
gas
tos p
or p
roye
cto,
30
de se
ptie
mbr
e de
200
0
Adm
inist
ratio
nCa
tch
and
Biol
ogy
ofOc
eano
grap
hyTu
na a
ndTu
na-D
olph
inef
fort
tuna
s and
and
billf
ishPr
ogra
mst
atist
ics
billf
ishes
m
eteo
rolo
gy
tagg
ing
Tota
lAd
min
istra
ción
Esta
díst
icas
Biol
ogía
de
Ocea
nogr
afía
Mar
cado
Prog
ram
ade
capt
ura
atun
es y
y
de a
tune
sAt
ún-
y es
fuer
zopi
cudo
sm
eteo
rolo
gía
y pi
cudo
sDe
lfín
Salar
ies−S
ueldo
s41
8,016
492,5
1289
4,796
15,69
889
,003
808,7
392,7
18,76
4Ob
serv
er co
sts−
Gasto
s por
obse
rvad
ores
−−
−−
−1,2
78,84
91,2
78,84
9M
ater
ials a
nd su
pplie
s−M
ater
iales
y pe
rtrec
hos
100,5
4480
,487
227,4
381,3
1051
7,544
123,4
061,0
50,72
9Co
ntra
ct ex
pend
iture
s−Ga
stos p
or co
ntra
to16
,385
165,5
4325
7,478
285
209,9
2664
9,419
Emplo
yee b
enefi
ts−Be
nefic
ios la
bora
les78
,857
92,91
016
8,800
2,961
16,79
015
2,565
512,8
83Tr
avel−
Viaje
s20
8,463
43,52
375
,316
35,2
1093
,883
426,3
98Ut
ilitie
s−Se
rvici
os pú
blico
s33
,037
22,78
316
,062
882
742
,362
115,0
79Pr
intin
g and
posta
ge−
Impr
enta
y fra
nque
o29
,825
4,686
6,962
−1,0
3318
,684
61,19
0In
sura
nce−
Segu
ros
9,269
7,085
1,487
423,7
5013
,320
34,95
3Le
gal a
nd pr
ofess
ional−
Lega
l y pr
ofesio
nal
20,42
32,5
79−
−−
4,315
27,31
7M
iscell
aneo
us−M
iscelá
nea
1,346
3,190
1,984
10,80
9−
4,484
21,81
3
$916
,165
915,2
981,6
50,32
330
,833
634,2
422,7
50,53
36,8
97,39
4
ANNUAL REPORT 2000 169

APPENDIX 3−−ANEXO 3CONTRIBUTIONS BY IATTC STAFF MEMBERS PUBLISHED DURING 2000
CONTRIBUCIONES POR EL PERSONAL DE CIAT PUBLICADAS DURANTE 2000
Annual Report−−Informe Anual
1998
Bulletin−−Boletín
Watters, George, and Richard Deriso. Catch per unit of effort of bigeye tuna: a new ana-lysis with regression trees and simulated annealing−Captura de atún patudo por uni-dad de esfuerzo: un nuevo análisis con árboles de regresión y templado simulado. Inter-Amer. Trop. Tuna Comm., Bull., 21 (8): 527-571.
Books−−Libros
Hall, Martin A., Dayton L. Alverson, and Kaija I. Metuzals. By-catch: problems and sol-utions. In Sheppard, Charles R. C. (editor), Seas at the Millennium: an Environmen-tal Evaluation, Vol. III, Global Issues and Processes: 135-151.
Lennert-Cody, Cleridy E., and Martín A. Hall. The development of the purse-seine fish-ery on drifting fish aggregating devices in the eastern Pacific Ocean: 1992-1998. In LeGall, Jean-Yves, Patrice Cayré, and Marc Taquet (editors), Pêche Thonière et Dispos-itifs de Concentration de Poissons, Colloque Caraïbe-Martinique, TroisÏlets, 15-19Octobre 1999, Inst. Fran. Recherche Exploitation Mer (IFREMER): 78-107.
Outside journals−−Revistas externas
Allen, Robin. International management of the tuna fisheries of the eastern PacificOcean. Fiskeriøkonomiske Små-Skrifter [Papers on Fisheries Economics], 38: 8 pp.
Allen, Robin. The Inter-American Tropical Tuna Commission: role, functions and future.In Hinman, Ken (editor), Getting Ahead of the Curve: Conserving the Pacific Ocean'sTunas, Swordfish, Billfishes and Sharks, National Coalition for Marine Conservation,Symposium 16: 145-152.
Childers, John, and Forrest R. Miller. Summary of the 1999 U.S. North and South Pacificalbacore troll fisheries. U.S. Nat. Mar. Fish. Serv., Admin. Rep., LJ-00-06: iii, 42 pp.
Dagorn, Laurent, Filippo Menczer, Pascal Bach, and Robert J. Olson. Co-evolution ofmovement behaviours by tropical pelagic predatory fishes in response to prey environ-ment: a simulation model. Ecol. Model., 134 (2-3): 325-341.
Deriso, Richard B., and William H. Bayliff. The status of Pacific tuna stocks. In Hin-man, Ken (editor), Getting Ahead of the Curve: Conserving the Pacific Ocean's Tunas,Swordfish, Billfishes and Sharks, National Coalition for Marine Conservation,Symposium 16: 12-30.
170 TUNA COMMISSION

Finneran, James J., Charles W. Oliver, Kurt M. Schaefer, and Sam H. Ridgway. Sourcelevels and estimated yellowfin tuna (Thunnus albacares) detection ranges for dolphinjaw pops, breaches, and tail slaps. Acous. Soc. Amer., Jour., 107 (1): 649-656.
Hall, Martin A., Dayton L. Alverson, and Kaija I. Metuzals. By-catch: problems and so-lutions. Mar. Pollution Bull., 41 (1-6): 204-219. [reprint of chapter in book listedabove]
Hall, Martin A., and Peter G. Williams. Bycatch in the tuna net fisheries. In Hinman,Ken (editor), Getting Ahead of the Curve: Conserving the Pacific Ocean's Tunas,Swordfish, Billfishes and Sharks, National Coalition for Marine Conservation,Symposium 16: 72-81.
Joseph, James. World tuna production: past, present and future. Pap. 6th World TunaTrade Conference, Bangkok, Thailand: 3-20.
Schaefer, Kurt M. Proyecto conducido por la CIAT. Atún Mar, 4 (6): 34-35.
Schaefer, Kurt M., and Charles W. Oliver. Shape, volume, and resonance frequency of theswim bladder of yellowfin tuna, Thunnus albacares. U.S. Nat. Mar. Fish. Serv., Fish.Bull., 98 (2): 364-374.
ANNUAL REPORT 2000 171


The IATTC’s responsibilities are met withtwo programs, the Tuna-Billfish Programand the Tuna-Dolphin Program. The prin-cipal responsibilities of the Tuna-BillfishProgram are (1) to study the biology of thetunas and related species of the easternPacific Ocean to estimate the effects thatfishing and natural factors have on theirabundance, (2) to recommend appropriateconservation measures so that the stocks offish can be maintained at levels which willafford maximum sustainable catches, and (3)to collect information on compliance withCommission resolutions. The principalresponsibilities of the Tuna-DolphinProgram are (1) to monitor the abundance ofdolphins and their mortality incidental topurse-seine fishing in the eastern PacificOcean, (2) to study the causes of mortality ofdolphins during fishing operations and pro-mote the use of fishing techniques and equip-ment that minimize these mortalities, (3) tostudy the effects of different modes of fishingon the various fish and other animals of thepelagic ecosystem, and (4) to provide a secre-tariat for the International DolphinConservation Program.
An important part of the work of theIATTC is the prompt publication and widedistribution of its research results. TheCommission publishes its results in itsBulletin, Special Report, and Data Reportseries, all of which are issued on an irregularbasis, and its Stock Assessment Reports,which are published annually.
The Commission also publishes AnnualReports and Quarterly Reports, whichinclude policy actions of the Commission,information on the fishery, and reviews ofthe year’s or quarter's work carried out bythe staff. The Annual Reports also containfinancial statements and a roster of theIATTC staff.
Additional information on the IATTC’spublications can be found in its web site.
La CIAT cumple sus obligaciones medi-ante dos programas, el Programa Atún-Picudo y el Programa Atún-Delfín. Lasresponsabilidades principales del primeroson (1) estudiar la biología de los atunes yespecies afines en el Océano Pacífico orientala fin de determinar los efectos de la pesca ylos factores naturales sobre su abundancia,(2) recomendar medidas apropiadas de con-servación para permitir mantener los stocksde peces a niveles que brinden las capturasmáximas sostenibles, (3) reunir informaciónsobre el cumplimiento de las resoluciones dela Comisión. Las responsabilidades princi-pales del segundo son (1) dar seguimiento ala abundancia de los delfines y la mortalidadde los mismos incidental a la pesca con red decerco en el Océano Pacífico oriental, (2) estu-diar las causas de la mortalidad de delfinesdurante las operaciones de pesca y fomentarel uso de técnicas y aparejo de pesca quereduzcan dicha mortalidad al mínimo, (3)estudiar los efectos de distintas morta-lidades de pesca sobre los varios peces y otrosanimales del ecosistema pelágico, (4) propor-cionar la Secretaría para el ProgramaInternacional para la Conservación de losDelfines.
La pronta publicación y amplia distribu-ción de los resultados de investigaciónforman un aspecto importante de las laboresde la Comisión, la cual publica los resultadosen su serie de Boletines, Informes Especiales,e Informes de Datos, publicados a intervalosirregulares, y sus Informes de Evaluación deStocks, publicados anualmente.
La Comisión publica también InformesAnuales e Informes Trimestrales; éstosincluyen información sobre las labores de laComisión, la pesquería, y las investigacionesrealizadas en el año o trimestre correspondi-ente. Los Informes Anuales incluyen tam-bién un resumen financiero y una lista delpersonal de la CIAT.
En el sitio de internet de la CIAT se pre-senta información adicional sobre estas pub-licaciones.
Editor−RedactorWilliam H. Bayliff
Inter-American Tropical Tuna CommissionComisión Interamericana del Atún Tropical
8604 La Jolla Shores DriveLa Jolla, California 92037-1508, U.S.A.
www.iattc.org


