IB 12 1 Quantum Physics What are photons? Quantum of energy – particle of light Properties of photons: m = 0, v = c (in a vacuum), q = 0 Energy of a Photon E = hf where h = Planck’s constant = 6.63 x 10 -34 J s Intensity – power per unit area Formula: I = P/A Symbol: I Units: W/m 2 1. A beam of monochromatic light has a frequency of 4.4 x 10 14 Hz. Determine the energy of each photon of this light in both joules and electron-volts. 2. Light from a 2.5 mW laser has a wavelength of 670 nm. a) Find the energy of each photon in joules and electron-volts. b) How many photons does it emit in 3.0 minutes? c) The laser beam falls normally on a plane surface and appears as a small circle whose diameter is 1.5 mm. What is the intensity of the laser beam?
Transcript
IB 12
1
Quantum Physics What are photons? Quantum of energy – particle of light
Properties of photons: m = 0, v = c (in a vacuum), q = 0
Energy of a Photon
E = hf where h = Planck’s constant = 6.63 x 10⁻³⁴ J s
Intensity – power per unit area
Formula: I = P/A Symbol: I Units: W/m2
1. A beam of monochromatic light has a frequency of 4.4 x 10¹⁴ Hz. Determine the energy of each photon of this light in both joules and electron-volts.
2. Light from a 2.5 mW laser has a wavelength of 670 nm. a) Find the energy of each photon in joules and electron-volts.
b) How many photons does it emit in 3.0 minutes?
c) The laser beam falls normally on a plane surface and appears as a small circle whose diameter is 1.5 mm. What is the intensity of the laser beam?
IB 12
2
Energy of each photon
Total energy Number of
photons
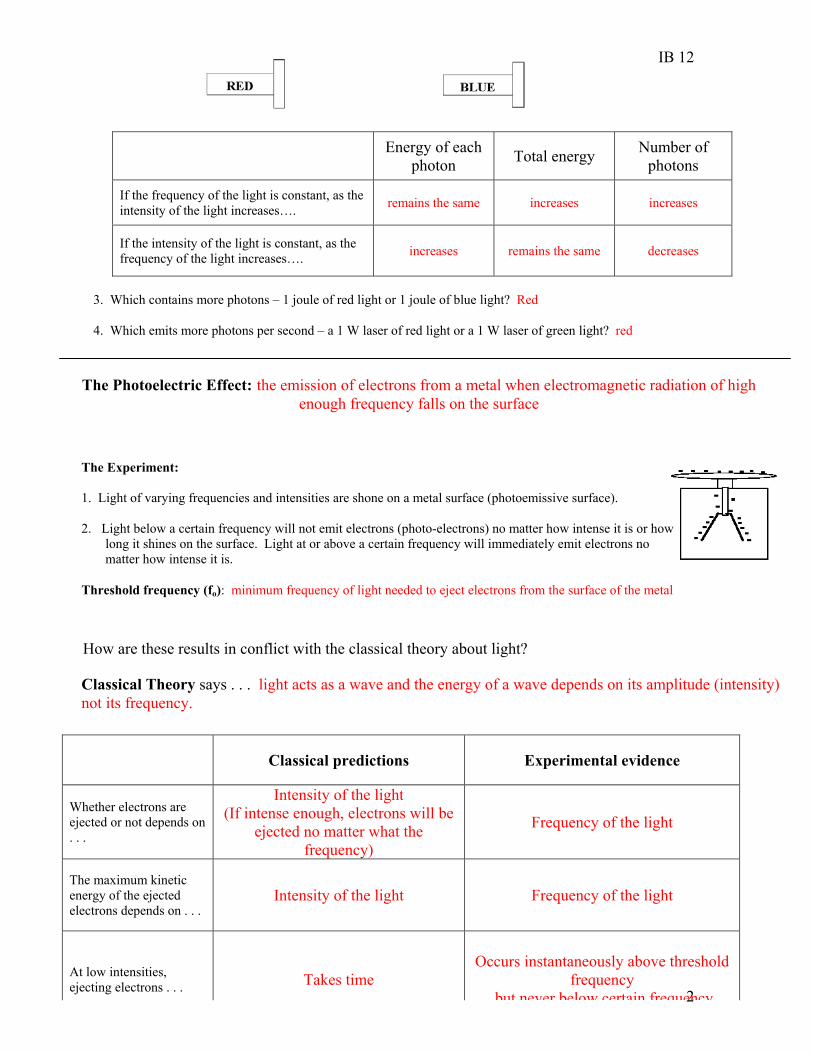
If the frequency of the light is constant, as the intensity of the light increases…. remains the same increases increases
If the intensity of the light is constant, as the frequency of the light increases…. increases remains the same decreases
3. Which contains more photons – 1 joule of red light or 1 joule of blue light? Red 4. Which emits more photons per second – a 1 W laser of red light or a 1 W laser of green light? red
The Photoelectric Effect: the emission of electrons from a metal when electromagnetic radiation of high enough frequency falls on the surface
The Experiment: 1. Light of varying frequencies and intensities are shone on a metal surface (photoemissive surface). 2. Light below a certain frequency will not emit electrons (photo-electrons) no matter how intense it is or how
long it shines on the surface. Light at or above a certain frequency will immediately emit electrons no matter how intense it is.
Threshold frequency (fo): minimum frequency of light needed to eject electrons from the surface of the metal
Classical Theory says . . . light acts as a wave and the energy of a wave depends on its amplitude (intensity) not its frequency.
How are these results in conflict with the classical theory about light?
Classical predictions Experimental evidence
Whether electrons are ejected or not depends on . . .
Intensity of the light (If intense enough, electrons will be
ejected no matter what the frequency)
Frequency of the light
The maximum kinetic energy of the ejected electrons depends on . . .
Intensity of the light Frequency of the light
At low intensities, ejecting electrons . . . Takes time
Occurs instantaneously above threshold frequency
but never below certain frequency
IB 12
3
Einstein’s explanation of the photo-electric effect:
4. Light acts like a particle (not a wave) in which its energy is proportional to its frequency. 5. Electrons at the surface of the metal need a minimum energy in order to be ejected from the
surface, called the work function, an amount which varies from metal to metal. (Electrons under the surface of the metal need more energy to be emitted.)
o
E h f
h f
Work Function ( ):
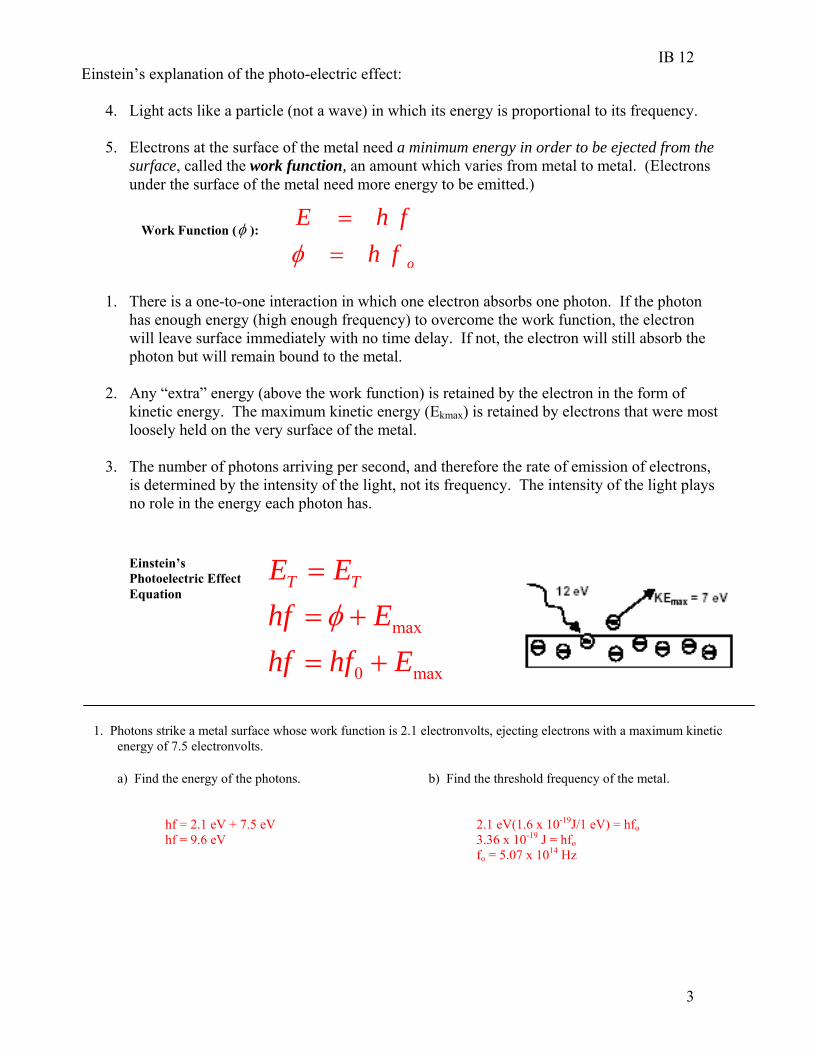
Einstein’s Photoelectric Effect Equation
max
0 max
T TE E
hf E
hf hf E
1. There is a one-to-one interaction in which one electron absorbs one photon. If the photon has enough energy (high enough frequency) to overcome the work function, the electron will leave surface immediately with no time delay. If not, the electron will still absorb the photon but will remain bound to the metal.
2. Any “extra” energy (above the work function) is retained by the electron in the form of
kinetic energy. The maximum kinetic energy (Ekmax) is retained by electrons that were most loosely held on the very surface of the metal.
3. The number of photons arriving per second, and therefore the rate of emission of electrons,
is determined by the intensity of the light, not its frequency. The intensity of the light plays no role in the energy each photon has.
1. Photons strike a metal surface whose work function is 2.1 electronvolts, ejecting electrons with a maximum kinetic energy of 7.5 electronvolts.
b) Find the threshold frequency of the metal.
2.1 eV(1.6 x 10⁻¹⁹J/1 eV) = hfo 3.36 x 10⁻¹⁹ J = hfo fo = 5.07 x 10¹⁴ Hz
a) Find the energy of the photons. hf = 2.1 eV + 7.5 eV hf = 9.6 eV
IB 12
4
Analysis of the Photo-Electric Effect Experimental Data
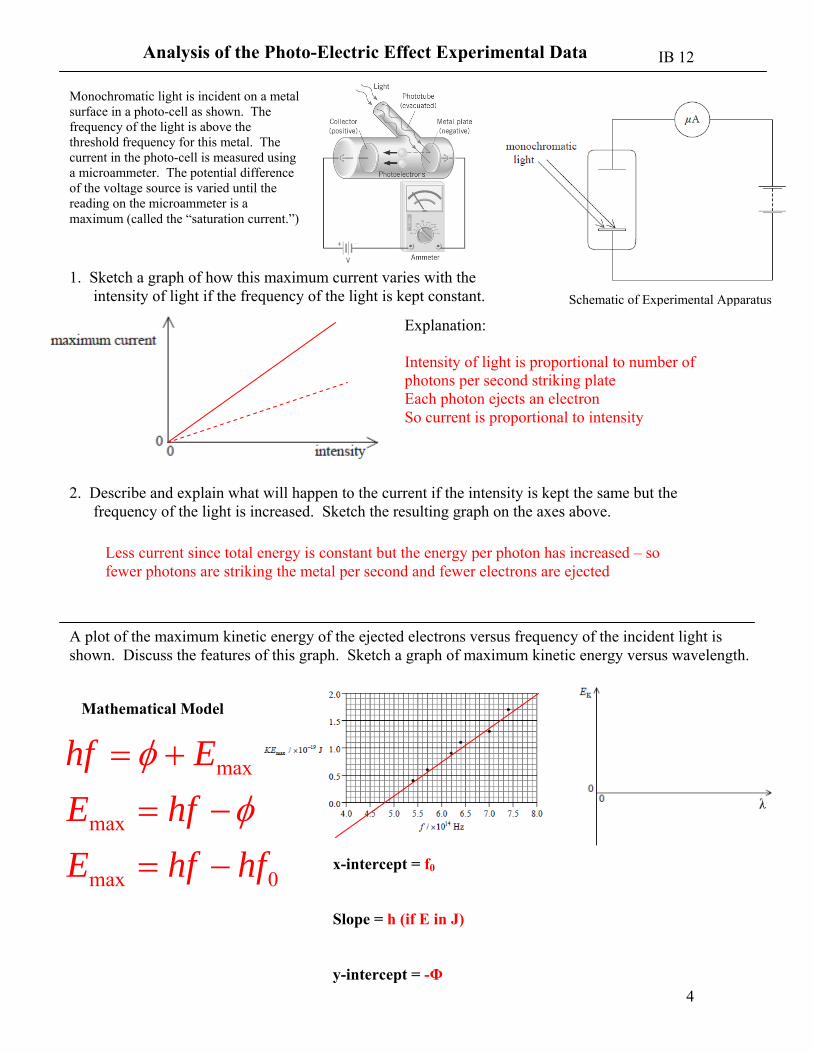
Monochromatic light is incident on a metal surface in a photo-cell as shown. The frequency of the light is above the threshold frequency for this metal. The current in the photo-cell is measured using a microammeter. The potential difference of the voltage source is varied until the reading on the microammeter is a maximum (called the “saturation current.”)
1. Sketch a graph of how this maximum current varies with the intensity of light if the frequency of the light is kept constant.
Explanation: Intensity of light is proportional to number of photons per second striking plate Each photon ejects an electron So current is proportional to intensity
2. Describe and explain what will happen to the current if the intensity is kept the same but the frequency of the light is increased. Sketch the resulting graph on the axes above.
Less current since total energy is constant but the energy per photon has increased – so fewer photons are striking the metal per second and fewer electrons are ejected
A plot of the maximum kinetic energy of the ejected electrons versus frequency of the incident light is shown. Discuss the features of this graph. Sketch a graph of maximum kinetic energy versus wavelength.
Mathematical Model
max
max
max 0
hf E
E hf
E hf hf
x-intercept = f0
Slope = h (if E in J) y-intercept = -Φ
Schematic of Experimental Apparatus
IB 12
5
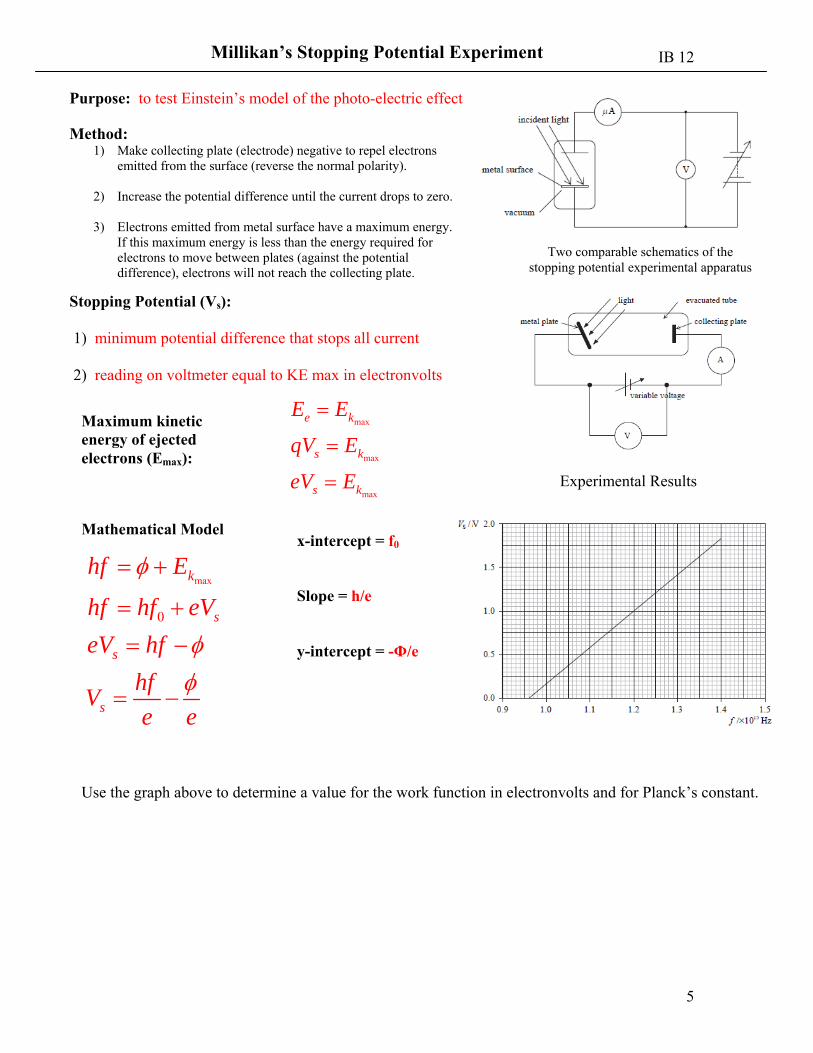
Millikan’s Stopping Potential Experiment
Purpose: to test Einstein’s model of the photo-electric effect
Method: 1) Make collecting plate (electrode) negative to repel electrons
emitted from the surface (reverse the normal polarity). 2) Increase the potential difference until the current drops to zero.
3) Electrons emitted from metal surface have a maximum energy.
If this maximum energy is less than the energy required for electrons to move between plates (against the potential difference), electrons will not reach the collecting plate.
Stopping Potential (Vs): 1) minimum potential difference that stops all current 2) reading on voltmeter equal to KE max in electronvolts
Two comparable schematics of the stopping potential experimental apparatus
Experimental Results
Maximum kinetic energy of ejected electrons (Emax):
Use the graph above to determine a value for the work function in electronvolts and for Planck’s constant.
IB 12
6
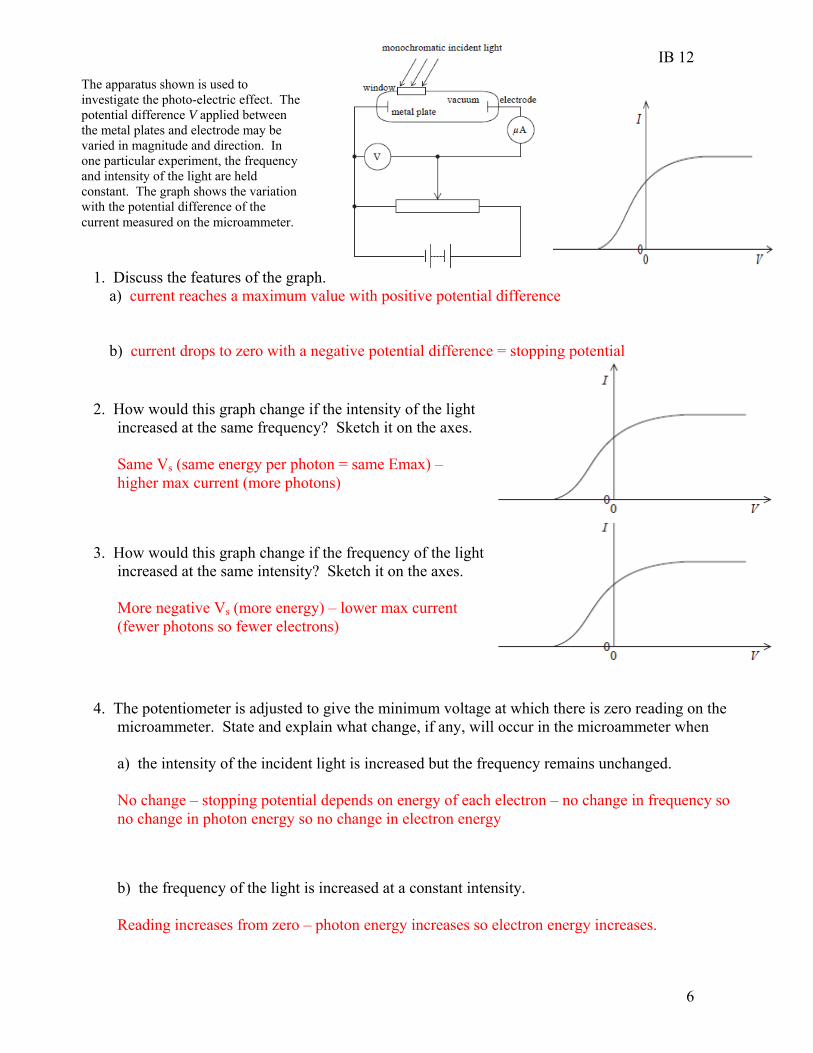
The apparatus shown is used to investigate the photo-electric effect. The potential difference V applied between the metal plates and electrode may be varied in magnitude and direction. In one particular experiment, the frequency and intensity of the light are held constant. The graph shows the variation with the potential difference of the current measured on the microammeter.
1. Discuss the features of the graph. a) current reaches a maximum value with positive potential difference b) current drops to zero with a negative potential difference = stopping potential
2. How would this graph change if the intensity of the light increased at the same frequency? Sketch it on the axes.
Same Vs (same energy per photon = same Emax) –
higher max current (more photons)
3. How would this graph change if the frequency of the light increased at the same intensity? Sketch it on the axes.
More negative Vs (more energy) – lower max current
(fewer photons so fewer electrons)
4. The potentiometer is adjusted to give the minimum voltage at which there is zero reading on the microammeter. State and explain what change, if any, will occur in the microammeter when
a) the intensity of the incident light is increased but the frequency remains unchanged. No change – stopping potential depends on energy of each electron – no change in frequency so
no change in photon energy so no change in electron energy
b) the frequency of the light is increased at a constant intensity. Reading increases from zero – photon energy increases so electron energy increases.
IB 12
7
Matter Waves
Louis de Broglie (French physicist, 1892 – 1987) postulated in his doctoral dissertation that because light can have both wave and particle characteristics, perhaps all forms of matter have both characteristics. De Broglie Hypothesis (1924): All particles can behave like waves whose wavelength is given by λ = h/p where h = Planck’s constant and p = the momentum of the particle
Matter wave: All moving particles have a “matter wave” associated with them whose wavelength is the de Broglie wavelength.
Wave-Particle Duality: Both matter and radiation have a dual nature. They exhibit both particle and wave properties.
De Broglie wavelength
h h
p mv
1. Determine the de Broglie wavelength for an electron moving at 6.0 × 10⁶ m/s and a baseball (mass = 0.15 kg) moving at 13 m/s. Electron baseball λ = 6.63 x 10⁻³⁴ / (9.11 x 10-31 x 6.0 x 106 ) λ = 6.63 x 10⁻³⁴ / (0.15 x 13) λ = 1.2 x 10⁻¹⁰ m λ = 3.3 x 10⁻³⁴ m
2. Why don’t we notice the wavelike nature of matter in everyday life? Wavelengths are too small
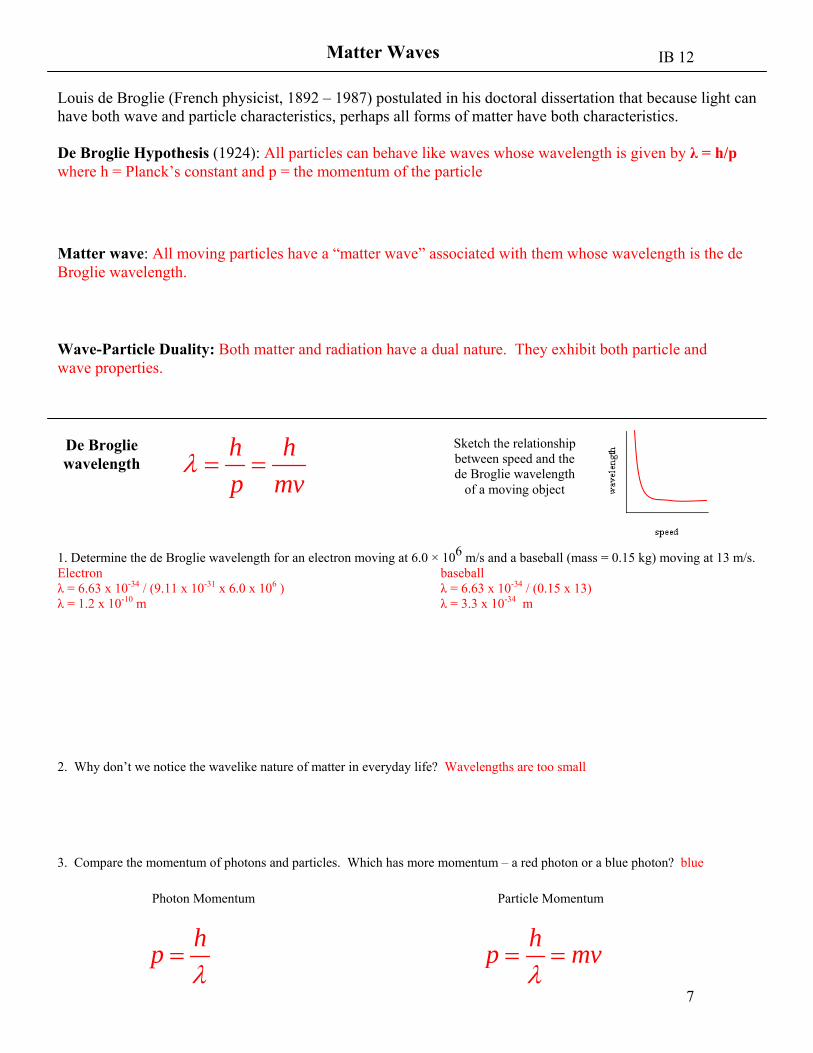
Sketch the relationship between speed and the de Broglie wavelength
of a moving object
3. Compare the momentum of photons and particles. Which has more momentum – a red photon or a blue photon? blue
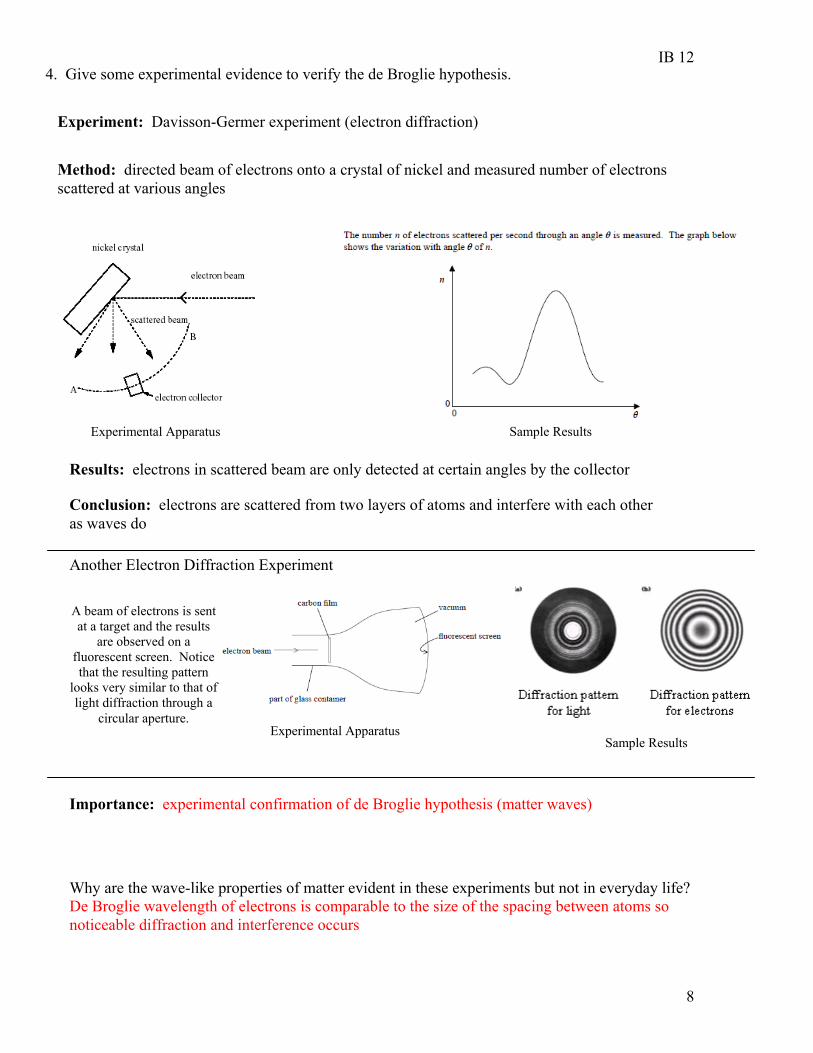
Method: directed beam of electrons onto a crystal of nickel and measured number of electrons scattered at various angles
Results: electrons in scattered beam are only detected at certain angles by the collector
Conclusion: electrons are scattered from two layers of atoms and interfere with each other as waves do
Experimental Apparatus Sample Results
Another Electron Diffraction Experiment
A beam of electrons is sent at a target and the results
are observed on a fluorescent screen. Notice that the resulting pattern
looks very similar to that of light diffraction through a
circular aperture. Experimental Apparatus
Sample Results
Importance: experimental confirmation of de Broglie hypothesis (matter waves)
Why are the wave-like properties of matter evident in these experiments but not in everyday life? De Broglie wavelength of electrons is comparable to the size of the spacing between atoms so noticeable diffraction and interference occurs
4. Give some experimental evidence to verify the de Broglie hypothesis.
IB 12
9
2
2
2
2
2
2
2
k
k
k
k
pE
m
p mE
h h
p mE
hE
m
k 2
1E
1
kE
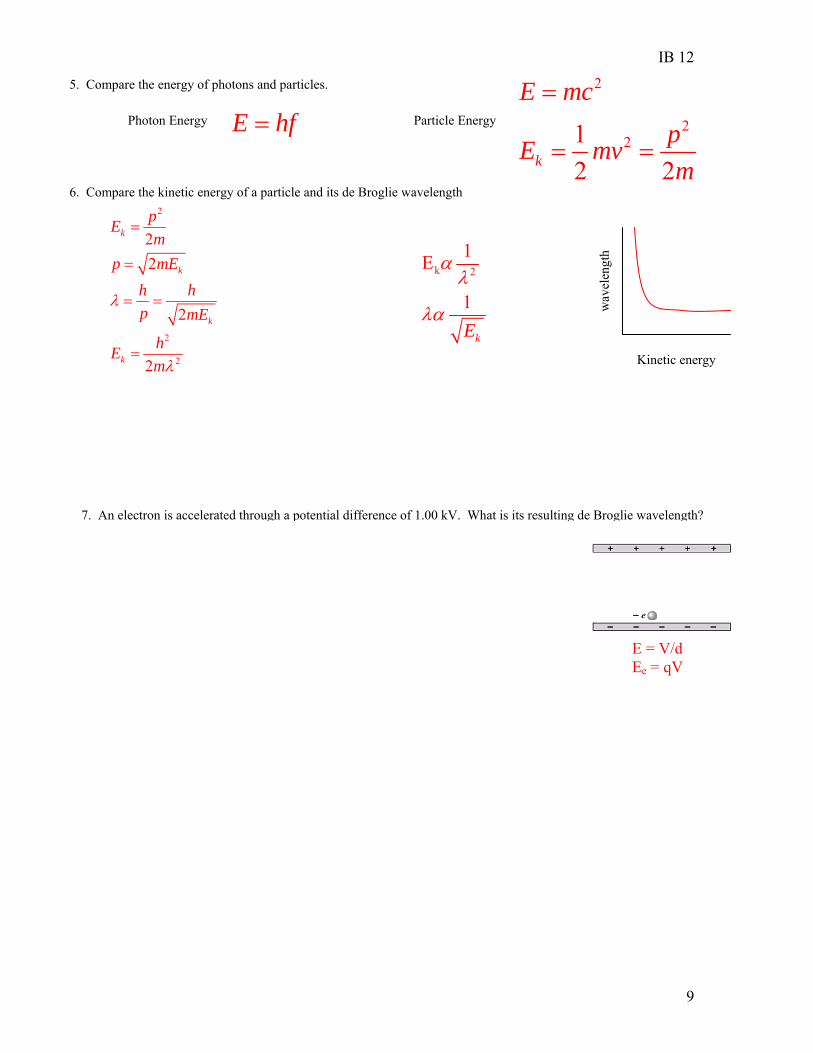
5. Compare the energy of photons and particles.
Photon Energy Particle Energy E hf
2
221
2 2k
E mc
pE mv
m
6. Compare the kinetic energy of a particle and its de Broglie wavelength
Kinetic energy
wav
elen
gth
E = V/d Ee = qV
7. An electron is accelerated through a potential difference of 1.00 kV. What is its resulting de Broglie wavelength?
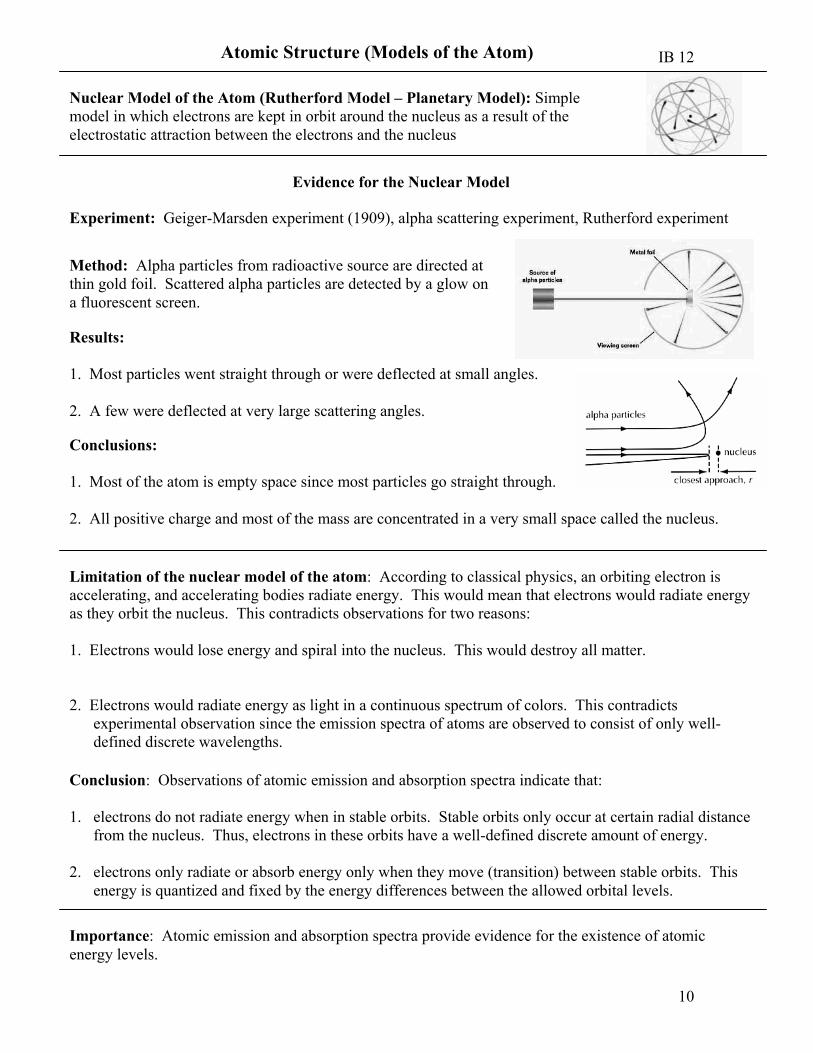
Method: Alpha particles from radioactive source are directed at thin gold foil. Scattered alpha particles are detected by a glow on a fluorescent screen.
Results: 1. Most particles went straight through or were deflected at small angles. 2. A few were deflected at very large scattering angles.
Conclusions: 1. Most of the atom is empty space since most particles go straight through. 2. All positive charge and most of the mass are concentrated in a very small space called the nucleus.
Nuclear Model of the Atom (Rutherford Model – Planetary Model): Simple model in which electrons are kept in orbit around the nucleus as a result of the electrostatic attraction between the electrons and the nucleus
Evidence for the Nuclear Model
Limitation of the nuclear model of the atom: According to classical physics, an orbiting electron is accelerating, and accelerating bodies radiate energy. This would mean that electrons would radiate energy as they orbit the nucleus. This contradicts observations for two reasons: 1. Electrons would lose energy and spiral into the nucleus. This would destroy all matter. 2. Electrons would radiate energy as light in a continuous spectrum of colors. This contradicts
experimental observation since the emission spectra of atoms are observed to consist of only well-defined discrete wavelengths.
Conclusion: Observations of atomic emission and absorption spectra indicate that: 1. electrons do not radiate energy when in stable orbits. Stable orbits only occur at certain radial distance
from the nucleus. Thus, electrons in these orbits have a well-defined discrete amount of energy.
2. electrons only radiate or absorb energy only when they move (transition) between stable orbits. This energy is quantized and fixed by the energy differences between the allowed orbital levels.
Importance: Atomic emission and absorption spectra provide evidence for the existence of atomic energy levels.
IB 12
11
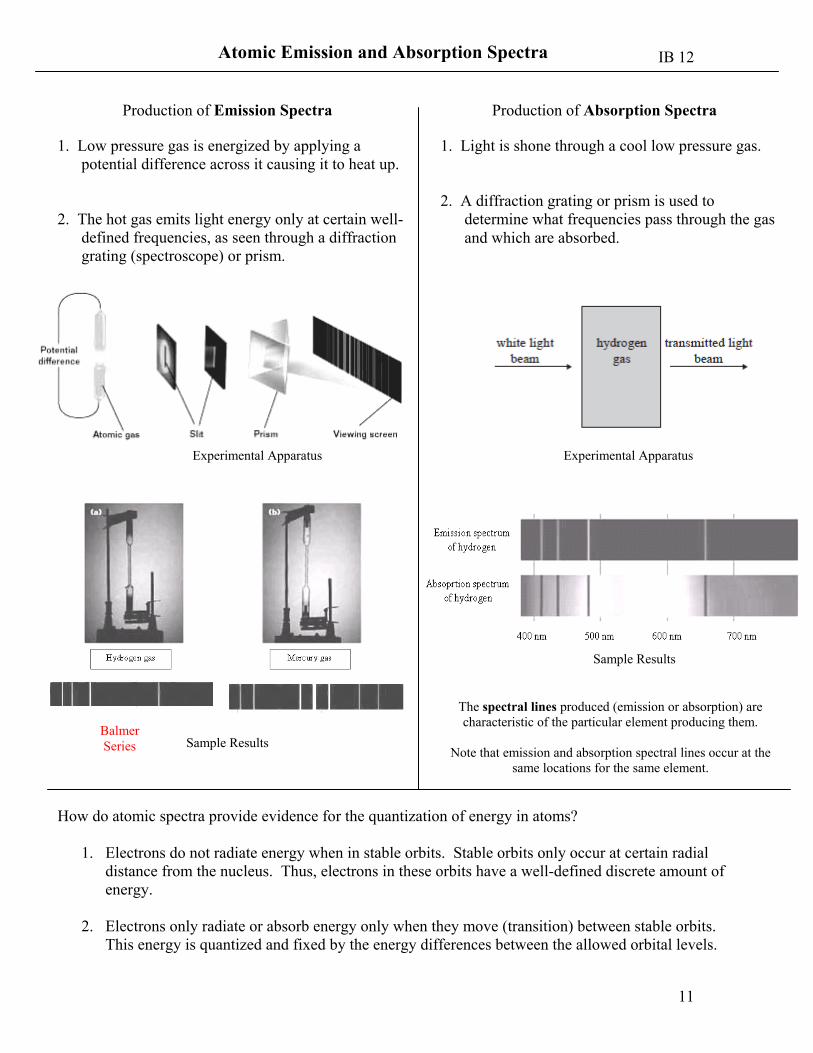
Atomic Emission and Absorption Spectra
Production of Emission Spectra
1. Low pressure gas is energized by applying a potential difference across it causing it to heat up.
2. The hot gas emits light energy only at certain well-
defined frequencies, as seen through a diffraction grating (spectroscope) or prism.
Experimental Apparatus
Sample Results Balmer Series
Production of Absorption Spectra
1. Light is shone through a cool low pressure gas. 2. A diffraction grating or prism is used to
determine what frequencies pass through the gas and which are absorbed.
Experimental Apparatus
The spectral lines produced (emission or absorption) are characteristic of the particular element producing them.
Note that emission and absorption spectral lines occur at the
same locations for the same element.
Sample Results
How do atomic spectra provide evidence for the quantization of energy in atoms?
1. Electrons do not radiate energy when in stable orbits. Stable orbits only occur at certain radial distance from the nucleus. Thus, electrons in these orbits have a well-defined discrete amount of energy.
2. Electrons only radiate or absorb energy only when they move (transition) between stable orbits. This energy is quantized and fixed by the energy differences between the allowed orbital levels.
IB 12
12
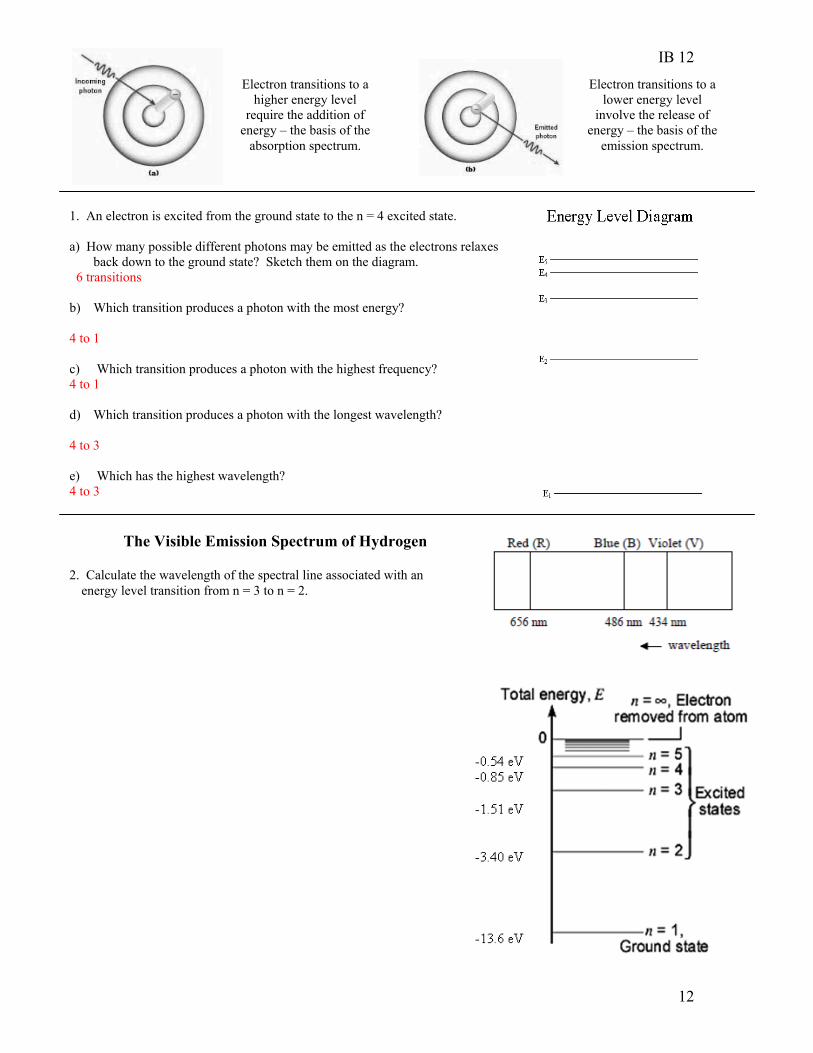
1. An electron is excited from the ground state to the n = 4 excited state. a) How many possible different photons may be emitted as the electrons relaxes
back down to the ground state? Sketch them on the diagram. 6 transitions b) Which transition produces a photon with the most energy? 4 to 1 c) Which transition produces a photon with the highest frequency? 4 to 1 d) Which transition produces a photon with the longest wavelength? 4 to 3 e) Which has the highest wavelength? 4 to 3
Electron transitions to a higher energy level
require the addition of energy – the basis of the
absorption spectrum.
Electron transitions to a lower energy level
involve the release of energy – the basis of the
emission spectrum.
The Visible Emission Spectrum of Hydrogen
2. Calculate the wavelength of the spectral line associated with an energy level transition from n = 3 to n = 2.
IB 12
13
How can the atomic energy levels be explained as quantized matter waves?
The “Electron-in-a-Box” Model of the Atom
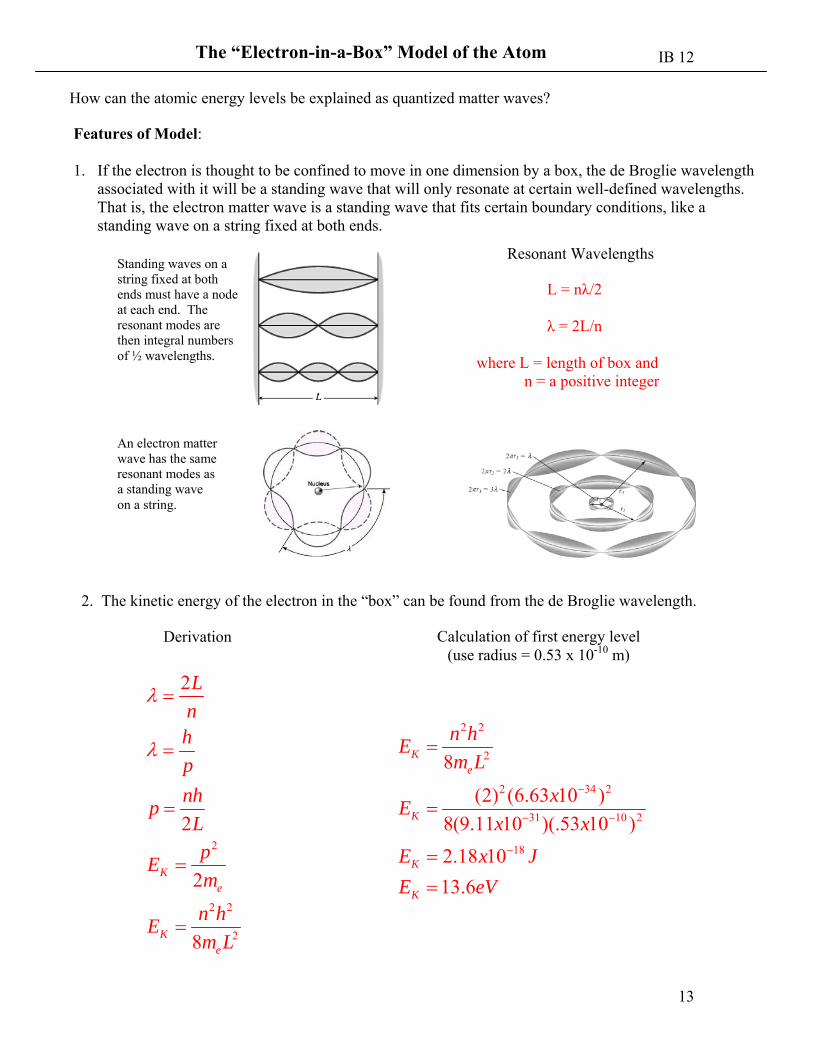
Features of Model: 1. If the electron is thought to be confined to move in one dimension by a box, the de Broglie wavelength
associated with it will be a standing wave that will only resonate at certain well-defined wavelengths. That is, the electron matter wave is a standing wave that fits certain boundary conditions, like a standing wave on a string fixed at both ends.
Standing waves on a string fixed at both ends must have a node at each end. The resonant modes are then integral numbers of ½ wavelengths.
L = nλ/2
λ = 2L/n
where L = length of box and n = a positive integer
An electron matter wave has the same resonant modes as a standing wave on a string.
Resonant Wavelengths
2. The kinetic energy of the electron in the “box” can be found from the de Broglie wavelength.
2
2 2
2
2
2
2
8
Ke
Ke
L
nh
p
nhp
L
pE
m
n hE
m L
Derivation Calculation of first energy level (use radius = 0.53 x 10⁻¹⁰ m)
2 2
2
2 34 2
31 10 2
18
8
(2) (6.63 10 )
8(9.11 10 )(.53 10 )
2.18 10
13.6
Ke
K
K
K
n hE
m L
xE
x x
E x J
E eV
IB 12
14
The Schrödinger (Quantum Mechanical) Model of the Atom
Erwin Schrödinger (Austrian physicist, 1887-1961) made use of de Broglie’s hypothesis to develop the first truly quantum theory of the atom using wave mechanics.
Wave Function: a mathematical wave function (ψ) is assigned to the electron.
sinn x
AL
2 2
2 2
8d mE V
dx h
These wave function equations are solutions to a second order differential equation known as Schrödinger’s equation:
Features of Model: 1. Electrons can be described as matter waves, rather than particles. The mathematical equation for this
matter wave is called a “wave function.”
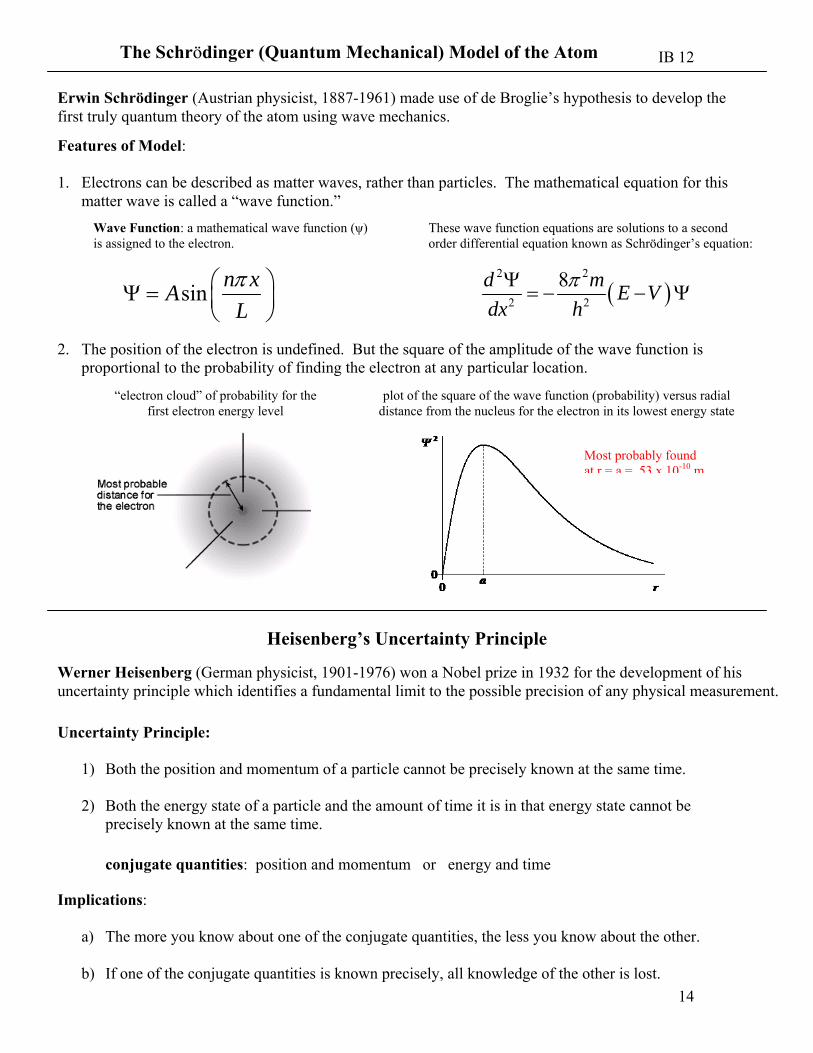
2. The position of the electron is undefined. But the square of the amplitude of the wave function is proportional to the probability of finding the electron at any particular location.
“electron cloud” of probability for the first electron energy level
plot of the square of the wave function (probability) versus radial distance from the nucleus for the electron in its lowest energy state
Most probably found at r = a = 53 x 10-10 m
Heisenberg’s Uncertainty Principle
Uncertainty Principle:
1) Both the position and momentum of a particle cannot be precisely known at the same time. 2) Both the energy state of a particle and the amount of time it is in that energy state cannot be
precisely known at the same time.
Werner Heisenberg (German physicist, 1901-1976) won a Nobel prize in 1932 for the development of his uncertainty principle which identifies a fundamental limit to the possible precision of any physical measurement.
conjugate quantities: position and momentum or energy and time
Implications:
a) The more you know about one of the conjugate quantities, the less you know about the other. b) If one of the conjugate quantities is known precisely, all knowledge of the other is lost.
IB 12
15
Δx · Δp ≥ h/4π Mathematical Representations of the Uncertainty Principle:
ΔE · Δt ≥ h/4π
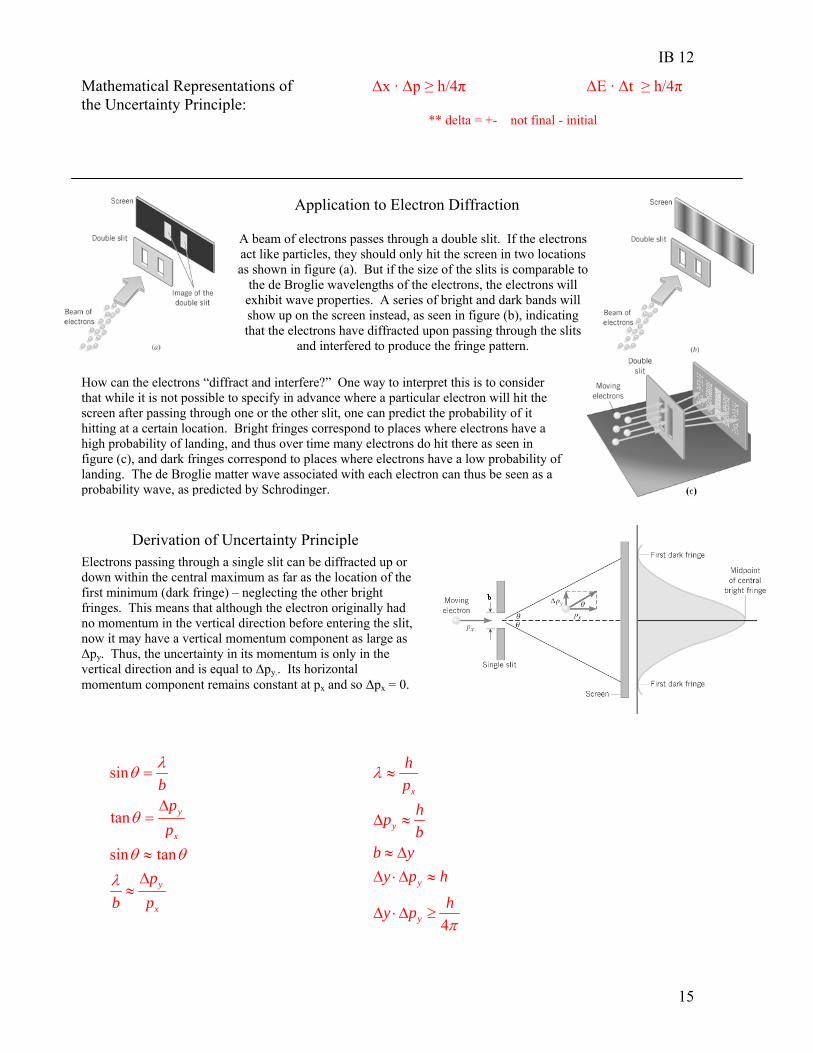
Application to Electron Diffraction
A beam of electrons passes through a double slit. If the electrons act like particles, they should only hit the screen in two locations as shown in figure (a). But if the size of the slits is comparable to
the de Broglie wavelengths of the electrons, the electrons will exhibit wave properties. A series of bright and dark bands will show up on the screen instead, as seen in figure (b), indicating that the electrons have diffracted upon passing through the slits
and interfered to produce the fringe pattern.
How can the electrons “diffract and interfere?” One way to interpret this is to consider that while it is not possible to specify in advance where a particular electron will hit the screen after passing through one or the other slit, one can predict the probability of it hitting at a certain location. Bright fringes correspond to places where electrons have a high probability of landing, and thus over time many electrons do hit there as seen in figure (c), and dark fringes correspond to places where electrons have a low probability of landing. The de Broglie matter wave associated with each electron can thus be seen as a probability wave, as predicted by Schrodinger.
** delta = +- not final - initial
Derivation of Uncertainty Principle Electrons passing through a single slit can be diffracted up or down within the central maximum as far as the location of the first minimum (dark fringe) – neglecting the other bright fringes. This means that although the electron originally had no momentum in the vertical direction before entering the slit, now it may have a vertical momentum component as large as Δpy. Thus, the uncertainty in its momentum is only in the vertical direction and is equal to Δpy.. Its horizontal momentum component remains constant at px and so Δpx = 0.
sin
tan
sin tan
y
x
y
x
bp
p
p
b p
4
x
y
y
y
h
p
hp
bb y
y p h
hy p
IB 12
16
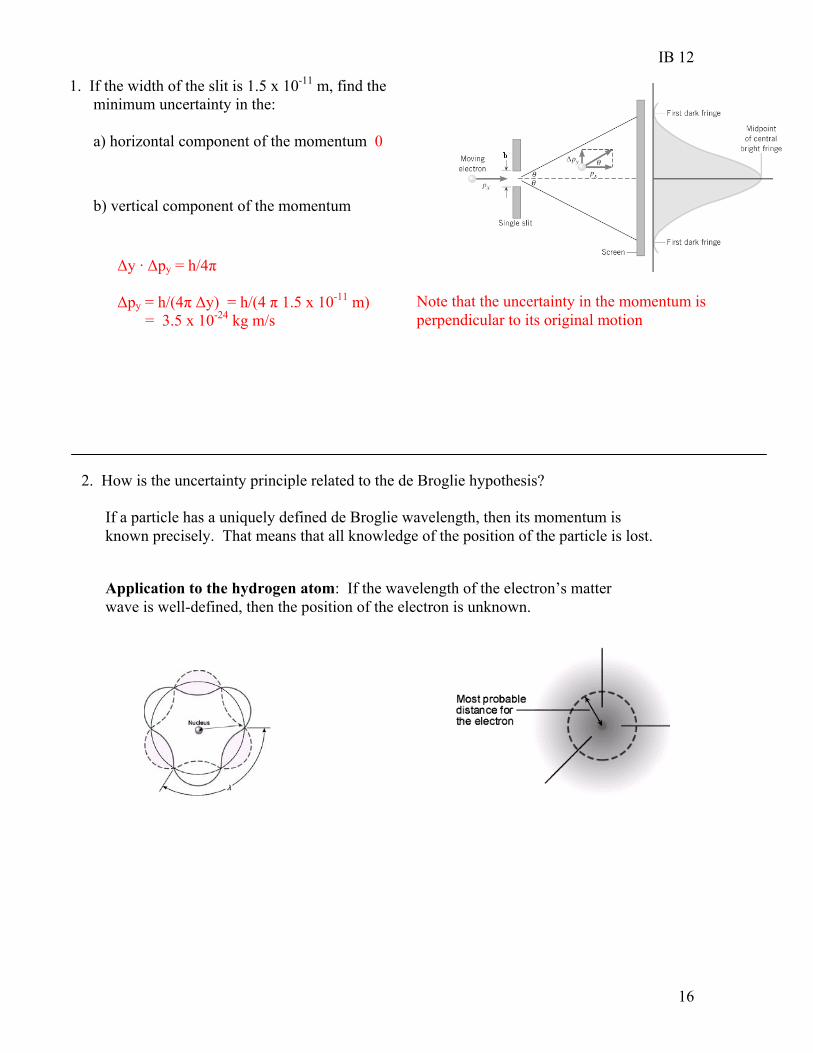
1. If the width of the slit is 1.5 x 10⁻¹¹ m, find the
minimum uncertainty in the: a) horizontal component of the momentum 0
b) vertical component of the momentum
Δy · Δpy = h/4π Δpy = h/(4π Δy) = h/(4 π 1.5 x 10⁻¹¹ m) = 3.5 x 10⁻²⁴ kg m/s
Note that the uncertainty in the momentum is perpendicular to its original motion
2. How is the uncertainty principle related to the de Broglie hypothesis?
If a particle has a uniquely defined de Broglie wavelength, then its momentum is known precisely. That means that all knowledge of the position of the particle is lost.
Application to the hydrogen atom: If the wavelength of the electron’s matter wave is well-defined, then the position of the electron is unknown.