15
IBIS-Q Tutorial: General Query Overview http://ibis.health.utah.gov The “Dataset Queries” button on the IBIS-PH home page takes you to the query system.
| Date post: | 30-Dec-2015 |
| Category: |
Documents |
| Upload: | brendan-powers |
| View: | 26 times |
| Download: | 0 times |

IBIS-Q Tutorial: General Query Overviewhttp://ibis.health.utah.gov
The “Dataset Queries” button on the IBIS-PH home page takes you to the query system.
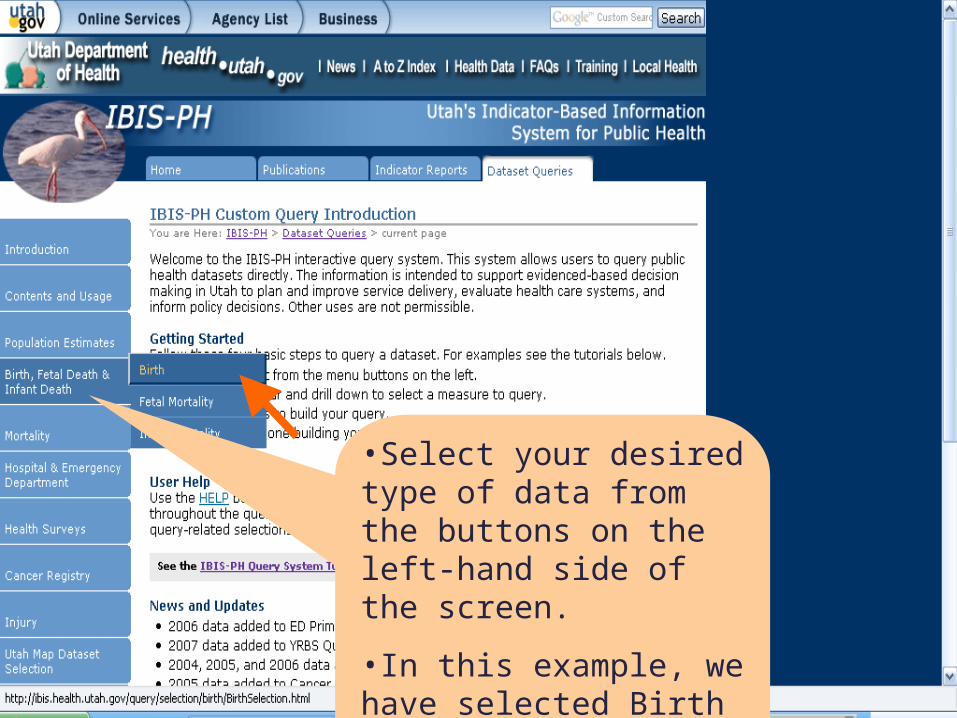
•Select your desired type of data from the buttons on the left-hand side of the screen.
•In this example, we have selected Birth Data.

Common query-builder options are listed in the “Quick Selection” area.
All available query-builder options are accessible under the “Advanced Selection” area.

Scroll over these question marks for relevant information to help guide you through your query.

In this example, we have selected the Low Birth Weight measure (for counties and local health districts).
Note that this same measure could have been selected by drilling down under “Advanced Selection.”

You must agree to the “Appropriate Data Use Agreement” –
1. You will not attempt to identify individuals represented in the data, and
2. If you inadvertently identify someone, you will inform the UDOH.

•Users build their query by clicking on steps and making selections.
•Default values for that step are described below the blue bar, and pre-selected within the step.
•At each step, you can select how you want to group values (e.g., “3-year Groups”), and whether you want to filter the data to certain values (e.g., “2003”).
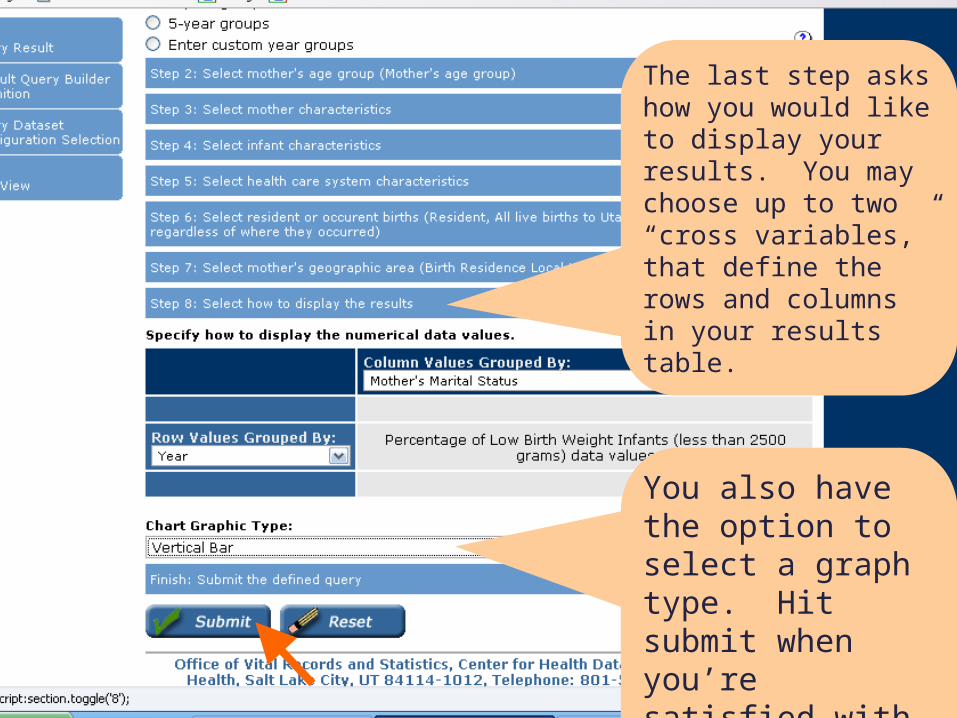
The last step asks how you would like to display your results. You may choose up to two “cross variables,” that define the rows and columns in your results table.
You also have the option to select a graph type. Hit submit when you’re satisfied with your selections.
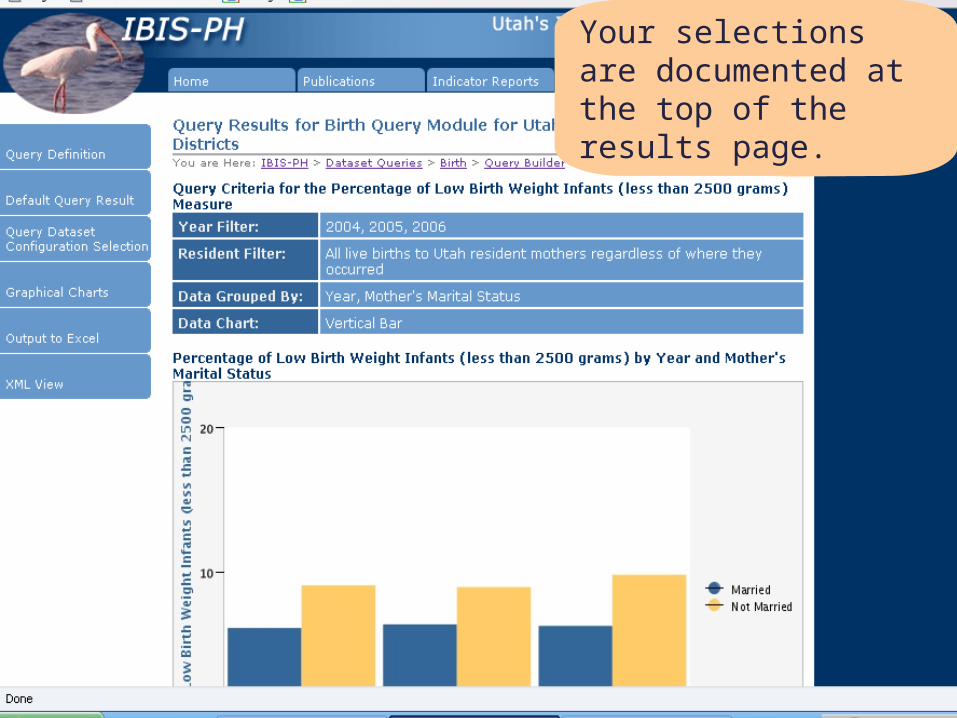
Your selections are documented at the top of the results page.

•If you selected two cross-variables, you will see a 2-dimensional table with the row and column groups you selected.
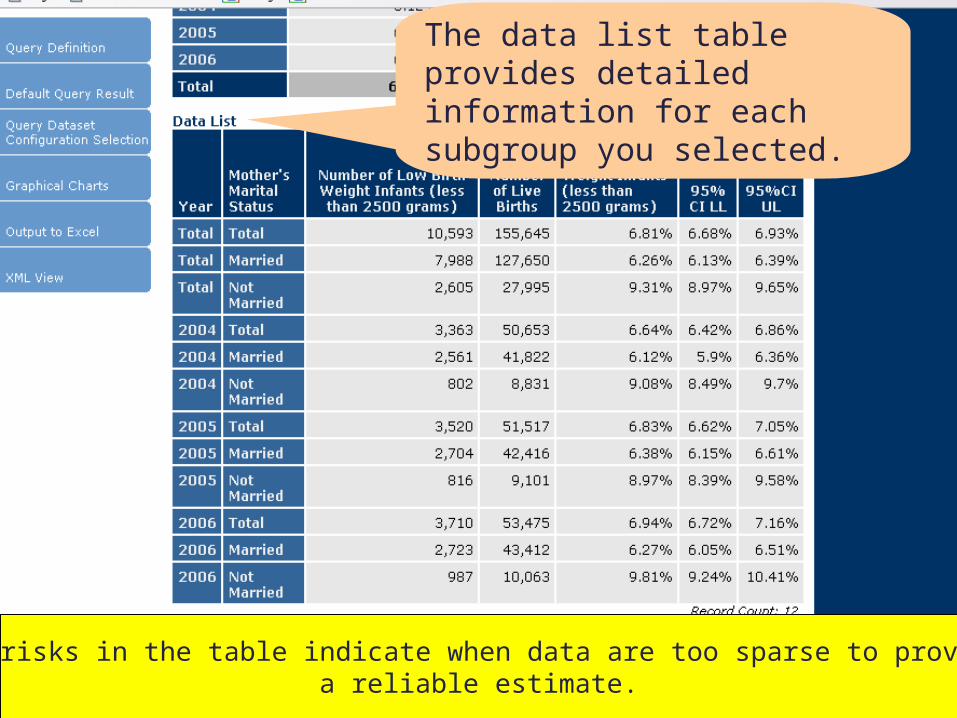
The data list table provides detailed information for each subgroup you selected.
Asterisks in the table indicate when data are too sparse to provide a reliable estimate.

Meta data (information about the data) are provided at the bottom of the results page.

The floating tool bar on the left provides several options. Query Definition takes you back to the query builder page in case you want to adjust an aspect of your query.
Default Query Result gives you the result using the default values for each step of the query.

Query Dataset Configuration Selection takes you back to the page where you can select different indicators to query.
Graphical Charts allows you to easily select a different type of graph display.
Output to Excel allows you to transfer your results to excel, but this function is still under construction.
XML View shows the page in XML format.

Selecting Help under Dataset Queries will bring you to this page where you can findvarious resources and helpful links for further information on a variety of topics.


