IBISWorld Industry Report 48111b Domestic Airlines in the US December2010 NimaSamadi On standby: Travelers will return to the skies and boost revenue as the economy recovers 2 AboutthisIndustry 2 Industry Definition 2 Main Activities 2 Similar Industries 2 Additional Resources 3 IndustryataGlance 4 IndustryPerformance 4 Executive Summary 4 Key External Drivers 5 Current Performance 9 Industry Outlook 12 Industry Life Cycle 14 Products&Markets 14 Supply Chain 14 Products & Services 15 Demand Determinants 17 Major Markets 18 International Trade 19 Business Locations 21 CompetitiveLandscape 21 Market Share Concentration 21 Key Success Factors 22 Cost Structure Benchmarks 24 Basis of Competition 25 Barriers to Entry 26 Industry Globalization 27 MajorCompanies 27 Delta Air Lines Inc. 28 United Continental Holdings Inc. 30 AMR Corporation 31 Southwest Airlines Co. 33 US Airways Group Inc. 35 OperatingConditions 35 Capital Intensity 36 Technology & Systems 37 Revenue Volatility 38 Regulation & Policy 39 Industry Assistance 40 KeyStatistics 40 Industry Data 40 Annual Change 40 Key Ratios 41 Jargon&Glossary www.ibisworld.com|1-800-330-3772 | info @ ibisworld.com
Transcript
WWW.IBISWORLD.COM� Domestic�Airlines�in�the�US December 2010 1
IBISWorld Industry Report 48111bDomestic Airlines in the USDecember�2010� Nima�Samadi
On standby: Travelers will return to the skies and boost revenue as the economy recovers
WWW.IBISWORLD.COM� Domestic�Airlines�in�the�US December 2010 2
This industry provides air transportation of passengers or cargo over regular routes on regular schedules. Network carriers operate a significant portion of their flights using at least one hub where connections are made for flights on a
spoke system. Regional carriers provide service from small cities, mostly using smaller aircraft and jets to support the network carriers’ hub and spoke systems. Airlines that transport mail are included in this industry.
The�primary�activities�of�this�industry�are
Scheduled domestic air transport
Scheduled domestic cargo/freight air transport (excluding air couriers)
Commuter domestic passenger air transport
Charter domestic passenger air transport
Scheduled domestic mail air transport
48111a International�Airlines�in�the�USThe International Airlines industry provides international air transportation of passengers and/or cargo over regular routes and on regular schedules.
48121 Nonscheduled�Air�Transportation�in�the�USThis industry provides domestic air transportation of passengers, cargo, or specialty flying services with no regular routes and regular schedules are classified.
49222 Couriers�&�Local�Delivery�Services�in�the�USLarger couriers in the US provide domestic air courier services for the market.
FOR ADDITIONAL STATISTICS AND TIME SERIES SEE THE APPENDIX ON PAGE 40
SOURCE: WWW.IBISWORLD.COM
WWW.IBISWORLD.COM� Domestic�Airlines�in�the�US December 2010 4
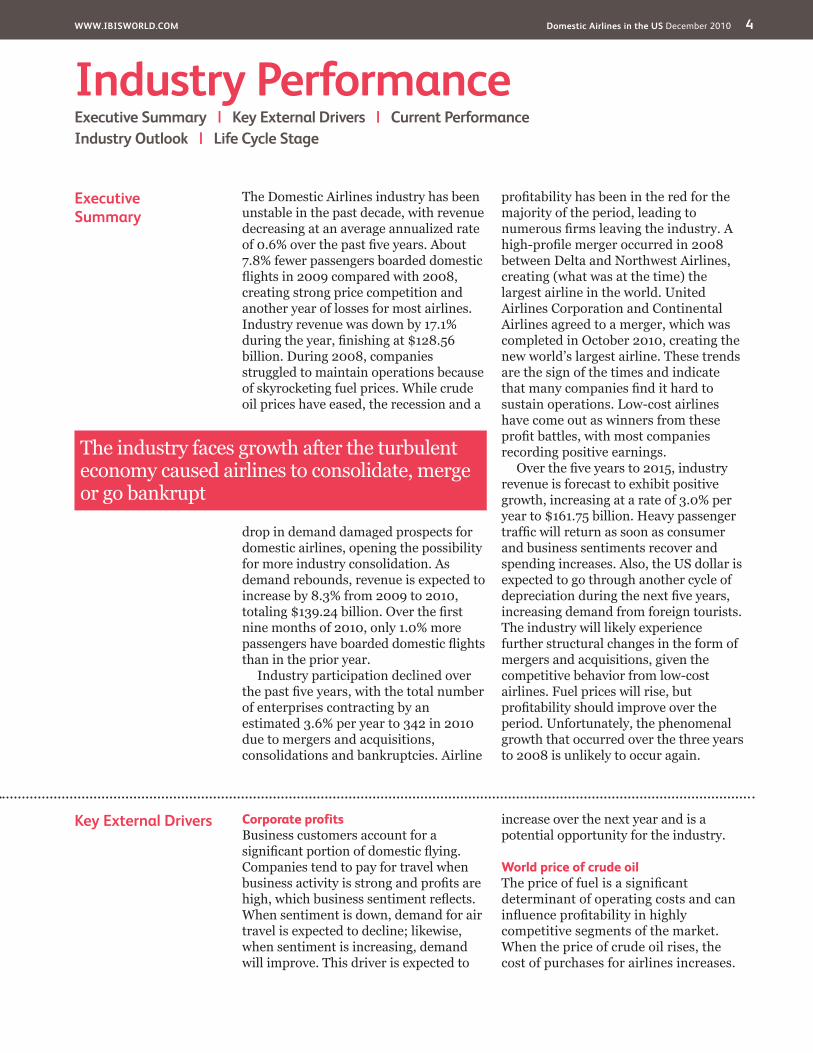
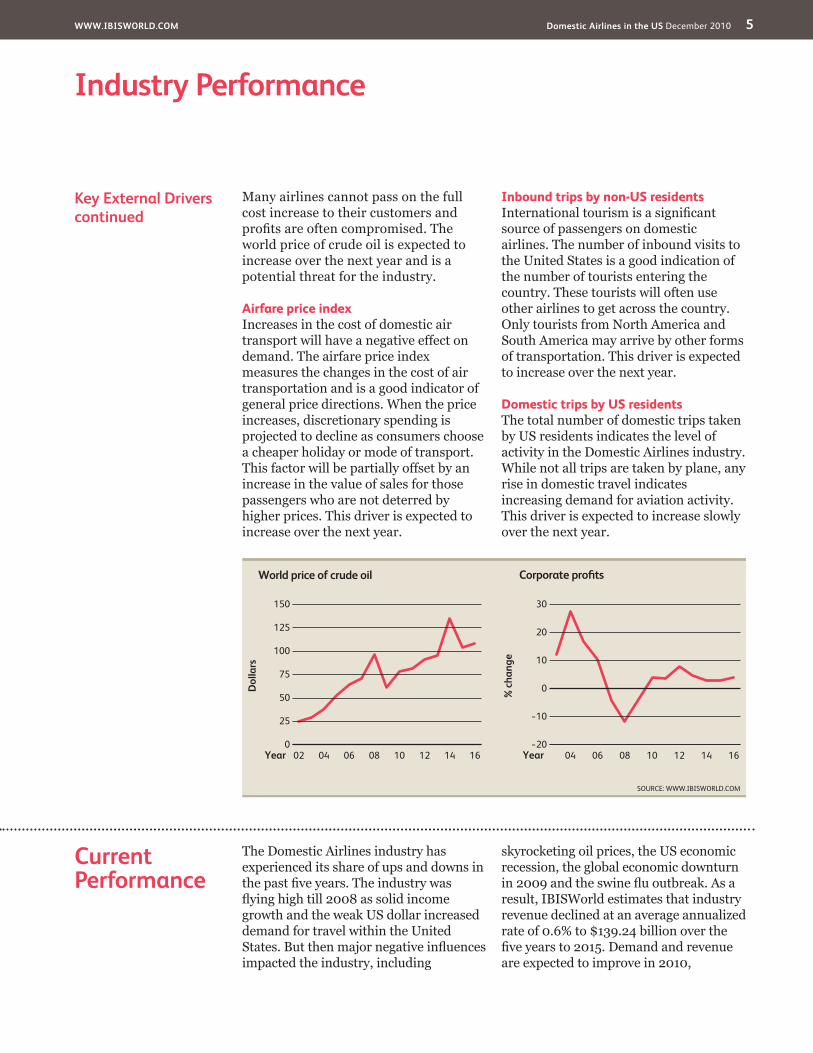
Key�External�Drivers Corporate profitsBusiness customers account for a significant portion of domestic flying. Companies tend to pay for travel when business activity is strong and profits are high, which business sentiment reflects. When sentiment is down, demand for air travel is expected to decline; likewise, when sentiment is increasing, demand will improve. This driver is expected to
increase over the next year and is a potential opportunity for the industry.
World price of crude oilThe price of fuel is a significant determinant of operating costs and can influence profitability in highly competitive segments of the market. When the price of crude oil rises, the cost of purchases for airlines increases.
Executive�Summary
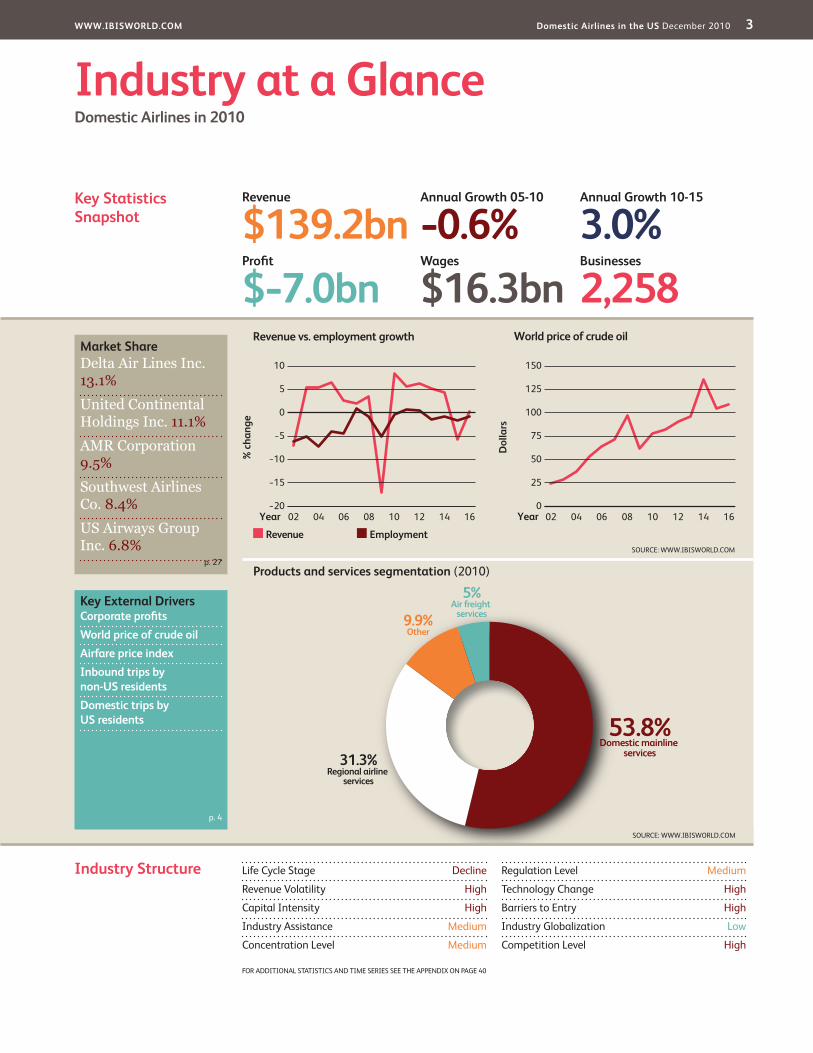
The Domestic Airlines industry has been unstable in the past decade, with revenue decreasing at an average annualized rate of 0.6% over the past five years. About 7.8% fewer passengers boarded domestic flights in 2009 compared with 2008, creating strong price competition and another year of losses for most airlines. Industry revenue was down by 17.1% during the year, finishing at $128.56 billion. During 2008, companies struggled to maintain operations because of skyrocketing fuel prices. While crude oil prices have eased, the recession and a
drop in demand damaged prospects for domestic airlines, opening the possibility for more industry consolidation. As demand rebounds, revenue is expected to increase by 8.3% from 2009 to 2010, totaling $139.24 billion. Over the first nine months of 2010, only 1.0% more passengers have boarded domestic flights than in the prior year.
Industry participation declined over the past five years, with the total number of enterprises contracting by an estimated 3.6% per year to 342 in 2010 due to mergers and acquisitions, consolidations and bankruptcies. Airline
profitability has been in the red for the majority of the period, leading to numerous firms leaving the industry. A high-profile merger occurred in 2008 between Delta and Northwest Airlines, creating (what was at the time) the largest airline in the world. United Airlines Corporation and Continental Airlines agreed to a merger, which was completed in October 2010, creating the new world’s largest airline. These trends are the sign of the times and indicate that many companies find it hard to sustain operations. Low-cost airlines have come out as winners from these profit battles, with most companies recording positive earnings.
Over the five years to 2015, industry revenue is forecast to exhibit positive growth, increasing at a rate of 3.0% per year to $161.75 billion. Heavy passenger traffic will return as soon as consumer and business sentiments recover and spending increases. Also, the US dollar is expected to go through another cycle of depreciation during the next five years, increasing demand from foreign tourists. The industry will likely experience further structural changes in the form of mergers and acquisitions, given the competitive behavior from low-cost airlines. Fuel prices will rise, but profitability should improve over the period. Unfortunately, the phenomenal growth that occurred over the three years to 2008 is unlikely to occur again.
� The industry faces growth after the turbulent economy caused airlines to consolidate, merge or go bankrupt
WWW.IBISWORLD.COM� Domestic�Airlines�in�the�US December 2010 5
Industry�Performance
Current�Performance
The Domestic Airlines industry has experienced its share of ups and downs in the past five years. The industry was flying high till 2008 as solid income growth and the weak US dollar increased demand for travel within the United States. But then major negative influences impacted the industry, including
skyrocketing oil prices, the US economic recession, the global economic downturn in 2009 and the swine flu outbreak. As a result, IBISWorld estimates that industry revenue declined at an average annualized rate of 0.6% to $139.24 billion over the five years to 2015. Demand and revenue are expected to improve in 2010,
Key�External�Driverscontinued
Many airlines cannot pass on the full cost increase to their customers and profits are often compromised. The world price of crude oil is expected to increase over the next year and is a potential threat for the industry.
Airfare price indexIncreases in the cost of domestic air transport will have a negative effect on demand. The airfare price index measures the changes in the cost of air transportation and is a good indicator of general price directions. When the price increases, discretionary spending is projected to decline as consumers choose a cheaper holiday or mode of transport. This factor will be partially offset by an increase in the value of sales for those passengers who are not deterred by higher prices. This driver is expected to increase over the next year.
Inbound trips by non-US residentsInternational tourism is a significant source of passengers on domestic airlines. The number of inbound visits to the United States is a good indication of the number of tourists entering the country. These tourists will often use other airlines to get across the country. Only tourists from North America and South America may arrive by other forms of transportation. This driver is expected to increase over the next year.
Domestic trips by US residentsThe total number of domestic trips taken by US residents indicates the level of activity in the Domestic Airlines industry. While not all trips are taken by plane, any rise in domestic travel indicates increasing demand for aviation activity. This driver is expected to increase slowly over the next year.
% c
hang
e
30
−20
−10
0
10
20
1604 06 08 10 12 14Year
Corporate profits
SOURCE: WWW.IBISWORLD.COM
Dol
lars
150
0
25
50
75
100
125
1602 04 06 08 10 12 14Year
World price of crude oil
WWW.IBISWORLD.COM� Domestic�Airlines�in�the�US December 2010 6
Industry�Performance
Current�Performancecontinued
however, as the economy begins to recover and consumers and business customers loosen their pocketbooks and travel more.
The industry is cyclical and sensitive to a number of key drivers, the most prominent of which is the world price of crude oil. The price of oil had the industry in disarray throughout 2008 as it climbed to $147 a barrel in July. This price increase sent many airlines into damage control, reducing services and employment. Other drivers include business sentiment and corporate profits, which have acted together with high oil prices in constricting the industry with the advent of the subprime mortgage
crisis and financial market issues. Poor economic conditions over 2008 and 2009 reduced demand for business travel, particularly from the finance sector, which experienced high-profile bankruptcies and government bailouts. The total number of domestic trips made by US residents was also down in 2009 as households cut back on discretionary spending. Although international tourism has been a solid source of demand for travel across the United States in the past, a global slowdown in 2009 and a recovery of the US dollar decreased the number of inbound tourists during the year. The number of inbound tourist visits has grown in 2010.
To�fly�or�not�to�fly The Domestic Airlines industry experienced a drop in the number of passengers boarding their planes after the September 11th terrorist attacks of 2001, and the same effect occurred during the global financial crisis of 2008 and 2009. Passenger numbers fell by 5.1% and 7.8%, respectively. Many Americans have chosen not to fly during the recession, including individuals, households and businesses. Both consumer and business sentiment were low during 2009, resulting in less spending on vacations, trips and business travel.
During this period, fewer foreign tourists visited the United States, with poor global economic conditions and recovery in the US dollar. The total
number of inbound visitors declined by 35.0% during 2009, leaving the industry struggling. To make matters worse, an outbreak of the swine flu scared people from using air travel as their first option of transportation. To attract business, operators engaged in price wars and cut prices significantly. Industry revenue declined by 17.1% in 2009, with prices and demand sloping downward.
Crippling�oil�prices Before the global downturn in air travel crippled the industry, the movement of world oil prices significantly affected the industry. The nominal price of crude oil increased at an annualized rate of 26.2% over the five years to 2008. It reached $147 per barrel in July 2008, averaging
$99.50 during the year, a 37.7% increase compared with the $72.30 average in 2007. The Air Transport Association (ATA) estimates that for every dollar increase in the price of jet fuel (a derivative product of crude oil), the US airlines industry (domestic and
� Low consumer sentiment and discretionary income have led to fewer airline passengers
WWW.IBISWORLD.COM� Domestic�Airlines�in�the�US December 2010 7
Industry�Performance
Crippling�oil�pricescontinued
international) incurs an additional $445 million in fuel expenses. Based on year-to-date figures, many airlines experienced a 50.0% increase on their fuel bills over the span of just one year. The price of crude oil plummeted in the span of a few months after August 2008, averaging about $40 per barrel by the end of the year. Since the beginning of 2009, prices have been nearly half of what they were in the year prior, creating some relief for airlines. Some industry operators hedged their fuel contracts at higher prices, however, and are still paying.
The consequences of these prices have been severe for the industry. In 2008, a number of airlines ceased operations, Delta Airlines and Northwest Airlines merged and airlines increased code-sharing arrangements in order to reduce costs. In 2010, United Airlines and Continental Airlines merged for many of the same reasons. These mergers provided significant cost advantages for the operation of both airlines as one company; however, they needed approval from many different regulatory bodies and to pass an antitrust review by the Department of Justice. Many of the top airlines in the industry have responded
by reducing services and aircraft fleet sizes, introducing new fees and higher fuel surcharges and reducing the number of people employed. Even with the price of fuel cut significantly in 2009, these measures remained in place during the year because of the sharp decline in demand for travel, which can be as damaging for operators as high costs.
Some airlines have fared better than others during the crisis, particularly those airlines with strong fuel-hedging strategies, such as Southwest Airlines. The volatility in the price of oil forced airlines to more actively hedge their fuel requirements than may have previously been the case. Airline profits were savaged in 2008, indicating the risk of not hedging. High fuel prices claimed six victims in the run up to 2008, with Frontier Airlines, ATA Airlines, Aloha Airlines, Champion Air, Skybus Airlines and Eos Airlines all entering Chapter 11 bankruptcy protection.
Airlines�making�money�on�fees
Since May 2008, airlines have increasingly used higher fees to recover some of the expenses lost in their bulging fuel bills. This trend continued throughout 2009 as revenue was hit by low passenger numbers. Additional charges have focused on forcing passengers to pay more to check in additional baggage, which can cost $50 or more each way, leading to a lack of pricing transparency in the industry. Airfares are quoted online without including these additional costs, and passengers are lured into purchasing
seats by comparing airline airfares rather than the total costs. Some airlines have introduced additional fees for bringing small pets onboard, attempting to expand the service they offer at a higher cost to the passenger. For most of the major players, revenue from additional fees and charges increased during 2009, compared to falling revenue from passenger tickets and cargo. According to the US Department of Transportation, in the first nine months of 2010, airlines made $4.3 billion from these fees.
� Companies struggled to maintain profitability as the price of crude oil rose
WWW.IBISWORLD.COM� Domestic�Airlines�in�the�US December 2010 8
Industry�Performance
Airlines�flying�away IBISWorld estimates that the total number of enterprises operating in the industry will decline at 3.6% per year over the five years to 2010. Some companies found the industry too costly to operate in, while others strategically merged in order to create a more powerful entity. Airline industry consolidation has gone on for years, particularly because of the competitive behavior by low-cost airlines. Southwest Airlines is the largest US airline based on the number of passengers, indicating that consumers are increasingly choosing
cheaper options. With smaller airlines winning the traffic from larger companies, operators have had to restructure operations in order to achieve cheaper prices without compromising profitability. Not surprisingly, some companies left the industry.
The total number of establishments is also expected to fall over the five years to 2010, declining by 1.7% per year to 2,258. Consolidation has led to closures of less profitable establishments (including hubs), while those companies that declared bankruptcies have lost all
Revenue�and�profit�are�down
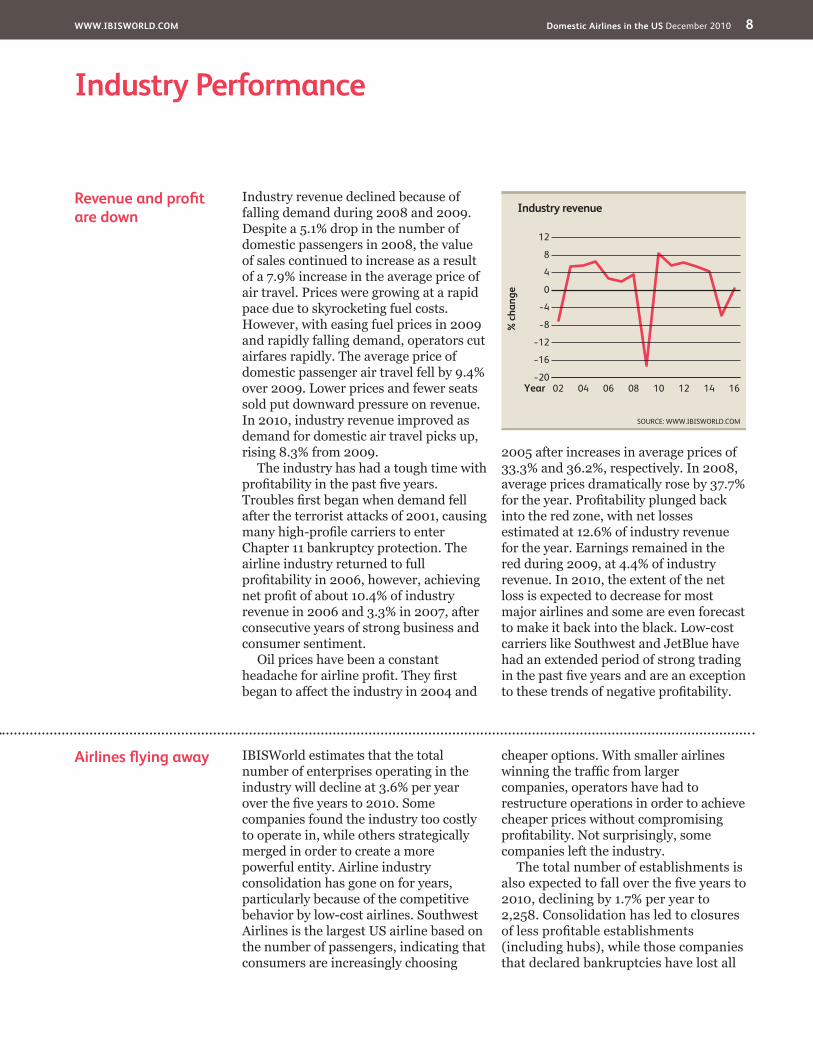
Industry revenue declined because of falling demand during 2008 and 2009. Despite a 5.1% drop in the number of domestic passengers in 2008, the value of sales continued to increase as a result of a 7.9% increase in the average price of air travel. Prices were growing at a rapid pace due to skyrocketing fuel costs. However, with easing fuel prices in 2009 and rapidly falling demand, operators cut airfares rapidly. The average price of domestic passenger air travel fell by 9.4% over 2009. Lower prices and fewer seats sold put downward pressure on revenue. In 2010, industry revenue improved as demand for domestic air travel picks up, rising 8.3% from 2009.
The industry has had a tough time with profitability in the past five years. Troubles first began when demand fell after the terrorist attacks of 2001, causing many high-profile carriers to enter Chapter 11 bankruptcy protection. The airline industry returned to full profitability in 2006, however, achieving net profit of about 10.4% of industry revenue in 2006 and 3.3% in 2007, after consecutive years of strong business and consumer sentiment.
Oil prices have been a constant headache for airline profit. They first began to affect the industry in 2004 and
2005 after increases in average prices of 33.3% and 36.2%, respectively. In 2008, average prices dramatically rose by 37.7% for the year. Profitability plunged back into the red zone, with net losses estimated at 12.6% of industry revenue for the year. Earnings remained in the red during 2009, at 4.4% of industry revenue. In 2010, the extent of the net loss is expected to decrease for most major airlines and some are even forecast to make it back into the black. Low-cost carriers like Southwest and JetBlue have had an extended period of strong trading in the past five years and are an exception to these trends of negative profitability.
% c
hang
e
12
−20
−16
−12
−8
−4
0
4
8
1602 04 06 08 10 12 14Year
Industry revenue
SOURCE: WWW.IBISWORLD.COM
WWW.IBISWORLD.COM� Domestic�Airlines�in�the�US December 2010 9
Industry�Performance
Airlines�flying�awaycontinued
their facilities. Employment has followed the same trend, with employee numbers decreasing by 2.0% annually to 309,385. Aside from downsizing and facility closures, staff layoffs have
occurred because of the struggle to get profit under control during rising oil prices. Similar conditions persisted in 2009, with 5.1% of the workforce losing their job.
Slow�flight�to�the�top Ticket sales are projected to be up in 2010, with growth in prices and air transport traffic also forecast. Macroeconomic indicators that will push for this marginal recovery include a positive outlook for consumer and business sentiment during the year, favorable disposable income growth and a depreciation of the US dollar. Global conditions will improve as well, leading to an increase in demand for travel to the United States. The weaker dollar and rising incomes in developing nations will positively affect the Domestic Airlines industry by attracting tourists to the United States. In the latter part of the
five years to 2015, revenue will grow by 4.0% to 7.0% per year. This growth will be supported by an even stronger recovery in US macroeconomic indicators, such as sentiment, income and consumer expenditure. The US dollar will continue to fall until the end of 2013, which will create more demand for travel across the United States and deter US residents from flying overseas. Airfare will likely continue to increase over the years, pressured by the weak US dollar, growing demand and rising fuel costs. When the US dollar is weak, operators increase prices in order to offset the decline in the exchange rate.
Industry�Outlook
The Domestic Airlines industry will spend the next five years playing catch up after suffering at the hands of the recession in 2009. IBISWorld forecasts that revenue will increase at an annualized rate of 3.0% over the five years to 2015, reaching $161.75 billion, with industry revenue expected to grow 5.7% to $147.17 billion in 2011. Industry drivers all point to a recovery during 2011 and continued growth in the next five years. Airfare will begin to increase in 2011, with slightly higher passenger numbers. Consumer and business confidence are expected to be up during the year, supporting demand for air travel. Fuel prices will remain subdued in 2010 and most of 2011, causing the industry to experience some relief after
years of losses. In the five years after 2010, global and domestic demand for travel across the United States is expected to rise, while a weaker US dollar will deter US residents from traveling overseas and increase domestic traffic. Low-cost airlines are expected to gain a higher share of revenue in the future, with competitive pressures leading to structural changes and consolidation in the industry.
� Revenue is forecast to grow 3.0% annually to 2015, as consumer and business travelers return
WWW.IBISWORLD.COM� Domestic�Airlines�in�the�US December 2010 10
Industry�Performance
Participation�continues�to�trickle�down
IBISWorld expects that further consolidation will occur among industry airlines. Mergers and acquisitions may occur during the recovery period as some operators find it more difficult to recover than others. Low-cost airlines weathered the storm in 2009 and are in a favorable position in 2010, so they may purchase some smaller regional operators as a result. The total number of
establishments is projected to decline over the next five years at 0.3% per year to 2,228, and employment will likely contract by 0.6% per year to 300,728. Average revenue per establishment is expected to be up from $450 million in 2010 to $583 million in 2015. This increase indicates that market power per company and market share concentration will grow.
Future�trends The industry is working with the US government to develop a group insurance vehicle called Equitime that will provide war and terrorism risk insurance protection for participating US airlines. Equitime is intended to help US airline industries fund substantial
The�bottom�line�saved
The industry is expected to return to profitability over the next year or two, and additional fees and charges will continue to be the main method to offset weak demand and oil price volatility. Despite the large drop in oil prices, companies will extensively implement hedging strategies as another profit protection tool. The volatility of oil brought the benefits of successful risk management strategies like hedging to the forefront of airline executives’ minds.
Profit will reach about 8.5% of industry revenue by the end of 2012, but fall back to 3.2% losses by the end of 2014. Earnings growth will rely on the continued stabilization of oil prices and return of demand to both the business and private traveler segments. Merger and acquisition activity will likely increase in response to the challenges facing the industry. Net loss is expected to occur in 2015 because of an increase in restructuring activity that will likely
occur after a few years of increasing demand. When demand begins to stave off around 2013 and 2014, IBISWorld expects major players to increase spending on changing services to align with shifting demand. Demand will likely slow at the end of the five-year period because of the cyclical nature of consumption spending in the economy.
Rising profit before 2015 is expected to increase the level of future investments for this industry. Major regional carriers, such as US Airways, Southwest Airlines and JetBlue, have already ordered new planes and are awaiting delivery, but some airlines will delay short-term delivery of these aircrafts. Technological developments in aircraft manufacturing will continue to provide faster and more fuel-efficient models that will improve the competitiveness of the operator using them. In times of growing demand, airlines will tend to place orders for new aircraft.
� IBISWorld forecasts a move toward safer flying as airlines implement war and terrorism risk insurance
WWW.IBISWORLD.COM� Domestic�Airlines�in�the�US December 2010 11
Industry�Performance
Future�trendscontinued
war and terrorism risk insurance, relying on the federal government to reinsure for catastrophe liability protection until other viable insurance alternatives develop or Equitime becomes financially self-sufficient. The start-up of Equitime is contingent upon agreement with the Federal Aviation Administration for catastrophe reinsurance and broad participation by US airlines as investors.
Airlines have been actively cutting the number of routes on their networks in
order to control costs and focus their operations on more profitable routes. If fuel costs remain in the current trading ranges, this trend of network reduction will become more prevalent, with a trip across the country likely to involve a stopover at a more centralized hub for travelers. The industry will continue to charge additional fees for baggage and extra services as a means of protecting profits while fuel costs are high, with airlines expected to continue to innovate when it comes to charging for services.
WWW.IBISWORLD.COM� Domestic�Airlines�in�the�US December 2010 12
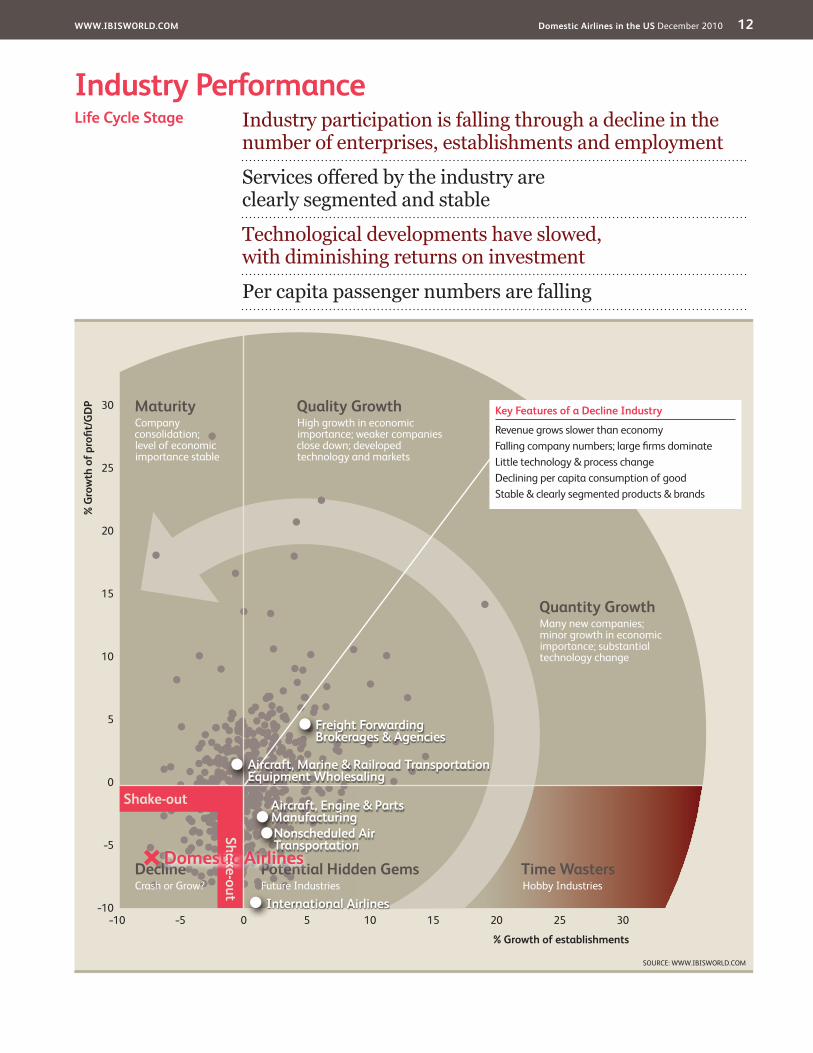
Industry�PerformanceIndustry participation is falling through a decline in the number of enterprises, establishments and employment
Services offered by the industry are clearly segmented and stable
Technological developments have slowed, with diminishing returns on investment
Per capita passenger numbers are falling
Life�Cycle�Stage
SOURCE: WWW.IBISWORLD.COM
30
25
20
15
10
5
0
–5
–10–10 100 20–5 155 25 30
%�G
row
th�o
f�pro
fi�t/G
DP
%�Growth�of�establishments
DeclineCrash or Grow?
Potential�Hidden�GemsFuture Industries
Quality�GrowthHigh growth in economic importance; weaker companies close down; developed technology and markets
Time�WastersHobby Industries
MaturityCompany consolidation;level of economic importance stable
Shake-out
Shake-out
Quantity�GrowthMany new companies; minor growth in economic importance; substantial technology change
Key�Features�of�a�Decline�Industry
Revenue grows slower than economyFalling company numbers; large fi rms dominateLittle technology & process changeDeclining per capita consumption of goodStable & clearly segmented products & brands
WWW.IBISWORLD.COM� Domestic�Airlines�in�the�US December 2010 13
Industry�Performance
Industry�Life�Cycle The Domestic Airlines industry in the US has been declining since 2001. Major changes in the life cycle occurred when the US airline industry was struck by the September 11 terrorist attacks. Over the ten years to 2015, industry revenue has under performed compared to GDP. Industry revenue is expected to grow at an average rate of 1.2% per year, while GDP is expected to grow at a rate of 1.9% per year over the same period.
Domestic air transport services have remained relatively unchanged over the past five years. The number of new routes offered as increased, however, growth has been slow. There is very little scope to expand services due to strong competition from mainline and regional providers. This has resulted in worsening operating conditions for most airlines, particularly during strong cost pressures with high fuel prices. As a result, industry profitability has been very volatile over the past five years and mainly in the red. This had led to an increase in merger and acquisition activity, with a major merger of two major players having occurred in 2008. As a result, Delta Air Lines increased its market share in the industry and became the largest airline in the world (at the time). In October 2010, United Airlines Corporation and Continental Airlines also closed to a merger which vaulted them to becoming the largest airline in the world.
Consolidation has occurred among smaller operators as well. Total number of enterprise is expected to decline at 3.6% per year to 342 over the five years to 2010. Total number of establishments
will also contract at 1.7% per year to 2,258. This is mainly because of merging of operations and smaller operators with fewer facilities leaving the industry through bankruptcy or poor earnings.
Technological upgrades in the industry have slowed. While companies are spending generously on new aircraft and machinery, the level of change from the previous models is declining. This is due to an already high level of technological advancements in the industry and little scope for change. In the past five years, there has been in increase in the focus on fuel efficient technology and cost reduction machinery. While technological upgrades are a consistent source of investment for airlines, benefits from each upgrade are slowing. This has restricted the industry from entering new and untapped markets and from growing at a rapid rate.
Total number of passengers boarding domestic flights decreased at an annualized rate of 1.3% over the five years to 2009. Compared to positive growth in population, this represents a contraction in per capita consumption of air transportation. A major decline in passenger numbers was in 2009, with numbers falling by an estimated 7.8%. Passenger numbers were down in 2008 as well, when the economy began to significant feel the effects of a downturn. Prior to 2008, passenger numbers were increasing at 4.1% per year (five year average in 2007), which is solid growth for a declining industry. Future expansions in numbers are expected to be more in line with population growth.
�This industry is Declining
WWW.IBISWORLD.COM� Domestic�Airlines�in�the�US December 2010 14
Products�&�Services
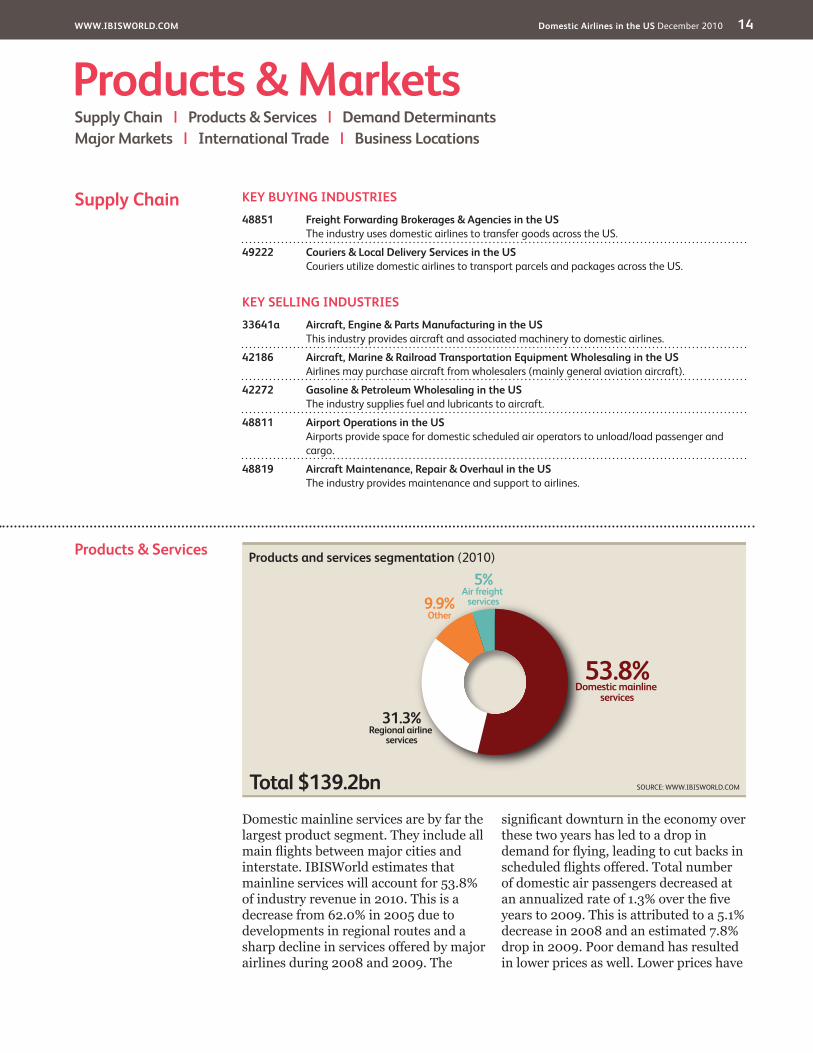
Domestic mainline services are by far the largest product segment. They include all main flights between major cities and interstate. IBISWorld estimates that mainline services will account for 53.8% of industry revenue in 2010. This is a decrease from 62.0% in 2005 due to developments in regional routes and a sharp decline in services offered by major airlines during 2008 and 2009. The
significant downturn in the economy over these two years has led to a drop in demand for flying, leading to cut backs in scheduled flights offered. Total number of domestic air passengers decreased at an annualized rate of 1.3% over the five years to 2009. This is attributed to a 5.1% decrease in 2008 and an estimated 7.8% drop in 2009. Poor demand has resulted in lower prices as well. Lower prices have
48851� Freight�Forwarding�Brokerages�&�Agencies�in�the�US�The industry uses domestic airlines to transfer goods across the US.
49222� Couriers�&�Local�Delivery�Services�in�the�US�Couriers utilize domestic airlines to transport parcels and packages across the US.
KEY�SELLING�INDUSTRIES
33641a� Aircraft,�Engine�&�Parts�Manufacturing�in�the�US�This industry provides aircraft and associated machinery to domestic airlines.
42186� Aircraft,�Marine�&�Railroad�Transportation�Equipment�Wholesaling�in�the�US�Airlines may purchase aircraft from wholesalers (mainly general aviation aircraft).
42272� Gasoline�&�Petroleum�Wholesaling�in�the�US�The industry supplies fuel and lubricants to aircraft.
48811� Airport�Operations�in�the�US�Airports provide space for domestic scheduled air operators to unload/load passenger and cargo.
48819� Aircraft�Maintenance,�Repair�&�Overhaul�in�the�US�The industry provides maintenance and support to airlines.
Supply�Chain
Products and services segmentation (2010)
Total $139.2bn
53.8%Domestic mainline
services
31.3%Regional airline
services
9.9%Other
5%Air freight
services
SOURCE: WWW.IBISWORLD.COM
WWW.IBISWORLD.COM� Domestic�Airlines�in�the�US December 2010 15
Products�&�Markets
DemandDeterminants
Demand for domestic air travel is dependent on many factors, most of which are economic influences on consumers, both private and corporate. Air transportation activity increases when the number of passengers grows and demand for freight increases. Main economic factors influencing a consumer’s choice to fly domestically, or
send cargo, include consumer and business sentiment, corporate profits and disposable incomes, exchange rates and airfares. Other considerations taken into account are also consumer preferences, the size of the country and population density, leisure time availability and competition from substitutes such as cars.
Products�&�Servicescontinued
contributed to a contraction in the value of revenue received from such services.
Regional airlines service particular regions within the US, filling niche markets that the major and national airlines may overlook. This segment also provides services to low-use routes and is often important to small and isolated communities. These commuter airlines are sometimes subsidiaries of the major airline or fly under a code sharing agreement. Regional carriers’ roles are primarily to bring passengers to the major hubs where they can connect on a long distance flight operated by mainline carriers. They are also known as feeder airlines. Revenue from regional flights has been increasing over the past five years. Approximately 25.4% of sales were regional flights in 2004, increasing to an estimated 31.3% in 2010. Consumers have turned to travel within the state or to less distant locations in order to save on costs, increasing demand for regional flights.
The air freight segment (including mail transportation) has been increasing steadily over the past ten years as packaging innovation and increased capacity attracted demand, notwithstanding increasing fuel costs. However, during 2008 and 2009, demand for cargo has declined substantially. Low consumer spending has decreased commercial cargo while households and individuals are sending
less freight, unless necessary. Revenue ton miles (miles traveled carrying a ton of freight) decreased by 4.5% in 2008 and a further 9.4% in 2009. As such, revenue from cargo will contract from 6.1% of industry revenue in 2005 to 5% in 2010.
Other revenue streams for domestic airlines include commuter and charter air transport, excess baggage charges, reservation cancellation fees, scheduled sightseeing tours and similar services/charges. Commuter carriers are regional airlines, or air taxi operators, that carry passengers on at least five round trips per week on a minimum of one route between two or more points according to its published flight schedules (which specify the times, days of the week and places between which those flights are performed). These flights accounted for 2.6% of industry revenue in 2010, increasing slightly from 2.7% in 2005. Scheduled charter flights are very rare (usually unscheduled), accounting for 0.8% of revenue.
Other charges have increased as a percentage of revenue over the past five years. While poor demand conditions have led to price cuts by major airlines, these charges have remained at the same level, increasing as a contribution to revenue from 6.4% in 2005. Airlines have also increased additional charges on items such as excess baggage and cancellation fees, to make up for loss in revenue on ticket sales.
WWW.IBISWORLD.COM� Domestic�Airlines�in�the�US December 2010 16
Products�&�Markets
DemandDeterminantscontinued
Leisure travelLeisure travel includes air transportation for the purpose of a vacation, visiting friends and family, moving house or similar non-business related activities. Demand for these activities is generally closely linked to disposable incomes and leisure time availability. When personal or household disposable income is experiencing favorable growth, more consumers tend to spend money on discretionary items such as vacations and visits interstate. Also, persons who have more free time away from work tend to increase their travel, e.g. retirees. Airfares also play a role, as cheaper prices tend to attract more potential passengers. However, if prices are increasing at a slower rate compared to income growth, consumers will generally not be deterred from flying. Exchange rates play in role in that they either make domestic travel more affordable compared to flying off-shore, or the either way around; an appreciating US dollar makes travel overseas relatively cheaper.
Other factors contributing to demand for leisure air transportation include the location of the consumer and population density in the area, as well as consumer preferences. Persons and households who live in remote areas tend to fly more out of necessity, and these locations are usually poorly populated. The US covers a large area of land and the most convenient way of transport from one end to the next is flying. Consumer preferences affect demand for air transport through consumers choosing their favorite mode of transport and choosing whether to go on vacation domestically or internationally. When people are more willing to fly rather than drive or catch a train, this increased demand for domestic airlines. Also, domestic vacation preferences help the industry.
Business travelBusiness travelers are much less responsive to price changes than they are to corporate profits and business sentiment. Demand for business travel tends to rise when corporate activity in the country increases and profits are performing favorably. This generates more need to visit other business locations or to attend conferences. However, when profits are falling and sentiment is down, business travel is usually on the chopping block for companies.
In this age of technological developments, competition from substitutes such as video conferencing is on the rise. As such, demand for business travel and therefore air transpiration is dependent on developments in the communications industry and the future need for businessmen to physically move from one location to the next.
Cargo transportationDemand determinants of air cargo include the level of high value time-sensitive imports and exports, air freight rates which are influenced by operating costs and capacity, and innovation in shipping and packaging technology. It is more profitable to ship products via air that are time sensitive and have a high value to weight ratio. Electronics and high end products are usually transported by air to reach the market in a fast and efficient manner due to the rapid change in technology. Time to market is important which could influence the demand for these products. Many carriers are also certified to handle dangerous goods such as explosives, gases, flammable liquids, toxic and infectious substances and radioactive materials. Consumer sentiment will affect demand for these time sensitive products to be transported; when sentiment is down, consumption tends to
WWW.IBISWORLD.COM� Domestic�Airlines�in�the�US December 2010 17
Products�&�Markets
Major�Markets
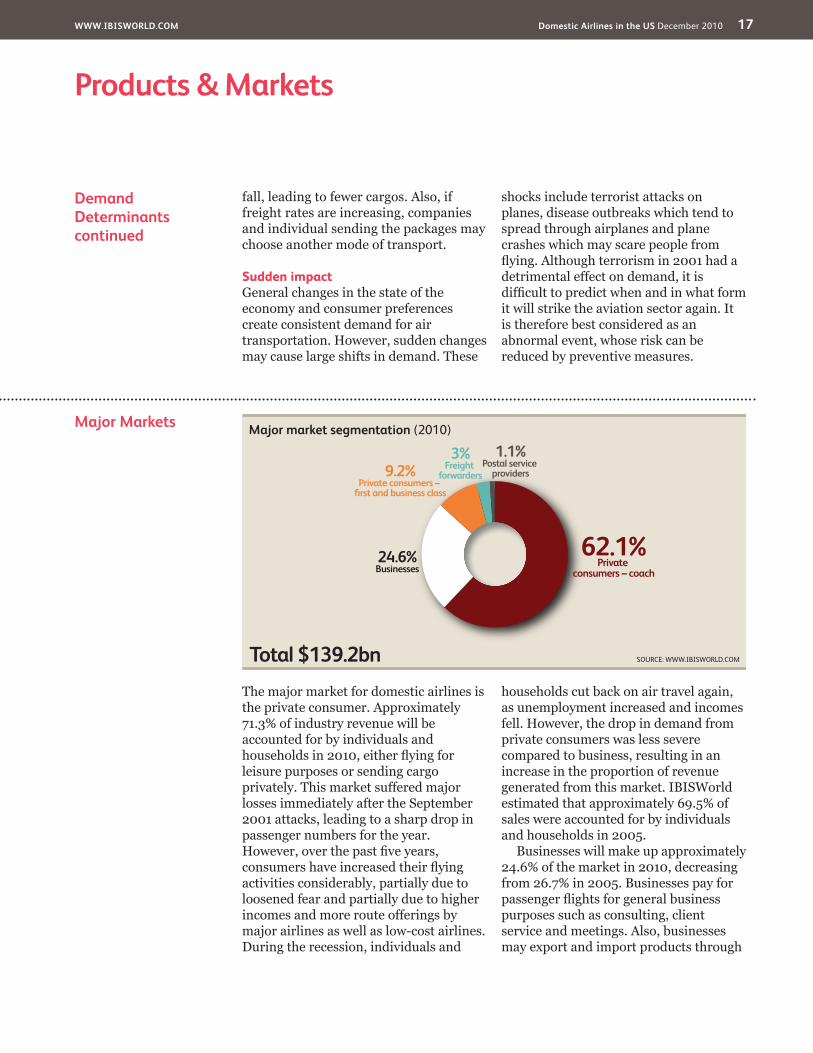
The major market for domestic airlines is the private consumer. Approximately 71.3% of industry revenue will be accounted for by individuals and households in 2010, either flying for leisure purposes or sending cargo privately. This market suffered major losses immediately after the September 2001 attacks, leading to a sharp drop in passenger numbers for the year. However, over the past five years, consumers have increased their flying activities considerably, partially due to loosened fear and partially due to higher incomes and more route offerings by major airlines as well as low-cost airlines. During the recession, individuals and
households cut back on air travel again, as unemployment increased and incomes fell. However, the drop in demand from private consumers was less severe compared to business, resulting in an increase in the proportion of revenue generated from this market. IBISWorld estimated that approximately 69.5% of sales were accounted for by individuals and households in 2005.
Businesses will make up approximately 24.6% of the market in 2010, decreasing from 26.7% in 2005. Businesses pay for passenger flights for general business purposes such as consulting, client service and meetings. Also, businesses may export and import products through
DemandDeterminantscontinued
fall, leading to fewer cargos. Also, if freight rates are increasing, companies and individual sending the packages may choose another mode of transport.
Sudden impactGeneral changes in the state of the economy and consumer preferences create consistent demand for air transportation. However, sudden changes may cause large shifts in demand. These
shocks include terrorist attacks on planes, disease outbreaks which tend to spread through airplanes and plane crashes which may scare people from flying. Although terrorism in 2001 had a detrimental effect on demand, it is difficult to predict when and in what form it will strike the aviation sector again. It is therefore best considered as an abnormal event, whose risk can be reduced by preventive measures.
Major market segmentation (2010)
Total $139.2bn
62.1%Private
consumers – coach24.6%Businesses
9.2%Private consumers –
first and business class
3%Freight
forwarders
1.1%Postal service
providers
SOURCE: WWW.IBISWORLD.COM
WWW.IBISWORLD.COM� Domestic�Airlines�in�the�US December 2010 18
Products�&�Markets
International�Trade The Domestic Airlines industry has no imports or exports. In the absence of foreign trade, domestic demand equals industry revenue, which is estimated at $139.24 billion in 2010.
Major�Marketscontinued
air cargo. The Travel Industry Association of America (TIA) reported that one in five business person-trips are taken for the primary purpose of attending a convention, conference or seminar; one-third of business person-trips are made by those traveling for combined business and pleasure purposes; one-third of business person-trips include air transportation; one in six business trips include multiple adults from the same household; and 10% of business trips include children under 18. Business travelers usually pay a premium for their tickets (business class) because payment is usually made under the company’s account or as mentioned above through last minute bookings that attract a higher price. Although business travel has grown strongly in the last five years, this segment was placed under increasing pressure in 2008 and 2009, as companies tightened their expenditure. Many companies are choosing to fly their employees in economy class as a means to saving on airfares, with many more choosing to abandon all non-essential business travel. This has resulted in the
shrinking of the business market for industry operators.
Freight forwarders organize transportation or air cargo for its customers, which include businesses, individuals and households. Over the five years to 2010, even with a significant drop in demand for air cargo transportation, the freight forwarders market has grown. This is largely due to the increasing trend of outsourcing which has increased demand for most agent type businesses. Freight forwarders accounted for 2.5% of industry revenue in 2005.
Postal service providers have always been a small market for the industry, and they have shrunk further over the past five years. Mail transportation has declined due to the internet, even though some offsets have been made by online shopping. During 2008 and 2009, both freight and mail experienced a significant decline in volumes as consumers spend less and online shopping contracts. As such, postal services will account for a smaller share of revenue compared to 1.3% in 2005.
WWW.IBISWORLD.COM� Domestic�Airlines�in�the�US December 2010 19
WWW.IBISWORLD.COM� Domestic�Airlines�in�the�US December 2010 20
�Products�&�Markets
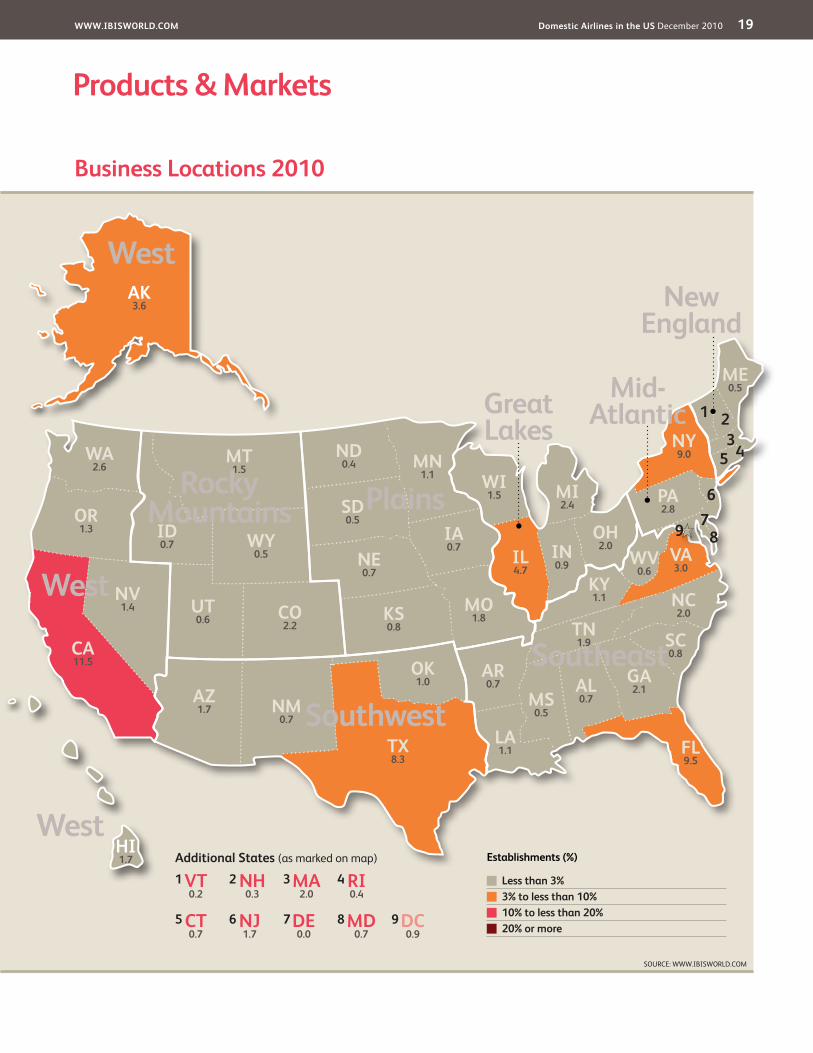
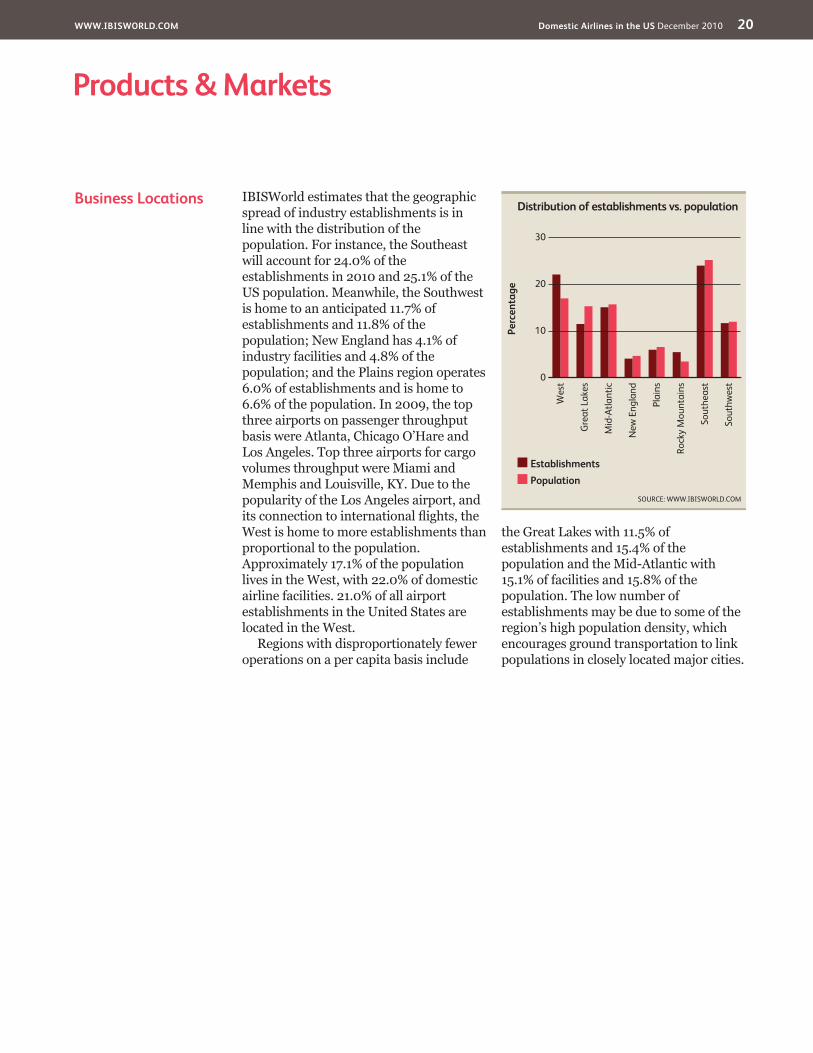
Business�Locations IBISWorld estimates that the geographic spread of industry establishments is in line with the distribution of the population. For instance, the Southeast will account for 24.0% of the establishments in 2010 and 25.1% of the US population. Meanwhile, the Southwest is home to an anticipated 11.7% of establishments and 11.8% of the population; New England has 4.1% of industry facilities and 4.8% of the population; and the Plains region operates 6.0% of establishments and is home to 6.6% of the population. In 2009, the top three airports on passenger throughput basis were Atlanta, Chicago O’Hare and Los Angeles. Top three airports for cargo volumes throughput were Miami and Memphis and Louisville, KY. Due to the popularity of the Los Angeles airport, and its connection to international flights, the West is home to more establishments than proportional to the population. Approximately 17.1% of the population lives in the West, with 22.0% of domestic airline facilities. 21.0% of all airport establishments in the United States are located in the West.
Regions with disproportionately fewer operations on a per capita basis include
the Great Lakes with 11.5% of establishments and 15.4% of the population and the Mid-Atlantic with 15.1% of facilities and 15.8% of the population. The low number of establishments may be due to some of the region’s high population density, which encourages ground transportation to link populations in closely located major cities.
Perc
enta
ge
30
0
10
20
Sout
hwes
t
Wes
t
Gre
at L
akes
Mid
-Atla
ntic
New
Eng
land
Plai
ns
Rock
y M
ount
ains
Sout
heas
t
EstablishmentsPopulation
Distribution of establishments vs. population
SOURCE: WWW.IBISWORLD.COM
WWW.IBISWORLD.COM� Domestic�Airlines�in�the�US December 2010 21
Key�Success�Factors Optimum capacity utilizationAirlines need to have the ability to match certain aircraft with certain routes for better utilization. The use of code-sharing agreements is also valuable to the operation of domestic airlines.
Prompt delivery to marketCompetition is fierce in this industry. The inability to deliver services on time may result in the loss of customers.
Well developed internal processesDomestic airlines require reservation systems and e-commerce products that
provide good access for clients to the services provided.
Effective cost controlsCost-control systems can help manage yields better and increase earnings. This is particularly important in times of operational uncertainty, as is currently the case with highly volatile fuel prices.
Ability to expand and curtail operations rapidly in line with market demandHaving flexible capacity to meet troughs and peaks in demand is vital to profitability in the industry. Airlines must
Market�Share�Concentration
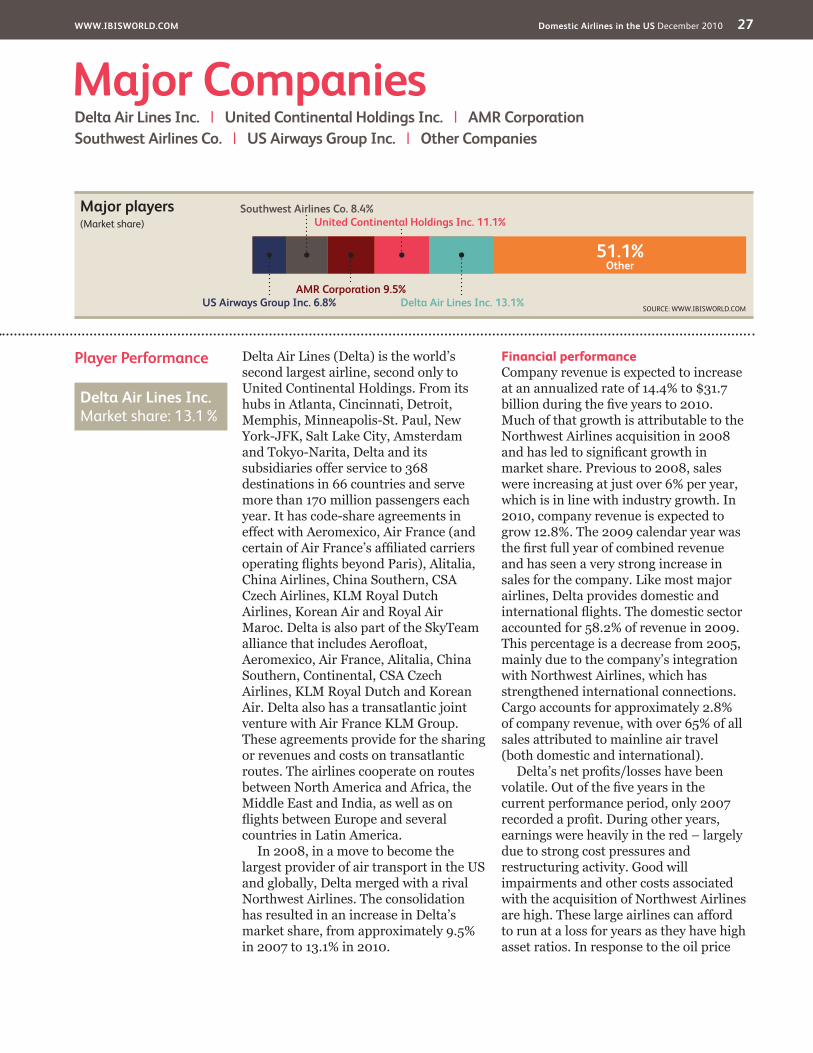
Industry concentration indicates the extent to which major players dominate the industry. The Domestic Airlines industry is classified as having a medium level of concentration. IBISWorld believes that the top four industry players in this industry held a combined market share of around 42.1% in 2010. This is a slight increase from 37% in 2005, mainly due to generic growth of low-cost air transport providers and merger and acquisition activity. The most significant recent industry mergers were in 2008 when Delta Air Lines and Northwest Airlines merged and in 2010 when United Airlines and Continental Airlines merged creating the largest airline in the world. In April 2010, United Airlines Corporation and Continental Airlines also agreed to a merger which is expected to be completed by the end of 2010. The overall trend among US airlines over the past five years has been an increase in market share for low-cost carriers such as US Airways, JetBlue and Southwest Airlines. This has been at the cost of market dominance by two of the industry’s top players, American Airlines and United Airlines.
Major players generally have a more significant market share in the industry as they offer a larger variety of routes. An
operator’s decision to fly to a destination is determined by the level of fixed costs to operate a particular route. Fixed costs are expenses that need to be incurred prior to the delivery of a service and are independent of output. Firms will provide a service only if there is a sufficient market. It can also act as a barrier to entry as incumbent firms that have already incurred fixed costs (or provided state-aid incentives such as government owned airlines) and have large levels of output will be able to produce at a lower per unit cost. Other costs such as airport, ground handling, leasing, and various ancillary services are also taken into consideration before a network route is determined, in addition to the availability of landing slots. All these factors have the potential to reduce the number of routes of operating firms that would otherwise be in the market.
The medium concentration implies that there is scope for new entrants servicing niche markets and to a certain extent competing with the majors. These niche markets have been in the form of low-cost air travel in the past five years. However, the majors are expected to merge in the future, with industry concentration increasing in the next five years.
�IBISWorld identifies 250 Key Success Factors for a business. The most important for this industry are:
WWW.IBISWORLD.COM� Domestic�Airlines�in�the�US December 2010 22
Competitive�Landscape
Cost�Structure�Benchmarks
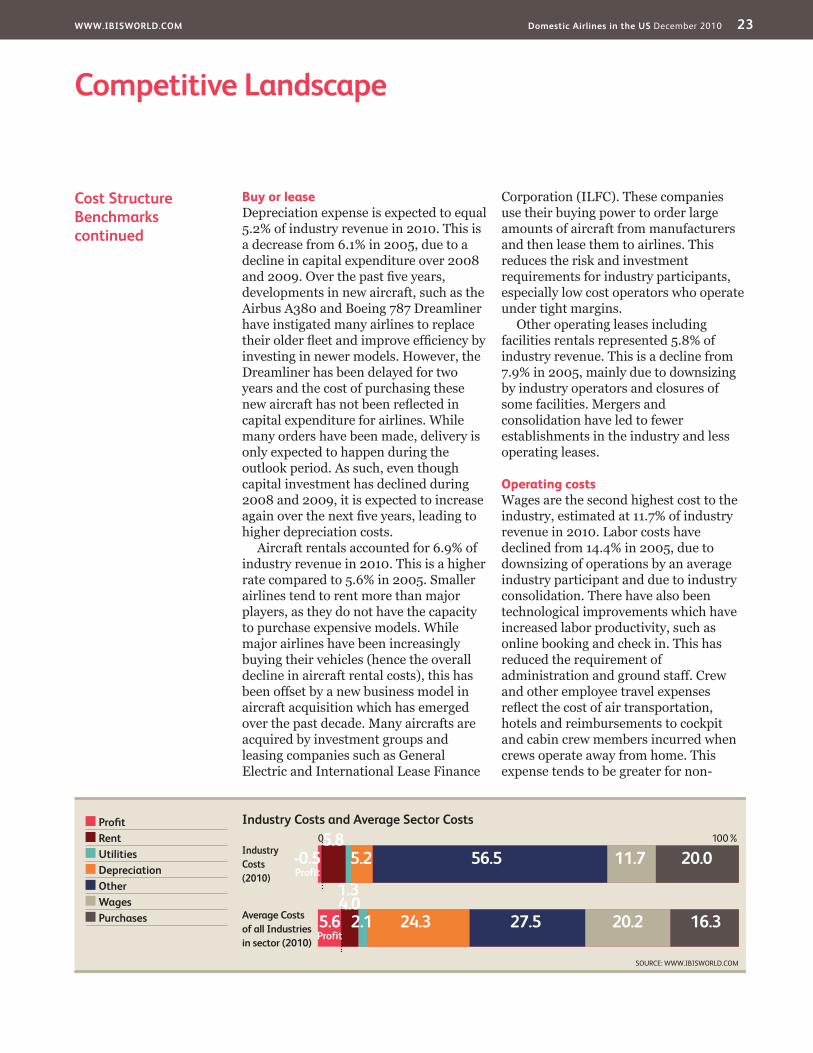
Profitability in the Domestic Airlines industry is highly volatile. During 2009, net loss of 4.4% of industry revenue was recorded, though it is expected to improve to a net loss of 0.5% in 2010. Industry operators have to battle high fixed costs and very volatile fuel prices without the ability to pass on the full cost increase to the consumer. Domestic airlines are highly competitive and consumers are price sensitive. As such, most airlines take losses in the time of high operating costs without raising the price too much. During 2008, most airlines decided to take measures to battle rising costs in order to downsizing operations and cutting staff, as opposed to raising prices. These restructuring methods reaped some benefit in 2009, with losses improving from 12.6% of industry revenue in 2008. However, most of the relief in costs has been due to lower oil prices since August 2008. During 2008 and 2009, airlines have also increased fees and charges such as excess baggage and cancellation fees in order to make up for revenue lost in falling passenger numbers.
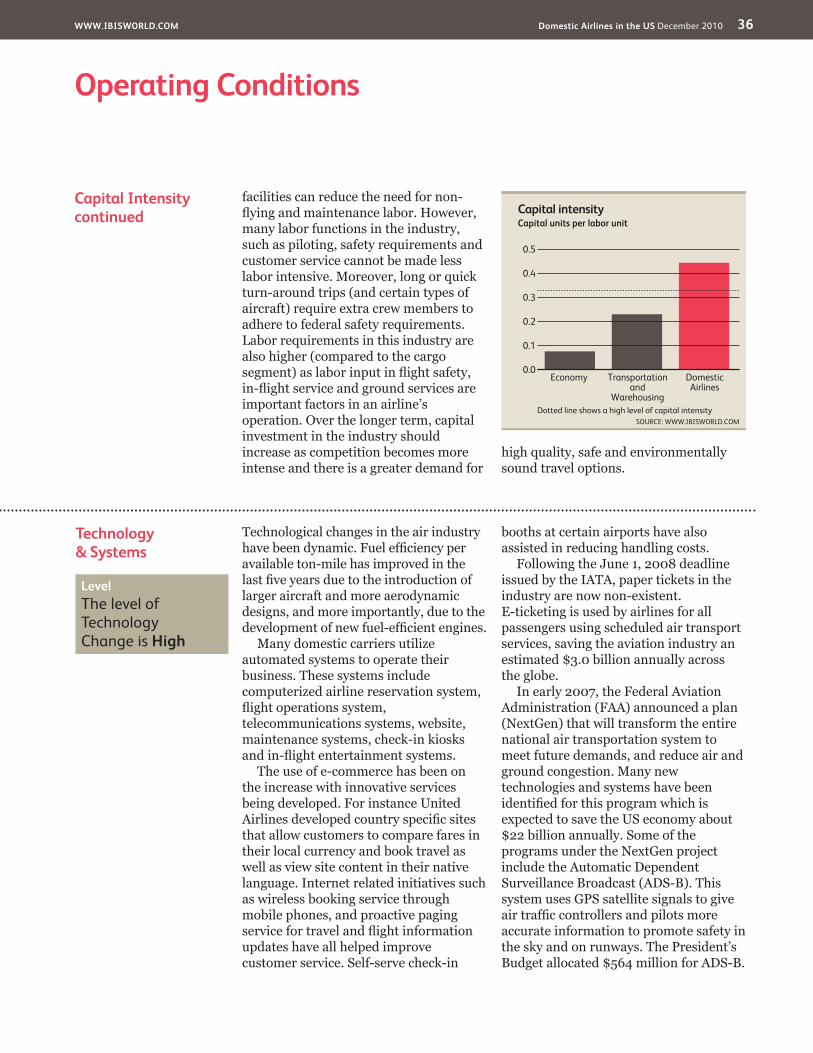
Fuel troublesA major expense in this industry is purchases which include the acquisition of materials used in operations, including fuel. Because these costs are relatively large, the industry is vulnerable to fluctuations in the prices of materials and supplies. Aviation fuel is one of the most significant expenses for an airline. Fuel accounted for 18.8% of industry revenue in 2005, jumping to 36% in 2008 and
falling back to 23.9% in 2010. This is a result of record high fuel prices, which increased substantially between 2005 and 2008. Total cost of purchases has increased as a result of growing fuel costs, from 38.6% of industry revenue in 2005.
Fuel consumption is determined by the fuel burn efficiency of the aircraft used and the routes flown. At cruising altitude, an aircraft uses the least fuel for the greatest mileage gain. The longer an aircraft flies at cruising altitude the lower the fuel cost per average seat mile. In addition, newer aircraft have greater fuel burn efficiency than older models. Therefore, an air carrier flying longer routes with newer aircraft will tend to use less fuel per average seat mile than a carrier specializing in shorter routes with relatively antiquated aircraft. These technological advancements will see the cost of purchases fall in the future.
It is more difficult for non-scheduled aviation operators to hedge against fuel price volatility as they struggle to determine future fuel consumption (as opposed to operators that fly scheduled routes). Many smaller companies also lack the financial resources and expertise to buy fuel in bulk, as well as enter into forward purchase contracts for fuel (whereby they agree to take delivery of a set amount of fuel at a fixed price and on a future specified date) and lack the negotiating power to incorporate fuel cost adjustments or escalation provisions into long-term contracts. As such, fuel troubles are most significant for smaller domestic airlines.
Key�Success�Factorscontinued
be able to service markets precisely or risk operating losses on a given route.
Access to the latest available and most efficient technology and techniquesThe use of up-to-date technology and new aircraft can improve operating efficiencies.
WWW.IBISWORLD.COM� Domestic�Airlines�in�the�US December 2010 23
Competitive�Landscape
Cost�Structure�Benchmarkscontinued
Buy or leaseDepreciation expense is expected to equal 5.2% of industry revenue in 2010. This is a decrease from 6.1% in 2005, due to a decline in capital expenditure over 2008 and 2009. Over the past five years, developments in new aircraft, such as the Airbus A380 and Boeing 787 Dreamliner have instigated many airlines to replace their older fleet and improve efficiency by investing in newer models. However, the Dreamliner has been delayed for two years and the cost of purchasing these new aircraft has not been reflected in capital expenditure for airlines. While many orders have been made, delivery is only expected to happen during the outlook period. As such, even though capital investment has declined during 2008 and 2009, it is expected to increase again over the next five years, leading to higher depreciation costs.
Aircraft rentals accounted for 6.9% of industry revenue in 2010. This is a higher rate compared to 5.6% in 2005. Smaller airlines tend to rent more than major players, as they do not have the capacity to purchase expensive models. While major airlines have been increasingly buying their vehicles (hence the overall decline in aircraft rental costs), this has been offset by a new business model in aircraft acquisition which has emerged over the past decade. Many aircrafts are acquired by investment groups and leasing companies such as General Electric and International Lease Finance
Corporation (ILFC). These companies use their buying power to order large amounts of aircraft from manufacturers and then lease them to airlines. This reduces the risk and investment requirements for industry participants, especially low cost operators who operate under tight margins.
Other operating leases including facilities rentals represented 5.8% of industry revenue. This is a decline from 7.9% in 2005, mainly due to downsizing by industry operators and closures of some facilities. Mergers and consolidation have led to fewer establishments in the industry and less operating leases.
Operating costsWages are the second highest cost to the industry, estimated at 11.7% of industry revenue in 2010. Labor costs have declined from 14.4% in 2005, due to downsizing of operations by an average industry participant and due to industry consolidation. There have also been technological improvements which have increased labor productivity, such as online booking and check in. This has reduced the requirement of administration and ground staff. Crew and other employee travel expenses reflect the cost of air transportation, hotels and reimbursements to cockpit and cabin crew members incurred when crews operate away from home. This expense tends to be greater for non-
WWW.IBISWORLD.COM� Domestic�Airlines�in�the�US December 2010 24
Competitive�Landscape
Basis�of�Competition The Domestic Airlines industry is highly competitive. Airlines compete for customers based on price, frequency and capacity, route offerings, loyalty programs, promotions, rewards and service quality. Industry operators also have to attract customers from substitutes such as cars, trains and buses. The level of competition is different among particular pockets of the industry; low-cost airlines are very price competitive while they may not offer the same number of routes as other airlines, while competition from substitutes is the strongest among regional and short-distance service providers.
Internal�competitionCompetition among domestic airlines has intensified over the past decade. Any US air carrier deemed fit by the US
Department of Transportation is free to operate scheduled passenger services between any two points within the US and its possessions. This has resulted in an introduction of a few new airlines over the past 10 years and the penetration of low-cost carriers increasing over time. Providers of cheap air transportation have increased the level of price competition in the industry, raising the focus on quantity over quality. While quality is still an important measure of success for an airline, this type of competition is more valuable at the higher end of the market (business class and corporate customers). Price competition is the most important tool in attracting customers in times of poor economic conditions, when unemployment is increasing and incomes are falling. In other times, airlines may
Cost�Structure�Benchmarkscontinued
scheduled charter operations than for aviation operations that are scheduled, because non-scheduled flights are more likely to position crew in remote places and companies cannot use frequent user discounts. IBISWorld believes that the average wage for this sector was relatively high at $52,600 in 2010 as many employees in this industry are represented by a trade union. The average wage is projected to have declined slightly from $54,500 in 2005, only due to cuts made during 2009.
Handling and landing fees include the costs incurred by firms to land and service aircraft, security, baggage handling and logistics at airports. Some larger firms use their own employees for ground handling functions. Landing and navigation fees accounted for an estimated 3.7% of operating revenue. Maintenance expenses include the cost of expendable aircraft spare parts, maintenance to repairable aircraft components, contract labor for
maintenance activities and other non-capitalized direct costs related to fleet maintenance, including spare engine leases, parts loan and exchange fees and related shipping costs.
Maintenance accounted for 4.9% of industry revenue in 2010. This is an increase from 4.4% in 2005, due to a growing focus on aircraft safety.
Other expensesOther expenses include interest, tax, utilities, insurance, restructuring, legal costs, good will impairments, administrative, sales and similar expenses. These costs increased from 13.5% of industry revenue in 2005, mainly due to a significant decline in revenue in 2009. Many costs are relatively fixed which means that they increase as a percentage of revenue when sales fall. Administration costs are estimated to have declined over the years, however, due to online bookings and check-in.
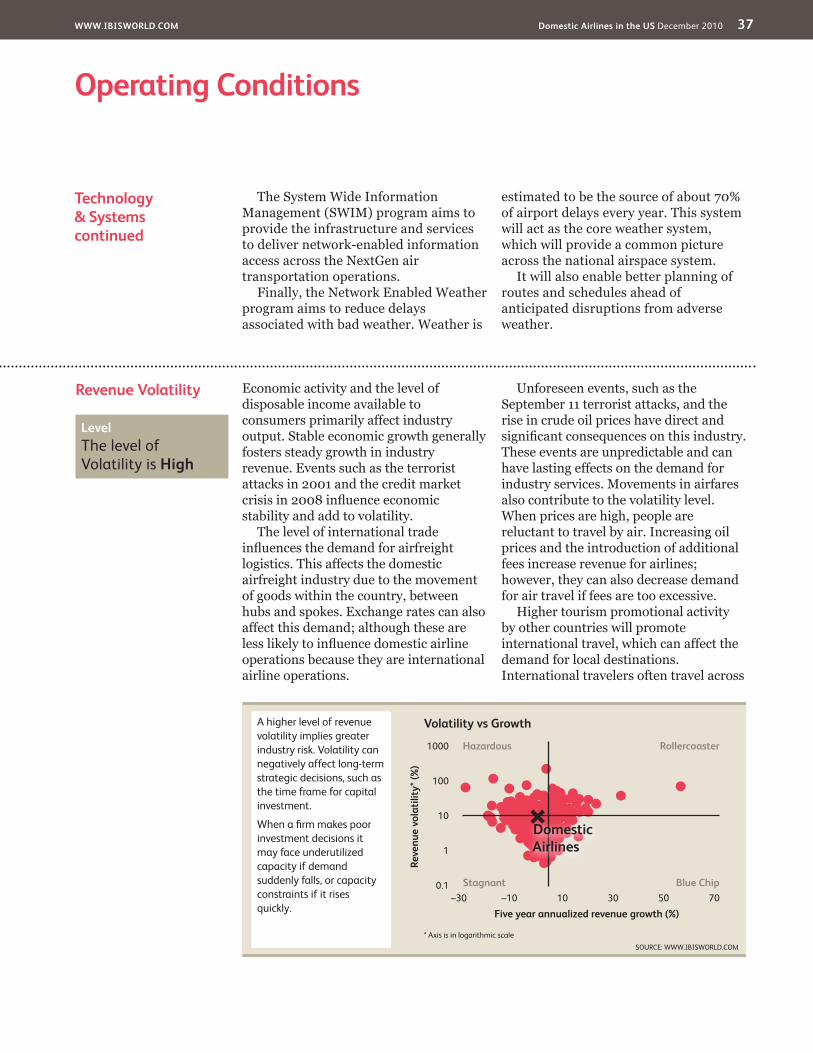
Level�&�Trend��Competition in this industry is High and the trend is Increasing
WWW.IBISWORLD.COM� Domestic�Airlines�in�the�US December 2010 25
Competitive�Landscape
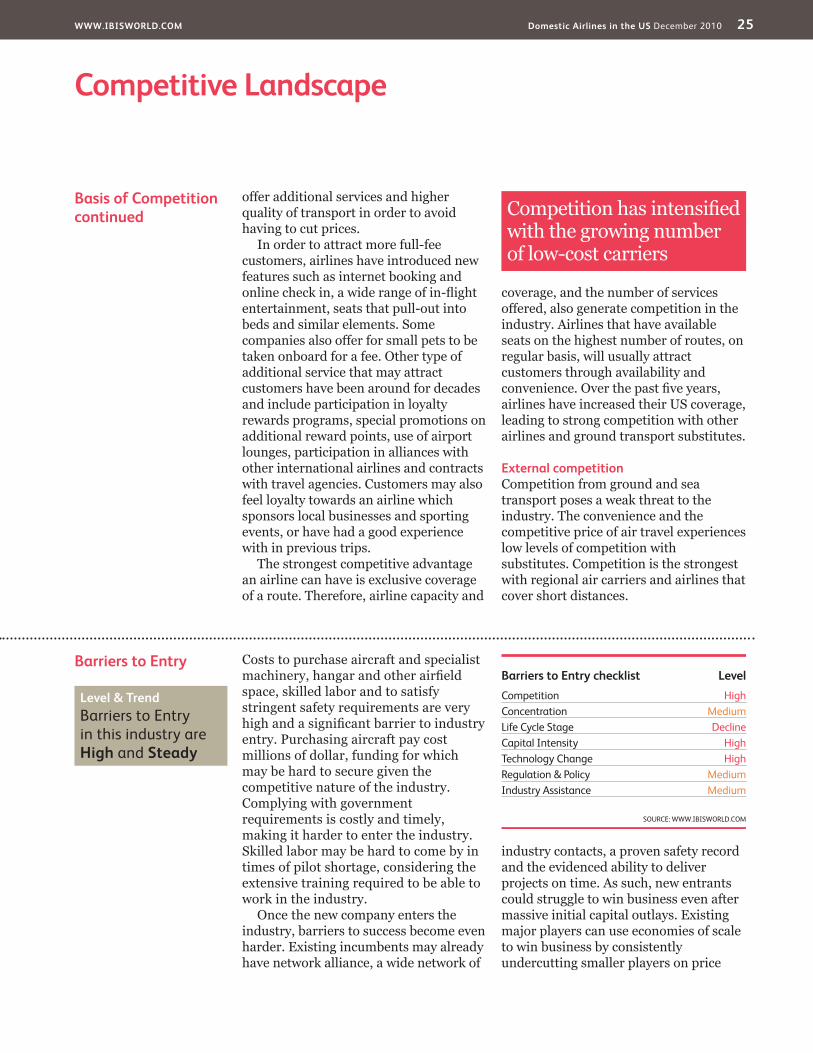
Barriers�to�Entry Costs to purchase aircraft and specialist machinery, hangar and other airfield space, skilled labor and to satisfy stringent safety requirements are very high and a significant barrier to industry entry. Purchasing aircraft pay cost millions of dollar, funding for which may be hard to secure given the competitive nature of the industry. Complying with government requirements is costly and timely, making it harder to enter the industry. Skilled labor may be hard to come by in times of pilot shortage, considering the extensive training required to be able to work in the industry.
Once the new company enters the industry, barriers to success become even harder. Existing incumbents may already have network alliance, a wide network of
industry contacts, a proven safety record and the evidenced ability to deliver projects on time. As such, new entrants could struggle to win business even after massive initial capital outlays. Existing major players can use economies of scale to win business by consistently undercutting smaller players on price
Basis�of�Competitioncontinued
offer additional services and higher quality of transport in order to avoid having to cut prices.
In order to attract more full-fee customers, airlines have introduced new features such as internet booking and online check in, a wide range of in-flight entertainment, seats that pull-out into beds and similar elements. Some companies also offer for small pets to be taken onboard for a fee. Other type of additional service that may attract customers have been around for decades and include participation in loyalty rewards programs, special promotions on additional reward points, use of airport lounges, participation in alliances with other international airlines and contracts with travel agencies. Customers may also feel loyalty towards an airline which sponsors local businesses and sporting events, or have had a good experience with in previous trips.
The strongest competitive advantage an airline can have is exclusive coverage of a route. Therefore, airline capacity and
coverage, and the number of services offered, also generate competition in the industry. Airlines that have available seats on the highest number of routes, on regular basis, will usually attract customers through availability and convenience. Over the past five years, airlines have increased their US coverage, leading to strong competition with other airlines and ground transport substitutes.
External�competitionCompetition from ground and sea transport poses a weak threat to the industry. The convenience and the competitive price of air travel experiences low levels of competition with substitutes. Competition is the strongest with regional air carriers and airlines that cover short distances.
� Competition has intensified with the growing number of low-cost carriers
Level�&�Trend��Barriers to Entry in this industry are High and Steady
WWW.IBISWORLD.COM� Domestic�Airlines�in�the�US December 2010 26
Competitive�Landscape
Industry�Globalization
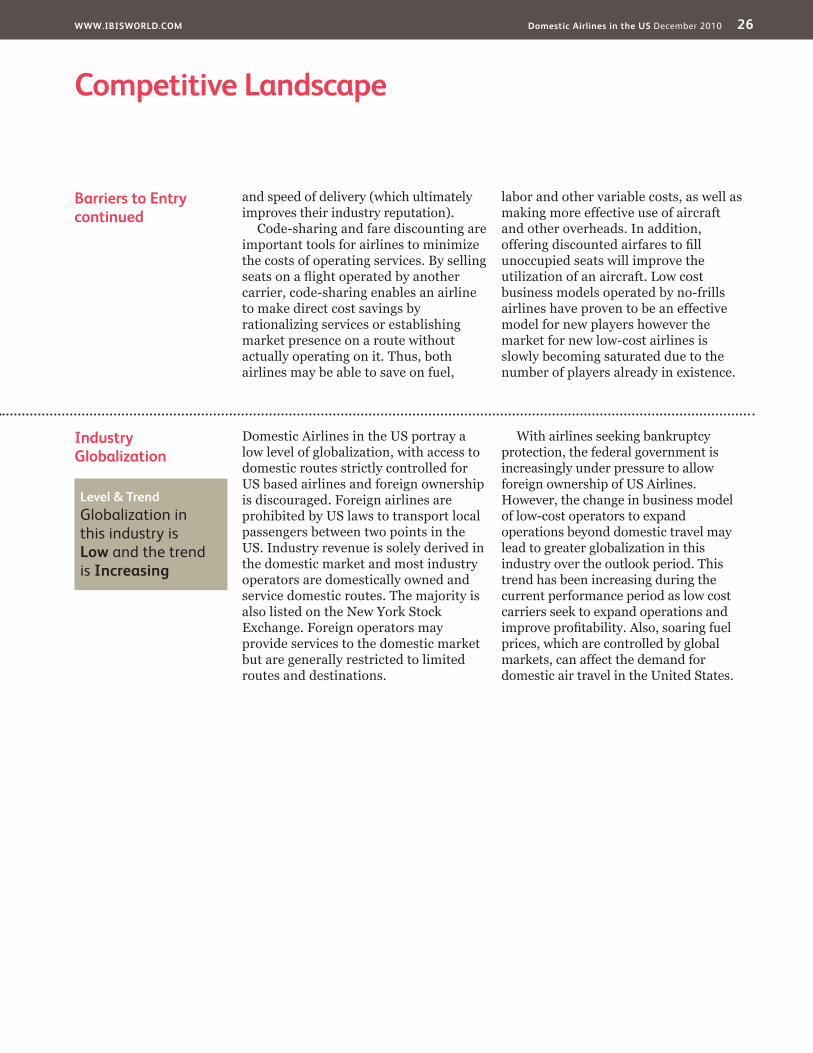
Domestic Airlines in the US portray a low level of globalization, with access to domestic routes strictly controlled for US based airlines and foreign ownership is discouraged. Foreign airlines are prohibited by US laws to transport local passengers between two points in the US. Industry revenue is solely derived in the domestic market and most industry operators are domestically owned and service domestic routes. The majority is also listed on the New York Stock Exchange. Foreign operators may provide services to the domestic market but are generally restricted to limited routes and destinations.
With airlines seeking bankruptcy protection, the federal government is increasingly under pressure to allow foreign ownership of US Airlines. However, the change in business model of low-cost operators to expand operations beyond domestic travel may lead to greater globalization in this industry over the outlook period. This trend has been increasing during the current performance period as low cost carriers seek to expand operations and improve profitability. Also, soaring fuel prices, which are controlled by global markets, can affect the demand for domestic air travel in the United States.
Barriers�to�Entrycontinued
and speed of delivery (which ultimately improves their industry reputation).
Code-sharing and fare discounting are important tools for airlines to minimize the costs of operating services. By selling seats on a flight operated by another carrier, code-sharing enables an airline to make direct cost savings by rationalizing services or establishing market presence on a route without actually operating on it. Thus, both airlines may be able to save on fuel,
labor and other variable costs, as well as making more effective use of aircraft and other overheads. In addition, offering discounted airfares to fill unoccupied seats will improve the utilization of an aircraft. Low cost business models operated by no-frills airlines have proven to be an effective model for new players however the market for new low-cost airlines is slowly becoming saturated due to the number of players already in existence.
Level�&�Trend��Globalization in this industry is Low and the trend is Increasing
WWW.IBISWORLD.COM� Domestic�Airlines�in�the�US December 2010 27
Player�Performance Delta Air Lines (Delta) is the world’s second largest airline, second only to United Continental Holdings. From its hubs in Atlanta, Cincinnati, Detroit, Memphis, Minneapolis-St. Paul, New York-JFK, Salt Lake City, Amsterdam and Tokyo-Narita, Delta and its subsidiaries offer service to 368 destinations in 66 countries and serve more than 170 million passengers each year. It has code-share agreements in effect with Aeromexico, Air France (and certain of Air France’s affiliated carriers operating flights beyond Paris), Alitalia, China Airlines, China Southern, CSA Czech Airlines, KLM Royal Dutch Airlines, Korean Air and Royal Air Maroc. Delta is also part of the SkyTeam alliance that includes Aerofloat, Aeromexico, Air France, Alitalia, China Southern, Continental, CSA Czech Airlines, KLM Royal Dutch and Korean Air. Delta also has a transatlantic joint venture with Air France KLM Group. These agreements provide for the sharing or revenues and costs on transatlantic routes. The airlines cooperate on routes between North America and Africa, the Middle East and India, as well as on flights between Europe and several countries in Latin America.
In 2008, in a move to become the largest provider of air transport in the US and globally, Delta merged with a rival Northwest Airlines. The consolidation has resulted in an increase in Delta’s market share, from approximately 9.5% in 2007 to 13.1% in 2010.
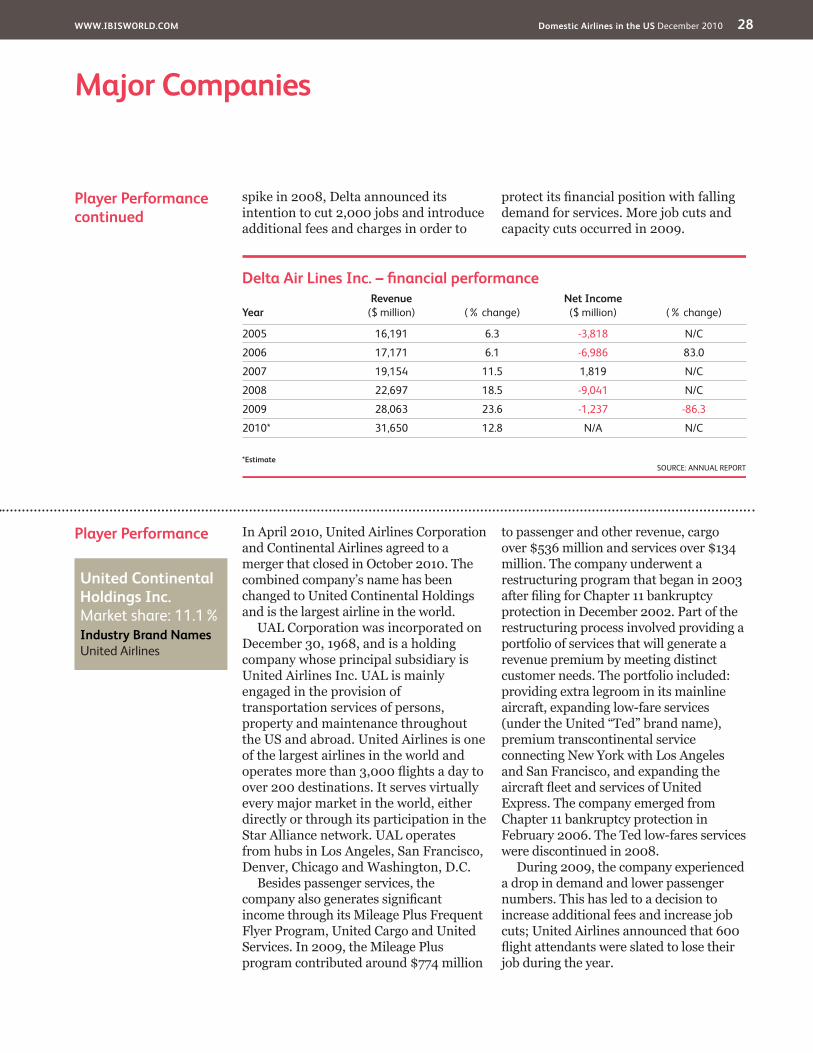
Financial performanceCompany revenue is expected to increase at an annualized rate of 14.4% to $31.7 billion during the five years to 2010. Much of that growth is attributable to the Northwest Airlines acquisition in 2008 and has led to significant growth in market share. Previous to 2008, sales were increasing at just over 6% per year, which is in line with industry growth. In 2010, company revenue is expected to grow 12.8%. The 2009 calendar year was the first full year of combined revenue and has seen a very strong increase in sales for the company. Like most major airlines, Delta provides domestic and international flights. The domestic sector accounted for 58.2% of revenue in 2009. This percentage is a decrease from 2005, mainly due to the company’s integration with Northwest Airlines, which has strengthened international connections. Cargo accounts for approximately 2.8% of company revenue, with over 65% of all sales attributed to mainline air travel (both domestic and international).
Delta’s net profits/losses have been volatile. Out of the five years in the current performance period, only 2007 recorded a profit. During other years, earnings were heavily in the red – largely due to strong cost pressures and restructuring activity. Good will impairments and other costs associated with the acquisition of Northwest Airlines are high. These large airlines can afford to run at a loss for years as they have high asset ratios. In response to the oil price
WWW.IBISWORLD.COM� Domestic�Airlines�in�the�US December 2010 28
Major�Companies
Player�Performance In April 2010, United Airlines Corporation and Continental Airlines agreed to a merger that closed in October 2010. The combined company’s name has been changed to United Continental Holdings and is the largest airline in the world.
UAL Corporation was incorporated on December 30, 1968, and is a holding company whose principal subsidiary is United Airlines Inc. UAL is mainly engaged in the provision of transportation services of persons, property and maintenance throughout the US and abroad. United Airlines is one of the largest airlines in the world and operates more than 3,000 flights a day to over 200 destinations. It serves virtually every major market in the world, either directly or through its participation in the Star Alliance network. UAL operates from hubs in Los Angeles, San Francisco, Denver, Chicago and Washington, D.C.
Besides passenger services, the company also generates significant income through its Mileage Plus Frequent Flyer Program, United Cargo and United Services. In 2009, the Mileage Plus program contributed around $774 million
to passenger and other revenue, cargo over $536 million and services over $134 million. The company underwent a restructuring program that began in 2003 after filing for Chapter 11 bankruptcy protection in December 2002. Part of the restructuring process involved providing a portfolio of services that will generate a revenue premium by meeting distinct customer needs. The portfolio included: providing extra legroom in its mainline aircraft, expanding low-fare services (under the United “Ted” brand name), premium transcontinental service connecting New York with Los Angeles and San Francisco, and expanding the aircraft fleet and services of United Express. The company emerged from Chapter 11 bankruptcy protection in February 2006. The Ted low-fares services were discontinued in 2008.
During 2009, the company experienced a drop in demand and lower passenger numbers. This has led to a decision to increase additional fees and increase job cuts; United Airlines announced that 600 flight attendants were slated to lose their job during the year.
Player�Performancecontinued
spike in 2008, Delta announced its intention to cut 2,000 jobs and introduce additional fees and charges in order to
protect its financial position with falling demand for services. More job cuts and capacity cuts occurred in 2009.
WWW.IBISWORLD.COM� Domestic�Airlines�in�the�US December 2010 29
Major�Companies
Player�Performancecontinued
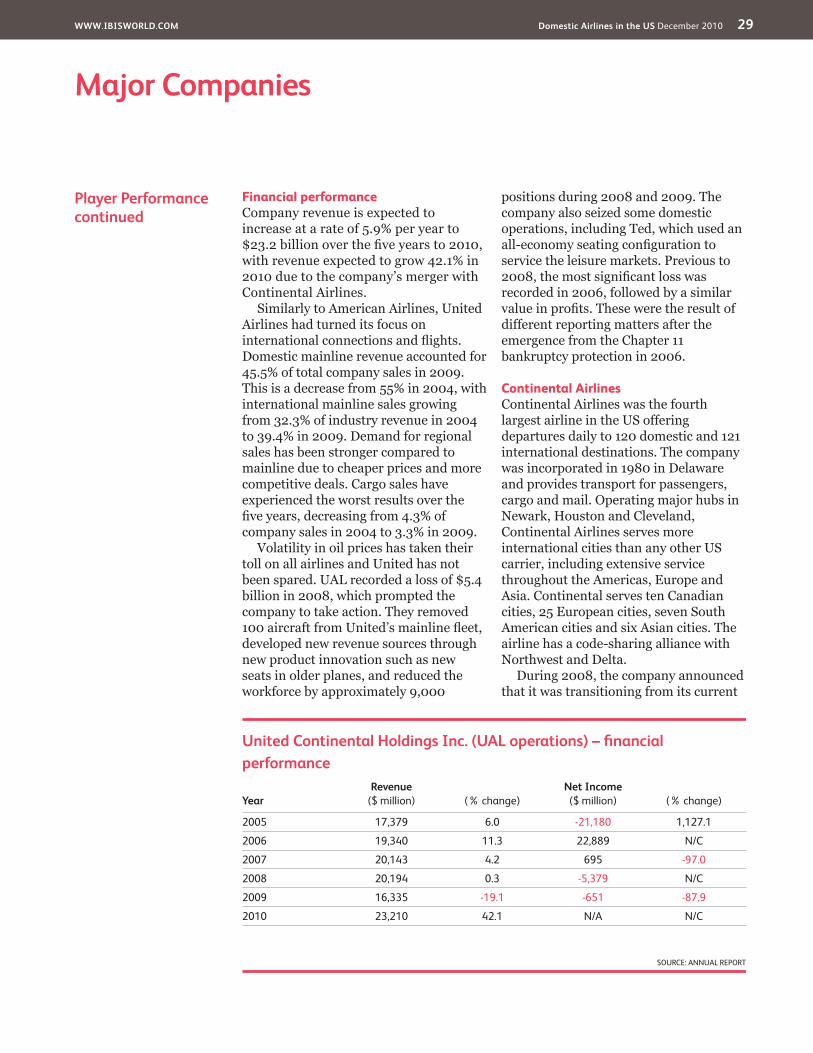
Financial performanceCompany revenue is expected to increase at a rate of 5.9% per year to $23.2 billion over the five years to 2010, with revenue expected to grow 42.1% in 2010 due to the company’s merger with Continental Airlines.
Similarly to American Airlines, United Airlines had turned its focus on international connections and flights. Domestic mainline revenue accounted for 45.5% of total company sales in 2009. This is a decrease from 55% in 2004, with international mainline sales growing from 32.3% of industry revenue in 2004 to 39.4% in 2009. Demand for regional sales has been stronger compared to mainline due to cheaper prices and more competitive deals. Cargo sales have experienced the worst results over the five years, decreasing from 4.3% of company sales in 2004 to 3.3% in 2009.
Volatility in oil prices has taken their toll on all airlines and United has not been spared. UAL recorded a loss of $5.4 billion in 2008, which prompted the company to take action. They removed 100 aircraft from United’s mainline fleet, developed new revenue sources through new product innovation such as new seats in older planes, and reduced the workforce by approximately 9,000
positions during 2008 and 2009. The company also seized some domestic operations, including Ted, which used an all-economy seating configuration to service the leisure markets. Previous to 2008, the most significant loss was recorded in 2006, followed by a similar value in profits. These were the result of different reporting matters after the emergence from the Chapter 11 bankruptcy protection in 2006.
Continental AirlinesContinental Airlines was the fourth largest airline in the US offering departures daily to 120 domestic and 121 international destinations. The company was incorporated in 1980 in Delaware and provides transport for passengers, cargo and mail. Operating major hubs in Newark, Houston and Cleveland, Continental Airlines serves more international cities than any other US carrier, including extensive service throughout the Americas, Europe and Asia. Continental serves ten Canadian cities, 25 European cities, seven South American cities and six Asian cities. The airline has a code-sharing alliance with Northwest and Delta.
During 2008, the company announced that it was transitioning from its current
WWW.IBISWORLD.COM� Domestic�Airlines�in�the�US December 2010 30
Major�Companies
Player�Performance AMR Corporation is the parent company of American Airlines, American Airlines Cargo and American Eagle. AMR was formed in 1982 after a restructuring plan that saw the company listed on the New York Stock Exchange. American airlines passenger division provides scheduled jet services to about 150 destinations throughout North America, the Caribbean, Latin America, Europe and Asia. Its affiliate, American Eagle was established in 1984 as a regional airline system connecting passengers to and from American flights at its hubs and other key cities. Together with AmericanConnection airlines, it serves
250 cities in 40 countries with more than 3,400 flights daily. AMR’s hubs are located in Boston, Chicago O’Hare, Dallas, Los Angeles, Miami, New York JFK, New York LaGuardia and San Juan, Puerto Rico.
American Airlines is also the founding member of Oneworld Alliance, which brings together 10 international airlines, including: Aer Lingus, British Airways, Cathay Pacific, Finnair, Iberia, Japan Airlines, Lan, Malev, Qantas and Royal Jordanian. Its members serve more than 675 destinations worldwide.
In 2009, American Airlines experienced significant downturns in
Player�Performancecontinued
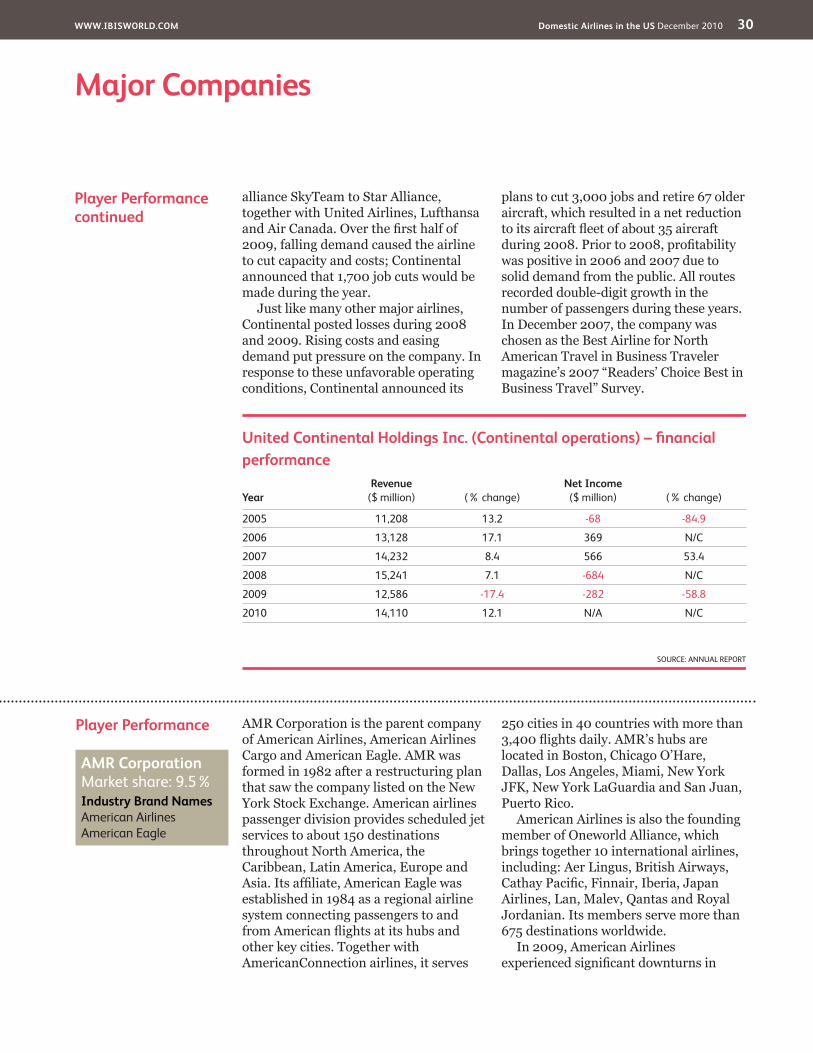
alliance SkyTeam to Star Alliance, together with United Airlines, Lufthansa and Air Canada. Over the first half of 2009, falling demand caused the airline to cut capacity and costs; Continental announced that 1,700 job cuts would be made during the year.
Just like many other major airlines, Continental posted losses during 2008 and 2009. Rising costs and easing demand put pressure on the company. In response to these unfavorable operating conditions, Continental announced its
plans to cut 3,000 jobs and retire 67 older aircraft, which resulted in a net reduction to its aircraft fleet of about 35 aircraft during 2008. Prior to 2008, profitability was positive in 2006 and 2007 due to solid demand from the public. All routes recorded double-digit growth in the number of passengers during these years. In December 2007, the company was chosen as the Best Airline for North American Travel in Business Traveler magazine’s 2007 “Readers’ Choice Best in Business Travel” Survey.
AMR�Corporation��Market share: 9.5% Industry�Brand�NamesAmerican Airlines American Eagle
WWW.IBISWORLD.COM� Domestic�Airlines�in�the�US December 2010 31
Major�Companies
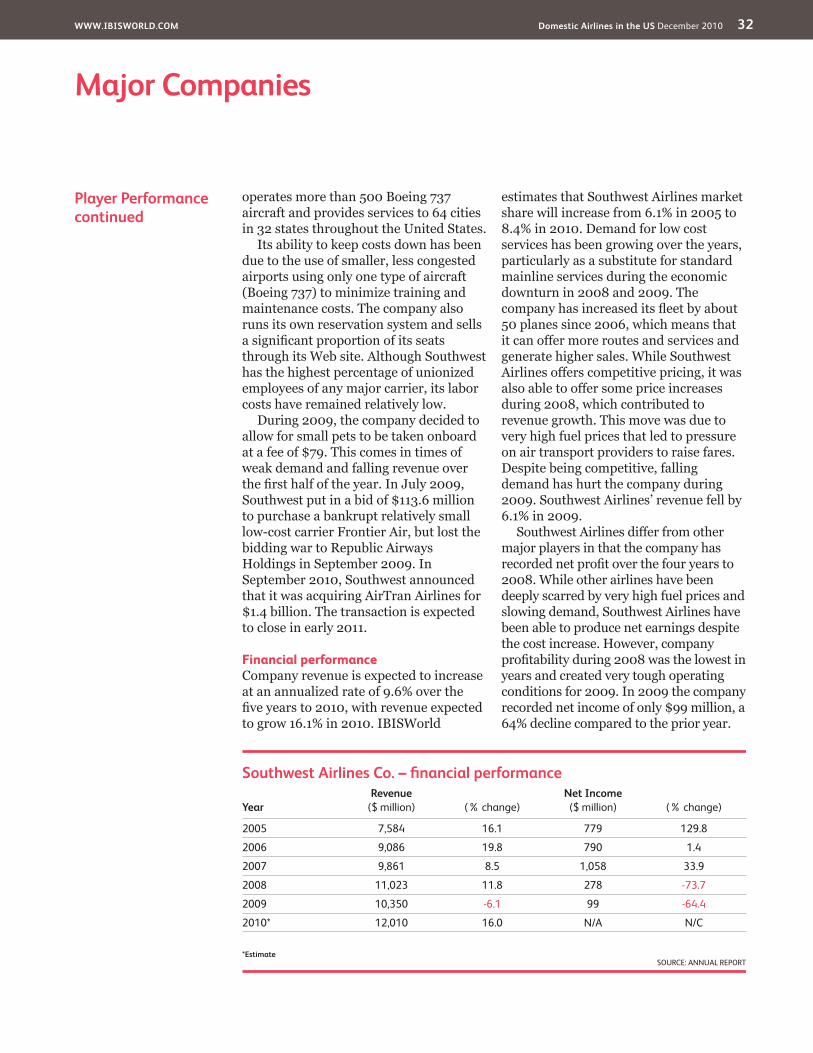
Player�Performance Southwest Airlines is the most successful low-cost carrier in the country with continued profitability for the past 30 years, even during periods of industry downturns. It is the largest domestic US airline by number of passengers enplaned and scheduled domestic departures, according to the Bureau of
Transportation Statistics. Based at Love Field in Dallas, it has expanded its low-cost, no-frills, open-seating approach to air travel throughout the Untied States to serve about 60 cities in 30 states. Incorporated in 1976, the company began operations on June 1971, with three Boeing 737 aircraft. The company
Player�Performancecontinued
passenger numbers, leading to the decision by the company to cut more jobs. A total of 1,600 were at stake during the year, mostly in flight attendant positions.
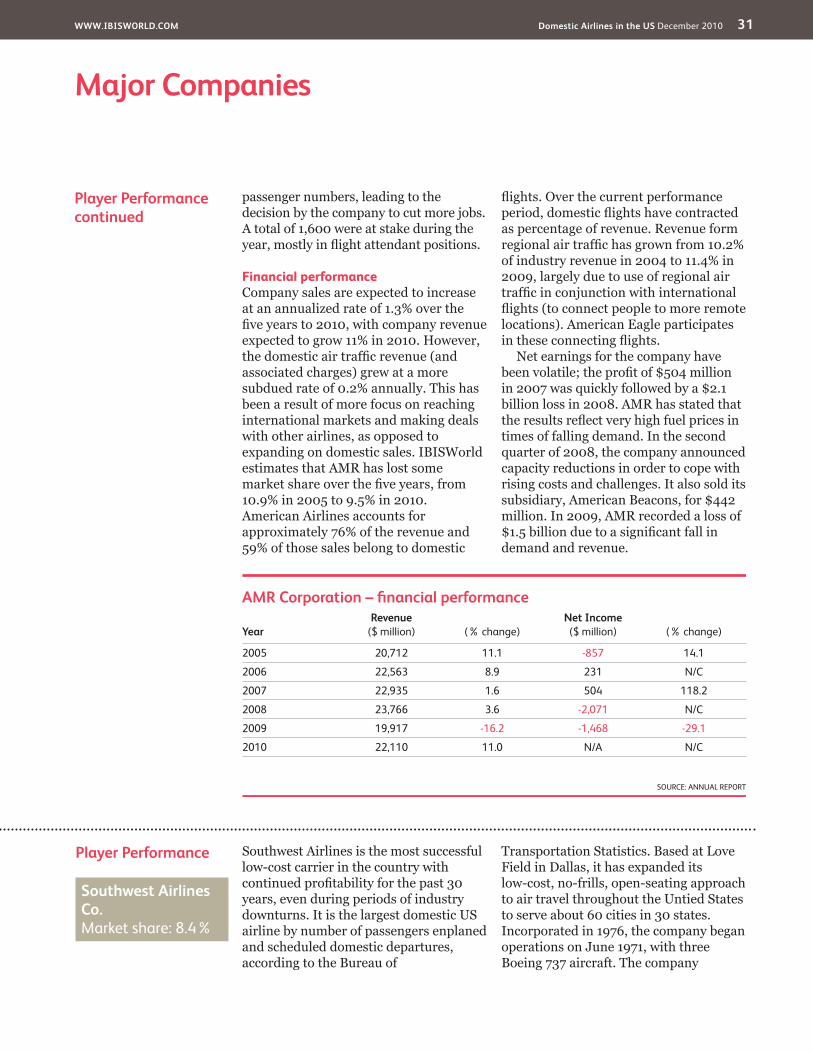
Financial performanceCompany sales are expected to increase at an annualized rate of 1.3% over the five years to 2010, with company revenue expected to grow 11% in 2010. However, the domestic air traffic revenue (and associated charges) grew at a more subdued rate of 0.2% annually. This has been a result of more focus on reaching international markets and making deals with other airlines, as opposed to expanding on domestic sales. IBISWorld estimates that AMR has lost some market share over the five years, from 10.9% in 2005 to 9.5% in 2010. American Airlines accounts for approximately 76% of the revenue and 59% of those sales belong to domestic
flights. Over the current performance period, domestic flights have contracted as percentage of revenue. Revenue form regional air traffic has grown from 10.2% of industry revenue in 2004 to 11.4% in 2009, largely due to use of regional air traffic in conjunction with international flights (to connect people to more remote locations). American Eagle participates in these connecting flights.
Net earnings for the company have been volatile; the profit of $504 million in 2007 was quickly followed by a $2.1 billion loss in 2008. AMR has stated that the results reflect very high fuel prices in times of falling demand. In the second quarter of 2008, the company announced capacity reductions in order to cope with rising costs and challenges. It also sold its subsidiary, American Beacons, for $442 million. In 2009, AMR recorded a loss of $1.5 billion due to a significant fall in demand and revenue.
AMR�Corporation�–�fi�nancial�performance
YearRevenue�
($ million) (% change)Net�Income�
($ million) (% change)
2005 20,712 11.1 -857 14.1
2006 22,563 8.9 231 N/C
2007 22,935 1.6 504 118.2
2008 23,766 3.6 -2,071 N/C
2009 19,917 -16.2 -1,468 -29.1
2010 22,110 11.0 N/A N/C
SOURCE: ANNUAL REPORT
Southwest�Airlines�Co.��Market share: 8.4%
WWW.IBISWORLD.COM� Domestic�Airlines�in�the�US December 2010 32
Major�Companies
Player�Performancecontinued
operates more than 500 Boeing 737 aircraft and provides services to 64 cities in 32 states throughout the United States.
Its ability to keep costs down has been due to the use of smaller, less congested airports using only one type of aircraft (Boeing 737) to minimize training and maintenance costs. The company also runs its own reservation system and sells a significant proportion of its seats through its Web site. Although Southwest has the highest percentage of unionized employees of any major carrier, its labor costs have remained relatively low.
During 2009, the company decided to allow for small pets to be taken onboard at a fee of $79. This comes in times of weak demand and falling revenue over the first half of the year. In July 2009, Southwest put in a bid of $113.6 million to purchase a bankrupt relatively small low-cost carrier Frontier Air, but lost the bidding war to Republic Airways Holdings in September 2009. In September 2010, Southwest announced that it was acquiring AirTran Airlines for $1.4 billion. The transaction is expected to close in early 2011.
Financial performanceCompany revenue is expected to increase at an annualized rate of 9.6% over the five years to 2010, with revenue expected to grow 16.1% in 2010. IBISWorld
estimates that Southwest Airlines market share will increase from 6.1% in 2005 to 8.4% in 2010. Demand for low cost services has been growing over the years, particularly as a substitute for standard mainline services during the economic downturn in 2008 and 2009. The company has increased its fleet by about 50 planes since 2006, which means that it can offer more routes and services and generate higher sales. While Southwest Airlines offers competitive pricing, it was also able to offer some price increases during 2008, which contributed to revenue growth. This move was due to very high fuel prices that led to pressure on air transport providers to raise fares. Despite being competitive, falling demand has hurt the company during 2009. Southwest Airlines’ revenue fell by 6.1% in 2009.
Southwest Airlines differ from other major players in that the company has recorded net profit over the four years to 2008. While other airlines have been deeply scarred by very high fuel prices and slowing demand, Southwest Airlines have been able to produce net earnings despite the cost increase. However, company profitability during 2008 was the lowest in years and created very tough operating conditions for 2009. In 2009 the company recorded net income of only $99 million, a 64% decline compared to the prior year.
Southwest�Airlines�Co.�–�fi�nancial�performance
YearRevenue�
($ million) (% change)Net�Income�
($ million) (% change)
2005 7,584 16.1 779 129.8
2006 9,086 19.8 790 1.4
2007 9,861 8.5 1,058 33.9
2008 11,023 11.8 278 -73.7
2009 10,350 -6.1 99 -64.4
2010* 12,010 16.0 N/A N/C
*EstimateSOURCE: ANNUAL REPORT
WWW.IBISWORLD.COM� Domestic�Airlines�in�the�US December 2010 33
Major�Companies
Player�Performance The US Airways Group is a holding company formed in 1982 whose origins trace back to the formation of All American Aviation in 1939. On September 12, 2004, US Airways sought protection from its creditors for the second time in 25 months by filing for bankruptcy protection. US Airways filed a motion with the bankruptcy court to have all union contracts nullified, which met with stiff opposition from its unionized labor force. In February 2005, Eastshore Aviation, an investment concern partially owned by Air Wisconsin, agreed to a $125 million cash investment for US Airways to plan its reorganization. Just after the Eastshore bailout, US Airways and America West Airlines (AWA) agreed to merge to form the first nationwide low-cost, hub-and-spoke carrier.
The merger was completed in late September 2005 with US Airways emergence from Chapter 11. The US Airways restructuring provides it with a war chest of $2.6 billion. Private investors, America West shareholders and the government agency that holds loan guarantees on $1 billion for both US Airways and America West control the merged company. The merged entity is a low-cost carrier offering scheduled passenger services on approximately 3700 flight daily to 233 cities in the US, Canada, the Caribbean, Latin America
and Europe, making it the only low-cost carrier with a significant international route presence.
Financial performanceCompany sales have increased considerably since 2005. Company revenue is expected to grow 18.6% to $11.9 billion over the five years to 2010, with revenue expected to grow 13.9% in 2010. Sales have increased due to the highly competitive nature of the company product, i.e. low cost air transport. Also, significant contributions have been made through merger activity in 2005. This has translated to a sharp increase in market share for the company, from 3.2% in 2005 to 6.8% in 2010. During these five years, the company has expanded its international and domestic operations significantly, along with other airlines in the industry. About 90% of revenue is generated from passengers, followed by 1.2% from cargo and 7.5% from other sources such as reservation cancellations.
The company has battled rising fuel costs and changing demand conditions along with the other airlines. US Airways set out a program to cut 5% of its workforce and between 6% and 8% of its capacity (domestic and international) by the end of 2008. These measures were a direct response to the pressure fuel prices have added to the airline, and also the
US�Airways�Group�Inc.�–�fi�nancial�performance
YearRevenue�
($ million) (% change)Net�Income�
($ million) (% change)
2005 5,069 83.9 335 N/C
2006 11,557 128.0 304 -9.3
2007 11,700 1.2 427 40.5
2008 12,118 3.6 -2,210 N/C
2009 10,458 -13.7 -205 -90.7
2010* 11,910 13.9 N/A N/C
*EstimateSOURCE: ANNUAL REPORT
US�Airways�Group�Inc.��Market share: 6.8%
WWW.IBISWORLD.COM� Domestic�Airlines�in�the�US December 2010 34
Major�Companies
Other�Companies JetBlue Airways CorporationEstimated market share: 2.7%Incorporated in Delaware in August 1998, JetBlue started operations in February 2000. Based at New York’s John F. Kennedy International Airport, the low-cost carrier offers one-class service to about 52 US cities in 19 states, and Puerto Rico, Mexico and the Caribbean, and has a fleet of 142 aircraft. It has established a second hub at Long Beach Airport outside Los Angeles. The airports used are less congested airports located near larger cities and rely on electronic ticketing. The company operates about 600 daily flights and is the seventh largest airlines in the US based on revenue passenger miles. Billionaire financier George Soros owns about 24.0% of the company.
Company revenue is expected to increase at a phenomenal 17.8% per year to $3.9 billion over the five years to 2010, with revenue expected to grow 17.2% in 2010. This rate is much faster compared
to the industry as a whole. As a result, IBISWorld estimates that JetBlue increased its market share in the industry, from 1.2% of total revenue in 2005 to 2.7% in 2010. Company sales have been solid due to the competitive nature of the product and an increase in demand for low-cost services. This is particularly true over 2008 and 2009, when both individuals and businesses were looking to cut costs. As a result, JetBlue fared better than the average major player during the recession in terms of revenue growth.
The company has experienced moderate volatility in profit margins over the past five years. Highest losses of $76.0 million were recorded in 2008, due to skyrocketing fuel prices and the inability to pass on the full cost increase to consumers. Tough conditions persisted in 2009, despite lower crude oil prices. However, the company still managed to squeak out $58.0 million in net income in 2009.
Player�Performancecontinued
decline in economic conditions in the US and across the globe. The company posted a $2.2 billion loss during 2008, after two years of solid profit. The 2009
calendar year saw another 12 months of losses, although much more favorable compared to the year prior. In 2009, net loss improved to $200 million.
WWW.IBISWORLD.COM� Domestic�Airlines�in�the�US December 2010 35
Capital�Intensity The Domestic Airlines industry is capital intensive, with wages accounting for a moderate proportion of revenue at 11.7% in 2010. Expenditure on wages accounts for a larger proportion of revenue than does capital, with a typical firm in the industry using approximately 2.5 units of labor for each unit of capital. This means that for every dollar invested into plant and equipment, approximately $2.40 is spent on labor. Labor expenses include the wages and salaries paid to pilots, crew members, ground staff and administrative staff. The average industry wage was healthy at $52,600 per person, per year in 2010. This reflects moderate skill levels in many industry positions, long working hours, the extended time a crew member spends away from his or
her home and family, and the industry’s strong union representation. Labor costs have traditionally been high as union muscle has dictated cost performances of major airlines. Labor arrangements have also been inflexible as employees usually have to follow schedules that are pre-determined.
The domestic airlines industry can be described as having high capital intensity owing to the large capital investment required to operate an airline. Airplanes can be leased to ease capital requirements, although most airlines prefer to own airplanes as assets. In addition, efficient communications equipment, newer aircraft and computer-assisted booking, strong and flexible packing equipment and route planning
Recreation,�Personal�Services,�Health�and�Education. Firms benefi t from personal wealth so stable macroeconomic conditions are imperative. Brand awareness and niche labor skills are key to product differentiation.
Traditional�Service�Economy
Wholesale�and Retail. Reliant on labor rather than capital to sell goods. Functions cannot be outsourced therefore fi rms must use new technology or improve staff training to increase revenue growth.
Old�Economy
Agriculture�and�Manufacturing.�Traded goods can be produced using cheap labor abroad. To expand fi rms must merge or acquire others to exploit economies of scale, or specialize in niche, high-value products.
Investment�Economy
Information,�Communications,�Mining,�Finance�and�Real�Estate.�To increase revenue fi rms need superior debt management, a stable macroeconomic environment and a sound investment plan.
Level��The level of capital intensity required is High
WWW.IBISWORLD.COM� Domestic�Airlines�in�the�US December 2010 36
Operating�Conditions
Technology&�Systems
Technological changes in the air industry have been dynamic. Fuel efficiency per available ton-mile has improved in the last five years due to the introduction of larger aircraft and more aerodynamic designs, and more importantly, due to the development of new fuel-efficient engines.
Many domestic carriers utilize automated systems to operate their business. These systems include computerized airline reservation system, flight operations system, telecommunications systems, website, maintenance systems, check-in kiosks and in-flight entertainment systems.
The use of e-commerce has been on the increase with innovative services being developed. For instance United Airlines developed country specific sites that allow customers to compare fares in their local currency and book travel as well as view site content in their native language. Internet related initiatives such as wireless booking service through mobile phones, and proactive paging service for travel and flight information updates have all helped improve customer service. Self-serve check-in
booths at certain airports have also assisted in reducing handling costs.
Following the June 1, 2008 deadline issued by the IATA, paper tickets in the industry are now non-existent. E-ticketing is used by airlines for all passengers using scheduled air transport services, saving the aviation industry an estimated $3.0 billion annually across the globe.
In early 2007, the Federal Aviation Administration (FAA) announced a plan (NextGen) that will transform the entire national air transportation system to meet future demands, and reduce air and ground congestion. Many new technologies and systems have been identified for this program which is expected to save the US economy about $22 billion annually. Some of the programs under the NextGen project include the Automatic Dependent Surveillance Broadcast (ADS-B). This system uses GPS satellite signals to give air traffic controllers and pilots more accurate information to promote safety in the sky and on runways. The President’s Budget allocated $564 million for ADS-B.
Capital�Intensitycontinued
facilities can reduce the need for non-flying and maintenance labor. However, many labor functions in the industry, such as piloting, safety requirements and customer service cannot be made less labor intensive. Moreover, long or quick turn-around trips (and certain types of aircraft) require extra crew members to adhere to federal safety requirements. Labor requirements in this industry are also higher (compared to the cargo segment) as labor input in flight safety, in-flight service and ground services are important factors in an airline’s operation. Over the longer term, capital investment in the industry should increase as competition becomes more intense and there is a greater demand for
high quality, safe and environmentally sound travel options.
Capital intensity
0.5
0.0
0.1
0.2
0.3
0.4
SOURCE: WWW.IBISWORLD.COMDotted line shows a high level of capital intensity
Capital units per labor unit
Domestic Airlines
Transportation and
Warehousing
Economy
Level��The level of Technology Change is High
WWW.IBISWORLD.COM� Domestic�Airlines�in�the�US December 2010 37
Operating�Conditions
Revenue�Volatility Economic activity and the level of disposable income available to consumers primarily affect industry output. Stable economic growth generally fosters steady growth in industry revenue. Events such as the terrorist attacks in 2001 and the credit market crisis in 2008 influence economic stability and add to volatility.
The level of international trade influences the demand for airfreight logistics. This affects the domestic airfreight industry due to the movement of goods within the country, between hubs and spokes. Exchange rates can also affect this demand; although these are less likely to influence domestic airline operations because they are international airline operations.
Unforeseen events, such as the September 11 terrorist attacks, and the rise in crude oil prices have direct and significant consequences on this industry. These events are unpredictable and can have lasting effects on the demand for industry services. Movements in airfares also contribute to the volatility level. When prices are high, people are reluctant to travel by air. Increasing oil prices and the introduction of additional fees increase revenue for airlines; however, they can also decrease demand for air travel if fees are too excessive.
Higher tourism promotional activity by other countries will promote international travel, which can affect the demand for local destinations. International travelers often travel across
Technology&�Systemscontinued
The System Wide Information Management (SWIM) program aims to provide the infrastructure and services to deliver network-enabled information access across the NextGen air transportation operations.
Finally, the Network Enabled Weather program aims to reduce delays associated with bad weather. Weather is
estimated to be the source of about 70% of airport delays every year. This system will act as the core weather system, which will provide a common picture across the national airspace system.
It will also enable better planning of routes and schedules ahead of anticipated disruptions from adverse weather.
A higher level of revenue volatility implies greater industry risk. Volatility can negatively affect long-term strategic decisions, such as the time frame for capital investment.
When a fi rm makes poor investment decisions it may face underutilized capacity if demand suddenly falls, or capacity constraints if it rises quickly.
Domestic�Airlines
Level��The level of Volatility is High
WWW.IBISWORLD.COM� Domestic�Airlines�in�the�US December 2010 38
Operating�Conditions
Regulation�&�Policy The Air Transport Association of America was founded in Chicago in 1936 and remains the only trade organization for the principal US airlines. In that capacity it has played a major role in all the major government decisions regarding aviation since its founding, including creation of the Civil Aeronautics Board, the creation of the air traffic control system, and airline deregulation.
The purpose of the ATA is to support and assist its members by promoting the air transport industry and the safety, cost effectiveness, and technological advancement of its operations; advocating common industry positions before state and local governments, conducting designated industry-wide programs; and assuring governmental and public understanding of all aspects of air transport. ATA continues to represent the industry on major aviation issues before congress, federal agencies, state legislatures and governmental bodies.
The Department of Justice is responsible for the continued workable competition on the US domestic aviation segment. The FAA has primary responsibility for matters relating to air carrier flight operations, including airline operating certificates, control of navigable air space, flight personnel, aircraft certification and maintenance, and other matters affecting air safety.
The Airport Noise and Capacity Act of 1990 (the “ANCA”) recognizes the rights of operators of airports with noise problems to implement local noise abatement programs so long as such programs do not interfere unreasonably with interstate or foreign commerce or the national air transportation system. It generally provides that local noise
restrictions on Stage 3 aircraft first effective after October 1, 1990, require FAA approval. On December 1, 2003, the FAA published a Notice of Proposed Rulemaking (NPRM) to adopt the International Civil Aviation Organization’s (ICAO) Chapter 4 noise standard, which is known as the Stage 4 standard in the United States. This standard required that all new commercial jet aircraft designs certificated on or after January 1, 2006 be at least ten decibels quieter than the existing Stage 3 noise standard requirements. The standard is currently in force.
The United States Environmental Protection Agency (the “EPA”) is authorized to regulate aircraft emissions.
In November 2001, the Aviation and Transportation Security Act (ATSA) was enacted in the US which created a new agency. The act created the Transportation Security Administration (TSA) which is responsible for aviation security. The Transportation Security Administration and the US Customs and Border Protection, divisions of Department of Homeland Security, are responsible for certain civil aviation security matters, including passenger and baggage screening at US airports.
Additional laws and regulations have been considered from time to time which could significantly increase the cost of airline operations by imposing additional requirements or restrictions on operations. For instance, the FAA from time to time issues directives and other regulations relating to the maintenance and operation of aircraft that necessitate significant expenditures. There is no assurance that laws and regulations
Revenue�Volatilitycontinued
the United States once they arrive and can visit many different locations depending on their length of stay.
Level�&�Trend��The level of Regulation is Medium and the trend is Steady
WWW.IBISWORLD.COM� Domestic�Airlines�in�the�US December 2010 39
Operating�Conditions
Industry�Assistance This industry is not directly affected by tariffs. The FAA assists airlines in solving congestion problems caused by air traffic control systems. Decisive action by the federal government and subsequent $15 billion bail out fund approved by Congress assisted the industry in stabilizing itself after the terrorist attack of September 11. The assistance consisted of payments to airlines affected by the disruption and cash payments to secure cockpit doors. The bail-out had been criticized by some sectors of the industry in that, instead of tiding otherwise sound airlines over until depressed air traffic could pick-up again, the program has been used in part to prop-up weak airlines that were struggling before September 11 and are still struggling.
The US industry is not directly affected by tariffs; however, the industry has received a high level of government assistance following the September 2001
terrorist attacks and the subsequent downturn in the aviation industry. In November 2001, the government passed the Air Transportation Safety and System Stabilization Act. This Act provided for up to $5.0 billion in compensation to US airlines and air cargo carriers, for direct and incremental losses resulting from the September 11 terrorist attacks. The Act also made available up to $10.0 billion in government guarantees of certain loans made to air carriers, which are administered by the newly established Air Transportation Stabilization Board. A number of large and medium sized players in this industry have been through Chapter 11 bankruptcy proceedings over the current performance period. War risk insurance for certain claims resulting from acts of terrorism, war or similar events is also currently provided by the US government.
Regulation�&�Policycontinued
currently enacted or enacted in the future will not adversely affect an industry player’s ability to maintain its current level of operations.
Level�&�Trend��The level of Industry Assistance is Medium and the trend is Steady
WWW.IBISWORLD.COM� Domestic�Airlines�in�the�US December 2010 40
WWW.IBISWORLD.COM� Domestic�Airlines�in�the�US December 2010 41
Jargon�&�Glossary
BARRIERS�TO�ENTRY Barriers to entry can be High, Medium or Low. High means new companies struggle to enter an industry, while Low means it is easy for a firm to enter an industry.
CAPITAL/LABOR�INTENSITY An indicator of how much capital is used in production as opposed to labor. Level is stated as High, Medium or Low. High is a ratio of less than $3 of wage costs for every $1 of depreciation; Medium is $3 – $8 of wage costs to $1 of depreciation; Low is greater than $8 of wage costs for every $1 of depreciation.
DOMESTIC�DEMAND The use of goods and services within the US; the sum of imports and domestic production minus exports.
EARNINGS�BEFORE�INTEREST�AND�TAX�(EBIT)� IBISWorld uses EBIT as an indicator of a company’s profitability. It is calculated as revenue minus expenses, excluding tax and interest.
EMPLOYMENT The number of working proprietors, partners, permanent, part-time, temporary and casual employees, and managerial and executive employees.
ENTERPRISE A division that is separately managed and keeps management accounts. The most relevant measure of the number of firms in an industry.
ESTABLISHMENT The smallest type of accounting unit within an Enterprise; usually consists of one or more locations in a state or territory of the country in which it operates.
EXPORTS The total sales and transfers of goods produced by an industry that are exported.
IMPORTS The value of goods and services imported with the amount payable to non-residents.
INDUSTRY�CONCENTRATION IBISWorld bases concentration on the top four firms. Concentration is identified as High, Medium or Low. High means the top four players account for over 70% of revenue; Medium is 40 –70% of revenue; Low is less than 40%.
INDUSTRY�REVENUE The total sales revenue of the industry, including sales (exclusive of excise and sales tax) of goods and services; plus transfers to other firms of the same business; plus subsidies on production; plus all other operating income from outside the firm (such as commission income, repair and service income, and rent, leasing and hiring income); plus capital work done by rental or lease. Receipts from interest royalties, dividends and the sale of fixed tangible assets are excluded.
INDUSTRY�VALUE�ADDED The market value of goods and services produced by an industry minus the cost of goods and services used in the production process, which leaves the gross product of the industry (also called its Value Added).
INTERNATIONAL�TRADE The level is determined by: Exports/Revenue: Low is 0 –5%; Medium is 5 –20%; High is over 20%. Imports/Domestic Demand: Low is 0 –5%; Medium is 5 –35%; and High is over 35%.
LIFE�CYCLE All industries go through periods of Growth, Maturity and Decline. An average life cycle lasts 70 years. Maturity is the longest stage at 40 years with Growth and Decline at 15 years each.
NON-EMPLOYING�ESTABLISHMENT Businesses with no paid employment and payroll are known as non-employing establishments. These are mostly set-up by self employed individuals.
VOLATILITY The level of volatility is determined by the percentage change in revenue over the past five years. Volatility levels: Very High is greater than ±20%; High Volatility is between ±10% and ±20%; Moderate Volatility is between ±3% and ±10%; and Low Volatility is less than ±3%.
WAGES The gross total wages and salaries of all employees of the establishment.
Industry�Jargon
IBISWorld�Glossary
AIRLINE�HUB An airport that an airline uses as a transfer point to get passengers to their intended destination.
CRUDE�OIL An unrefined oil.
HUB�AND�SPOKE�NETWORK A system of connections arranged like a chariot wheel, where all traffic moves along spokes connected to the hub at the center.
REVENUE�PASSENGER�MILES A measure calculated using the total number of revenue-paying passengers aboard a vehicle by the distance traveled measured in miles.
REVENUE�TON�MILES A measure of freight traffic onboard an aircraft, calculated using the total weight of the cargo aboard the vehicle by the distance traveled measured in miles.
Disclaimer
This product has been supplied by IBISWorld Inc. (‘IBISWorld’) solely for use by its authorized licenses strictly in accordance with their license agreements with IBISWorld. IBISWorld makes no representation to any other person with regard to the completeness or accuracy of the data or information contained herein, and it accepts no responsibility and disclaims all liability (save for liability which cannot be lawfully disclaimed) for loss or damage whatsoever suffered or incurred by any other person resulting from the use
of, or reliance upon, the data or information contained herein. Copyright in this publication is owned by IBISWorld Inc. The publication is sold on the basis that the purchaser agrees not to copy the material contained within it for other than the purchasers own purposes. In the event that the purchaser uses or quotes from the material in this publication – in papers, reports, or opinions prepared for any other person – it is agreed that it will be sourced to: IBISWorld Inc.
At IBISWorld we know that industry intelligence is more than assembling factsIt is combining data with analysis to answer the questions that successful businesses askIdentify�high�growth,�emerging�&�shrinking�marketsArm�yourself�with�the�latest�industry�intelligenceAssess�competitive�threats�from�existing�&�new�entrantsBenchmark�your�performance�against�the�competitionMake�speedy�market-ready,�profit-maximizing�decisions
Who�is�IBISWorld?We are strategists, analysts, researchers, and marketers. We provide answers to information-hungry, time-poor businesses. Our goal is to provide real world answers that matter to your business in our 700 US industry reports. When tough strategic, budget, sales and marketing decisions need to be made, our suite of Industry and Risk intelligence products give you deeply-researched answers quickly.
IBISWorld�MembershipIBISWorld offers tailored membership packages to meet your needs.