25
© 2013 IBM Corporation IBM Advanced Care Insights: Analytics and Care Management to Reduce Readmissions Paul Hake MSPA ([email protected])

© 2013 IBM Corporation
IBM Advanced Care Insights:
Analytics and Care Management to Reduce Readmissions Paul Hake MSPA ([email protected])

© 2012 IBM Corporation 2 ©2013 IBM Corporation ©2013 IBM Corporation
Coordination Engage, convene, collaborate and cross boundaries to deliver
an integrated plan to achieve optimal outcomes and lower costs
Understand
Engage
Foundation Know individuals and populations; recognize intervention opportunities to apply evidence-based and standardized
care planning
Know
The path forward … enabling holistic and individualized care to optimize outcomes and lower costs
Wellness
Da
ta-d
rive
n in
sigh
ts
Exp
eri
en
tia
l in
sigh
ts
Analytics and Cognitive Computing Gain understanding through data-driven insights that enable
providers to act with greater visibility into outcomes and cost

© 2012 IBM Corporation 3 ©2013 IBM Corporation ©2013 IBM Corporation
IBM integrated portfolio for Smarter Care
Care identification
Coordination
Care planning Care collaboration Outcome evaluation
Analytics and Cognitive Computing
Foundation
Data warehouse and data models
“Single view” customer EMPI
(MDM)
Portals, mobile and collaboration
Remote monitoring and medical device
connectivity
Paper and Fax capture, conversion
and extraction
Population analytics Diagnostic support Care pathways Operational reporting
Cognitive computing
BI, reports and dashboards
Comprehensive global consulting, technology, infrastructure and managed services

© 2012 IBM Corporation 4 ©2013 IBM Corporation ©2013 IBM Corporation
20% of People Generate
80% of Costs
Health Care Spending
Health Status
Healthy Low Risk
High Risk At Risk Early
Clinical Symptoms
Time
Early Intervention
Opportunities Identification
Early Intervention
Opportunities Identification 70% of US Deaths
from Chronic Diseases
The Cost of Disease Progression

© 2013 IBM Corporation 5
If we could only activate the relevant information to bring insights to the point of care when needed most …
Time once spent manually interpreting data … becomes time spent healing patients
• Aggregate, activate and enrich relevant patient information beyond what is known
• Surface new data driven insights that enable new intervention opportunities … earlier
• Adapt to changes and proactively deliver individualized patient centered care
Knowledge, Guidelines and Best Practice Measures
Longitudinal “Data Driven” Insights
Identify Intervention Opportunities
Adapt Care to Changing Conditions and New Information
Confirm what I think or suspect?
Show me something new or unexpected?
How many are being missed?
How do we move faster and anticipate change?
Information Should Aid Us, Not Lie Hidden and Dormant

© 2013 IBM Corporation 6
The Data We Thought Would Be Useful … Wasn’t
• Structured data not available, not accurate enough, without the unstructured data - which was more trustworthy
What We Thought Was Causing 30 Day Readmissions … Wasn’t
• 113 possible candidate predictors expanded and changed after mining the data for hidden insights
New Hidden Indicators Emerged … Readmissions is a Highly Predictive Model
• 18 accurate indicators or predictors (see next slide)
Predictor Analysis % Encounters Structured Data
% Encounters Unstructured Data
Ejection Fraction (LVEF) 2% 74%
Smoking Indicator 35% (65% Accurate)
81% (95% Accurate)
Living Arrangements <1% 73% (100% Accurate)
Drug and Alcohol Abuse 16% 81%
Assisted Living 0% 13%
What were the Readmissions Predictors at Seton? The value of adding unstructured Data
97% at 80th percentile
49% at 20th percentile

© 2013 IBM Corporation 7
Readmissions at Seton - Top 18 Indicators
1. Jugular Venous Distention Indicator
2. Paid by Medicaid Indicator
3. Immunity Disorder Disease Indicator
4. Cardiac Rehab Admit Diagnosis with CHF Indicator
5. Lack of Emotion Support Indicator
6. Self COPD Moderate Limit Health History Indicator
7. With Genitourinary System and Endocrine Disorders
8. Heart Failure History
9. High BNP Indicator
10. Low Hemoglobin Indicator
11. Low Sodium Level Indicator
12. Assisted Living
13. High Cholesterol History
14. Presence of Blood Diseases in Diagnosis History
15. High Blood Pressure Health History
16. Self Alcohol / Drug Use Indicator
17. Heart Attack History
18. Heart Disease History
0123456789
101112131415161718
0 1 2 3 4 5 6
Ran
kingofStrengthofModelV
ariable
ProjectedOddsRa o
18 17 16 15 14 13 12 11 109 8 7 6 5 4 3 2 1
New Insights Uncovered by Combining Content and Predictive Analytics
• Top indicator JVDI not on the original list of 113 - as well as several others
• Assisted Living and Drug and Alcohol Abuse emerged as key predictors - only found in unstructured data
• LVEF and Smoking are significant indicators of CHF but not readmissions
• A combination of actionable and non-actionable factors cause readmissions

© 2013 IBM Corporation 8
The Impact of Readmissions at Seton CHF Patient X – What Happened? Admit / Readmission
30-Day Readmission
98% 98% 96% 95% 96% 100%
Apr-18-2009 May-12-2009 May-20-2009 Oct-11-2009 Nov-24-2009 Dec-20-2009
8 days 24 days 144 days 44 days 26 days
Individual Patient Data at Each Encounter (Patient X @ Dec 20, 2009)
Patient X was hospitalized 6 times over an 8 month period. The same basic information was available at each encounter and Patient X’s readmission prediction score never dropped below 95% (out of possible 100%)
Patient Population Monitoring Clinical and Operational Data

© 2013 IBM Corporation 9
Structured Data
IBM Content Analytics
Hospital Systems EMR
Administration Cost
…
Longitudinal Patient
Data\semantics
Structured Data
Unstructured Data
Clinical notes
Discharge Summaries
Echocardiogram Report
…
Custom
Healthcare Accelerator
Annotators
IBM SPSS Modeler
IPCI Datastore
Modeling & Scoring Results
IPCI Core
User Interaction Layer Operational Systems
Admissions, Discharge, Care Planning Analyst / Research Interfaces
Illustrative CHF Readmissions Architecture
IBM Cognos BI Dashboards - Reports

© 2013 IBM Corporation 10
IBM Natural Language Processing Annotator technology …
Annotators are used to identify valuable facts in unstructured documents (e.g. clinician notes,
consult reports, free text fields in EMRs) and convert to a structured form
Annotators execute in a sequence called the UIMA or Unstructured Information Management Architecture pipeline
IBM Patient Care and Insights Annotators use UMLS to normalize discovered facts to coding systems
Excellent application training services / annotators can be developed in IBM Content Studio
Unified Medical Language System

© 2013 IBM Corporation 11
Healthcare Annotators example
Problems – Result of a series of interim annotations that identify diseases, symptoms, and disorders
– Normalize to standard terms and standard coding systems including SNOMED CT, ICD-9, HCC, CCS
– Capture timeframes of the problem
• determine if past or current problem
– Determine confidence
• Positive, Negative, Rule Out, etc.
• Negation example
– “abdominal pain”
•11

© 2013 IBM Corporation 12
Reducing readmissions - UNC
Risk-stratifying patients
• Focus costly, resource-intense interventions on patients
who are at highest risk
• Example: nurse home visits, home tele-monitoring
Risk prediction models
• Performance is generally poor
• Typically only use structured EMR and/or clams data
• Psycho-social determinants of readmission risk usually not
in structured data
• Free-text diagnostic test results not included in risk model

© 2013 IBM Corporation 13
Develop readmission risk model using structured + unstructured data
Structured
Age
Gender
Race/ethnicity
Insurance type
Diagnoses (ICD-9)
Vital signs
Laboratory results
# previous readmissions
LOS on previous hospitalizations
# Medications
Unstructured
• Physical exam findings
• Diagnostic test results
• Psycho-social factors
o Lives alone, homeless
o Substance abuse
o Medication non-compliance
o Estrangement from family/friends
o Depression

© 2013 IBM Corporation 14
Admission note (social history)

© 2013 IBM Corporation 15
Diagnostic tests (example: echocardiogram)

© 2013 IBM Corporation 16
Structured Data is Not Enough
Unstructured data significantly increases the
richness and accuracy of analysis and decision
making … including paper / faxes
Today’s Care Guidelines Only Get You So Far
Not granular enough to deliver on the promise of
personalized medicine with data driven insights 1, 2
Manual Processes and Traditional Workflow
Approaches Don’t Work
Process complexity increases with disease
complexity … changing conditions require process
adaptability 3
© 2012 IBM Corporation
Prediction Results of Knowledge-driven Features plus Data-driven Features
! AUC significantly improves as complementary data driven risk factors are added into existing knowledge based risk factors.
! A significant AUC increase occurs when we add first 50 data driven features
! "##$! %&#$
! %##$! &#$
' (($) *+, (- . /- $0- ' 123- 4$! . 5' 6- 1- 4$
! 789- 31- *45+*$
: ; <$
#=&$
#=&&$
#=>$
#=>&$
#=?$
#=?&$
#=@$
#$ %##$ "##$ A##$ B##$ &##$ >##$
!"#$
%&' ( ) *$+,$,) - .&*) /$
Knowledge and Guidelines
Data Driven Insights
1. Dijun Luo, Fie Wang, Jimeng Sun, Marianthi Markatou, Jianying Hu,Shahram Ebadollahi, SOR: ScalableOrthogonal Regression for Low-
Redundancy Feature Selection and its Healthcare Applications. SDM’12
2. Jimeng Sun, Jianying Hu, Dijun Luo, Marianthi Markatou, Fei Wang, Shahram Edabollahi, Steven E. Steinhubl, Zahra Daar, Walter F. Stewart.
Combining Knowledge and Data Driven Insights for Identifying Risk Factors using Electronic Health Records. Under submission at AMIA’12 3. Blind Surgeon Metaphor Problem - W.M.P. van der Aalst, M. Weske, and D. Grünbauer. Case Handling: A New Paradigm for Business Process
Support. Data and Knowledge Engineering, 53(2):129-162, 2005
What Have We Learned So Far?

© 2013 IBM Corporation 17
Advanced Care Insights Solution Models • Readmission Prediction and Prevention • Condition Onset or Deterioration Prediction and Prevention • Drug Treatment Efficacy and Effectiveness • Physician, Care Team or Resource Matching • Resource Utilization Pattern and Anomaly Detection • Risk Adjusted Scoring Improvement • Care Pathways Adherence and Deviation
Advanced Care Insights Care Management
Care Management Solution Plans • Disease and Scenario Specific Care Plans and Templates
Visualizations • Care Pathway Flows • Custom Population Analysis
User Experience, Dashboards and Reporting • Case Performance Analysis and Monitoring • Semantic Powered Search
Configurable Solution Options
A Configurable Solution designed to surface evidence based insights from longitudinal data that enables advanced population analysis, personalized interventions and proactive care delivery in complex and costly disease scenarios. Supporting doctors treating patients in
collaborative care models with process complexity, interventions and care transitions.
IBM Advanced Care Insights and Care Management
Care Management Platform
• Assess
• Plan
• Deliver
• Monitor
• Audit
• Analyze
Content
Analytics
Case
Analytics
Similarity
Analytics Predictive
Analytics
Care Management Solution
Pathway
Analytics
Population Evidence Based
Semantic Insights

© 2012 IBM Corporation 18 ©2013 IBM Corporation ©2013 IBM Corporation
Reducing Readmissions with targeted care management – Catalonia Region in Spain
Nationalized Healthcare – Government Payor
Healthcare Provider for the region of Catalonia
~7 million residents served
$4 Billion annual budget
8 Hospitals, 4500 beds, 130 OR, 450 primary care centers
Existing IBM customer since 2005
– SAP implementation for clinical healthcare and financial (8 ICS Hospitals)
Smarter Care proof-of-concept delivered Dec’2012
Phase 1 live March’2013
– 300 patients, 10-20 Care Coordinators, 30-40 Doctors and others
– Developed in 8 weeks
Spain’s most prosperous region

© 2012 IBM Corporation 19 ©2013 IBM Corporation ©2013 IBM Corporation
To achieve the main objectives, care systems must focus on areas of highest impact
Improve quality of care
Lower costs of care
• 25% of population over 65 years, 60% have chronic diseases and consume 70% of healthcare resources
• Complex needs require care by providers across disciplines, acting as a team
• Over time, progress must be tracked and care plans refined to achieve desired outcomes $
Catalonia: Care Management Key Drivers
© 2012 IBM Corporation 20 ©2013 IBM Corporation ©2013 IBM Corporation Source: Catalan Health Plan 2011-2015.
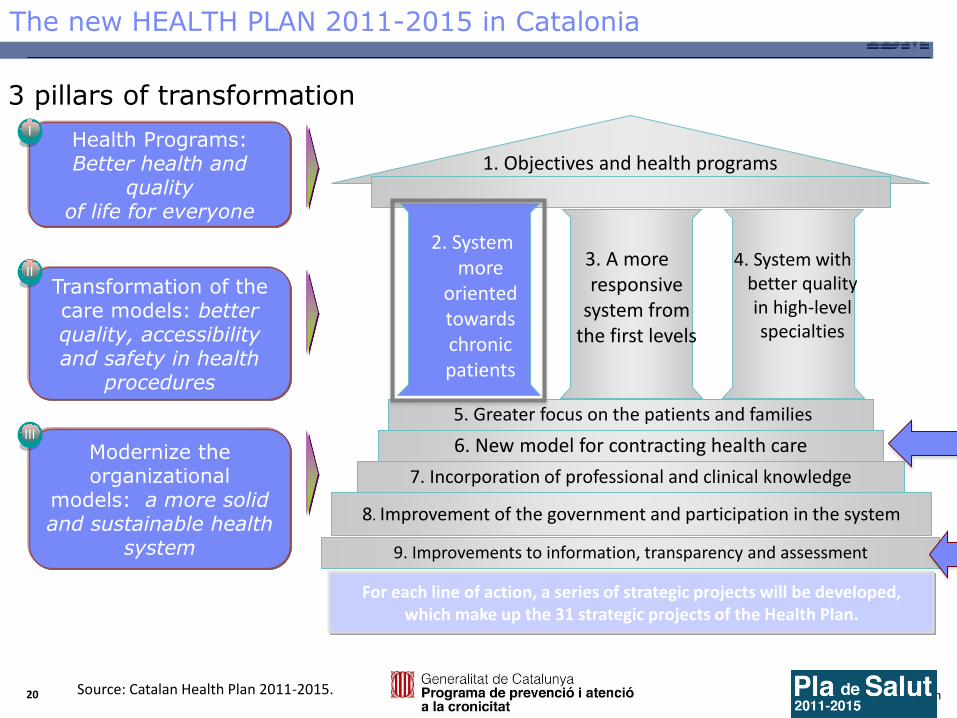
The new HEALTH PLAN 2011-2015 in Catalonia
Health Programs: Better health and
quality of life for everyone
Transformation of the care models: better quality, accessibility and safety in health
procedures
Modernize the organizational
models: a more solid and sustainable health
system
I
II
III
For each line of action, a series of strategic projects will be developed, which make up the 31 strategic projects of the Health Plan.
3 pillars of transformation
9. Improvements to information, transparency and assessment
1. Objectives and health programs
7. Incorporation of professional and clinical knowledge
6. New model for contracting health care
5. Greater focus on the patients and families
8. Improvement of the government and participation in the system
2. System more
oriented towards chronic patients
3. A more responsive
system from the first levels
4. System with better quality in high-level specialties

© 2012 IBM Corporation 21 ©2013 IBM Corporation ©2013 IBM Corporation
Catalonia Care Management Functional Objectives
• Implement a care management program to effective manage care • Overcome fragmented views of health Physical, mental, nutrition,
education, employment & income, safety, family & community, living conditions
• Design care approaches to address holistic needs of the patient
Approach care holistically
Manage care plans for better outcomes
• Reduce Aggressive Treatments: Increase homecare, Reduce A&E cases, Reduce inpatient cases
• Collaborate and coordinate all stakeholders Care providers, activities, services, medication, equipment
• Improve adherence to care management program
Empower Patients
• Improve therapeutic adherence
• Increase the patient co-responsibility in his/her care
• Improve patient satisfaction with the healthcare system

© 2012 IBM Corporation 22 ©2013 IBM Corporation ©2013 IBM Corporation
Holistic View of patient
• Segmentation & Stratification
• MDT portal
• Same information available for all actors involved in the patient
Care Management
• Identification and referral inbound process
• Global treatment plan
• Evaluation and Follow-up
• Regional management – Multidisciplinary Team approach (MDT)
Integration
• Alerts and warnings in real time
• Integration of all relevant data from backend systems
• Access from backend systems
Project Areas and Process Flow
Manage incoming
referrals
Obtain a holistic
view of the
patient
Create an
individualized
care plan
Manage Care
Deliver
Obtain Patient
Alerts and Refine
Plan
Collaborate
across the care
team
Assess Patient
Needs

© 2012 IBM Corporation 23 ©2013 IBM Corporation ©2013 IBM Corporation
Key Project Objectives for Tracking
Indicators Objective
Prevalence recruiting Complex Chronic Patients (PCC) and Advanced Chronic Patients (MACA)
At least to double PCC and MACA prevalence comparing with the rest of control territories
Proportion of PCC/MACA patients with a related activated/reviewed Care Plan
More than 70% patients with a Care Plan
Avoidable emergency admission: COPD / Heart failure / “composite”
Decreasing by 10%
30-day Readmission: COPD / Heart Failure / “Composite”
Decreasing between 5-10%
Mean number of contacts with PHC services Increasing contacts with PHC by 15%
Patient Satisfaction Satisfaction over 85 score
Introduction of Quality of Life (Euroqol) measure Improvement Euroqol score
Regular Medication Plan review Over 80% medication plan reviewed at least 2 times a year

© 2012 IBM Corporation 24 ©2013 IBM Corporation ©2013 IBM Corporation
Key Findings:
1) Predictive Modeling/Risk identification is not enough to reduce
readmissions
2) Care Management is equally as important
3) NLP can help augment both
4) Platform approaches integrating all 3 look promising
© 2012 IBM Corporation 25 ©2013 IBM Corporation ©2013 IBM Corporation


