1 Executive Summary Energy and power consumption are the topmost challenges in the race to Exascale computing 1 . Other constraints include memory, storage, networks, resiliency, software and scalability. Power limits the total number of components that can be packaged on a chip whereas the total energy required by Exascale performance capable systems restricts their location to places closer to sources of affordable power. Extrapolating from current power consumption rates from the Top500 and Green500 lists, Exascale power requirements are of the order of GigaWatts, large enough to power multiple modern cities. Further, these electricity costs continue to escalate globally. High performance supercomputing clusters and parallel systems constitute the largest installed base for supercomputers today 2 . Three kinds of common architectures are primarily considered today in order to address the power and energy constraints of high performance supercomputing in the Petascale to Exascale range. These are: traditional microprocessor (x86 or Power CPUs) based multi-core, multi-socket chip based clusters; hybrid clusters comprising of a mix of x86 CPUs and GPU; and the IBM Blue Gene/Q. The key strengths of x86 based pure CPU and hybrid GPU clusters are commodity components and higher performance of GPU based systems. However, when scaling to multi Petaflops scale, these systems have significantly higher energy and RAS (reliability, availability and serviceability) costs. As compared to pure x86 clusters, GPU based hybrid systems have to also deal with the additional challenges of wider acceptance by the HPC community and software migration costs that add to the overall total cost of ownership (TCO). In terms of energy efficiency, scalability, reliability and overall TCO, the IBM Blue Gene/Q clearly leads the pack and has an edge over the other systems as highlighted by the TCO analysis presented in this paper. This paper covers the results of our TCO study as well as the methodology adopted. Data for anchor systems selected for the study was sourced from publicly available system configuration and performance metrics data for some of the existing and planned supercomputing systems at supercomputing centers across the globe. A TCO model was created for each type of architecture using the Uptime Institute’s data center TCO calculator as the base and then customized to HPC environments. This was enhanced with findings of our earlier analysis 3 to account for RAS costs in supercomputing clusters. Data from anchor systems were fed into the enhanced calculator and results analyzed to arrive at comparative insights that clearly indicate IBM Blue Gene/Q as the most promising, energy and cost effective solution for Petaflop scale clusters and beyond into the Exascale supercomputing needs of the market. Introduction The high end technical high performance computing market continues to expand as the race to Exascale computing intensifies across the globe. Today, there are many installed systems with performance of the order of 100s of Teraflops and a few with Petaflops in the US, Europe, Japan and several other emerging countries such as China. The Top500 list, Green500 list and NERSC estimates indicate that sustained Petaflops systems have approximately 1.5 to 5 million cores 4 . These systems today consume power of the order of 20MW and require almost 16000 square feet of floor space with over $12 million per year as electricity costs. 1 Darpa Study identifies four challenges for Exascale computing: http://www.er.doe.gov/ascr/Research/CS/DARPA%20exascale%20- %20hardware%20(2008).pdf 2 Horst D. Simon: Petascale systems in the US http://acts.nersc.gov/events/Workshop2006/slides/Simon.pdf 3 Why IBM systems lead in Performance, Reliability, Availability and Serviceability (RAS): http://www- 03.ibm.com/systems/resources/systems_deepcomputing_IBMPower-HPC-RAS_Final-1.pdf 4 Horst D. Simon: Petascale systems in the US http://acts.nersc.gov/events/Workshop2006/slides/Simon.pdf IBM Blue Gene/Q: The Most Energy Efficient Green Solution for High Performance Computing A Total Cost of Ownership (TCO) Study comparing the IBM Blue Gene/Q with traditional x86 based cluster systems including systems with Graphics Processing Units (GPUs) Srini Chari, Ph.D., MBA Sponsored by IBM June, 2011 [email protected]Cabot Partners Optimizing Business Value Cabot Partners Group, Inc. 100 Woodcrest Lane, Danbury CT 06810, www.cabotpartners.com
Transcript
1
Executive Summary
Energy and power consumption are the topmost challenges in the race to Exascale computing1. Other constraints include memory, storage, networks, resiliency, software and scalability. Power limits the total number of components that can be packaged on a chip whereas the total energy required by Exascale performance capable systems restricts their location to places closer to sources of affordable power. Extrapolating from current power consumption rates from the Top500 and Green500 lists, Exascale power requirements are of the order of GigaWatts, large enough to power multiple modern cities. Further, these electricity costs continue to escalate globally.
High performance supercomputing clusters and parallel systems constitute the largest installed base for supercomputers today2. Three kinds of common architectures are primarily considered today in order to address the power and energy constraints of high performance supercomputing in the Petascale to Exascale range. These are: traditional microprocessor (x86 or Power CPUs) based multi-core, multi-socket chip based clusters; hybrid clusters comprising of a mix of x86 CPUs and GPU; and the IBM Blue Gene/Q.
The key strengths of x86 based pure CPU and hybrid GPU clusters are commodity components and higher performance of GPU based systems. However, when scaling to multi Petaflops scale, these systems have significantly higher energy and RAS (reliability, availability and serviceability) costs. As compared to pure x86 clusters, GPU based hybrid systems have to also deal with the additionalchallenges of wider acceptance by the HPC community and software migration costs that add to the overall total cost of ownership (TCO). In terms of energy efficiency, scalability, reliability and overall TCO, the IBM Blue Gene/Q clearly leads the pack and has an edge over the other systems as highlighted by the TCO analysis presented in this paper.
This paper covers the results of our TCO study as well as the methodology adopted. Data for anchor systems selected for the study was sourced from publicly available system configuration and performance metrics data for some of the existing and planned supercomputing systems at supercomputing centers across the globe. A TCO model was created for each type of architecture using the Uptime Institute’s data center TCO calculator as the base and then customized to HPC environments. This was enhanced with findings of our earlier analysis3 to account for RAS costs in supercomputing clusters. Data from anchor systems were fed into the enhanced calculator and results analyzed to arrive at comparative insights that clearly indicate IBM Blue Gene/Q as the most promising, energy and cost effective solution for Petaflop scale clusters and beyond into the Exascale supercomputing needs of the market.
Introduction
The high end technical high performance computing market continues to expand as the race to Exascale computing intensifies across the globe. Today, there are many installed systems with performance of the order of 100s of Teraflops and a few with Petaflops in the US, Europe, Japan and several other emerging countries such as China. The Top500 list, Green500 list and NERSC estimates indicate that sustained Petaflops systems have approximately 1.5 to 5 million cores4. These systems today consume power of the order of 20MW and require almost 16000 square feet of floor space with over $12 million per year as electricity costs.
1 Darpa Study identifies four challenges for Exascale computing: http://www.er.doe.gov/ascr/Research/CS/DARPA%20exascale%20-%20hardware%20(2008).pdf2 Horst D. Simon: Petascale systems in the US http://acts.nersc.gov/events/Workshop2006/slides/Simon.pdf3 Why IBM systems lead in Performance, Reliability, Availability and Serviceability (RAS): http://www-03.ibm.com/systems/resources/systems_deepcomputing_IBMPower-HPC-RAS_Final-1.pdf4 Horst D. Simon: Petascale systems in the US http://acts.nersc.gov/events/Workshop2006/slides/Simon.pdf
IBM Blue Gene/Q: The Most Energy Efficient Green Solution for High Performance Computing
A Total Cost of Ownership (TCO) Study comparing the IBM Blue Gene/Q with traditional x86 based cluster systems including systems with Graphics Processing Units (GPUs)
Given the complexity and scale of supercomputing systems, it is important to analyze how different architectures are dealing with power and energy challenges. This paper is a realistic TCO analysis of the fastest supercomputers today, in an attempt to support well-informed business and financial decisions when evaluating and deciding on various supercomputing systems available in the marketplace.
The key supercomputing players today include IBM, Cray, SGI, HP, and DELL with other smaller vendors trying to get a foothold5. The available offerings span a broad range of architectures from pure x86 clusters to hybrid CPU-GPU ones and also to ultra-scalable systems such as IBM’s Blue Gene/Q. IBM leads the market in very large scale supercomputing offerings for unprecedented scalability, portfolio breath, increased energy-efficiency, compute density and operational efficiencies5.
One of the major attributes of a supercomputer is its processing prowess. It is usually measured in total or peak Teraflops (TF). However, in recent years and with escalating energy costs, the metric of gigaflops/watt has becomeincreasingly important. The performance of the highest ranking supercomputer in the Top 500 supercomputer list went from around 140TF in 2005 to an impressive and previously unimaginable 1 Petaflops (PF) in 2008. Today, the horizon of multi-petaflop computing poses the question: what are the true trends in the total costs that are incurred when making investments in supercomputers and what is the business value moving forward?
Several factors in addition to acquisition costs drive the total cost of ownership (TCO). These include significant and
Figure 1: Projections for Computing Systems Power without cooling (Source: NERSC)
Figure 2: Projections for Computer Room Power System + Cooling (Source: NERSC)
3
generic factors such as energy costs, floor space costs, infrastructure hardware costs, cluster management complexity, scalability, and people costs. Other factors such as costs for application porting and migration, retraining of the IT staff, software licensing, unplanned outages and solution deployments are also typically incurred. Newer considerations include ‘Carbon tax’ and the regulatory inevitability of reducing energy consumption6 . Our analysis shows that RAS costs can be significant for Petaflop scale supercomputing clusters.
In this paper, we evaluate the Blue Gene/Q solution from IBM with other comparable HPC platforms from the perspective of an annualized Total Cost of Ownership (TCO) over a three-year period. In order to maintain relevance and objectivity across diverse industry scenarios, in this study we consider common factors such as: energy costs, floor space and data center costs, hardware acquisition costs, downtime costs, and people costs.
The platform differentiators for the Blue Gene/Q are its higher energy efficiency, especially at Petaflops and beyond, unparalleled scalability and smaller footprint (high package density), coupled with a standardized parallel programming model and software tools that permit the migration of a broad number of HPC applications with minimal parallel algorithmic invention. However, relative to standardized commodity pure x86 Cluster architectures which are the mainstream platforms for HPC, the Blue Gene/Q needs continuing focused investments in application migration and optimization. IBM and a broad range of application partners continue to make these investments, and a portfolio of optimized HPC applications both ISV and in-house proprietary applications continues to grow. The Blue Gene has been used in many industrial applications ranging from financial services to the life sciences delivering unsurpassed performance, scalability, energy efficiency, and substantial reduction in data center footprint and costs.
On the path to Exascale, as the die casts shrink, exploding cores and costs increase the complexity to unprecedented levels. The table below shows the growth in the number of cores and the performance in terms of peak flops over the years.
If you look at how electrical and space costs are evolving, (Ref: Simon.pdf) trends show that price performance (FLOPS/$) is increasing faster especially when considering FLOPS/sq. feet and FLOPS/W. With advances in cooling technology, vendors are trying to control both the energy consumption by the supercomputers as well as the energy required to cool the systems given the high compute density in today’s supercomputing clusters. Newer techniques such as liquid cooling allow higher density and cooling efficiency with less floor space use but could result in higher oveall electricity consumption7.
Trends in HPCAs HPC continues to grow faster than the overall server industry, HPC solution providers have geared to engineer breakthroughs in performance, scalability, price/performance, space and energy costs and software for management of applications enablement.
The anticipated energy costs in large HPC data centers in order to power and cool infrastructures are likely to increase more rapidly during the next decade unless economical approaches to energy production are developed in the near term. The IT industry is defining additional metrics such as gigaflops/watt, power use efficiency (PUE) which rate the HPC solution providers and data center operators today. The Top Green 500 list is becoming as important as the Top 500 list of supercomputers as HPC solution providers compete for bragging rights.
6 Preparing for green regulations: http://insidehpc.com/2009/07/16/big-datacenters-prepare-now-new-green-regulations/7 Horst D. Simon: Petascale systems in the US http://acts.nersc.gov/events/Workshop2006/slides/Simon.pdf
4
In recent years, HPC solution providers have made significant innovations in “green” and next generation data centers to reduce the TCO, reflecting not just capital costs but operational and maintenance costs as well. More than an economic pain point or a social responsibility, bringing sound environmental principles to bear in operating the data center can become a competitive advantage and a source of operational stability and increased reliability. It is from this perspective that we compare prominent HPC supercomputing systems available today.
IBM Blue Gene/Q – on the road to Exascale
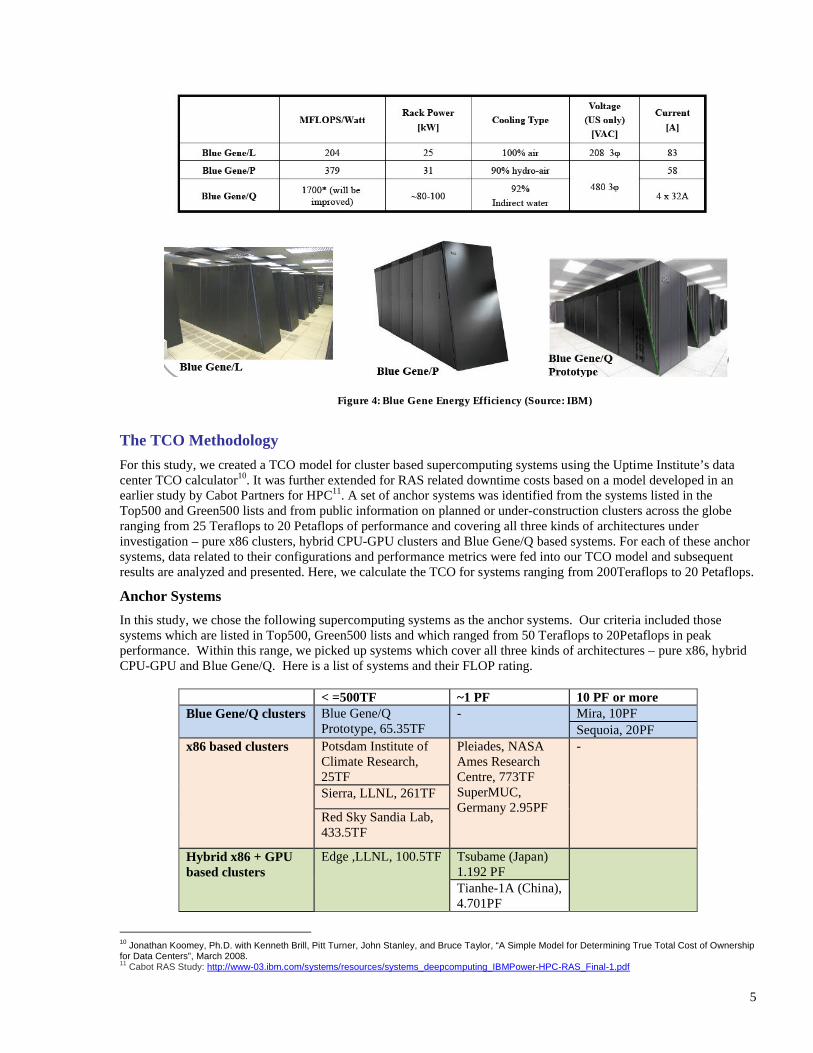
IBM’s Blue Gene technology consists of integrated HPC systems designed using IBM’s Power architecture that is both high performance and energy efficient with the objective of maximizing MFLOPS/W. The water cooling allows maximum rack power use to increase. The future systems are slated to use 100% indirect water cooling and should not exceed 100KW per rack.
Blue Gene/Q Innovations: Blue Gene/Q is the third generation computing architecture in the Blue Gene family of supercomputers with innovations such as:
5D Torus network in compute nodes 2GB/s bidirectional bandwidth, New processing A2 core (4 way SMT) with
o New intelligent pre-fetching algorithms, o Speculative multi-threading and transactional memory support with 32 MB of speculative state, o Hardware mechanisms to support multi-threading8.
In addition, it has software to manage power – the IBM Systems Director Active Energy Manager which is the cornerstone of IBMs energy management framework. It measures, manages and monitors power and thermal energy usage and also integrates with infrastructure and enterprise management suites. As supercomputers scale to millions of cores to reach the Exaflop performance, the underlying resource management software architecture needs to provide a flexible mechanism for a wide variety of workloads executing on the supercomputer. IBM’s Loadleveler with Energy aware scheduling addresses this requirement by setting optimal processor frequency on the set of nodes where a job runs or setting the node frequency at lowest power consumption when no job is scheduled. Blue Gene/Q has a resilient I/O framework that provides higher availability for workloads9.
8 HPC – Innovative technologies for power management based on Power architecture – Dr Luigi Brochard, IBM Deepcomputing division http://www.power.org/events/PowerWebinar-03-29-11/IBM_March_29_Webinar_-_Dr._Luigi.pdf9 Blue Gene/Q Resource Management architecture: http://www.cs.iit.edu/~iraicu/MTAGS10/paper11.pdf
Figure 3: IBM Blue Gene Technology Roadmap (Source IBM)
5
The TCO Methodology
For this study, we created a TCO model for cluster based supercomputing systems using the Uptime Institute’s data center TCO calculator10. It was further extended for RAS related downtime costs based on a model developed in anearlier study by Cabot Partners for HPC11. A set of anchor systems was identified from the systems listed in the Top500 and Green500 lists and from public information on planned or under-construction clusters across the globe ranging from 25 Teraflops to 20 Petaflops of performance and covering all three kinds of architectures under investigation – pure x86 clusters, hybrid CPU-GPU clusters and Blue Gene/Q based systems. For each of these anchor systems, data related to their configurations and performance metrics were fed into our TCO model and subsequent results are analyzed and presented. Here, we calculate the TCO for systems ranging from 200Teraflops to 20 Petaflops.
Anchor Systems
In this study, we chose the following supercomputing systems as the anchor systems. Our criteria included those systems which are listed in Top500, Green500 lists and which ranged from 50 Teraflops to 20Petaflops in peakperformance. Within this range, we picked up systems which cover all three kinds of architectures – pure x86, hybrid CPU-GPU and Blue Gene/Q. Here is a list of systems and their FLOP rating.
< =500TF ~1 PF 10 PF or moreBlue Gene/Q clusters Blue Gene/Q
Prototype, 65.35TF - Mira, 10PF
Sequoia, 20PFx86 based clusters Potsdam Institute of
Climate Research, 25TF
Pleiades, NASA Ames Research Centre, 773TFSuperMUC, Germany 2.95PF
10 Jonathan Koomey, Ph.D. with Kenneth Brill, Pitt Turner, John Stanley, and Bruce Taylor, “A Simple Model for Determining True Total Cost of Ownership for Data Centers”, March 2008. 11 Cabot RAS Study: http://www-03.ibm.com/systems/resources/systems_deepcomputing_IBMPower-HPC-RAS_Final-1.pdf
Figure 4: Blue Gene Energy Efficiency (Source: IBM)
6
Factors that Fuel Annualized TCO at the Petaflop Scale and Beyond
The annualized TCO consists of several significant components such as: electricity costs (Op-Ex) which accounts for the annual energy cost of wattage being consumed; site infrastructure costs (Cap-Ex) that depend on computingdensity, building costs associated with housing the computing infrastructure including networks and storage, cabling,power and cooling equipment, etc.; IT capital hardware acquisition cost (Cap-Ex); downtime costs (Op-Ex) that depend on RAS; and people cost (Op-Ex) restricted only to maintaining the system at the customer site in the data center.
An x86 based Cluster has standardized components for which far greater number of applications are available. This could lower expected deployment and customization costs. Factors like application enablement and migration costs, operating costs and training costs for all systems were not considered in the study. Life cycle costs involved with upgrading equipment were not considered but scalability and reliability of systems were taken into account. Software licensing costs vary across providers and industries and hence were not considered.
The drivers for the annualized TCO components and other associated considerations include:
Energy Consumption: Technological and performance advancements in processor technology enable higher density packaging of processing cores and transistors on a server, and the processor energy consumption has been rising. More transistors translate to increased heat generation per chip resulting in increased operational energy costs.
While energy costs and cooling costs have been a major buzz in the IT industry, our study indicates that actual annualized energy costs are a small component (<10%) of the overall Total Costs of Ownership of a supercomputing cluster. However, energy considerations limit the growth of HPC data center capability especially in urban and suburban locations. This is motivating the trend to locate large computing clusters for supercomputing or cloud computing close to sources of power.
RAS: System failure rates increase with higher temperature, larger footprints, and more IT components. Hence adequate cooling is essential for efficient functioning. In addition to the direct cooling costs involved, cooling systems also occupy additional space on racks. Each rack cannot be fully populated with only server nodes, and more racks would be needed for a particular performance level. As the energy requirements in large data centers rise, additional UPS and backup power capacities are also needed for the operation and cooling of data center. All of these increase energy and RAS costs.
In this analysis, we have included the downtime costs associated with RAS for each of these architectures. The Blue Gene/Q has significantly lower downtime costs associated with reliability, availability and serviceability especially in the multi-Petaflop performance regime where RAS concerns magnify.
Total Floor Area: In the last 5 years, the performance of systems in data centers has increased exponentially. Advanced networking technologies and high speed InfiniBand switches have enabled clustering of a large number of nodes. Most equipment layouts are in a single row of rack-mounted servers, forming aisles between them. Network switches and storage devices, placed alongside the racks, are often as big as the racks themselves. This has caused a significant strain on the infrastructure of data centers that were built for hardware with much less capability than what is being shipped today. The much higher rack power levels have caused customers to further spread out their server products in order to cool them in the current facilities, using up valuable and expensive raised floor space.
The electrically active floor area of a data center is estimated to be only about 40% of the total floor area of the data center. Chillers, fans, pumps, service aisles between racks and other electrically inactive components make up the remaining space in a data center and also add to site costs.
IT Capital Costs: Annualized IT-related capital cost, is acquisition cost for racks including servers, disk and tape storage, and networking depreciated over a three year life.
Other Facilities Costs: Other facilities costs include interest during construction estimated based on total infrastructure and other facility capital costs at a fixed rate of interest, land costs, architectural and engineering fees, and inert gas fire suppression. Land costs are based at $100,000 per acre and architectural and engineering fees are estimated at 5% of kW related infrastructure costs plus other facility costs (electrically active). The fixed capital costs for land, building, etc. are depreciated over fifteen years.
7
Other Operating Expenses - Mainly Labor: The IT and site-related operating expenses account for the total operating expenses incurred in each of the three systems under investigation – Blue Gene/Q, x86 based clusters and hybrid CPU and GPU based clusters. The major component of these costs is people costs. Operating expenses rise significantly for higher performance ranges from 500Tflops to 20 Petaflops. Yet, the Blue Gene/Q has a significant cost advantage here with approximately a 75% reduction compared to the x86 based cluster and a 50 % reduction compared with the hybrid CPU/GPU systems in the multi-Petaflop regime.
Other Considerations: The x86 based cluster architecture is the most prevalent offering in the HPC market with a thriving ecosystem of applications, software tools, and other HPC components. The same is not true for hybrid CPU-GPU based clusters. There is significant complexity involved with CUDA programming models and migration costs are substantial. The costs of application migration, training, and deployment for these hybrid architectures could be significantly more than standard x86 architectures and even the Blue Gene/Q.
While direct electricity costs are not very significant, increased energy consumption lowers computing density, restrictsfloor space and drives up all other operating expenses. This drives up the TCO for HPC systems –growing larger with greater performance - as shown in the next section.
Annualized TCO Results and Discussion
This TCO study includes the energy costs for the entire data center, the IT capital costs and infrastructure equipment capital costs annualized over a 3 year life and a 15 year life for land and other fixed property, and the annualized operating expenses. We studied systems at 200, 500 TF, 1, 5, 10 and 20 Petaflops. We looked at real systems (anchor systems) ranging from 100TF to 20 PF and used the TCO calculator to arrive at the various annualized TCO estimates.
The following charts show the TCO vs. Peak Performance for different architectures from 200TF to 20PF. At lower performance levels (~200TF), the cost of standard x86 based pure CPU clusters is probably slightly more attractive especially if application rework and deployment and training costs are considered. But when scaling up to higher performance systems beyond 200TF, Energy and RAS costs rise up significantly and Blue Gene/Q easily emerges as a winner for the Petaflop range of performance. At higher performance levels, the Blue Gene/Q TCO is much lower reflecting its fundamental advantages of an ultra-scalable and energy-efficient architecture.
The TCO of a typical system consists of five major components: IT Capital Costs, Site Infrastructure Capital Costs, Energy Costs, RAS-related downtime Costs, and other Operating Expenses.
IT Capital costs include the following:
Cost of Servers or nodes in the cluster Internal Routers and Switches, Rack Management Hardware
Site Infrastructure Capital Costs include:
Cabling and external hardwired connections Kw related infrastructure costs including power and cooling equipment Other costs including land, buildings, point of presence etc.
Electricity costs are related to total energy consumption within the data center including IT equipment and cooling, auxiliaries and other facilities related power consumption.
RAS-related downtime costs include the costs associated with failures including wasted labor costs and costs involved in restarting the HPC workloads after a unscheduled system interrupt due to failure.
Other Operating Expenses refer to operating costs besides energy such as:
Network Fees IT and Facilities site management Staff costs Maintenance and Security Property tax and other site related costs.
8
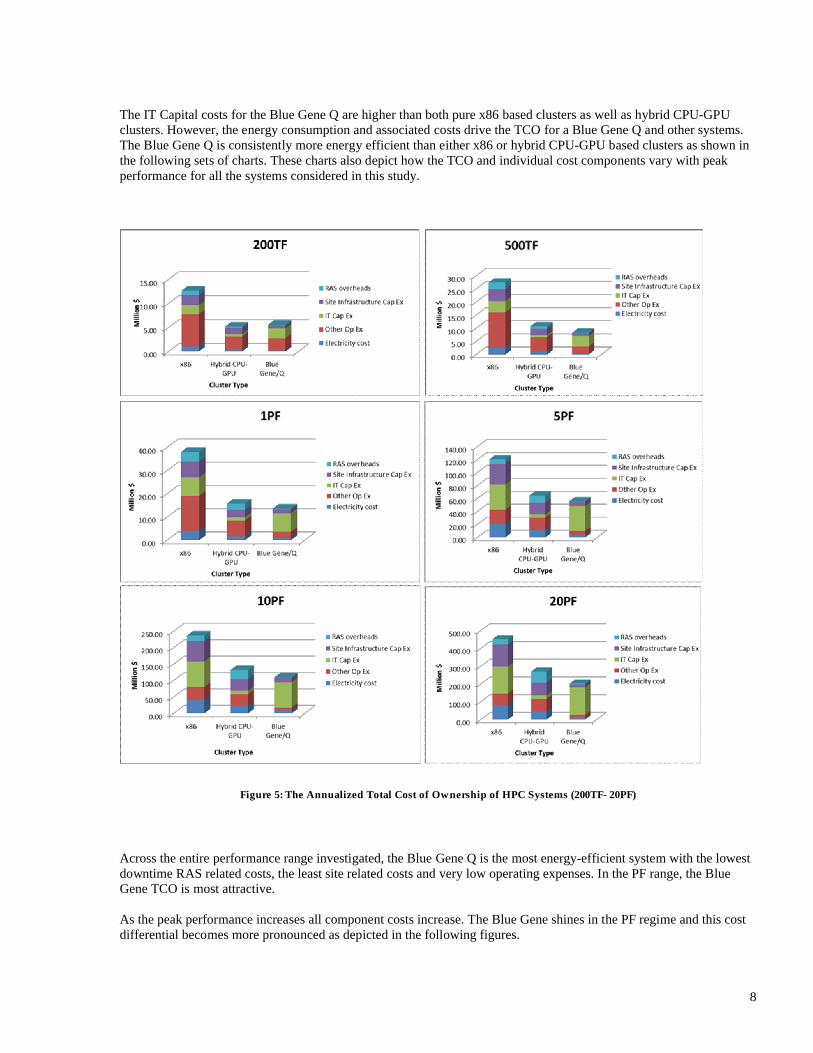
The IT Capital costs for the Blue Gene Q are higher than both pure x86 based clusters as well as hybrid CPU-GPU clusters. However, the energy consumption and associated costs drive the TCO for a Blue Gene Q and other systems. The Blue Gene Q is consistently more energy efficient than either x86 or hybrid CPU-GPU based clusters as shown in the following sets of charts. These charts also depict how the TCO and individual cost components vary with peak performance for all the systems considered in this study.
Figure 5: The Annualized Total Cost of Ownership of HPC Systems (200TF- 20PF)
Across the entire performance range investigated, the Blue Gene Q is the most energy-efficient system with the lowest downtime RAS related costs, the least site related costs and very low operating expenses. In the PF range, the Blue Gene TCO is most attractive.
As the peak performance increases all component costs increase. The Blue Gene shines in the PF regime and this cost differential becomes more pronounced as depicted in the following figures.
9
Figure 6: Annualized TCO and Component Costs versus Peak Performance (200TF-20PF)
Summary
The Blue Gene/Q system from IBM is attractive because of the total performance it offers, and its total cost of ownership that is far lower than the other systems in the study, over the three-year period. Even then, the appetite for HPC is growing by a factor of 10 (from 10 cores in 1992, 100 cores in 1998, 1000 cores in 2004, 10,000 cores in 2010 and a realistic projection of 1.5 million cores by 2018), hence the biggest challenge is to make the systems more efficient, scalable, reliable from the perspective of energy, floor space, operating expense and deployment costs. The Blue Gene/Q has the appropriate architecture to match and exceed these future requirements. Further, the lower energy consumption and smaller footprints of Blue Gene/Q systems especially at larger performance levels significantly enhance system reliability and hence reduce downtime costs.
The x86-based pure CPU clusters have an advantage as most HPC applications are supported on this architecture. Hence application migration and deployment costs could be much smaller, especially for environments that do not require large scalability. This is not true for hybrid GPU based systems – they have significantly high processing power but require CUDA type programming tools and must overcome other practical deployment related issues including reliability. At Petaflop scale performance, brute force check pointing and restart cannot take care of all the failures. Further, this also requires significantly higher memory and/or storage for storing and retrieving the checkpoint. The downtime and associated costs could climb much higher as the move to exascale proceeds. Studies12 indicate onefailure per month per TF for such systems.
12 Horst D. Simon: Petascale systems in the US http://acts.nersc.gov/events/Workshop2006/slides/Simon.pdf
10
For HPC environments that require large scalability and performance and economical operation, the Blue Gene/Q is an excellent platform and the costs of application migration and training could well justify the investment. In any case, very few existing HPC applications scale beyond 10,000 nodes. With higher number of nodes/cores/sockets, many of the application migration costs to harness multi-threading and parallelism for achieving higher performance may anyway be inevitable for any high end cluster system.
More Information
To learn more about IBM’s high performance computing product portfolio and the IBM Blue Gene/Q, contact your IBM representative or visit http://www-03.ibm.com/systems/deepcomptuing/bluegene/
The cost drivers of TCO are quantified based on the model provided by the Uptime Instititue, Inc.: http://uptimeinstitute.org/content/view/57/81
Assumptions
1) With the Blue Gene/Q design, IBM is separating compute nodes from I/O nodes, which will allow compute and I/O capacity to scale independently of each other. The compute drawer has 32 of the single-socket Power A2 modules, and up to 32 of these drawers can be put into a rack for a total of 16,384 cores per rack. The I/O nodes go into an I/O drawer; the drawer can hold up to eight I/O nodes based on the same PowerPC A2 boards, as well as up to eight 10 Gigabit Ethernet or InfiniBand adapters for linking to the outside world. The Blue Gene/Q design allows from 8 to 128 I/O nodes to be used per rack, with 16 being the default.
2) Number of racks calculated based on Blue Gene/Q Prototype at Green 500, Mira and Sequoia data available publicly.
3) Racks are standard (6.5 feet high with 32 Us per rack). Refer to the presentation -http://www.scc.acad.bg/documentation/gara.pdf
4) % of rack filled based on Uptime consulting experience data is available at:http://www.missioncriticalmagazine.com/MC/Home/Files/PDFs/(TUI3011B)SimpleModelDetermingTrueTCO.pdf .
5) Energy use per U taken from Blue Gene press and other online public info. Server power and costs per watt assumes IBM Blue Gene system.
6) Energy use per rack is the product of the total number of Us filled times watts per installed U.7) Total direct IT energy use is the product of watts per rack times the number of racks of a given type.8) Cooling electricity use (including chillers, fans, pumps, CRAC units) is estimated as 0.65 times the IT load .9) Auxiliaries’ electricity use (including UPS/PDU losses, lights, and other losses) is estimated as 0.35 times IT
load.10) Total electricity use is the sum of IT, cooling, and auxiliaries. Cooling and auxiliaries together are equal to
the IT load (Power overhead multiplier = 2.0).11) Electricity intensity is calculated by dividing the power associated with a particular component (eg IT load) by
the total electrically active area of the facility.12) Total electricity consumption is calculated using the total power, a power load factor of 95%, and 8766
hours/year (average over leap and non-leap years).13) Total energy cost calculated by multiplying electricity consumption by the average U.S. industrial electricity
price in 2011 as per http://www.eia.doe.gov/oiaf/aeo/pdf/0383(2010).pdf (8.6 cents/kWh, 2008 dollars).14) Watts per thousand 2009 dollars of IT costs taken from selective review of market and technology data.
Server number calculated assuming IBM Blue Gene /Q prototype public information available online.15) Cost per filled U taken from Blue Gene Q prototype and Mira/Sequoia public info. Server street cost
calculated assuming IBM Mira cost $50,000,000 plus 4-5 million dollars for electricity costs.16) External hardwired connections costs are Uptime estimates.17) Internal routers and switch costs are Uptime estimates.18) Rack management hardware costs are Uptime estimates.19) Total costs for racks, hardwired connections, and internal routers and switches are the product of the cost per
rack and the number of racks.20) Cabling costs totals are Uptime estimates.21) Point of presence costs are Uptime estimates for a dual POP OC96 installation.22) KW related infrastructure costs (taken from Turner and Seader 2006) are based on Tier 3 architecture,
$23,801 per kW cost. Assumes immediate full build out. Includes costs for non-electrically active area. Construction costs escalated to 2009$ using Turner construction cost indices for 2010 and 2011 (http://www.turnerconstruction.com/corporate/content.asp?d=20) and 2011forecast (http://www.turnerconstruction.com/corporate/content.asp?d=5952). Electricity prices escalated to 2009$
11
using the GDP deflator 2009 to 2010 and 3% inflation for 2010 to 2011.23) RAS costs are based on inputs whereby hourly cost of downtime ranges from thousands to millions of dollars
across applications, industries and companies. We are taking a conservative number of $1000 - and multiplying it by total downtime for the system under investigation. It was further scaled depending upon the total people time involved in the cluster IT maintenance and upkeep.
Copyright ® 2011. Cabot Partners Group. Inc. All rights reserved. Other companies’ product names or trademarks or service marks are used herein for identification only and belong to their respective owner. All images and supporting data were obtained from IBM or from public sources. The information and product recommendations made by the Cabot Partners Group are based upon public information and sources and may also include personal opinions both of the Cabot Partners Group and others, all of which we believe to be accurate and reliable. However, as market conditions change and not within our control, the information and recommendations are made without warranty of any kind. The Cabot Partners Group, Inc. assumes no responsibility or liability for any damages whatsoever (including incidental, consequential or otherwise), caused by your use of, or reliance upon, the information and recommendations presented herein, nor for any inadvertent errors which may appear in this document.