Page 1
AT.IllinoisState.edu/EDA
IBM Cognos Analytics
Records and Enrollment – Participants Guide
Welcome to Cognos Records and Enrollment Training!
Today’s objectives include:
• Gain a Basic Understanding of Cognos
• Understand University policies on data security including FERPA
• Understand the information in the Records and Enrollment package
• View reports using the Records and Enrollment package
• Understand which package/report to use for your reporting needs
• Request access and additional assistance
Table of Contents: Guided Instruction
Cognos Overview…………………...…………………………...……………………..….2
Navigate to Cognos………...…………………………...……………………..….2
Welcome Page Overview………...…………...………...……………………..….3
View a Report………...…………………………...……………………..………………...4
Navigate to a Report……………………...……………………..………………...4
Overview a Report Viewer………………………………………………………..5
Run as/Export Options……………………………………………………………6
Export to Excel……………………………………………………………………6
Change Selected Prompts…………………………………………………………6
Subscribe to a Report…………………………………….………………………..7
Manage a Subscription……………………………………………………………7
Using the Interactive Tool Bar……………………………………………………9
Navigate to a Standard Report……………………………………………...……11
Independent Practice …………………………………………………………………..…………12
Guided Instruction
Student Registration Package – Department Registration Dashboard…………………...17
Request Access……………………………………………………………………..……18
Help…...………………………………………………………………………………………...…..19
Supported Web Browsers
Cognos supports most major browsers with the exception of Microsoft Edge and Mozilla
Firefox’s recent releases.
Check the home page of our website AT.IllinoisState.edu/EDA for up-to-date browser issues.
Page 2
Records and Enrollment – Participants Guide
Updated 1-8-20 AT.IllinoisState.edu/EDA 2 | P a g e
Guided Instruction
The following instructions cover the basic layout of Cognos and how to view and edit reports.
A. Overview of the Welcome Page
Navigate to Cognos For this training session, we will be viewing reports in the Test environment of Cognos.
Steps:
1. Open Google Chrome.
2. Go to insight-test.ilstu.edu.
3. Enter the Username and password on the sheet of paper you were given. Do NOT enter
your own ULID and password.
Page 3
Records and Enrollment – Participants Guide
Updated 1-8-20 AT.IllinoisState.edu/EDA 3 | P a g e
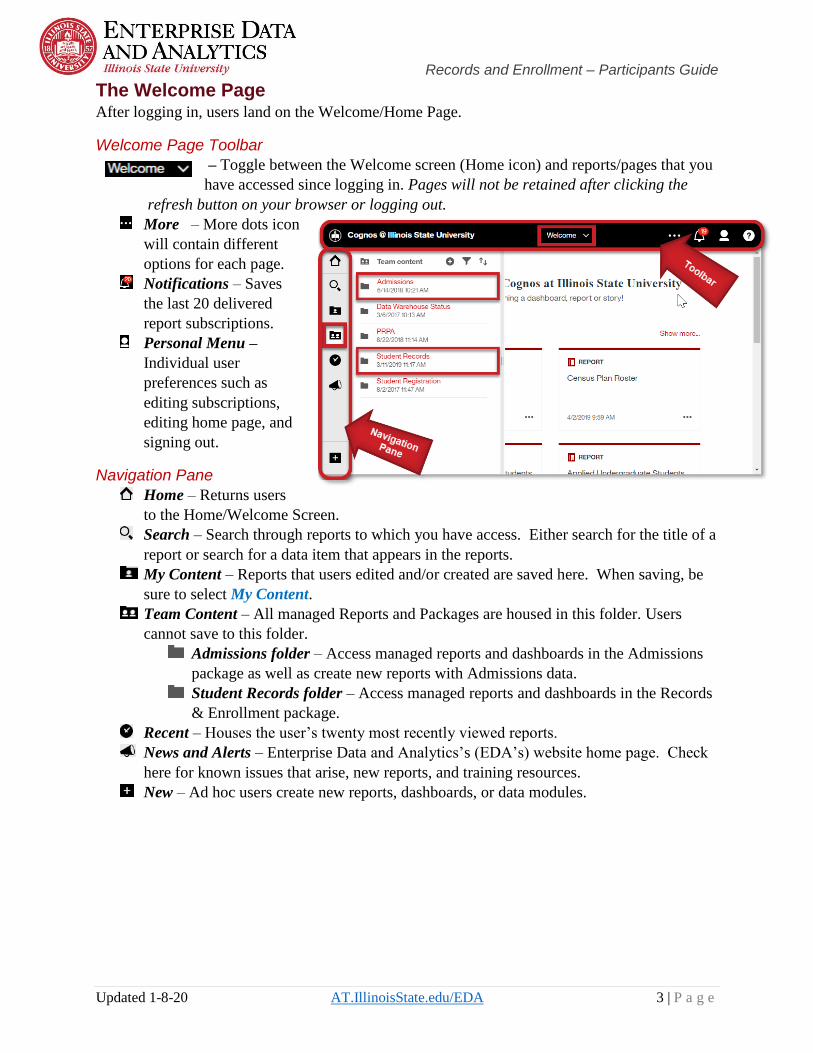
The Welcome Page After logging in, users land on the Welcome/Home Page.
Welcome Page Toolbar
– Toggle between the Welcome screen (Home icon) and reports/pages that you
have accessed since logging in. Pages will not be retained after clicking the
refresh button on your browser or logging out.
More – More dots icon
will contain different
options for each page.
Notifications – Saves
the last 20 delivered
report subscriptions.
Personal Menu –
Individual user
preferences such as
editing subscriptions,
editing home page, and
signing out.
Navigation Pane
Home – Returns users
to the Home/Welcome Screen.
Search – Search through reports to which you have access. Either search for the title of a
report or search for a data item that appears in the reports.
My Content – Reports that users edited and/or created are saved here. When saving, be
sure to select My Content.
Team Content – All managed Reports and Packages are housed in this folder. Users
cannot save to this folder.
Admissions folder – Access managed reports and dashboards in the Admissions
package as well as create new reports with Admissions data.
Student Records folder – Access managed reports and dashboards in the Records
& Enrollment package.
Recent – Houses the user’s twenty most recently viewed reports.
News and Alerts – Enterprise Data and Analytics’s (EDA’s) website home page. Check
here for known issues that arise, new reports, and training resources.
New – Ad hoc users create new reports, dashboards, or data modules.
Page 4
Records and Enrollment – Participants Guide
Updated 1-8-20 AT.IllinoisState.edu/EDA 4 | P a g e
B. View a Report The following instructions cover how to view a managed report (report that was created and
saved by the EDA team) in Cognos. The information covered can be applied to any interactive
report in Cognos. Feel free to select a different set of prompts than the ones demonstrated.
Navigate to a Report
In Cognos Analytics, all managed reports are housed in the Team Content pane.
In this example, we will be viewing the Plan Roster Report
which provides academic information for enrolled students by
college, department, plan or plan/subplan.
Steps:
1. Report Navigation: Team Content > Student Records
Within the Student Records package folder, there are three folders:
Dashboards – Houses the dashboards specific to the package information. The Records
and Enrollment package has two dashboards:
• Advisor Dashboard - Contains pertinent student details for advisors such as a
student's current program, plan and subplan, hours towards degree, cumulative
GPA, service indicators, risk factor, and student groups.
• Department Grade Distribution Dashboard – Displays University/College,
Department, and Course grade averages, counts, and percent's by term and
grade. Use the tabs to navigate between the College, Department, and Course.
Filters are located at the top of the screen to further personalize the selections.
Packages – Houses all data items in the Records and Enrollment Package. This folder is
used when creating reports with ad hoc access.
Reports – Houses all managed reports. Most users spend most of their time in this folder.
2. Click the Reports folder.
3. Select the Plan Roster Report.
4. Suggested Prompts:
a) Step #1 Term – Spring Semester 2020
b) Step #2 Career - Undergraduate
c) Step #3 Type Criteria – Plan & Subplan.
d) Click the Next button.
e) Step #1 Plans – Agriculture BS and Agriculture Addl Plan.
f) Click the Reprompt button.
g) Step #2 SubPlan – Select All link at the bottom of the box.
5. Once you have selected your prompts, click the Finish button at the bottom of the screen.
Prompt Screen When running a report, the prompt screen will first appear. Prompt selections are
made before a report can run. The prompt selections act as filters, so only the information you wish
to view is displayed. Every report’s prompt screen is different depending on the purpose of the report.
For a list of all the reports and a
description, visit AT.ilstu.edu/enterprise-
data-analytics/bi-reports/.
Page 5
Records and Enrollment – Participants Guide
Updated 1-8-20 AT.IllinoisState.edu/EDA 5 | P a g e
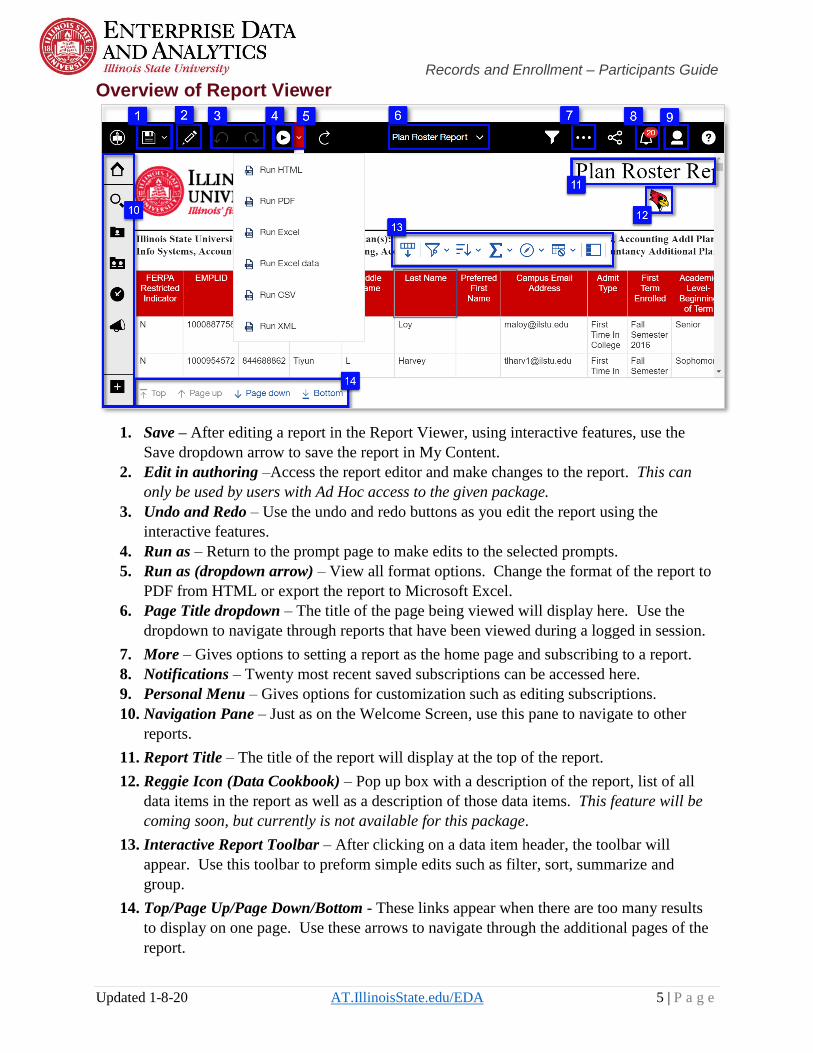
Overview of Report Viewer
1. Save – After editing a report in the Report Viewer, using interactive features, use the
Save dropdown arrow to save the report in My Content.
2. Edit in authoring –Access the report editor and make changes to the report. This can
only be used by users with Ad Hoc access to the given package.
3. Undo and Redo – Use the undo and redo buttons as you edit the report using the
interactive features.
4. Run as – Return to the prompt page to make edits to the selected prompts.
5. Run as (dropdown arrow) – View all format options. Change the format of the report to
PDF from HTML or export the report to Microsoft Excel.
6. Page Title dropdown – The title of the page being viewed will display here. Use the
dropdown to navigate through reports that have been viewed during a logged in session.
7. More – Gives options to setting a report as the home page and subscribing to a report.
8. Notifications – Twenty most recent saved subscriptions can be accessed here.
9. Personal Menu – Gives options for customization such as editing subscriptions.
10. Navigation Pane – Just as on the Welcome Screen, use this pane to navigate to other
reports.
11. Report Title – The title of the report will display at the top of the report.
12. Reggie Icon (Data Cookbook) – Pop up box with a description of the report, list of all
data items in the report as well as a description of those data items. This feature will be
coming soon, but currently is not available for this package.
13. Interactive Report Toolbar – After clicking on a data item header, the toolbar will
appear. Use this toolbar to preform simple edits such as filter, sort, summarize and
group.
14. Top/Page Up/Page Down/Bottom - These links appear when there are too many results
to display on one page. Use these arrows to navigate through the additional pages of the
report.
Page 6
Records and Enrollment – Participants Guide
Updated 1-8-20 AT.IllinoisState.edu/EDA 6 | P a g e
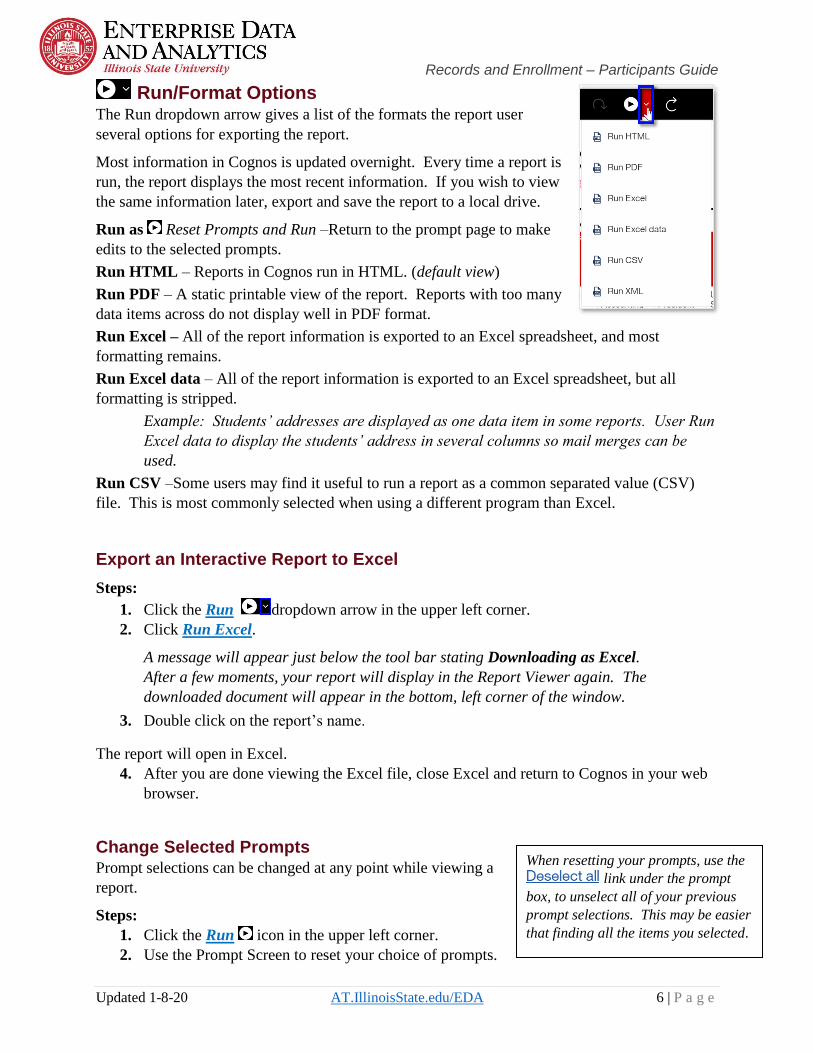
Run/Format Options
The Run dropdown arrow gives a list of the formats the report user
several options for exporting the report.
Most information in Cognos is updated overnight. Every time a report is
run, the report displays the most recent information. If you wish to view
the same information later, export and save the report to a local drive.
Run as Reset Prompts and Run –Return to the prompt page to make
edits to the selected prompts.
Run HTML – Reports in Cognos run in HTML. (default view)
Run PDF – A static printable view of the report. Reports with too many
data items across do not display well in PDF format.
Run Excel – All of the report information is exported to an Excel spreadsheet, and most
formatting remains.
Run Excel data – All of the report information is exported to an Excel spreadsheet, but all
formatting is stripped.
Example: Students’ addresses are displayed as one data item in some reports. User Run
Excel data to display the students’ address in several columns so mail merges can be
used.
Run CSV –Some users may find it useful to run a report as a common separated value (CSV)
file. This is most commonly selected when using a different program than Excel.
Export an Interactive Report to Excel
Steps:
1. Click the Run dropdown arrow in the upper left corner.
2. Click Run Excel.
A message will appear just below the tool bar stating Downloading as Excel.
After a few moments, your report will display in the Report Viewer again. The
downloaded document will appear in the bottom, left corner of the window.
3. Double click on the report’s name.
The report will open in Excel.
4. After you are done viewing the Excel file, close Excel and return to Cognos in your web
browser.
Change Selected Prompts Prompt selections can be changed at any point while viewing a
report.
Steps:
1. Click the Run icon in the upper left corner.
2. Use the Prompt Screen to reset your choice of prompts.
When resetting your prompts, use the
link under the prompt
box, to unselect all of your previous
prompt selections. This may be easier
that finding all the items you selected.
Page 7
Records and Enrollment – Participants Guide
Updated 1-8-20 AT.IllinoisState.edu/EDA 7 | P a g e
Subscribe to a Report Users subscribe to reports they frequently view. Updated reports are sent via email and saved in
Cognos based on the schedule the user sets up.
Steps:
1. From the report viewer screen, click the More dots icon in the upper right corner.
2. Click Subscribe.
3. Use the On day(s) field to select the days of the week the report will be run and sent.
Depending on the day(s) of the week you wish to receive the subscription, you
may need to unselect the current day of the week.
4. Use the Time field to enter the time the report will be run and sent.
Most information is updated overnight. For the most up-to-date report, enter a
time after 4:00AM.
5. Click the arrow at the end of the Format field.
a. Confirm HTML is selected.
b. Select Excel.
c. Click the Done button.
6. Click the arrow at the end of the Delivery field.
a. Select Send report by email.
b. When two options appear, select Attach the report
c. Unselect Include a link to the report.
d. Confirm Save report is selected.
e. Click the Done button.
7. Click the Create button.
Once a subscription has been sent it will also be saved under the Notifications icon on the
right side of the tool bar.
Manage Subscriptions Once a user has subscribed to a report, the subscriptions can be edited or deleted.
Steps:
1. Click the Personal Menu tab.
2. Click My schedules and subscriptions.
3. Hover over the subscription you wish to delete. Click the More dots that will appear
to the right of the subscription.
4. Click Modify this subscription to edit.
All selections can be edited the same way they were originally selected with the
exception that Prompts can now be edited as well.
Subscriptions are displayed in the order they were last modified (created or
edited.) The most recent subscription created will be at the bottom of the list.
Page 8
Records and Enrollment – Participants Guide
Updated 1-8-20 AT.IllinoisState.edu/EDA 8 | P a g e
5. To edit the Prompts field:
a. Click the arrow at the end of the Prompts field.
b. Click Edit in the top right.
c. Select the prompts of your choice.
d. Click the Finish button.
e. Click the Back arrow top left of the pane.
f. Click the Update button.
Once the Update button has been clicked, the subscriptions has been edited. The Modified date
and time will be updated as well.
Return to the Plan Roster Report By going to the My schedule and subscriptions page, we left the report viewer page. Use the
dropdown in the top middle of the toolbar to return to reports you have viewed during that log in
session.
Steps:
1. Click the dropdown arrow by the name of the page My schedules and subscriptions in
the middle of the top toolbar.
2. After the dropdown list appears, click Plan Roster Report.
The report will load with the prompt selections you previously made.
After clicking the Edit link, a message saying, “Generating prompt inputs for
report,” will display under the toolbar. It may take several moments for the
prompt screen pop up to appear. Be patient. Do not keep clicking the Edit link.
Page 9
Records and Enrollment – Participants Guide
Updated 1-8-20 AT.IllinoisState.edu/EDA 9 | P a g e
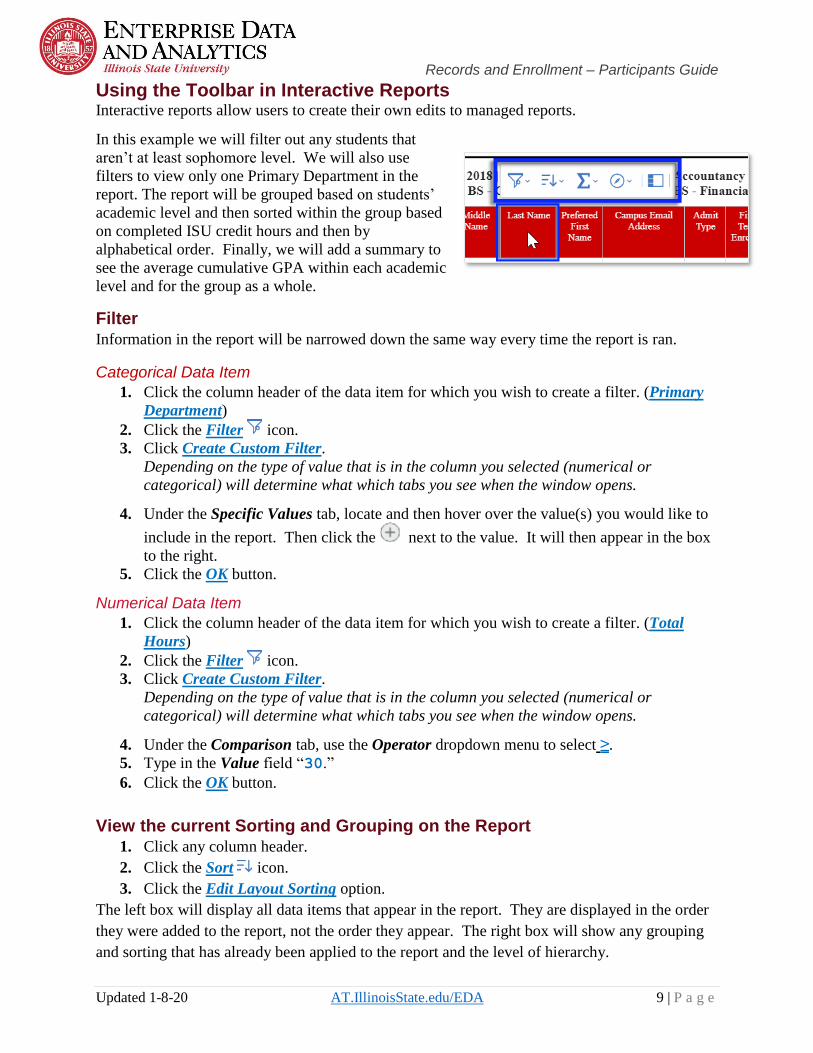
Using the Toolbar in Interactive Reports Interactive reports allow users to create their own edits to managed reports.
In this example we will filter out any students that
aren’t at least sophomore level. We will also use
filters to view only one Primary Department in the
report. The report will be grouped based on students’
academic level and then sorted within the group based
on completed ISU credit hours and then by
alphabetical order. Finally, we will add a summary to
see the average cumulative GPA within each academic
level and for the group as a whole.
Filter Information in the report will be narrowed down the same way every time the report is ran.
Categorical Data Item
1. Click the column header of the data item for which you wish to create a filter. (Primary
Department)
2. Click the Filter icon.
3. Click Create Custom Filter.
Depending on the type of value that is in the column you selected (numerical or
categorical) will determine what which tabs you see when the window opens.
4. Under the Specific Values tab, locate and then hover over the value(s) you would like to
include in the report. Then click the next to the value. It will then appear in the box
to the right.
5. Click the OK button.
Numerical Data Item
1. Click the column header of the data item for which you wish to create a filter. (Total
Hours)
2. Click the Filter icon.
3. Click Create Custom Filter.
Depending on the type of value that is in the column you selected (numerical or
categorical) will determine what which tabs you see when the window opens.
4. Under the Comparison tab, use the Operator dropdown menu to select ≥.
5. Type in the Value field “30.”
6. Click the OK button.
View the current Sorting and Grouping on the Report 1. Click any column header.
2. Click the Sort icon.
3. Click the Edit Layout Sorting option.
The left box will display all data items that appear in the report. They are displayed in the order
they were added to the report, not the order they appear. The right box will show any grouping
and sorting that has already been applied to the report and the level of hierarchy.
Page 10
Records and Enrollment – Participants Guide
Updated 1-8-20 AT.IllinoisState.edu/EDA 10 | P a g e
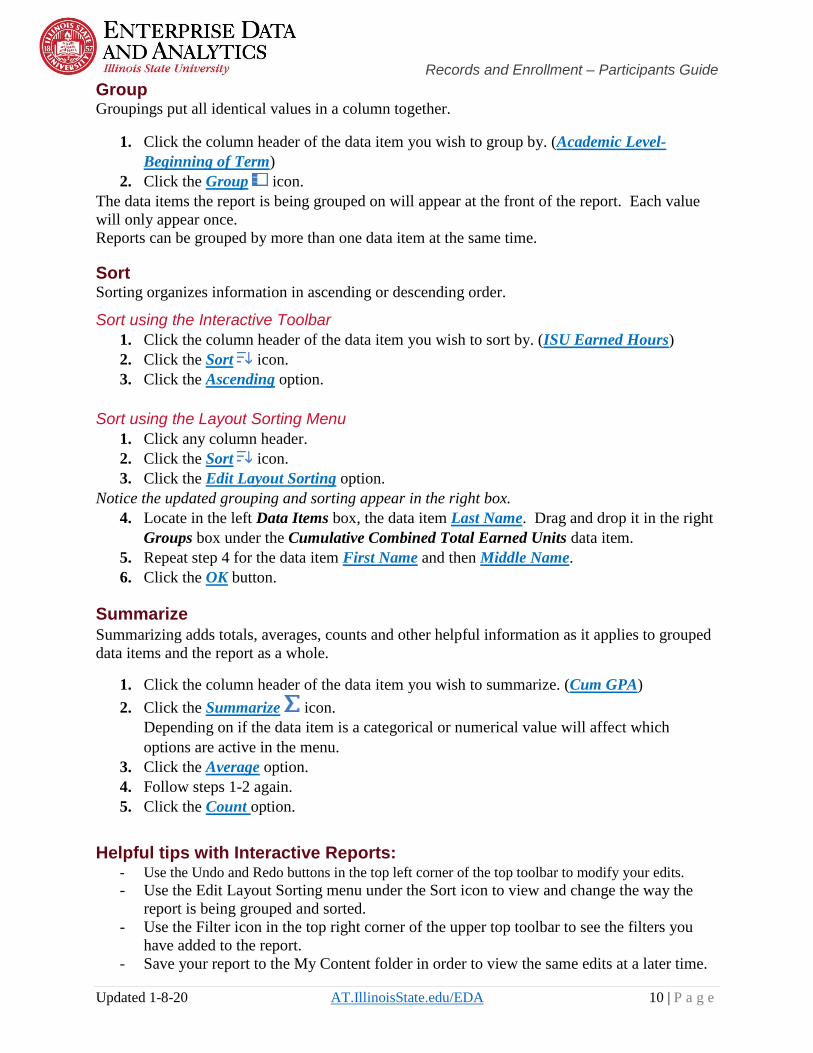
Group Groupings put all identical values in a column together.
1. Click the column header of the data item you wish to group by. (Academic Level-
Beginning of Term)
2. Click the Group icon.
The data items the report is being grouped on will appear at the front of the report. Each value
will only appear once.
Reports can be grouped by more than one data item at the same time.
Sort Sorting organizes information in ascending or descending order.
Sort using the Interactive Toolbar
1. Click the column header of the data item you wish to sort by. (ISU Earned Hours)
2. Click the Sort icon.
3. Click the Ascending option.
Sort using the Layout Sorting Menu
1. Click any column header.
2. Click the Sort icon.
3. Click the Edit Layout Sorting option.
Notice the updated grouping and sorting appear in the right box.
4. Locate in the left Data Items box, the data item Last Name. Drag and drop it in the right
Groups box under the Cumulative Combined Total Earned Units data item.
5. Repeat step 4 for the data item First Name and then Middle Name.
6. Click the OK button.
Summarize Summarizing adds totals, averages, counts and other helpful information as it applies to grouped
data items and the report as a whole.
1. Click the column header of the data item you wish to summarize. (Cum GPA)
2. Click the Summarize icon.
Depending on if the data item is a categorical or numerical value will affect which
options are active in the menu.
3. Click the Average option.
4. Follow steps 1-2 again.
5. Click the Count option.
Helpful tips with Interactive Reports: - Use the Undo and Redo buttons in the top left corner of the top toolbar to modify your edits.
- Use the Edit Layout Sorting menu under the Sort icon to view and change the way the
report is being grouped and sorted.
- Use the Filter icon in the top right corner of the upper top toolbar to see the filters you
have added to the report.
- Save your report to the My Content folder in order to view the same edits at a later time.
Page 11
Records and Enrollment – Participants Guide
Updated 1-8-20 AT.IllinoisState.edu/EDA 11 | P a g e
Navigate to Another Report Navigate to the Instructor Schedule report in the Records and Enrollment package. The report
displays course information of a class by individual instructor or by all instructors within a
Subject, College or Department.
1. Click the Team Content icon.
Cognos will remember the folder path previously followed. The following folder
selection should be represented in the breadcrumbs at the top of the navigation pane.
Student Records > Reports
2. Click the Instructor Schedule
3. Suggested prompts for the Prompt Screen:
a. Step #1 Term: Spring Semester 2020
b. Step #2 Criteria: Subject
c. Click the Next button.
d. Step #3 Class Subject: Biological Sciences and Chemistry
4. Click the Finish button.
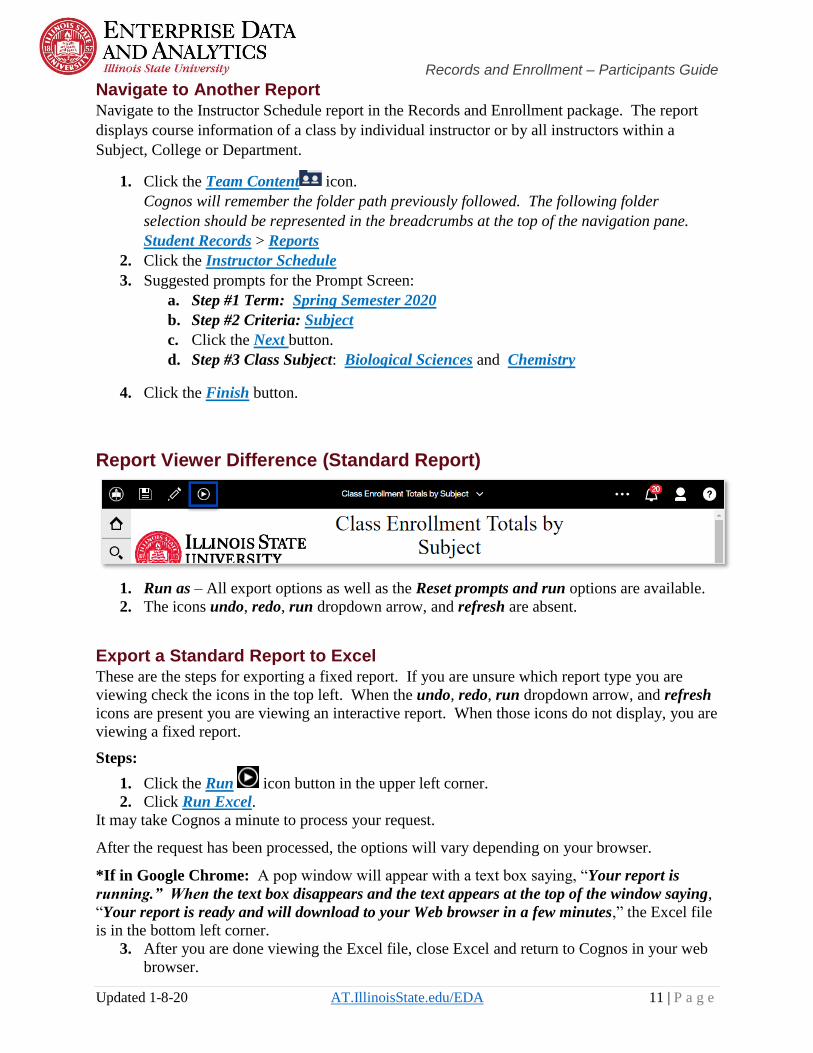
Report Viewer Difference (Standard Report)
1. Run as – All export options as well as the Reset prompts and run options are available.
2. The icons undo, redo, run dropdown arrow, and refresh are absent.
Export a Standard Report to Excel These are the steps for exporting a fixed report. If you are unsure which report type you are
viewing check the icons in the top left. When the undo, redo, run dropdown arrow, and refresh
icons are present you are viewing an interactive report. When those icons do not display, you are
viewing a fixed report.
Steps:
1. Click the Run icon button in the upper left corner.
2. Click Run Excel.
It may take Cognos a minute to process your request.
After the request has been processed, the options will vary depending on your browser.
*If in Google Chrome: A pop window will appear with a text box saying, “Your report is
running.” When the text box disappears and the text appears at the top of the window saying,
“Your report is ready and will download to your Web browser in a few minutes,” the Excel file
is in the bottom left corner.
3. After you are done viewing the Excel file, close Excel and return to Cognos in your web
browser.
Page 12
Records and Enrollment – Participants Guide
Updated 1-8-20 AT.IllinoisState.edu/EDA 12 | P a g e
C. View a Report – Independent Practice
The following instructions will walk you through the View a Report independent activity.
Follow the detailed steps or if you would like to test yourself, try to complete the task in
the first line before reading the step by step
instructions.
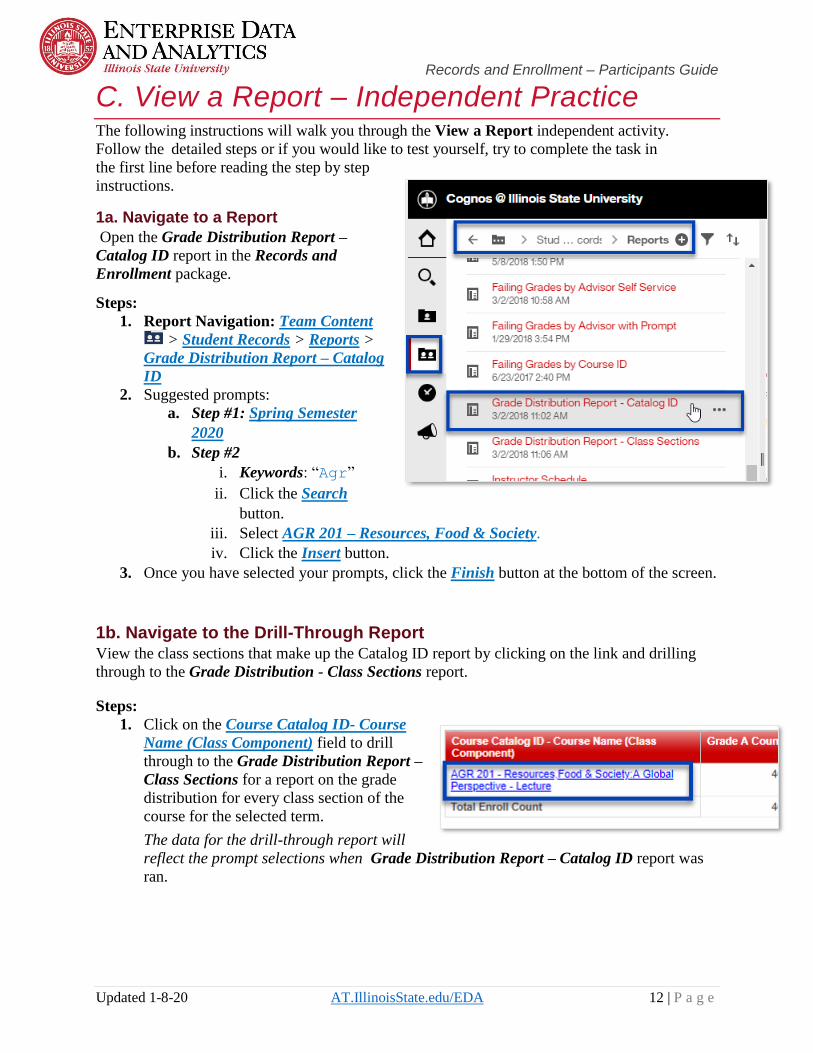
1a. Navigate to a Report
Open the Grade Distribution Report –
Catalog ID report in the Records and
Enrollment package.
Steps:
1. Report Navigation: Team Content
> Student Records > Reports >
Grade Distribution Report – Catalog
ID
2. Suggested prompts:
a. Step #1: Spring Semester
2020
b. Step #2
i. Keywords: “Agr”
ii. Click the Search
button.
iii. Select AGR 201 – Resources, Food & Society.
iv. Click the Insert button.
3. Once you have selected your prompts, click the Finish button at the bottom of the screen.
1b. Navigate to the Drill-Through Report View the class sections that make up the Catalog ID report by clicking on the link and drilling
through to the Grade Distribution - Class Sections report.
Steps:
1. Click on the Course Catalog ID- Course
Name (Class Component) field to drill
through to the Grade Distribution Report –
Class Sections for a report on the grade
distribution for every class section of the
course for the selected term.
The data for the drill-through report will
reflect the prompt selections when Grade Distribution Report – Catalog ID report was
ran.
Page 13
Records and Enrollment – Participants Guide
Updated 1-8-20 AT.IllinoisState.edu/EDA 13 | P a g e
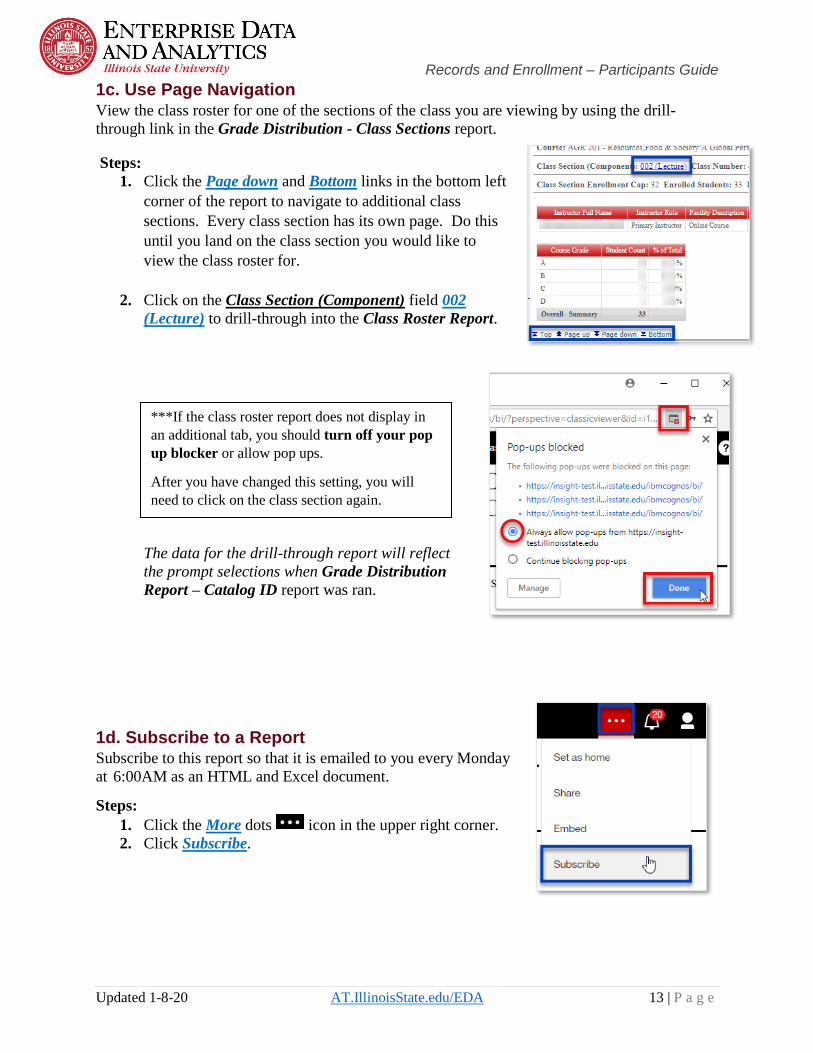
1c. Use Page Navigation View the class roster for one of the sections of the class you are viewing by using the drill-
through link in the Grade Distribution - Class Sections report.
Steps:
1. Click the Page down and Bottom links in the bottom left
corner of the report to navigate to additional class
sections. Every class section has its own page. Do this
until you land on the class section you would like to
view the class roster for.
2. Click on the Class Section (Component) field 002
(Lecture) to drill-through into the Class Roster Report.
The data for the drill-through report will reflect
the prompt selections when Grade Distribution
Report – Catalog ID report was ran.
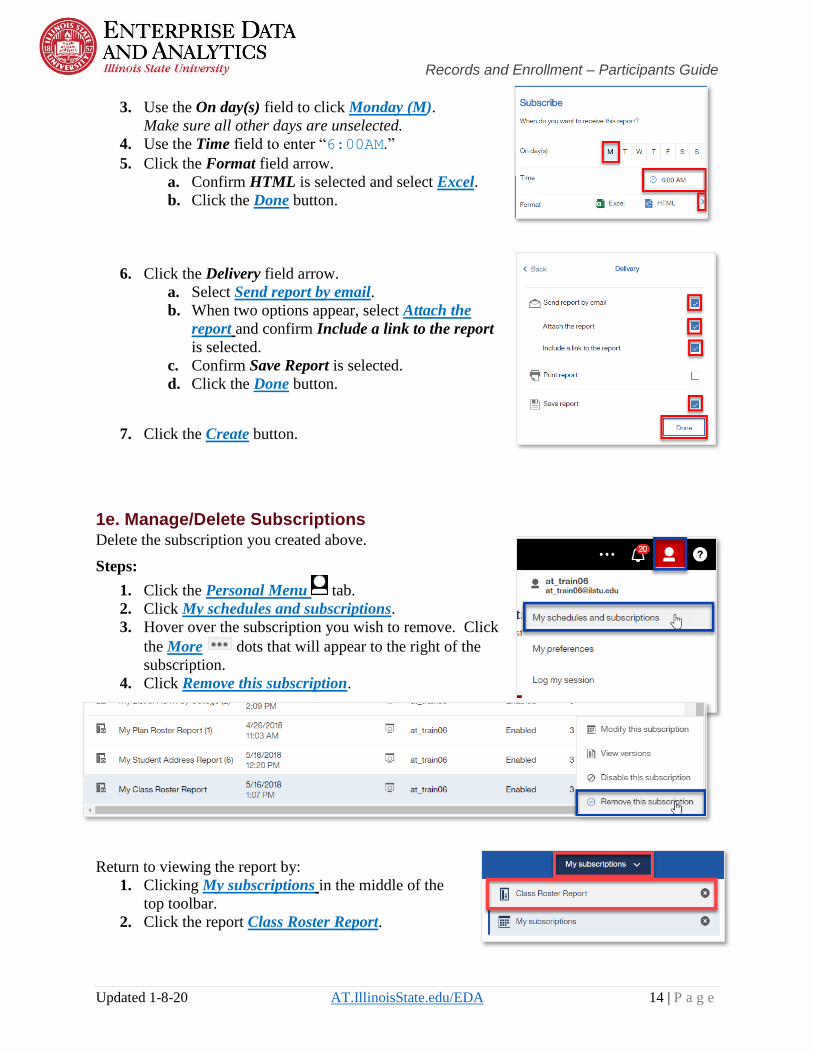
1d. Subscribe to a Report Subscribe to this report so that it is emailed to you every Monday
at 6:00AM as an HTML and Excel document.
Steps:
1. Click the More dots icon in the upper right corner.
2. Click Subscribe.
***If the class roster report does not display in
an additional tab, you should turn off your pop
up blocker or allow pop ups.
After you have changed this setting, you will
need to click on the class section again.
Page 14
Records and Enrollment – Participants Guide
Updated 1-8-20 AT.IllinoisState.edu/EDA 14 | P a g e
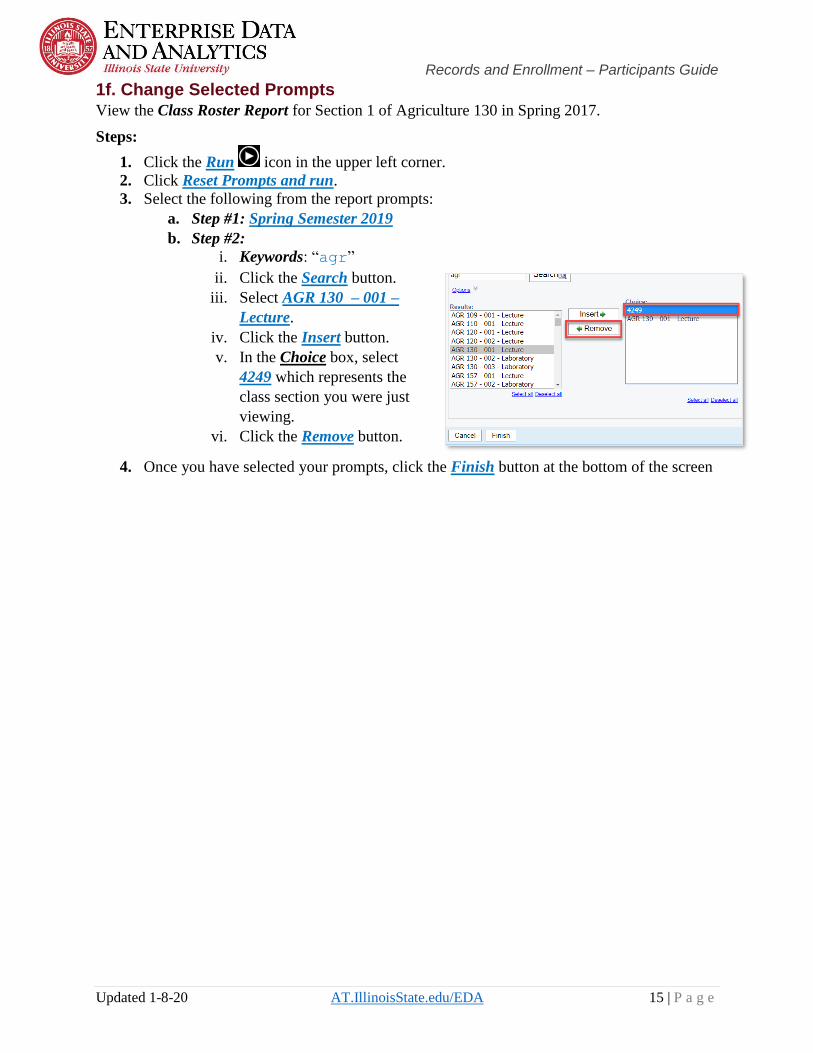
3. Use the On day(s) field to click Monday (M).
Make sure all other days are unselected.
4. Use the Time field to enter “6:00AM.”
5. Click the Format field arrow.
a. Confirm HTML is selected and select Excel.
b. Click the Done button.
6. Click the Delivery field arrow.
a. Select Send report by email.
b. When two options appear, select Attach the
report and confirm Include a link to the report
is selected.
c. Confirm Save Report is selected.
d. Click the Done button.
7. Click the Create button.
1e. Manage/Delete Subscriptions Delete the subscription you created above.
Steps:
1. Click the Personal Menu tab.
2. Click My schedules and subscriptions.
3. Hover over the subscription you wish to remove. Click
the More dots that will appear to the right of the
subscription.
4. Click Remove this subscription.
Return to viewing the report by:
1. Clicking My subscriptions in the middle of the
top toolbar.
2. Click the report Class Roster Report.
Page 15
Records and Enrollment – Participants Guide
Updated 1-8-20 AT.IllinoisState.edu/EDA 15 | P a g e
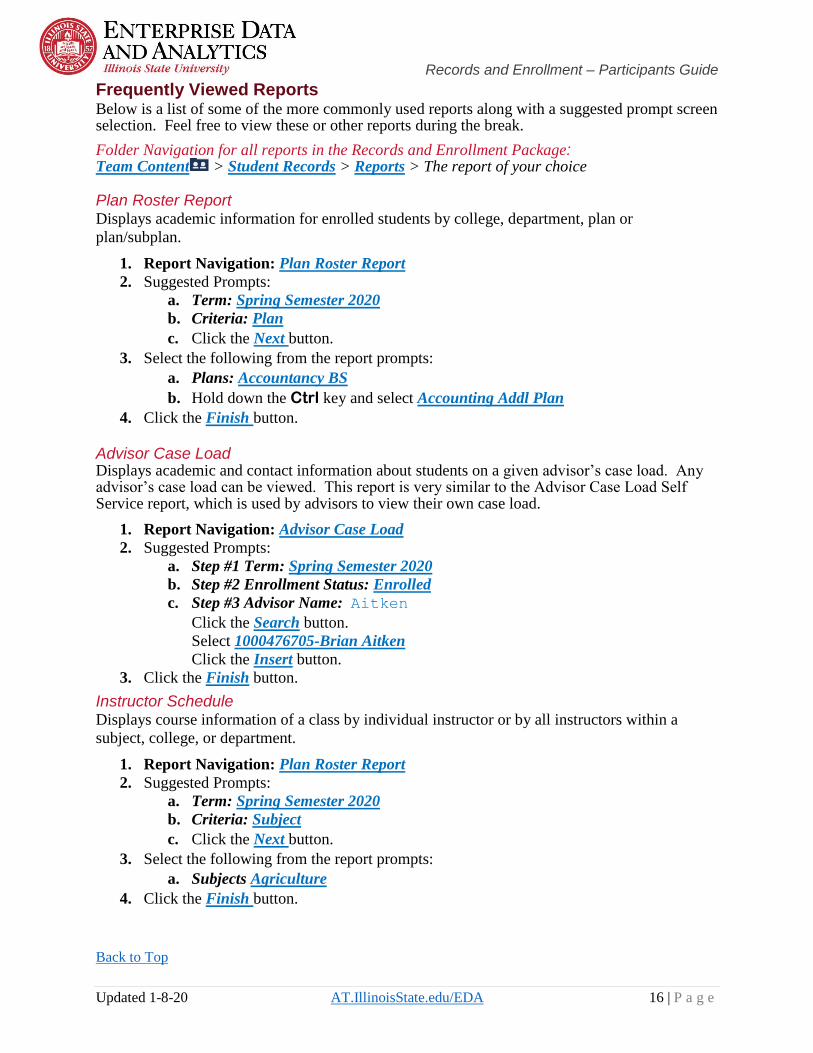
1f. Change Selected Prompts View the Class Roster Report for Section 1 of Agriculture 130 in Spring 2017.
Steps:
1. Click the Run icon in the upper left corner.
2. Click Reset Prompts and run.
3. Select the following from the report prompts:
a. Step #1: Spring Semester 2019
b. Step #2:
i. Keywords: “agr”
ii. Click the Search button.
iii. Select AGR 130 – 001 –
Lecture.
iv. Click the Insert button.
v. In the Choice box, select
4249 which represents the
class section you were just
viewing.
vi. Click the Remove button.
4. Once you have selected your prompts, click the Finish button at the bottom of the screen
Page 16
Records and Enrollment – Participants Guide
Updated 1-8-20 AT.IllinoisState.edu/EDA 16 | P a g e
Frequently Viewed Reports Below is a list of some of the more commonly used reports along with a suggested prompt screen selection. Feel free to view these or other reports during the break.
Folder Navigation for all reports in the Records and Enrollment Package: Team Content > Student Records > Reports > The report of your choice
Plan Roster Report Displays academic information for enrolled students by college, department, plan or
plan/subplan.
1. Report Navigation: Plan Roster Report
2. Suggested Prompts:
a. Term: Spring Semester 2020
b. Criteria: Plan
c. Click the Next button.
3. Select the following from the report prompts:
a. Plans: Accountancy BS
b. Hold down the Ctrl key and select Accounting Addl Plan
4. Click the Finish button.
Advisor Case Load Displays academic and contact information about students on a given advisor’s case load. Any advisor’s case load can be viewed. This report is very similar to the Advisor Case Load Self Service report, which is used by advisors to view their own case load.
1. Report Navigation: Advisor Case Load
2. Suggested Prompts:
a. Step #1 Term: Spring Semester 2020
b. Step #2 Enrollment Status: Enrolled
c. Step #3 Advisor Name: Aitken
Click the Search button.
Select 1000476705-Brian Aitken
Click the Insert button.
3. Click the Finish button.
Instructor Schedule Displays course information of a class by individual instructor or by all instructors within a
subject, college, or department.
1. Report Navigation: Plan Roster Report
2. Suggested Prompts:
a. Term: Spring Semester 2020
b. Criteria: Subject
c. Click the Next button.
3. Select the following from the report prompts:
a. Subjects Agriculture
4. Click the Finish button.
Back to Top
Page 17
Records and Enrollment – Participants Guide
Updated 1-8-20 AT.IllinoisState.edu/EDA 17 | P a g e
Student Registration Package
The Student Registration Package contains several reports dealing with details about registration
information. Each of the reports in the package can be accessed by directly clicking on them, or
by using the drill-throughs in the Department Registration Dashboard.
Department Registration Dashboard The Department Registration Dashboard is an interactive, real time dashboard that displays
student registration counts by career, department, plan, and sub-plan. Users can use the
dashboard to drill-through into detailed reports about the students that make up each number.
Open the Registration Dashboard The Registration Dashboard was created so you can monitor what students have registered for
classes and what students still need to register. It is reponsive to selections you make so you can
see different populations and the students that make them up.
Steps:
1. Click the Team Content icon.
2. Click the Student Registration folder.
3. Click the Reports folder.
4. Click the Department Dashboard folder
5. Click the Department Registration Dashboard .
Note: The dashboard has a different icon than the reports that make up the drill-
throughs.
The dashboard opens in an additional tab. If an error message appears, make sure your pop up
blocker is set to allow pop ups for Cognos.
The dashboard takes a while to load. This is normal.
If it does not seem to load correctly, or shows an error message on the new tab, click the refresh
button on your browser.
Back to Top
Page 18
Records and Enrollment – Participants Guide
Updated 1-8-20 AT.IllinoisState.edu/EDA 18 | P a g e
Request Access to Cognos
Attending this class does not grant you access to Cognos. You must request access to each
package you need with a separate business case for each package.
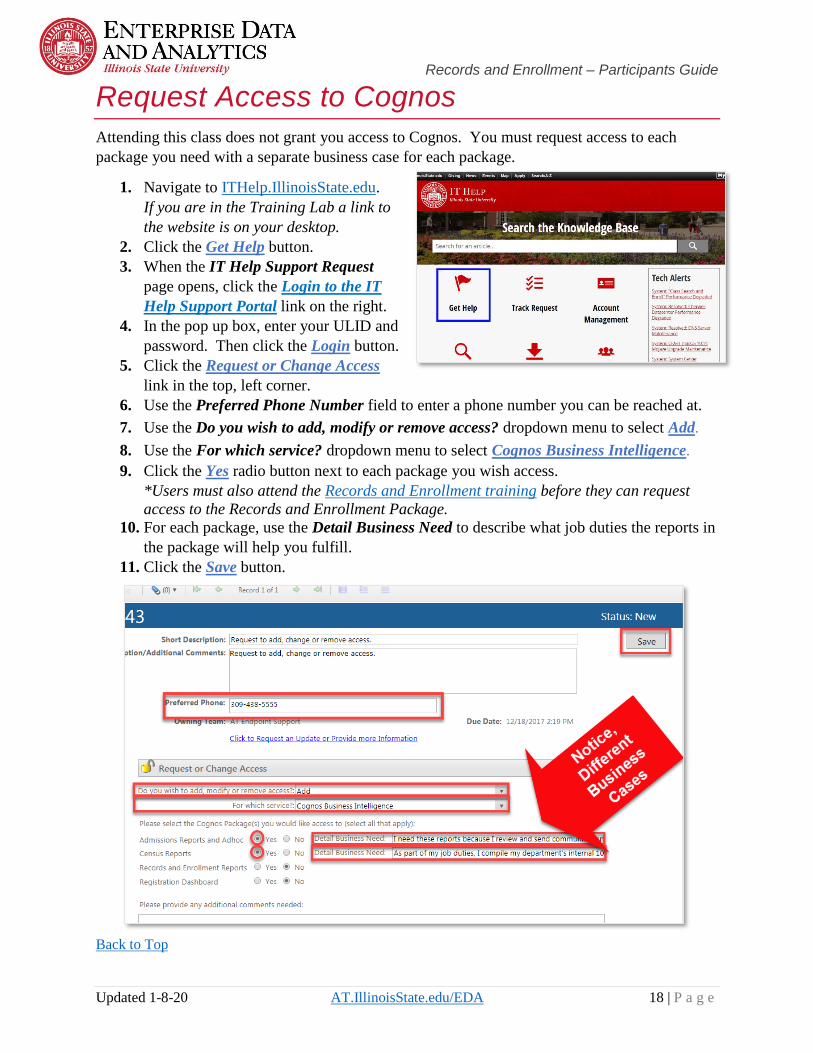
1. Navigate to ITHelp.IllinoisState.edu.
If you are in the Training Lab a link to
the website is on your desktop.
2. Click the Get Help button.
3. When the IT Help Support Request
page opens, click the Login to the IT
Help Support Portal link on the right.
4. In the pop up box, enter your ULID and
password. Then click the Login button.
5. Click the Request or Change Access
link in the top, left corner.
6. Use the Preferred Phone Number field to enter a phone number you can be reached at.
7. Use the Do you wish to add, modify or remove access? dropdown menu to select Add.
8. Use the For which service? dropdown menu to select Cognos Business Intelligence.
9. Click the Yes radio button next to each package you wish access.
*Users must also attend the Records and Enrollment training before they can request
access to the Records and Enrollment Package.
10. For each package, use the Detail Business Need to describe what job duties the reports in
the package will help you fulfill.
11. Click the Save button.
Back to Top
Page 19
Records and Enrollment – Participants Guide
Updated 1-8-20 AT.IllinoisState.edu/EDA 19 | P a g e
Where to Get Help
Request Access to Cognos This class does not automatically give a user access to Cognos. Request access through the
Technology Support Center (TSC) by phone at 438-HELP (4357), email at
[email protected] , or through the web portal ITHelp.IllinoisState.edu.
When you request access you will need to include the following information:
• ULID
• Department
• Business Need
• What you need access to:
- Admissions (includes reports and ad hoc)
- Census Reports
- Records and Enrollment Reports*
- Records and Enrollment Ad Hoc**
- Student Registration
**Users must have access to the Records and Enrollment Package for 2 weeks before
requesting ad hoc access. When you do request this access, include the business need
why the delivered reports do not meet your needs.
Contact the Technology Support Center (TSC) - Phone: 438-HELP (4357)
- Email: [email protected]
Attend an Open Lab session - One-on-one assistance
- Creating/modifying reports
- General Cognos assistance
- Email [email protected] to set up an appointment
Visit Website for: - Information about packages/reports
- Changes and upcoming releases
- Additional training resources
URL: https://at.illinoisstate.edu/enterprise-data-analytics/
You Try!
Go to https://insight.illinoisstate.edu/ and log in using your ULID and password.
Questions?
Visit AT.ilstu.edu/EDA/
or
Contact [email protected]