Page 1
1 | P a g e
Updated 11/8/17 [email protected]
IBM Cognos Analytics Edit a Report
The following instructions cover how to edit an existing report in IBM Cognos Analytics.
Navigate to Cognos
Cognos Analytics supports all browsers with the exception of Microsoft Edge.
Log into Cognos by going to https://insight.illinoisstate.edu/. (You must use a computer that
is connected to the ISU network.) Log in using your ULID and central login password.
Table of Contents
Access Report Editor from the Public Content Pane
Access Report Editor from the Report Viewer
Overview of the Report Editor
IMPORTANT – Set Report Options Add Data Items
Delete Data Items
Change a Data Item’s Label
Move Data Items
Group Data Items
Sort Data Items
Summarize a Data Item
Apply Filters and Prompts
Apply a Null Filter
Remove Filter or Prompt
Create Custom Filter
Highlight a Column
Preview the Report with Data
Save Report in My Content
Return to Welcome Page
Page 2
2 | P a g e
Updated 11/8/17 [email protected]
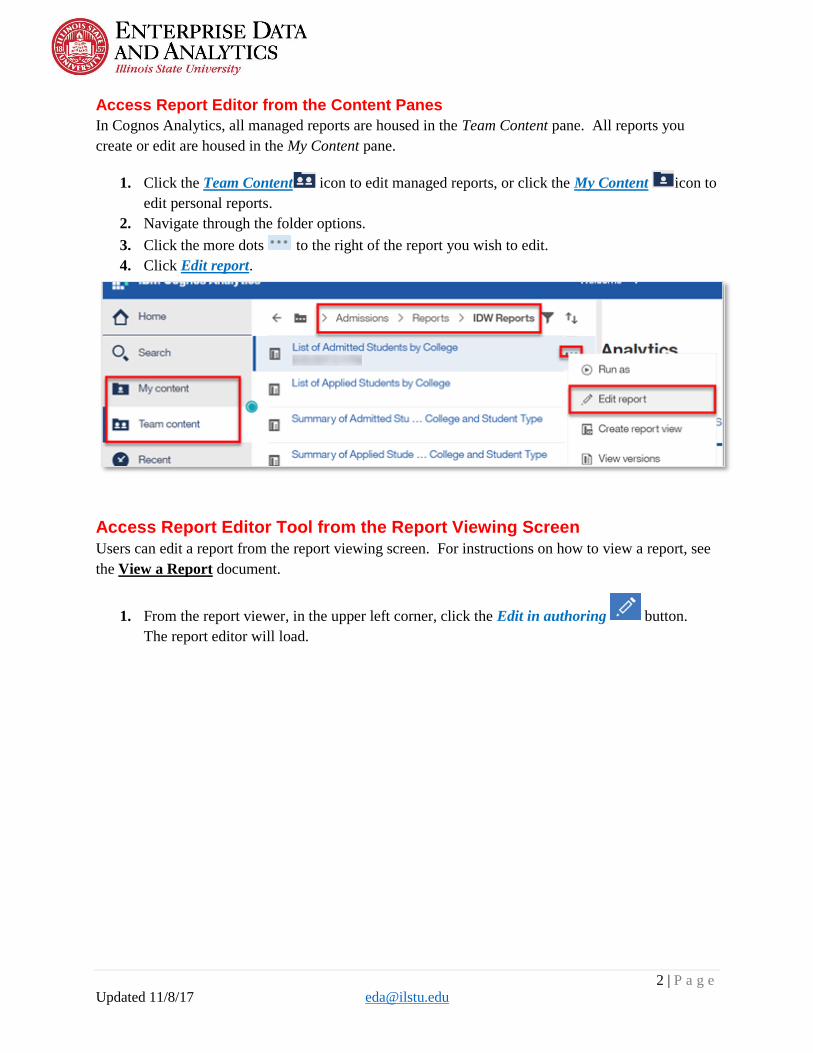
Access Report Editor from the Content Panes
In Cognos Analytics, all managed reports are housed in the Team Content pane. All reports you
create or edit are housed in the My Content pane.
1. Click the Team Content icon to edit managed reports, or click the My Content icon to
edit personal reports.
2. Navigate through the folder options.
3. Click the more dots to the right of the report you wish to edit.
4. Click Edit report.
Access Report Editor Tool from the Report Viewing Screen
Users can edit a report from the report viewing screen. For instructions on how to view a report, see
the View a Report document.
1. From the report viewer, in the upper left corner, click the Edit in authoring button.
The report editor will load.
Page 3
3 | P a g e
Updated 11/8/17 [email protected]
Overview of the Report Editor
1. Undo and Redo – Used the undo and redo buttons to as you edit the report.
2. Page Views – Used to preview the report with data. The default view in the report editor
does not fill in data, so that editing can be done faster.
3. Data Pane:
Data – Contains data items and filters. Expand the folders then either drag and drop into
the report, or double click the item.
Toolbox – Contains numerous items that users can add to reports, such as page numbers,
additional titles, and images.
Pages – Used to view or create new report pages and prompt pages. (Most users will not
use this pane.)
Queries – Used to create or adjust queries in reports and to complete complex tasks, such
as writing SQL statements. (Most users will not use this pane.)
4. Tool Bar – Used for edits such as sorting, summarizing, and grouping. The tool bar will only
appear after you click a column header. The picture above shows Current Department after
being clicked.
!Must be done before editing or creating any report!
Set Report Options
For every report you edit or create, you must set your default option for Summarization.
1. Click the More icon on the upper right.
2. Click Options.
3. In the Options window, click the Report tab.
4. Uncheck Automatic group and summary behavior for lists.
5. Click Apply.
6. Click the OK button.
Page 4
4 | P a g e
Updated 11/8/17 [email protected]
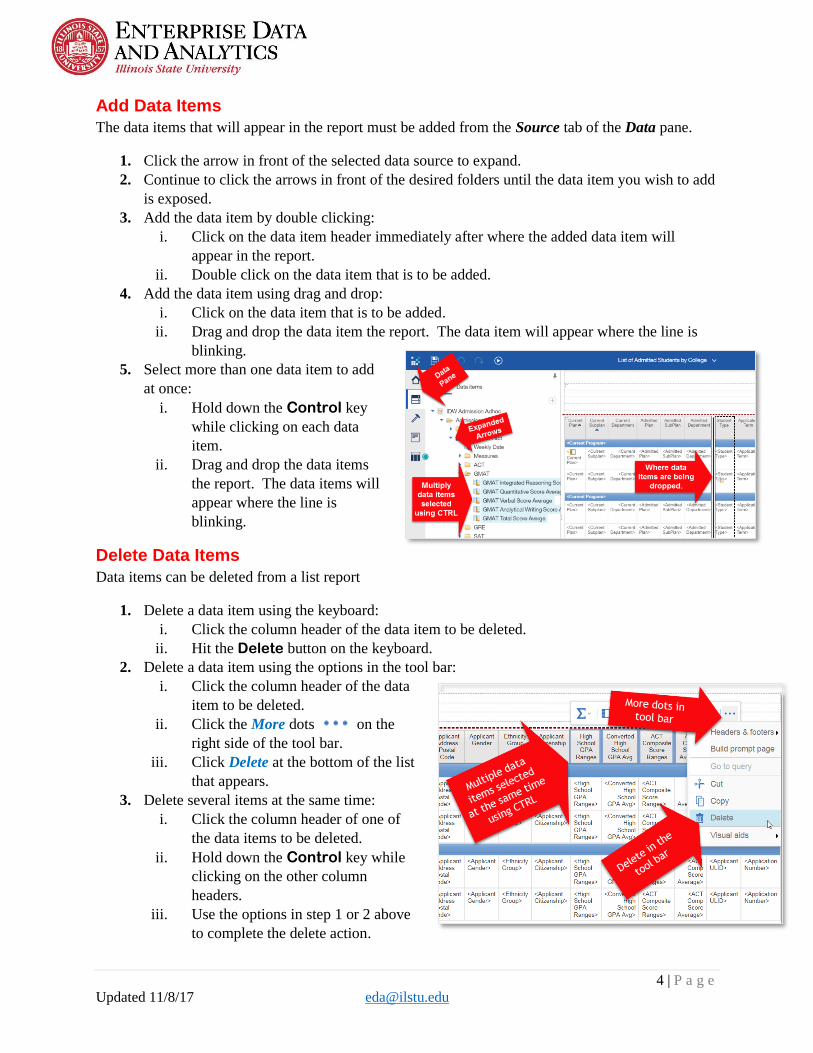
Add Data Items
The data items that will appear in the report must be added from the Source tab of the Data pane.
1. Click the arrow in front of the selected data source to expand.
2. Continue to click the arrows in front of the desired folders until the data item you wish to add
is exposed.
3. Add the data item by double clicking:
i. Click on the data item header immediately after where the added data item will
appear in the report.
ii. Double click on the data item that is to be added.
4. Add the data item using drag and drop:
i. Click on the data item that is to be added.
ii. Drag and drop the data item the report. The data item will appear where the line is
blinking.
5. Select more than one data item to add
at once:
i. Hold down the Control key
while clicking on each data
item.
ii. Drag and drop the data items
the report. The data items will
appear where the line is
blinking.
Delete Data Items
Data items can be deleted from a list report
1. Delete a data item using the keyboard:
i. Click the column header of the data item to be deleted.
ii. Hit the Delete button on the keyboard.
2. Delete a data item using the options in the tool bar:
i. Click the column header of the data
item to be deleted.
ii. Click the More dots on the
right side of the tool bar.
iii. Click Delete at the bottom of the list
that appears.
3. Delete several items at the same time:
i. Click the column header of one of
the data items to be deleted.
ii. Hold down the Control key while
clicking on the other column
headers.
iii. Use the options in step 1 or 2 above
to complete the delete action.
Page 5
5 | P a g e
Updated 11/8/17 [email protected]
Change a Data Item’s Label
The text of the column header for a data item can be changed.
1. Click on the column header of the data item
that is to be changed.
2. Click the More dots at the end of the
tool bar that appears.
3. Click Edit Data Item Label…
4. Use the Data item label field to type in the desired name.
Do not change the text in the Data item name field.
5. Click the OK button.
Move Data Items in a List
Data items can be arranged in any order.
1. Click on the column header of the data item that needs to be moved.
If moving more than one data item, hold down the Control key while clicking on the
column headers of the additional data items.
2. Hold down the left mouse button while moving the mouse over the report until a line is
blinking where the data item is being moved to.
3. Drop the data item in place by releasing the left mouse button.
Group Data Items
Data items can be grouped so all like values within that data item will appear together in the report.
1. Click on the column header of the
data item that is being grouped.
If grouping more than
one data item, hold down
the Control key while
clicking the column
headers of each
additional data item.
2. Click the Group icon on the
tool bar.
Page 6
6 | P a g e
Updated 11/8/17 [email protected]
Sort Data Items
Information can be sorted in alphabetical or numerical order based on a single data item. (If data
items have been grouped, information will be sorted within each grouping.)
1. Click on the column header of the data item being
sorted.
2. Click the Sort icon .
3. Select from the sort options.
Summarize a Data Item
Numerical data items can be summarized several ways
including averaged, counted, and totaled.
If data items have been grouped, a summary will
automatically be calculated for each group within the data
item. If there are no grouped data items, the summary will
appear at the end of the report.
1. Click on the column header of the data item that is to
be summarized.
If summarizing more than one data item, hold
down the Control key while clicking on the
column headers of the additional data items.
2. Click the Summarize icon .
3. Select from the summarize options.
Total – the sum of all values added together.
Count – the number of rows.
Apply Filters and Prompts
Filters and prompts are applied to data in order to narrow down the information that appears in the
report. Filters are applied and stay the same every time the report is ran. Prompts are selected before
the report is ran each time. The information in the report changes each time based on the prompt selections.
1. Under the Source tab in the Data pane, on the left side of the screen, click the arrow in front
of the Filters and Prompts folder to expand the folder and see all prompts and filter that are
include in the package.
2. Add one filter/prompt at a time:
i. Double click on the filter that needs to be added.
3. Add several filter/prompts at the same time:
i. Click on the first filter or prompt to be added.
ii. Hold down the Control key while clicking on each additional filter or prompt.
iii. Drag and drop selected filters and prompts into the report area.
4. Click the OK button in the pop up window that says the filter(s) has/have been added.
Page 7
7 | P a g e
Updated 11/8/17 [email protected]
Create Custom Filter
Filters and prompt are part of each delivered package just as data items. You can also create
custom filters based on the data items that are in the report.
1. Click on the column header of the data item that the filter will
be based on.
The data item that you wish to filter on must be present
in the report.
2. Click the Filter icon on the toolbar.
3. Click Create Custom Filter...
4. The Find box displays all the current
values of the data item that was
selected. Scroll through the values
and select the values that will appear
in the filtered report.
5. Click the Plus icon directly to the
right of each value.
Repeat steps 4 and 5 until all
desired values have been added.
6. Click the OK button.
Apply a Null Filter
A null filter is added to a data item so that any students that do not
have a value reported for that specific data item will not appear in the
report.
1. Click the column header of the data item that the null filter is
being applied to.
2. Click the Filter icon on the toolbar.
3. Click Exclude Null.
Page 8
8 | P a g e
Updated 11/8/17 [email protected]
Remove Filter or Prompt
Filters and prompts can be removed from a report at any time in the editing process.
1. Click any data item column header to get the toolbar to appear.
2. Click the Filter icon on the toolbar.
3. Click Edit Filters…
4. All filters and prompts that
have been added to the report
are displayed in the box. Click
on the one that is being deleted.
If more than one is
being deleted, hold
down the Control key
while clicking on the
additional filters and
prompts.
5. Click the Delete icon .
6. Click the OK button.
Highlight a Column
In order to draw special attention to a column, the background
color can be changed.
1. Click in the column of the desired data item. Not the
column header.
2. Click the Background color icon on the toolbar.
3. Select the color.
Change Report View (Preview Data) The default view while editing a report is the Page design view. This means that the information
is not populated in the report. At any point, the report view can be
changed.
1. Click the Page views icon at the top right of the screen.
2. Click on Page preview.
The current view is Page design.
3. Select the answers to fill in the prompts.
4. Click the OK button.
Page 9
9 | P a g e
Updated 11/8/17 [email protected]
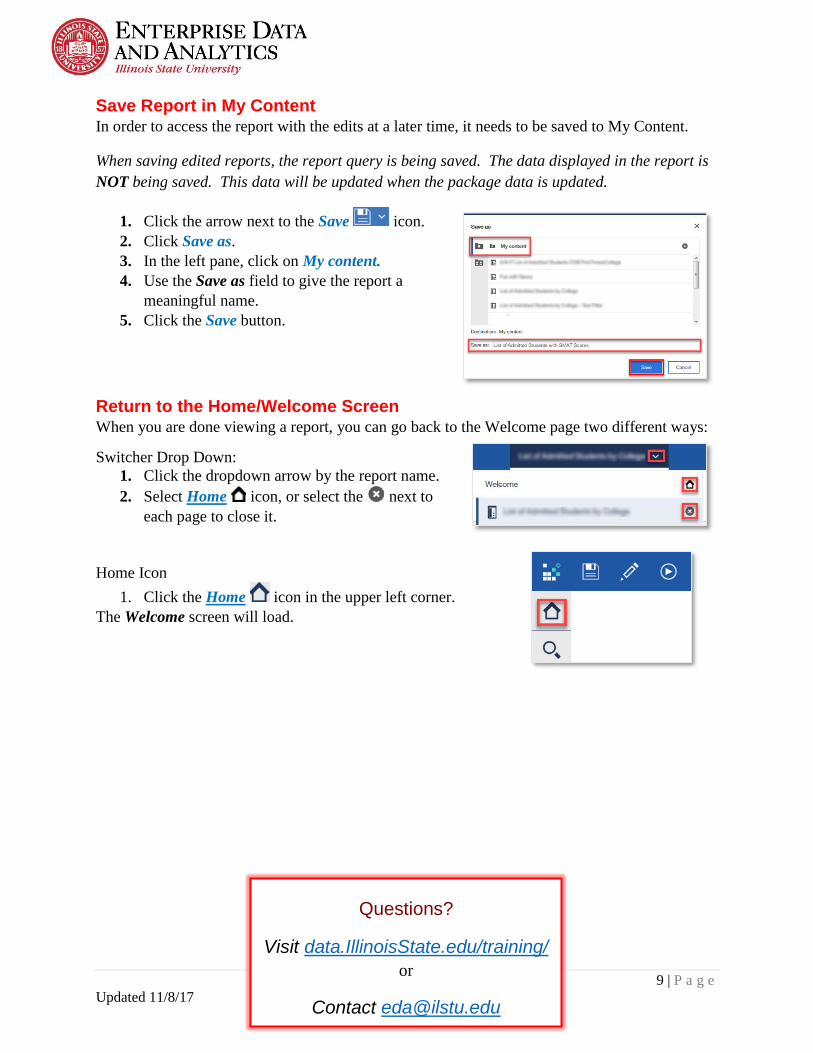
Save Report in My Content In order to access the report with the edits at a later time, it needs to be saved to My Content.
When saving edited reports, the report query is being saved. The data displayed in the report is
NOT being saved. This data will be updated when the package data is updated.
1. Click the arrow next to the Save icon.
2. Click Save as.
3. In the left pane, click on My content.
4. Use the Save as field to give the report a
meaningful name.
5. Click the Save button.
Return to the Home/Welcome Screen When you are done viewing a report, you can go back to the Welcome page two different ways:
Switcher Drop Down:
1. Click the dropdown arrow by the report name.
2. Select Home icon, or select the next to
each page to close it.
Home Icon
1. Click the Home icon in the upper left corner.
The Welcome screen will load.
Questions?
Visit data.IllinoisState.edu/training/
or
Contact [email protected]