90
IBM Cognos Analytics Version 11.1 Samples Guide IBM
IBM Cognos AnalyticsVersion 11.1
Samples Guide
IBM
©
Product InformationThis document applies to IBM Cognos Analytics version 11.1.0 and may also apply to subsequent releases.
CopyrightLicensed Materials - Property of IBM© Copyright IBM Corp. 2005, 2021.
US Government Users Restricted Rights – Use, duplication or disclosure restricted by GSA ADP Schedule Contract withIBM Corp.
IBM, the IBM logo and ibm.com are trademarks or registered trademarks of International Business Machines Corp.,registered in many jurisdictions worldwide. Other product and service names might be trademarks of IBM or othercompanies. A current list of IBM trademarks is available on the Web at " Copyright and trademark information " atwww.ibm.com/legal/copytrade.shtml.
The following terms are trademarks or registered trademarks of other companies:
• Adobe, the Adobe logo, PostScript, and the PostScript logo are either registered trademarks or trademarks of AdobeSystems Incorporated in the United States, and/or other countries.
• Microsoft, Windows, Windows NT, and the Windows logo are trademarks of Microsoft Corporation in the United States,other countries, or both.
Microsoft product screen shot(s) used with permission from Microsoft.© Copyright International Business Machines Corporation 2005, 2021.US Government Users Restricted Rights – Use, duplication or disclosure restricted by GSA ADP Schedule Contract withIBM Corp.
Contents
Chapter 1. Cognos Analytics samples..................................................................... 1Base samples............................................................................................................................................... 2
Boston 311 dashboard sample.............................................................................................................. 2California website visits dashboard sample.......................................................................................... 3Country comparison dashboard sample................................................................................................4Policy analysis dashboard sample......................................................................................................... 5Product line dashboard sample............................................................................................................. 6Storm events dashboard sample........................................................................................................... 6Telco churn dashboard sample.............................................................................................................. 7Weather analytics dashboard sample....................................................................................................7Boston 311 report sample..................................................................................................................... 8Corporate website visits report sample.................................................................................................9Customer claim analysis report sample.............................................................................................. 10Customer lifetime value analysis report sample.................................................................................11Global sales report sample.................................................................................................................. 12Storm events 2015 report sample.......................................................................................................12Telco churn relationships exploration sample.................................................................................... 13Animated path scene transition story sample.....................................................................................14Guided journey template story sample............................................................................................... 15More valuable customers story sample...............................................................................................16
Importing the base samples......................................................................................................................16
Chapter 2. Downloading and configuring the extended samples............................ 19Download the Cognos Analytics Extended Samples................................................................................ 19Restore backup files for the sample databases........................................................................................19
Db2 sample databases.........................................................................................................................19Oracle sample databases.....................................................................................................................24SQL Server sample databases............................................................................................................. 27
Create data server connections to the samples databases..................................................................... 27Import the extended samples...................................................................................................................28Copy the sample images............................................................................................................................28Optional : Cognos Framework Manager sample database models.......................................................... 28
Chapter 3. Installing and configuring the supplementary samples.........................31Set Up Microsoft Analysis Services Cube Samples...................................................................................31Set up the Essbase cube sample...............................................................................................................32Creating Data Source Connections to OLAP Data Sources.......................................................................32
Create Data Source Connections to PowerCubes............................................................................... 33Create Data Source Connections to Oracle Essbase Cubes................................................................33Create Data Source Connections to Microsoft Analysis Service Cubes..............................................34
Import the supplementary samples......................................................................................................... 35Setting up the samples for IBM Cognos Dynamic Cubes......................................................................... 36
Deploying sample dynamic cubes....................................................................................................... 36
Chapter 4. Using the samples...............................................................................37The Sample Outdoors Company................................................................................................................37The Sample Outdoors Group of Companies..............................................................................................37Employees..................................................................................................................................................39Sales and marketing.................................................................................................................................. 39Sample Outdoors Company models, Powercubes, and packages........................................................... 39
iii
Sample audit model and audit reports......................................................................................................41Setting up sample audit reports.......................................................................................................... 44
Sample reports for the dynamic query mode........................................................................................... 45Modify the data source connections to the sample data sources...................................................... 46Import the dynamic query samples content (packages) into the content store................................46
IBM Cognos Analytics - Reporting samples..............................................................................................46Samples in the Sample Outdoors Sales (cube) package ....................................................................46Samples in the Sales and Marketing (Cube) Package......................................................................... 46Samples in the GO Data Warehouse (analysis) Package.....................................................................48Samples in the GO Data Warehouse (query) Package........................................................................ 55Samples in the GO Sales (analysis) Package.......................................................................................57Samples in the GO Sales (query) Package...........................................................................................57Prompt API samples............................................................................................................................ 61
Cognos Workspace samples......................................................................................................................62Samples in the GO Data Warehouse (analysis) package.....................................................................62Samples in the GO Data Warehouse (query) package........................................................................ 62
Using the Java samples............................................................................................................................. 63Java samples setup for Windows operating systems......................................................................... 64Java setup for Linux and UNIX operating systems..............................................................................64
IBM Cognos Analysis Studio samples....................................................................................................... 65Combine Filters Sample....................................................................................................................... 65Custom Rank Sample........................................................................................................................... 65QTD Growth by Product Brand.............................................................................................................65Top 10 Promotions by Retailers...........................................................................................................65Difference between Actual and Planned Revenue.............................................................................. 66Revenue vs per cent Gross Profit by Product Brand ...........................................................................66
IBM Cognos Query Studio samples...........................................................................................................66Samples in the Go Data Warehouse (analysis) Package..................................................................... 66Sample in the Go Sales (query) Package............................................................................................. 66
Chapter 5. Sample Outdoors organization and schemas........................................ 67Warehouse Schema................................................................................................................................... 70Transaction Schemas.................................................................................................................................72
Chapter 6. Cognos Analytics for Jupyter Notebook samples.................................. 75Importing and configuring the Jupyter samples.......................................................................................75Jupyter notebook samples........................................................................................................................ 76
Flexible lightweight ETL notebook sample..........................................................................................76Time series analysis notebook sample................................................................................................76Visualization creation notebook sample..............................................................................................76Retailer dashboard notebook sample..................................................................................................76Telecom data analysis notebook sample............................................................................................ 76Telecom data visualizations notebook sample................................................................................... 76Unit infection data notebook sample...................................................................................................76Data quality template notebook sample............................................................................................. 77Schedule data creation notebook sample...........................................................................................77Schedule data creation notebook widget sample............................................................................... 77Health insurance coverage analysis notebook sample ...................................................................... 77Retailer report notebook widget sample............................................................................................. 77
Chapter 7. The Weather Company sample............................................................ 79Importing The Weather Company sample................................................................................................ 79
Index.................................................................................................................. 83
iv
Chapter 1. Cognos Analytics samplesIBM® Cognos® Analytics has an extensive collection of dashboards, stories, explorations, reports, datamodules, and sample databases. These samples illustrate the use of many Cognos Analytics features.
Base samplesBase samples include sample reports, explorations, dashboards, and stories that use data modules thatare based on uploaded files as their underlying data source so they can be easily imported. For moreinformation about the base samples, see “Importing the base samples” on page 16.
Extended samplesExtended samples use an IBM DB2®, Microsoft SQL Server, or Oracle database and database connectionto host the sample databases.
For instructions on downloading and configuring these samples, see Chapter 2, “Downloading andconfiguring the extended samples,” on page 19.
JavaScript samplesThese samples demonstrate how to add JavaScript to your reports. For more information, see JavaScriptSamples for IBM Cognos Analytics.
Theme and extension samplesYou can customize the IBM Cognos Analytics interface to suit the needs of your organization.Customization samples in the form of .zip files are available that demonstrate how to create themes,extensions, and views (perspectives). You can modify these samples to create your own customizations.For more information, see Theme and Extension Samples for IBM Cognos Analytics.
Audit reporting samplesYou use the sample audit reports to view the information in a logging database about user and reportactivity. For more information, see Audit Reporting Samples for IBM Cognos Analytics.
OLAP samplesTo demonstrate typical OLAP features, we created a sample dashboard, report, and the underlying OLAPcube. For more information, see OLAP Samples for IBM Cognos Analytics.
Package based drill-through samplesTo demonstrate package based drill-through, we provided sample source and target reports that use thesample GO data warehouse (query) package and a drill-through definition. For more information, seePackage Based Drill-Through Samples for IBM Cognos Analytics.
Legacy samplesLegacy samples from past versions are available for drill-through, dynamic cubes, IBM Cognos MetricsManager, PowerCubes, and PowerPlay. For more information, see Legacy Samples.
© Copyright IBM Corp. 2005, 2021 1
10.2.2 Cognos Mashup Service (CMS) samplesThe IBM® Cognos® Mashup Service includes code samples that illustrate how to use the SOAP and RESTinterfaces to develop mashup applications. For more information, see 10.2.2 Cognos Mashup Service(CMS) Samples for IBM Cognos Analytics.
Base samplesBase samples include sample reports, explorations, dashboards, and stories that use data modules thatare based on uploaded files as their underlying data source so they can be easily imported.
The base samples are installed with the product and demonstrate its core functionality. To open them,click Team content > Samples and get ready to explore! All the Base Samples use uploaded files/datamodules as their underlying data sources. There is no need to create data source connections or restoredatabases in order to use the base samples.
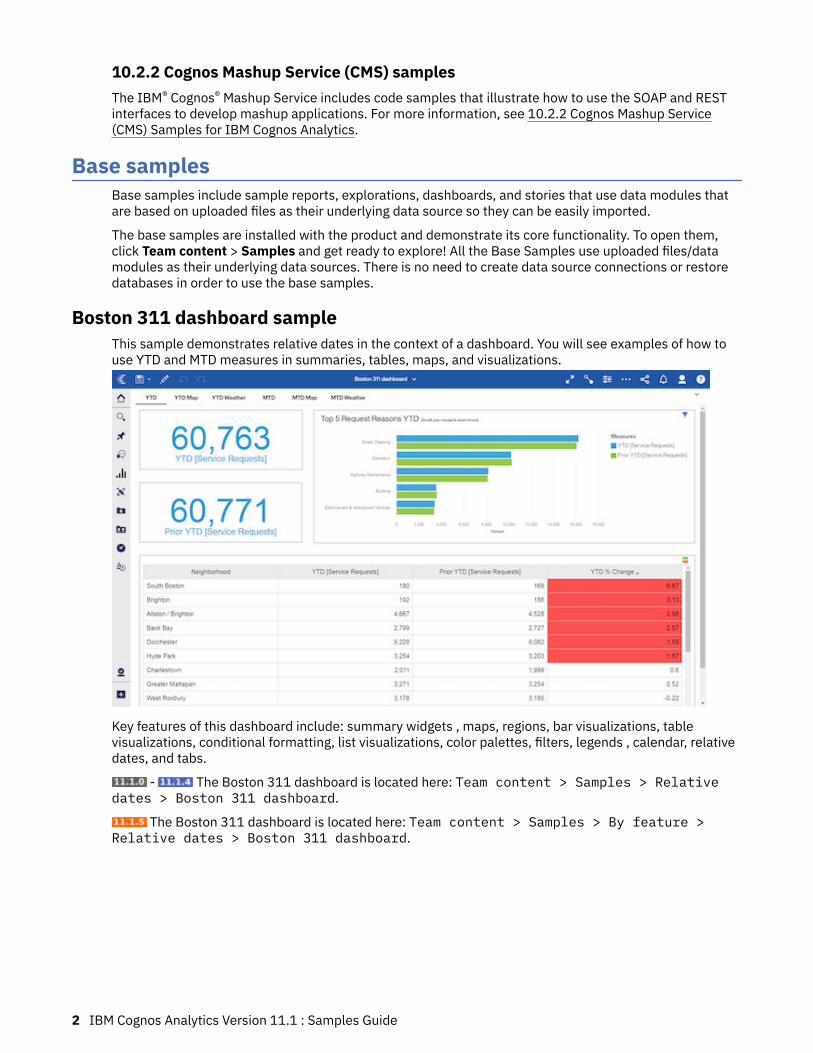
Boston 311 dashboard sampleThis sample demonstrates relative dates in the context of a dashboard. You will see examples of how touse YTD and MTD measures in summaries, tables, maps, and visualizations.
Key features of this dashboard include: summary widgets , maps, regions, bar visualizations, tablevisualizations, conditional formatting, list visualizations, color palettes, filters, legends , calendar, relativedates, and tabs.
- The Boston 311 dashboard is located here: Team content > Samples > Relativedates > Boston 311 dashboard.
The Boston 311 dashboard is located here: Team content > Samples > By feature >Relative dates > Boston 311 dashboard.
2 IBM Cognos Analytics Version 11.1 : Samples Guide
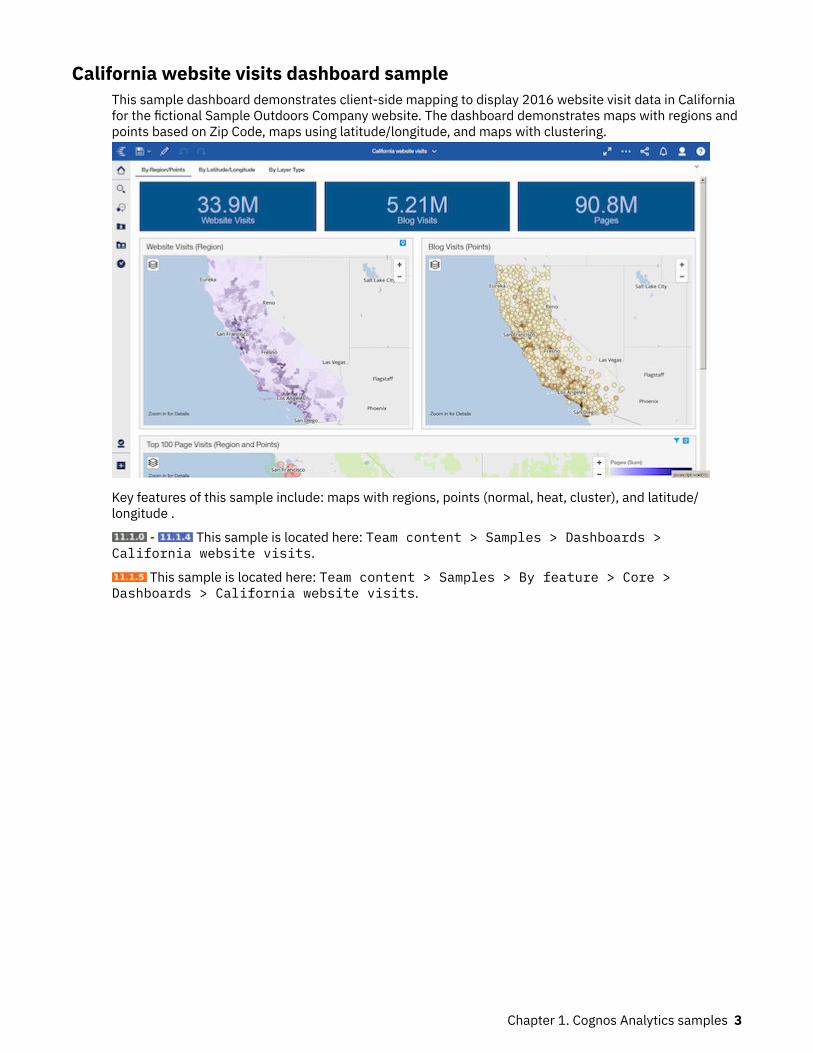
California website visits dashboard sampleThis sample dashboard demonstrates client-side mapping to display 2016 website visit data in Californiafor the fictional Sample Outdoors Company website. The dashboard demonstrates maps with regions andpoints based on Zip Code, maps using latitude/longitude, and maps with clustering.
Key features of this sample include: maps with regions, points (normal, heat, cluster), and latitude/longitude .
- This sample is located here: Team content > Samples > Dashboards >California website visits.
This sample is located here: Team content > Samples > By feature > Core >Dashboards > California website visits.
Chapter 1. Cognos Analytics samples 3
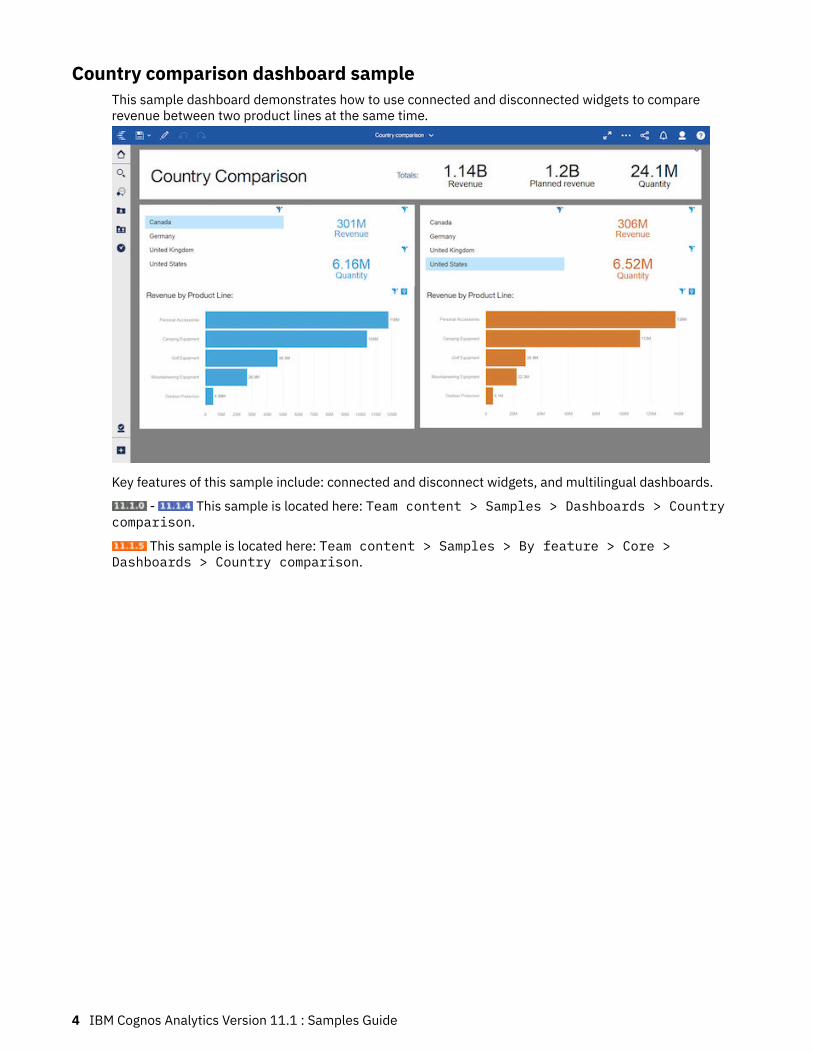
Country comparison dashboard sampleThis sample dashboard demonstrates how to use connected and disconnected widgets to comparerevenue between two product lines at the same time.
Key features of this sample include: connected and disconnect widgets, and multilingual dashboards.
- This sample is located here: Team content > Samples > Dashboards > Countrycomparison.
This sample is located here: Team content > Samples > By feature > Core >Dashboards > Country comparison.
4 IBM Cognos Analytics Version 11.1 : Samples Guide
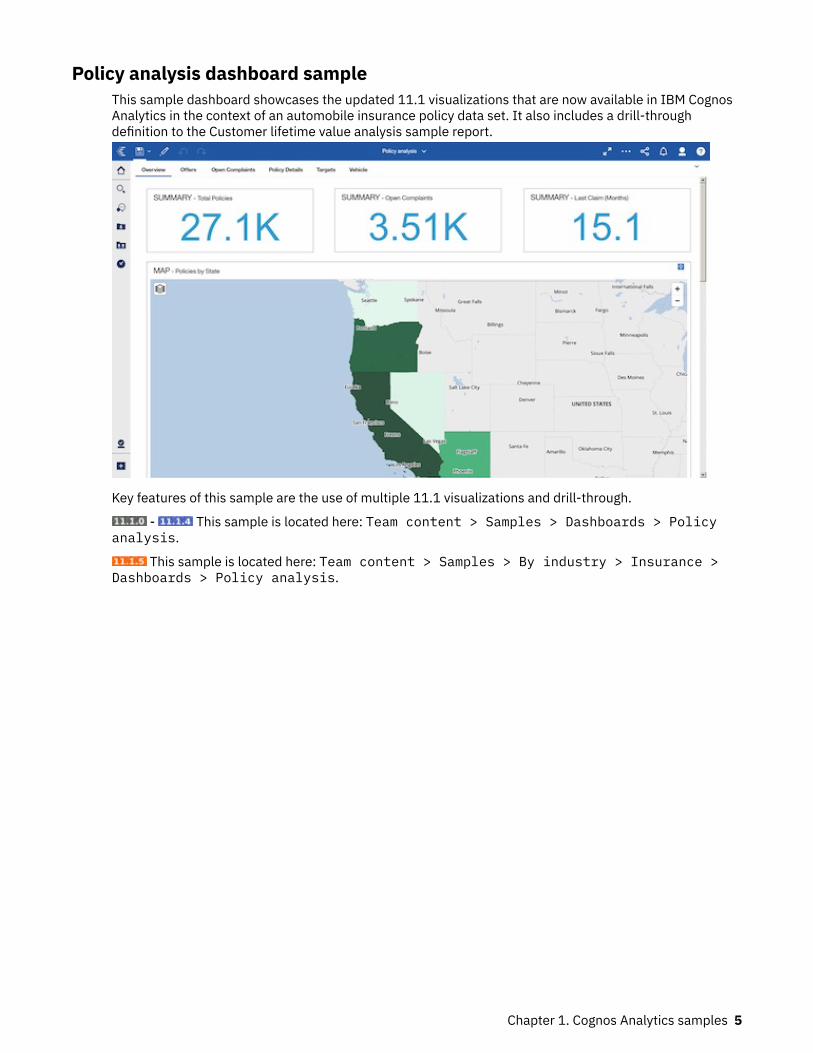
Policy analysis dashboard sampleThis sample dashboard showcases the updated 11.1 visualizations that are now available in IBM CognosAnalytics in the context of an automobile insurance policy data set. It also includes a drill-throughdefinition to the Customer lifetime value analysis sample report.
Key features of this sample are the use of multiple 11.1 visualizations and drill-through.
- This sample is located here: Team content > Samples > Dashboards > Policyanalysis.
This sample is located here: Team content > Samples > By industry > Insurance >Dashboards > Policy analysis.
Chapter 1. Cognos Analytics samples 5
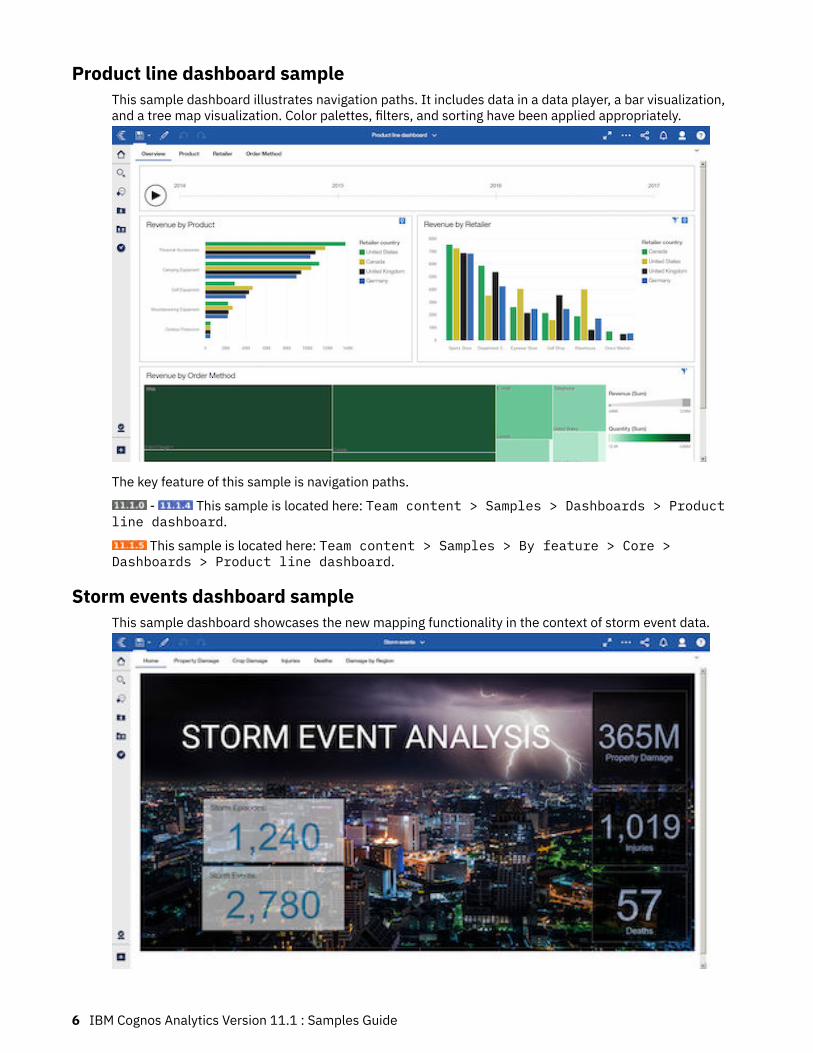
Product line dashboard sampleThis sample dashboard illustrates navigation paths. It includes data in a data player, a bar visualization,and a tree map visualization. Color palettes, filters, and sorting have been applied appropriately.
The key feature of this sample is navigation paths.
- This sample is located here: Team content > Samples > Dashboards > Productline dashboard.
This sample is located here: Team content > Samples > By feature > Core >Dashboards > Product line dashboard.
Storm events dashboard sampleThis sample dashboard showcases the new mapping functionality in the context of storm event data.
6 IBM Cognos Analytics Version 11.1 : Samples Guide
Key features of this sample include: custom polygons, custom regions, images, summary widgets , listvisualizations, data player, maps with regions, points, text widgets, shape, word cloud visualizations, pievisualizations, donut radius, map ID, layer names, property names , show titles, and tabs.
- This sample is located here: Team content > Samples > Dashboards > Stormevents.
This sample is located here: Team content > Samples > By feature > Core >Dashboards > Storm events.
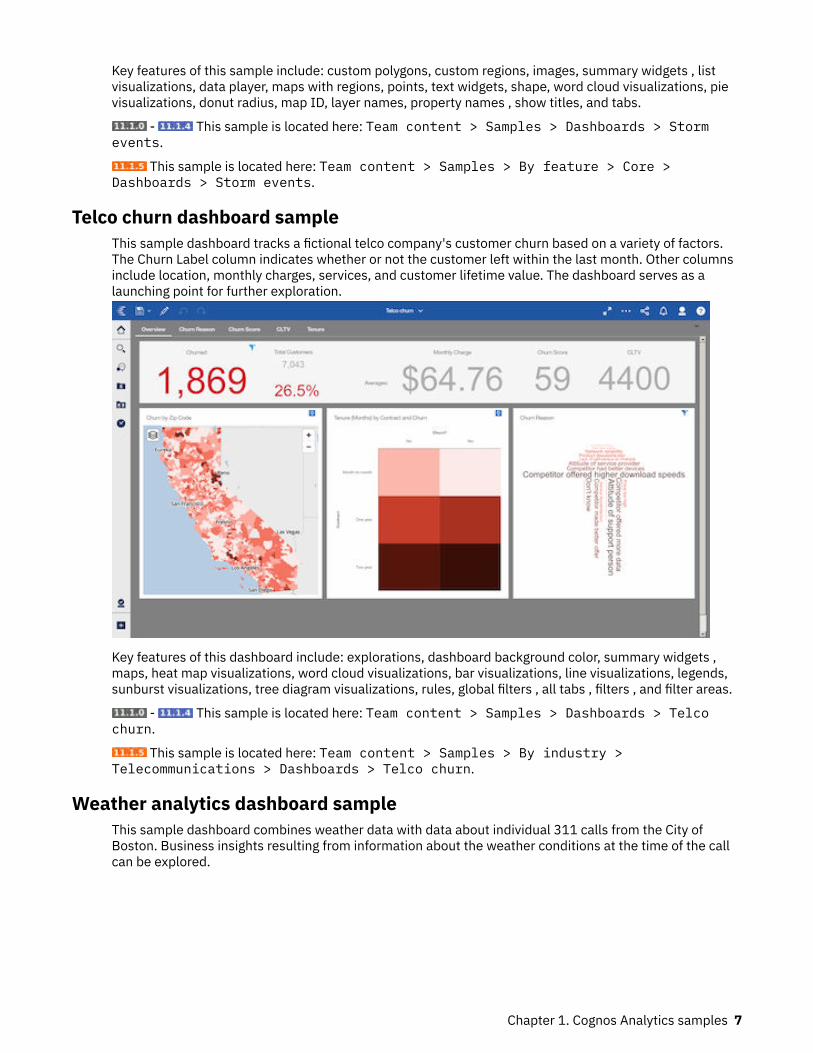
Telco churn dashboard sampleThis sample dashboard tracks a fictional telco company's customer churn based on a variety of factors.The Churn Label column indicates whether or not the customer left within the last month. Other columnsinclude location, monthly charges, services, and customer lifetime value. The dashboard serves as alaunching point for further exploration.
Key features of this dashboard include: explorations, dashboard background color, summary widgets ,maps, heat map visualizations, word cloud visualizations, bar visualizations, line visualizations, legends,sunburst visualizations, tree diagram visualizations, rules, global filters , all tabs , filters , and filter areas.
- This sample is located here: Team content > Samples > Dashboards > Telcochurn.
This sample is located here: Team content > Samples > By industry >Telecommunications > Dashboards > Telco churn.
Weather analytics dashboard sampleThis sample dashboard combines weather data with data about individual 311 calls from the City ofBoston. Business insights resulting from information about the weather conditions at the time of the callcan be explored.
Chapter 1. Cognos Analytics samples 7
Key features of this dashboard include: images, text , summary widgets, abbreviate, columnvisualizations, filters, measure sort, background color, word cloud visualizations, line visualizations,crosstab visualizations, conditional formatting, conditional palette, maps, legend, show titles, show valuelabels , Top 10 , Bottom 10 , filter area, and tabs.
This sample dashboard can be found here: Team content > Samples > Dashboards> Weatheranalytics.
Data for this sample can be found here: Team content > Samples > Data > Weatheranalytics.
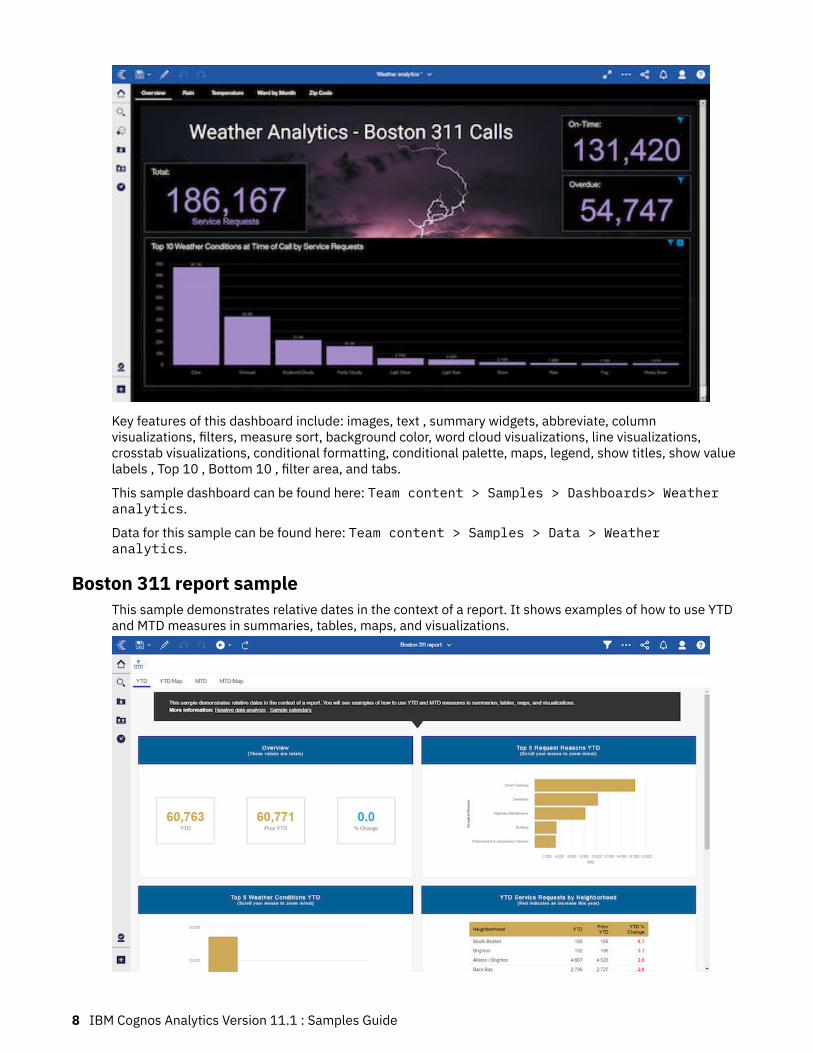
Boston 311 report sampleThis sample demonstrates relative dates in the context of a report. It shows examples of how to use YTDand MTD measures in summaries, tables, maps, and visualizations.
8 IBM Cognos Analytics Version 11.1 : Samples Guide
Key features of this report include: text items, maps with regions, clustered bar visualizations, clusteredcolumn visualizations, lists, conditional styles, sort, calendar, relative dates, and tabs.
- The Boston 311 report can be found here: Team content > Samples > Relativedates > Boston 311 report.
This sample is located here: Team content > Samples > By feature > Relative dates> Boston 311 report.
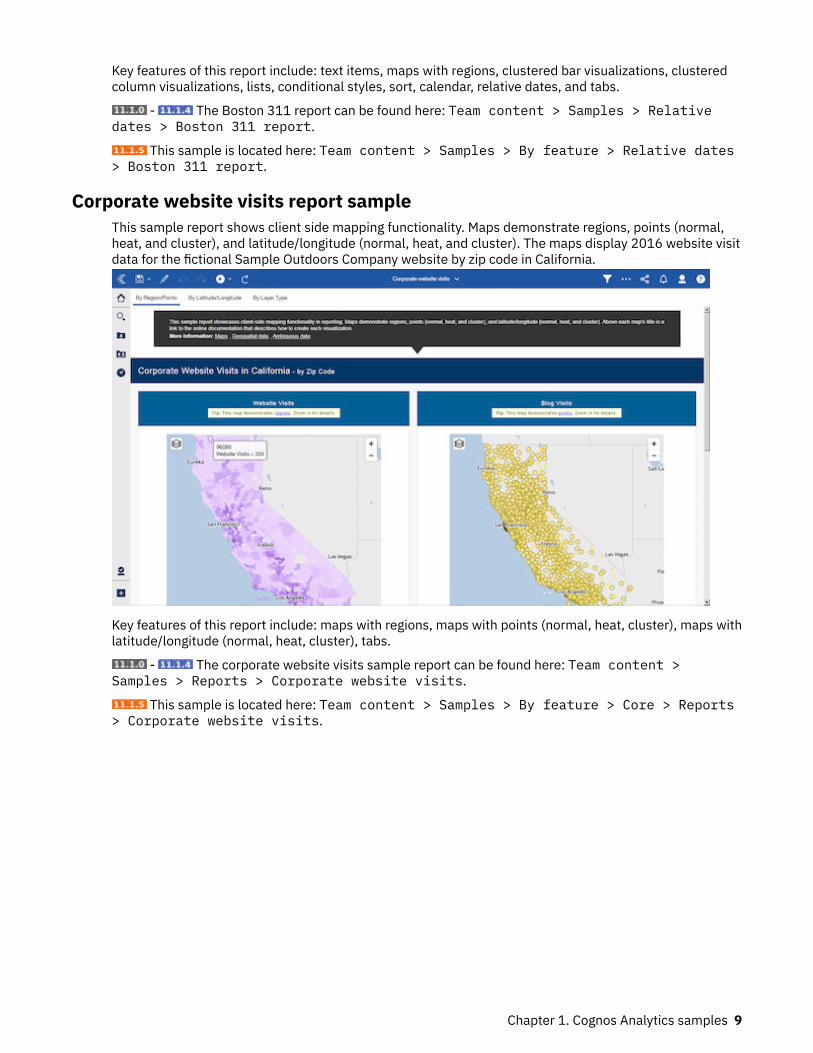
Corporate website visits report sampleThis sample report shows client side mapping functionality. Maps demonstrate regions, points (normal,heat, and cluster), and latitude/longitude (normal, heat, and cluster). The maps display 2016 website visitdata for the fictional Sample Outdoors Company website by zip code in California.
Key features of this report include: maps with regions, maps with points (normal, heat, cluster), maps withlatitude/longitude (normal, heat, cluster), tabs.
- The corporate website visits sample report can be found here: Team content >Samples > Reports > Corporate website visits.
This sample is located here: Team content > Samples > By feature > Core > Reports> Corporate website visits.
Chapter 1. Cognos Analytics samples 9
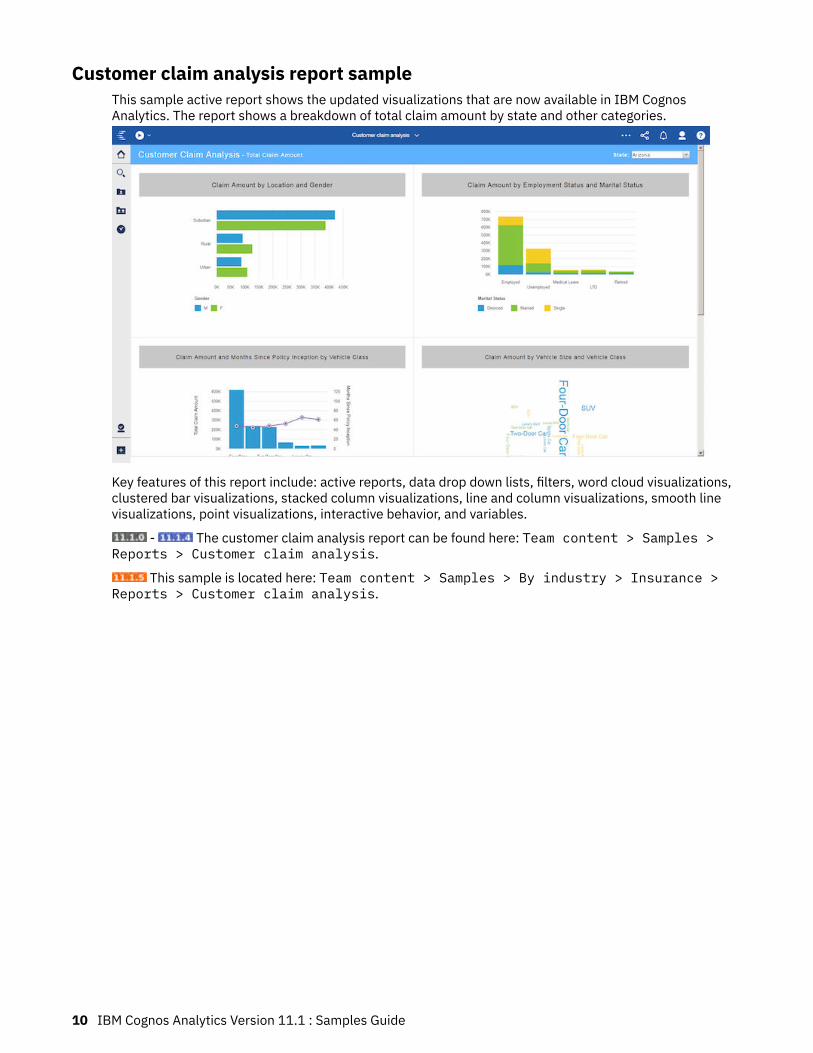
Customer claim analysis report sampleThis sample active report shows the updated visualizations that are now available in IBM CognosAnalytics. The report shows a breakdown of total claim amount by state and other categories.
Key features of this report include: active reports, data drop down lists, filters, word cloud visualizations,clustered bar visualizations, stacked column visualizations, line and column visualizations, smooth linevisualizations, point visualizations, interactive behavior, and variables.
- The customer claim analysis report can be found here: Team content > Samples >Reports > Customer claim analysis.
This sample is located here: Team content > Samples > By industry > Insurance >Reports > Customer claim analysis.
10 IBM Cognos Analytics Version 11.1 : Samples Guide
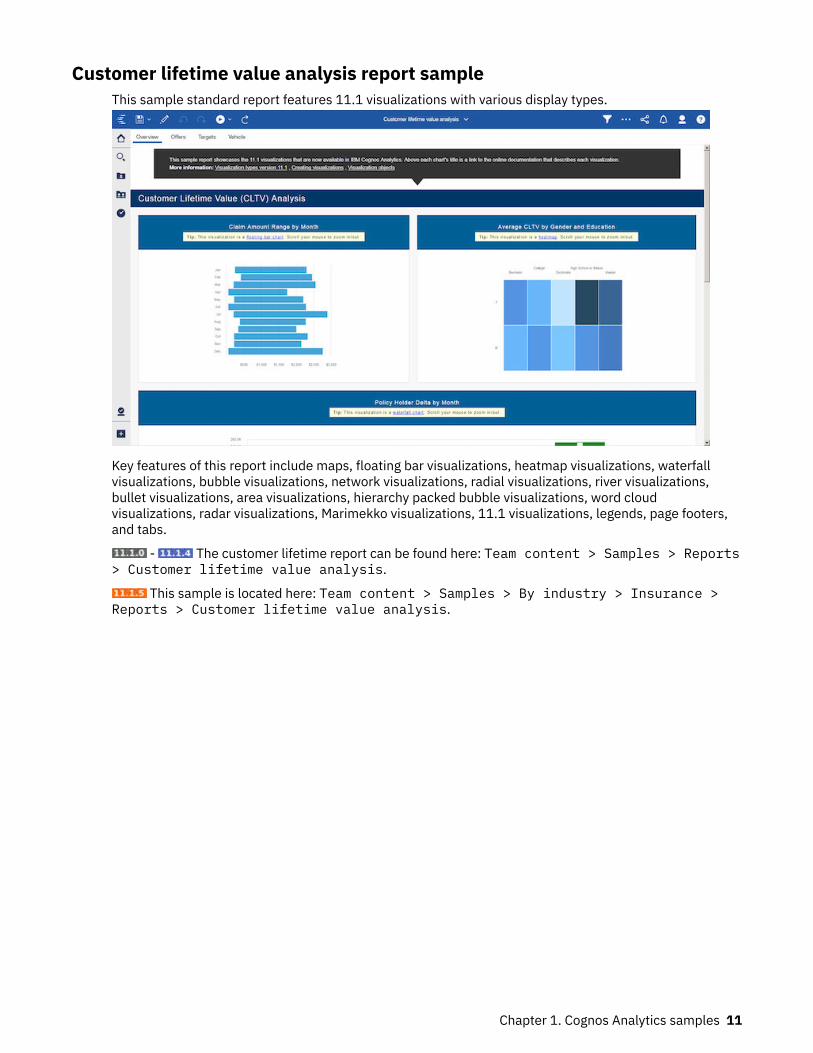
Customer lifetime value analysis report sampleThis sample standard report features 11.1 visualizations with various display types.
Key features of this report include maps, floating bar visualizations, heatmap visualizations, waterfallvisualizations, bubble visualizations, network visualizations, radial visualizations, river visualizations,bullet visualizations, area visualizations, hierarchy packed bubble visualizations, word cloudvisualizations, radar visualizations, Marimekko visualizations, 11.1 visualizations, legends, page footers,and tabs.
- The customer lifetime report can be found here: Team content > Samples > Reports> Customer lifetime value analysis.
This sample is located here: Team content > Samples > By industry > Insurance >Reports > Customer lifetime value analysis.
Chapter 1. Cognos Analytics samples 11
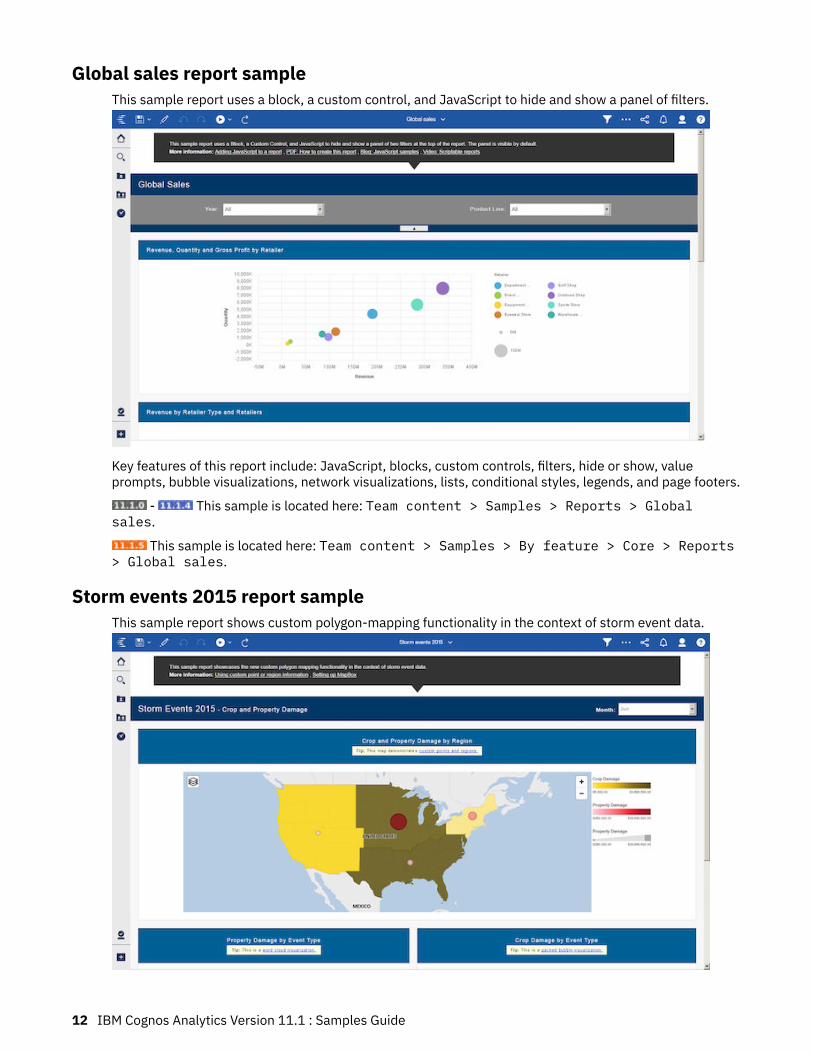
Global sales report sampleThis sample report uses a block, a custom control, and JavaScript to hide and show a panel of filters.
Key features of this report include: JavaScript, blocks, custom controls, filters, hide or show, valueprompts, bubble visualizations, network visualizations, lists, conditional styles, legends, and page footers.
- This sample is located here: Team content > Samples > Reports > Globalsales.
This sample is located here: Team content > Samples > By feature > Core > Reports> Global sales.
Storm events 2015 report sampleThis sample report shows custom polygon-mapping functionality in the context of storm event data.
12 IBM Cognos Analytics Version 11.1 : Samples Guide
Key features of this report include custom points, custom regions, maps, Tileset Id, layer names, propertynames, value prompts, filters, legends, word cloud visualizations, packed bubble visualizations, and pagefooters.
- The Storm events 2015 report can be found here: Team content >Samples > Reports> Storm events 2015.
The Storm events 2015 report can be found here: Team content > Samples > By feature> Core > Reports > Storm events 2015.
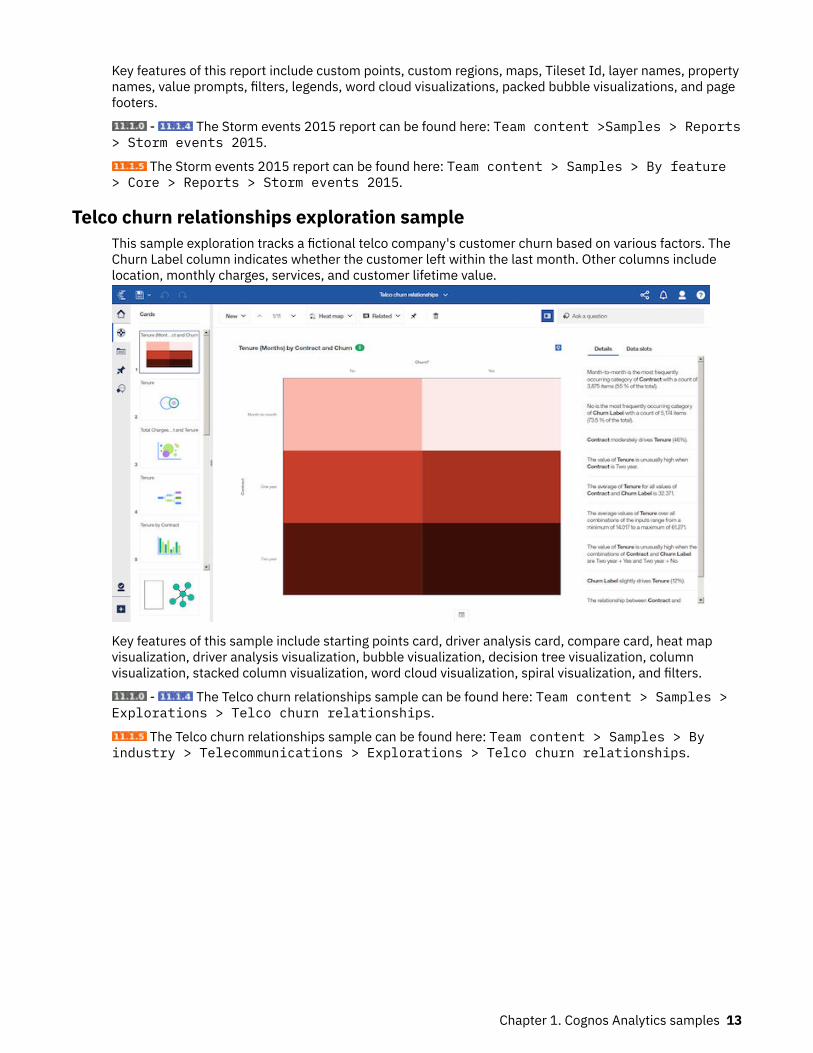
Telco churn relationships exploration sampleThis sample exploration tracks a fictional telco company's customer churn based on various factors. TheChurn Label column indicates whether the customer left within the last month. Other columns includelocation, monthly charges, services, and customer lifetime value.
Key features of this sample include starting points card, driver analysis card, compare card, heat mapvisualization, driver analysis visualization, bubble visualization, decision tree visualization, columnvisualization, stacked column visualization, word cloud visualization, spiral visualization, and filters.
- The Telco churn relationships sample can be found here: Team content > Samples >Explorations > Telco churn relationships.
The Telco churn relationships sample can be found here: Team content > Samples > Byindustry > Telecommunications > Explorations > Telco churn relationships.
Chapter 1. Cognos Analytics samples 13
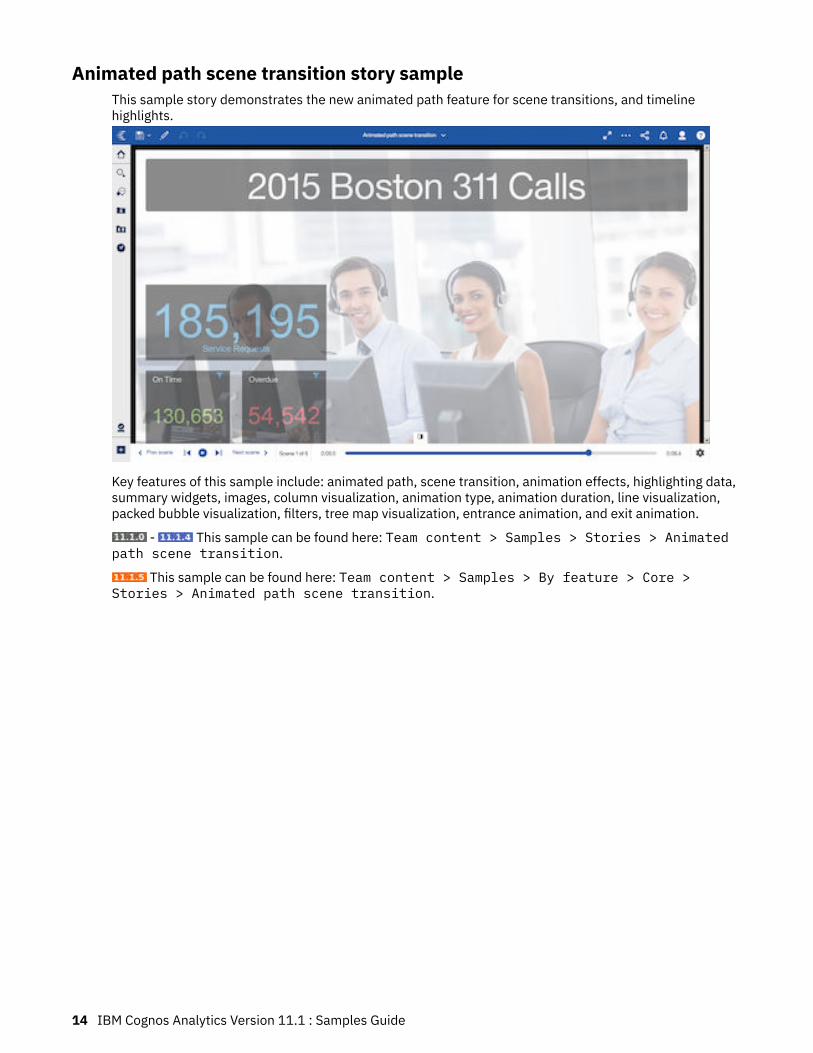
Animated path scene transition story sampleThis sample story demonstrates the new animated path feature for scene transitions, and timelinehighlights.
Key features of this sample include: animated path, scene transition, animation effects, highlighting data,summary widgets, images, column visualization, animation type, animation duration, line visualization,packed bubble visualization, filters, tree map visualization, entrance animation, and exit animation.
- This sample can be found here: Team content > Samples > Stories > Animatedpath scene transition.
This sample can be found here: Team content > Samples > By feature > Core >Stories > Animated path scene transition.
14 IBM Cognos Analytics Version 11.1 : Samples Guide
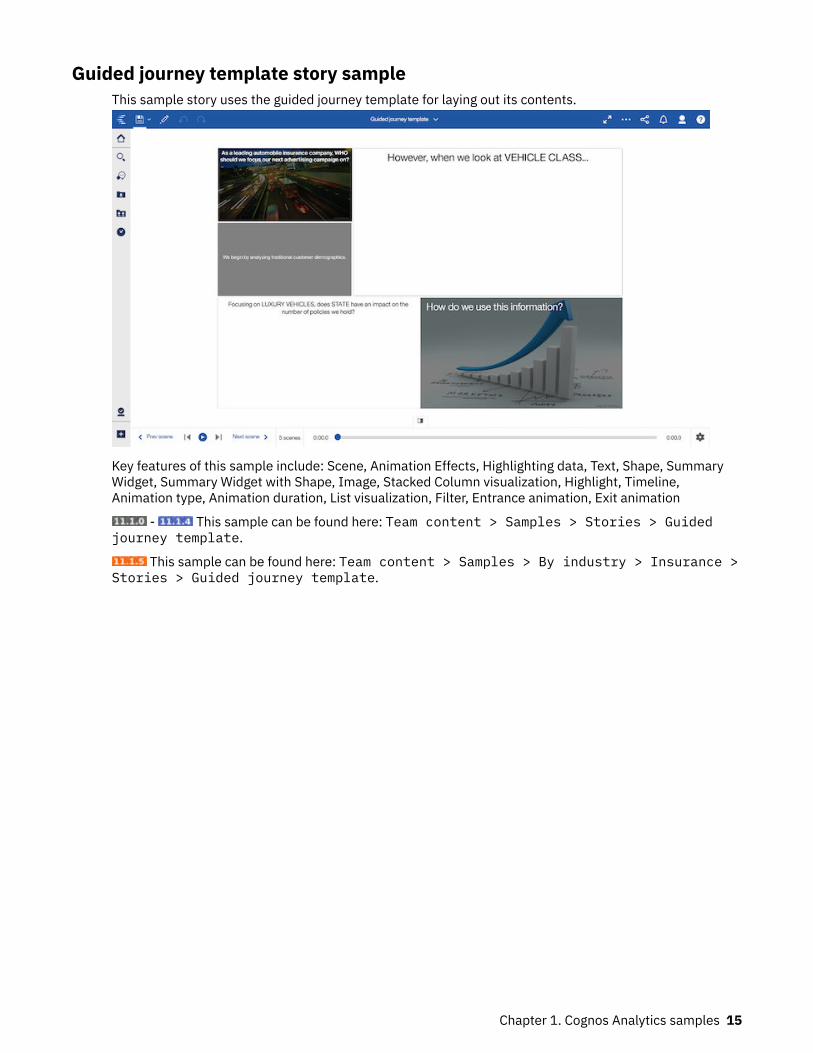
Guided journey template story sampleThis sample story uses the guided journey template for laying out its contents.
Key features of this sample include: Scene, Animation Effects, Highlighting data, Text, Shape, SummaryWidget, Summary Widget with Shape, Image, Stacked Column visualization, Highlight, Timeline,Animation type, Animation duration, List visualization, Filter, Entrance animation, Exit animation
- This sample can be found here: Team content > Samples > Stories > Guidedjourney template.
This sample can be found here: Team content > Samples > By industry > Insurance >Stories > Guided journey template.
Chapter 1. Cognos Analytics samples 15
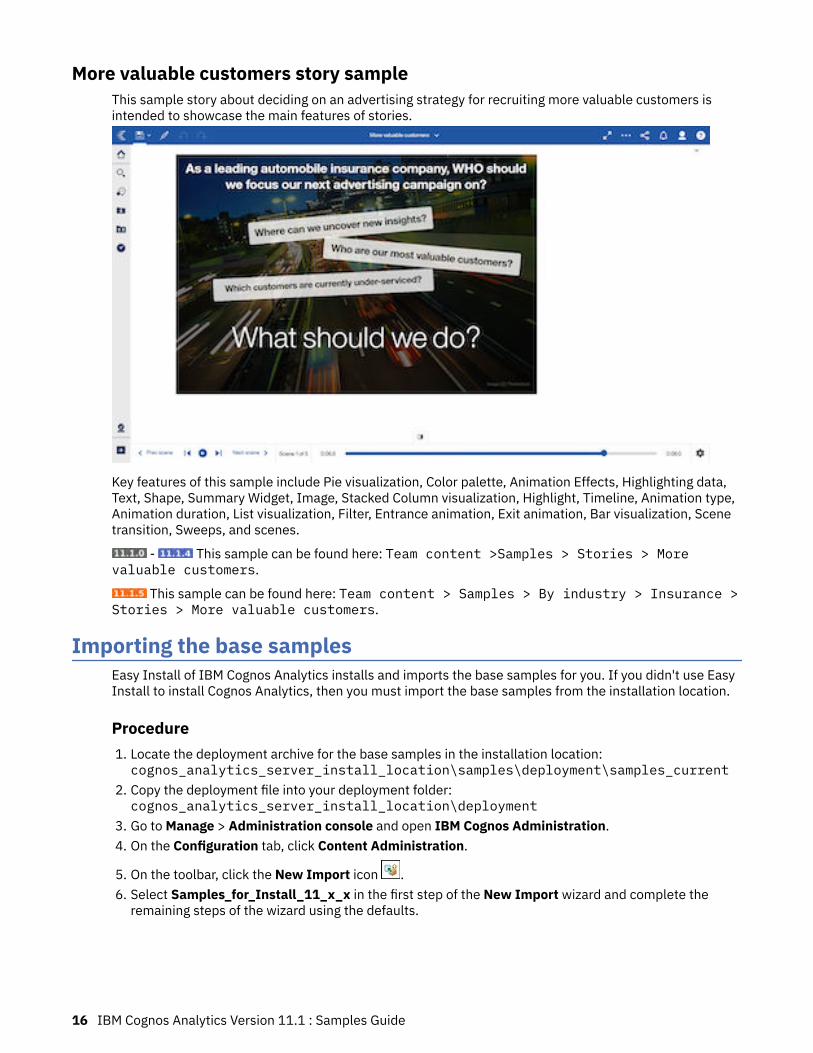
More valuable customers story sampleThis sample story about deciding on an advertising strategy for recruiting more valuable customers isintended to showcase the main features of stories.
Key features of this sample include Pie visualization, Color palette, Animation Effects, Highlighting data,Text, Shape, Summary Widget, Image, Stacked Column visualization, Highlight, Timeline, Animation type,Animation duration, List visualization, Filter, Entrance animation, Exit animation, Bar visualization, Scenetransition, Sweeps, and scenes.
- This sample can be found here: Team content >Samples > Stories > Morevaluable customers.
This sample can be found here: Team content > Samples > By industry > Insurance >Stories > More valuable customers.
Importing the base samplesEasy Install of IBM Cognos Analytics installs and imports the base samples for you. If you didn't use EasyInstall to install Cognos Analytics, then you must import the base samples from the installation location.
Procedure1. Locate the deployment archive for the base samples in the installation location:cognos_analytics_server_install_location\samples\deployment\samples_current
2. Copy the deployment file into your deployment folder:cognos_analytics_server_install_location\deployment
3. Go to Manage > Administration console and open IBM Cognos Administration.4. On the Configuration tab, click Content Administration.
5. On the toolbar, click the New Import icon .6. Select Samples_for_Install_11_x_x in the first step of the New Import wizard and complete the
remaining steps of the wizard using the defaults.
16 IBM Cognos Analytics Version 11.1 : Samples Guide
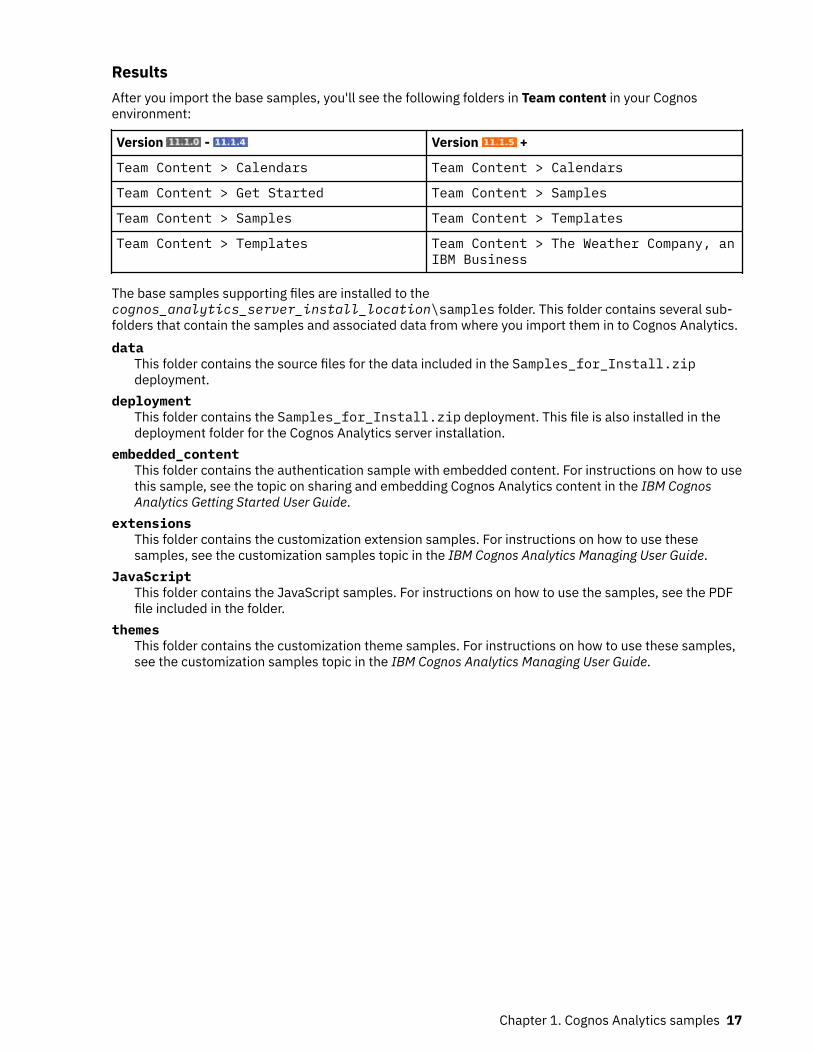
ResultsAfter you import the base samples, you'll see the following folders in Team content in your Cognosenvironment:
Version - Version +
Team Content > Calendars Team Content > Calendars
Team Content > Get Started Team Content > Samples
Team Content > Samples Team Content > Templates
Team Content > Templates Team Content > The Weather Company, anIBM Business
The base samples supporting files are installed to thecognos_analytics_server_install_location\samples folder. This folder contains several sub-folders that contain the samples and associated data from where you import them in to Cognos Analytics.data
This folder contains the source files for the data included in the Samples_for_Install.zipdeployment.
deploymentThis folder contains the Samples_for_Install.zip deployment. This file is also installed in thedeployment folder for the Cognos Analytics server installation.
embedded_contentThis folder contains the authentication sample with embedded content. For instructions on how to usethis sample, see the topic on sharing and embedding Cognos Analytics content in the IBM CognosAnalytics Getting Started User Guide.
extensionsThis folder contains the customization extension samples. For instructions on how to use thesesamples, see the customization samples topic in the IBM Cognos Analytics Managing User Guide.
JavaScriptThis folder contains the JavaScript samples. For instructions on how to use the samples, see the PDFfile included in the folder.
themesThis folder contains the customization theme samples. For instructions on how to use these samples,see the customization samples topic in the IBM Cognos Analytics Managing User Guide.
Chapter 1. Cognos Analytics samples 17

18 IBM Cognos Analytics Version 11.1 : Samples Guide
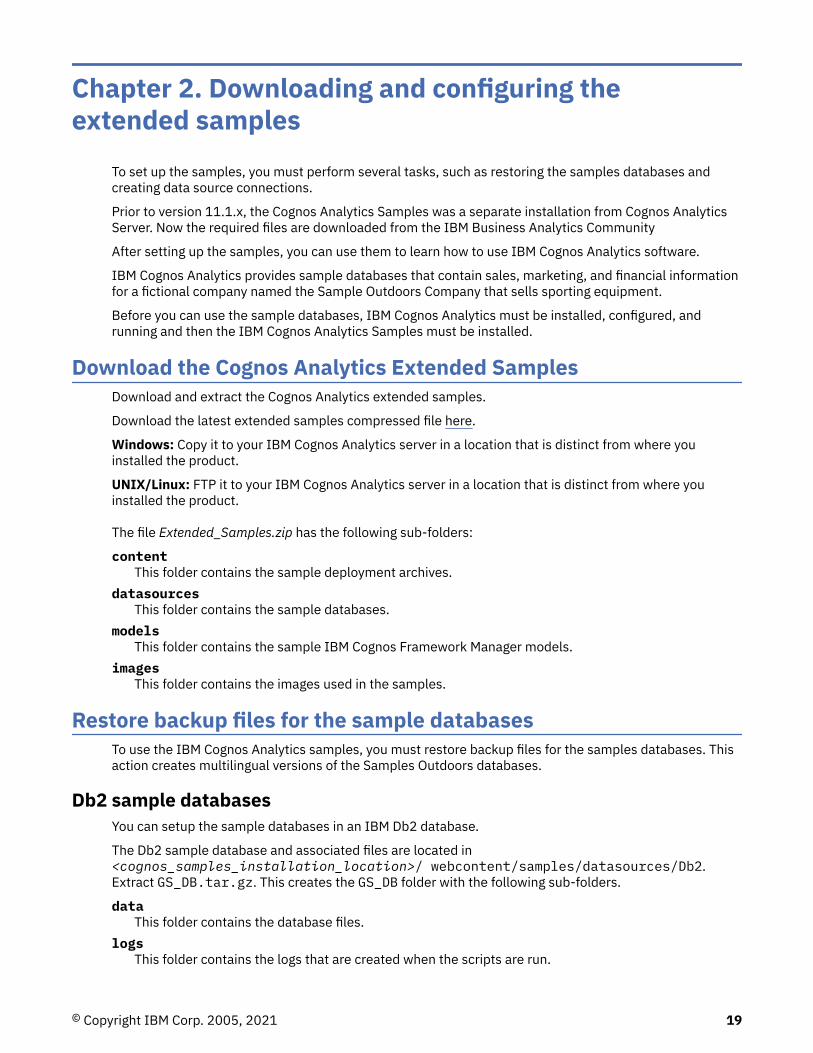
Chapter 2. Downloading and configuring theextended samples
To set up the samples, you must perform several tasks, such as restoring the samples databases andcreating data source connections.
Prior to version 11.1.x, the Cognos Analytics Samples was a separate installation from Cognos AnalyticsServer. Now the required files are downloaded from the IBM Business Analytics Community
After setting up the samples, you can use them to learn how to use IBM Cognos Analytics software.
IBM Cognos Analytics provides sample databases that contain sales, marketing, and financial informationfor a fictional company named the Sample Outdoors Company that sells sporting equipment.
Before you can use the sample databases, IBM Cognos Analytics must be installed, configured, andrunning and then the IBM Cognos Analytics Samples must be installed.
Download the Cognos Analytics Extended SamplesDownload and extract the Cognos Analytics extended samples.
Download the latest extended samples compressed file here.
Windows: Copy it to your IBM Cognos Analytics server in a location that is distinct from where youinstalled the product.
UNIX/Linux: FTP it to your IBM Cognos Analytics server in a location that is distinct from where youinstalled the product.
The file Extended_Samples.zip has the following sub-folders:
contentThis folder contains the sample deployment archives.
datasourcesThis folder contains the sample databases.
modelsThis folder contains the sample IBM Cognos Framework Manager models.
imagesThis folder contains the images used in the samples.
Restore backup files for the sample databasesTo use the IBM Cognos Analytics samples, you must restore backup files for the samples databases. Thisaction creates multilingual versions of the Samples Outdoors databases.
Db2 sample databasesYou can setup the sample databases in an IBM Db2 database.
The Db2 sample database and associated files are located in<cognos_samples_installation_location>/ webcontent/samples/datasources/Db2.Extract GS_DB.tar.gz. This creates the GS_DB folder with the following sub-folders.
dataThis folder contains the database files.
logsThis folder contains the logs that are created when the scripts are run.
© Copyright IBM Corp. 2005, 2021 19
unixThis folder contains the Unix and Linux® scripts.
winThis folder contains the Microsoft Windows scripts.
IBM Db2 samplesThe data files for Db2move (a database movement tool command) and the scripts to add constraints arein the data directory.
If you use WinZip to extract the Db2 move file on in a Microsoft Windows environment, ensure that theTAR file smart CR/LF conversion option is not selected.
After you extract the Db2 move file, restore the schemas to a database named GS_DB.
To add views, constraints, user privileges, and stored procedures to GS_DB, prepare and run thegs_db_modify files that are included with the samples in the following order:
1. Update the user name and password in gs_db_modify.sql and save it.2. Run gs_db_modify.bat
Note: If the script file attempts to create a stored procedure where the procedure does not exist an erroris generated. This error does not affect the samples.
Set the Db2CODEPAGE environment variable to a value of 1208.
When you create the GS_DB database, create a system default buffer pool with a page size of 32 KB andan associated regular tablespace. Ensure that the system temporary tablespace is also 32 KB.
Memory requirements are affected by the size and type of your database system. The GO sampledatabase whose tables are organized by column might require more memory than the typical row-basedsetup.
Restore the samples on IBM Db2 using a scriptYou can use scripts to restore backup files for sample databases for Db2.
To set up the sample database, you must extract the GS_DB tar.gz file, customize a configuration file,and run the setup script.
There are prerequisites for installing the Great Outdoors sample database for Db2 on Linux, UNIX andWindows. Before you can install the sample databases, you must verify or configure privileges.
1. Extract the GS_DB.tar.gz file and retain the original directory structure. If you use WinZip to extractthe Db2 move file on Microsoft Windows operating system, ensure that the TAR file smart CR/LFconversion option is not selected.
2. On Linux and UNIX operating systems, modify the file permissions on the setupGSDB.sh file so that itis executable: chmod u+x setupGSDB.sh.
3. Ensure that the user ID used to set up the database has DBADM authority or the following authoritiesin Db2:
• CREATETAB• CREATE_NOT_FENCED_ROUTINE• LOAD
Optional: Editing the configuration fileThe configuration file contains the default configuration options that are used when creating the GOSALESdata. The default configuration settings are listed in the following table.
20 IBM Cognos Analytics Version 11.1 : Samples Guide
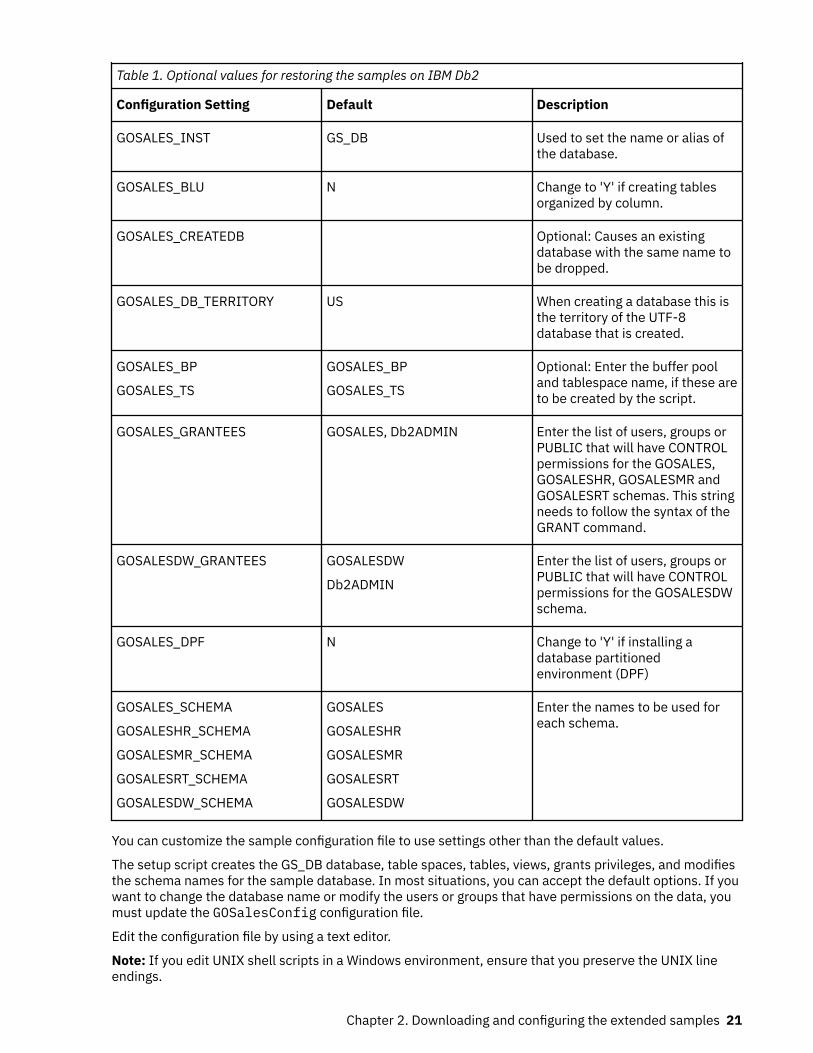
Table 1. Optional values for restoring the samples on IBM Db2
Configuration Setting Default Description
GOSALES_INST GS_DB Used to set the name or alias ofthe database.
GOSALES_BLU N Change to 'Y' if creating tablesorganized by column.
GOSALES_CREATEDB Optional: Causes an existingdatabase with the same name tobe dropped.
GOSALES_DB_TERRITORY US When creating a database this isthe territory of the UTF-8database that is created.
GOSALES_BP
GOSALES_TS
GOSALES_BP
GOSALES_TS
Optional: Enter the buffer pooland tablespace name, if these areto be created by the script.
GOSALES_GRANTEES GOSALES, Db2ADMIN Enter the list of users, groups orPUBLIC that will have CONTROLpermissions for the GOSALES,GOSALESHR, GOSALESMR andGOSALESRT schemas. This stringneeds to follow the syntax of theGRANT command.
GOSALESDW_GRANTEES GOSALESDW
Db2ADMIN
Enter the list of users, groups orPUBLIC that will have CONTROLpermissions for the GOSALESDWschema.
GOSALES_DPF N Change to 'Y' if installing adatabase partitionedenvironment (DPF)
GOSALES_SCHEMA
GOSALESHR_SCHEMA
GOSALESMR_SCHEMA
GOSALESRT_SCHEMA
GOSALESDW_SCHEMA
GOSALES
GOSALESHR
GOSALESMR
GOSALESRT
GOSALESDW
Enter the names to be used foreach schema.
You can customize the sample configuration file to use settings other than the default values.
The setup script creates the GS_DB database, table spaces, tables, views, grants privileges, and modifiesthe schema names for the sample database. In most situations, you can accept the default options. If youwant to change the database name or modify the users or groups that have permissions on the data, youmust update the GOSalesConfig configuration file.
Edit the configuration file by using a text editor.
Note: If you edit UNIX shell scripts in a Windows environment, ensure that you preserve the UNIX lineendings.
Chapter 2. Downloading and configuring the extended samples 21
The configuration file on Windows is GOSalesConfig.bat. The configuration file on UNIX isGOSalesConfig.sh.
By default, the GS_DB database name is used and permissions are granted to the Db2ADMIN (Linux,UNIX, Windows) and GOSALES users.
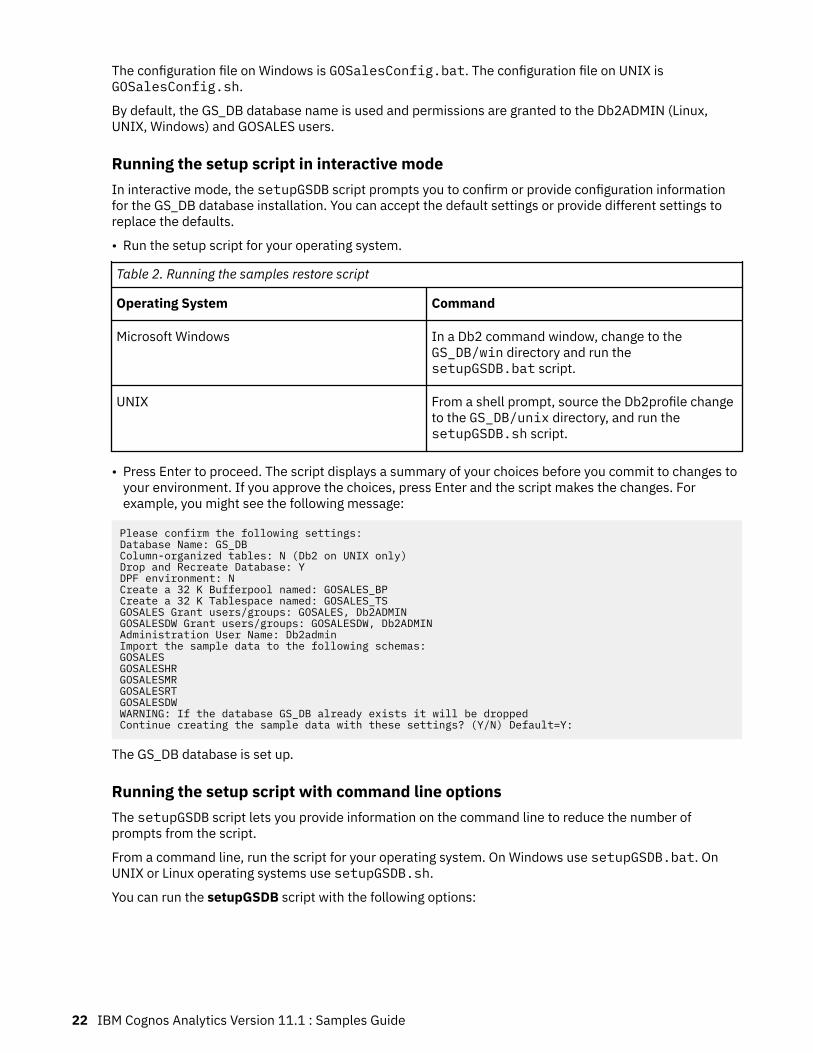
Running the setup script in interactive modeIn interactive mode, the setupGSDB script prompts you to confirm or provide configuration informationfor the GS_DB database installation. You can accept the default settings or provide different settings toreplace the defaults.
• Run the setup script for your operating system.
Table 2. Running the samples restore script
Operating System Command
Microsoft Windows In a Db2 command window, change to theGS_DB/win directory and run thesetupGSDB.bat script.
UNIX From a shell prompt, source the Db2profile changeto the GS_DB/unix directory, and run thesetupGSDB.sh script.
• Press Enter to proceed. The script displays a summary of your choices before you commit to changes toyour environment. If you approve the choices, press Enter and the script makes the changes. Forexample, you might see the following message:
Please confirm the following settings:Database Name: GS_DBColumn-organized tables: N (Db2 on UNIX only)Drop and Recreate Database: YDPF environment: NCreate a 32 K Bufferpool named: GOSALES_BPCreate a 32 K Tablespace named: GOSALES_TSGOSALES Grant users/groups: GOSALES, Db2ADMINGOSALESDW Grant users/groups: GOSALESDW, Db2ADMINAdministration User Name: Db2adminImport the sample data to the following schemas:GOSALESGOSALESHRGOSALESMRGOSALESRTGOSALESDWWARNING: If the database GS_DB already exists it will be droppedContinue creating the sample data with these settings? (Y/N) Default=Y:
The GS_DB database is set up.
Running the setup script with command line optionsThe setupGSDB script lets you provide information on the command line to reduce the number ofprompts from the script.
From a command line, run the script for your operating system. On Windows use setupGSDB.bat. OnUNIX or Linux operating systems use setupGSDB.sh.
You can run the setupGSDB script with the following options:
22 IBM Cognos Analytics Version 11.1 : Samples Guide
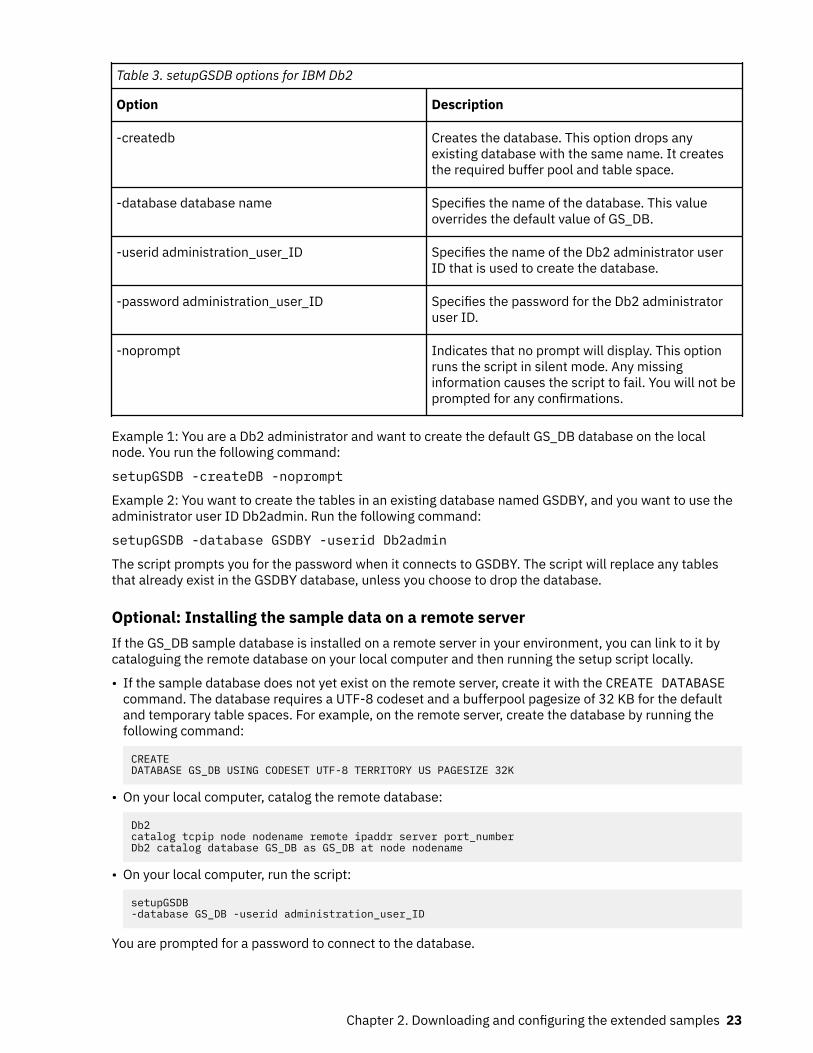
Table 3. setupGSDB options for IBM Db2
Option Description
-createdb Creates the database. This option drops anyexisting database with the same name. It createsthe required buffer pool and table space.
-database database name Specifies the name of the database. This valueoverrides the default value of GS_DB.
-userid administration_user_ID Specifies the name of the Db2 administrator userID that is used to create the database.
-password administration_user_ID Specifies the password for the Db2 administratoruser ID.
-noprompt Indicates that no prompt will display. This optionruns the script in silent mode. Any missinginformation causes the script to fail. You will not beprompted for any confirmations.
Example 1: You are a Db2 administrator and want to create the default GS_DB database on the localnode. You run the following command:
setupGSDB -createDB -noprompt
Example 2: You want to create the tables in an existing database named GSDBY, and you want to use theadministrator user ID Db2admin. Run the following command:
setupGSDB -database GSDBY -userid Db2admin
The script prompts you for the password when it connects to GSDBY. The script will replace any tablesthat already exist in the GSDBY database, unless you choose to drop the database.
Optional: Installing the sample data on a remote serverIf the GS_DB sample database is installed on a remote server in your environment, you can link to it bycataloguing the remote database on your local computer and then running the setup script locally.
• If the sample database does not yet exist on the remote server, create it with the CREATE DATABASEcommand. The database requires a UTF-8 codeset and a bufferpool pagesize of 32 KB for the defaultand temporary table spaces. For example, on the remote server, create the database by running thefollowing command:
CREATEDATABASE GS_DB USING CODESET UTF-8 TERRITORY US PAGESIZE 32K
• On your local computer, catalog the remote database:
Db2catalog tcpip node nodename remote ipaddr server port_numberDb2 catalog database GS_DB as GS_DB at node nodename
• On your local computer, run the script:
setupGSDB-database GS_DB -userid administration_user_ID
You are prompted for a password to connect to the database.
Chapter 2. Downloading and configuring the extended samples 23
Oracle sample databasesYou can setup the sample databases in an Oracle database.
The Oracle sample database and associated files are located in<cognos_samples_installation_location>/ webcontent/samples/datasources/oracle.Extract GS_DB_ORA.tar.gz. This creates the GS_DB_ORA folder with the following sub-folders.
dataThis folder contains the database files.
logsThis folder contains the logs that are created when the scripts are run.
unixThis folder contains the Unix and Linux scripts.
winThis folder contains the Microsoft Windows scripts.
Oracle samplesTo create foreign key constraints in tables that reference different schemas, you must rungs_or_modify.sql, found in the data folder.
Restore the samples on Oracle using a scriptYou can use scripts to restore backup files for sample databases for Oracle.
To set up the sample database, you must extract the file GS_DB_ORA.tar.gz, customize a configurationfile, and run the setup script.
There are prerequisites for installing the Great Outdoors sample database for Oracle. Before you caninstall the sample databases, you must verify or configure privileges.
• Extract the GS_DB_ORA.tar.gz file and retain the original directory structure.• On Linux and UNIX operating systems, modify the file permissions on the setupGSDB.sh file so that it
is executable: chmod u+x setupGSDB.sh.• Ensure that the user ID used to set up the Oracle database has authority to create users and run the
import utility.
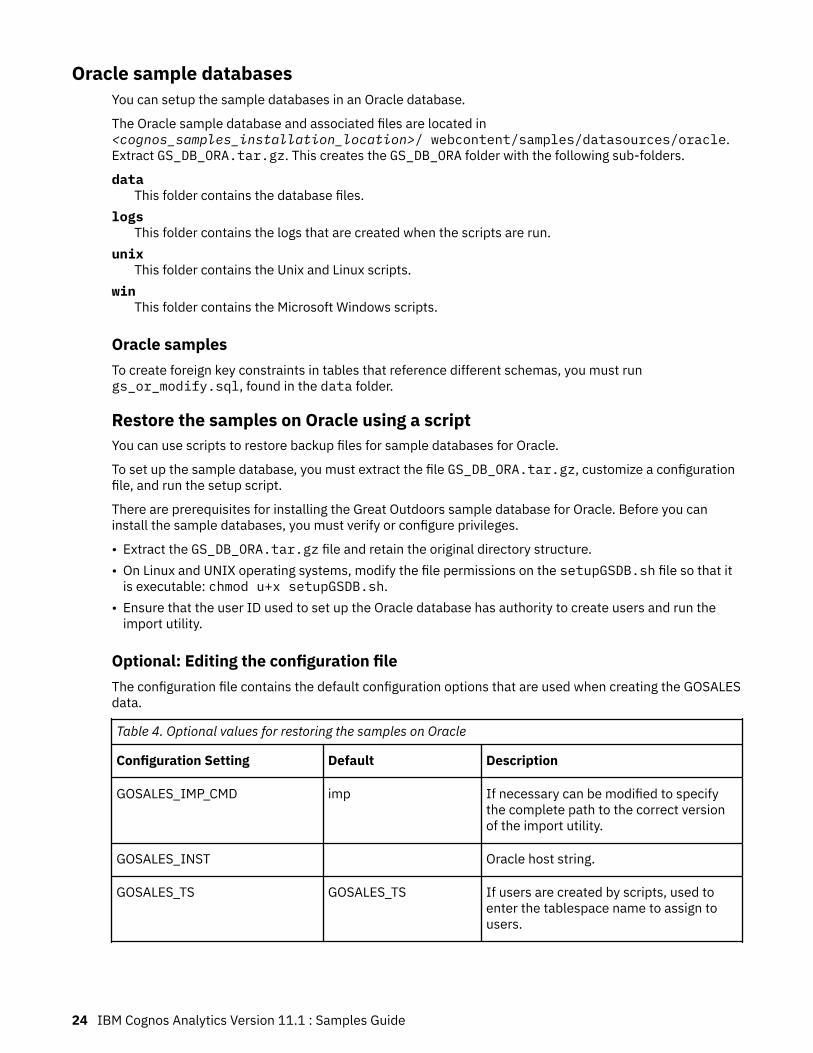
Optional: Editing the configuration fileThe configuration file contains the default configuration options that are used when creating the GOSALESdata.
Table 4. Optional values for restoring the samples on Oracle
Configuration Setting Default Description
GOSALES_IMP_CMD imp If necessary can be modified to specifythe complete path to the correct versionof the import utility.
GOSALES_INST Oracle host string.
GOSALES_TS GOSALES_TS If users are created by scripts, used toenter the tablespace name to assign tousers.
24 IBM Cognos Analytics Version 11.1 : Samples Guide
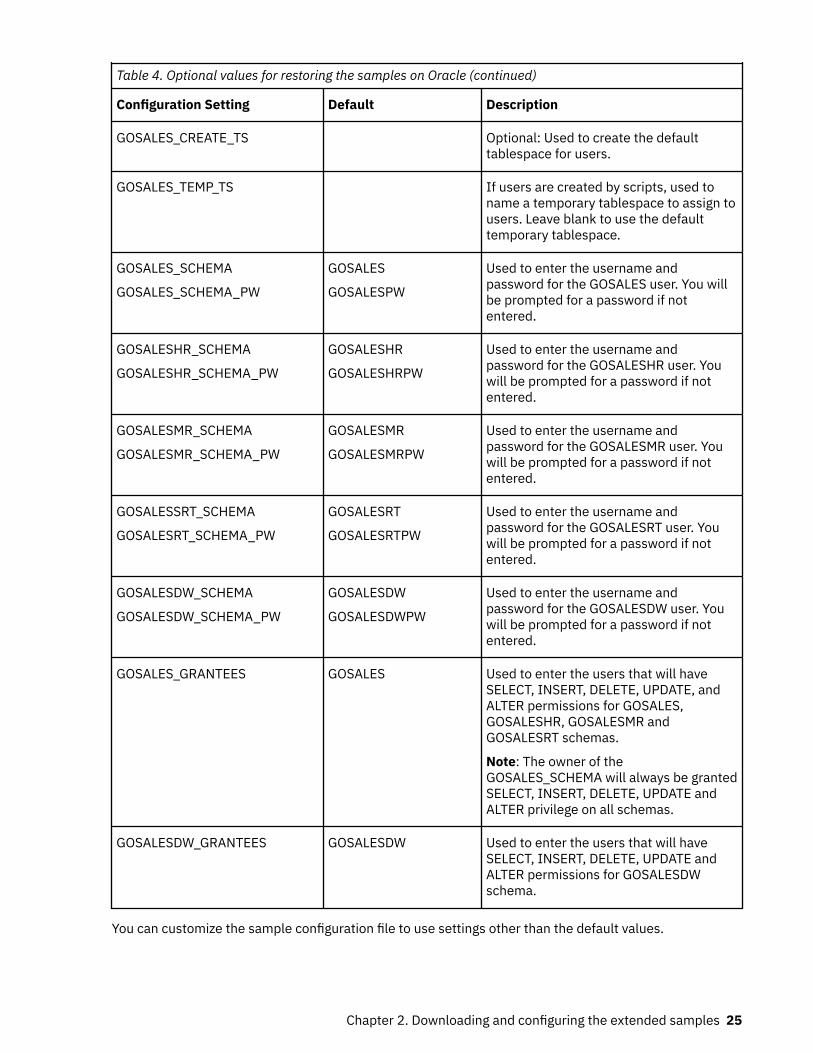
Table 4. Optional values for restoring the samples on Oracle (continued)
Configuration Setting Default Description
GOSALES_CREATE_TS Optional: Used to create the defaulttablespace for users.
GOSALES_TEMP_TS If users are created by scripts, used toname a temporary tablespace to assign tousers. Leave blank to use the defaulttemporary tablespace.
GOSALES_SCHEMA
GOSALES_SCHEMA_PW
GOSALES
GOSALESPW
Used to enter the username andpassword for the GOSALES user. You willbe prompted for a password if notentered.
GOSALESHR_SCHEMA
GOSALESHR_SCHEMA_PW
GOSALESHR
GOSALESHRPW
Used to enter the username andpassword for the GOSALESHR user. Youwill be prompted for a password if notentered.
GOSALESMR_SCHEMA
GOSALESMR_SCHEMA_PW
GOSALESMR
GOSALESMRPW
Used to enter the username andpassword for the GOSALESMR user. Youwill be prompted for a password if notentered.
GOSALESSRT_SCHEMA
GOSALESRT_SCHEMA_PW
GOSALESRT
GOSALESRTPW
Used to enter the username andpassword for the GOSALESRT user. Youwill be prompted for a password if notentered.
GOSALESDW_SCHEMA
GOSALESDW_SCHEMA_PW
GOSALESDW
GOSALESDWPW
Used to enter the username andpassword for the GOSALESDW user. Youwill be prompted for a password if notentered.
GOSALES_GRANTEES GOSALES Used to enter the users that will haveSELECT, INSERT, DELETE, UPDATE, andALTER permissions for GOSALES,GOSALESHR, GOSALESMR andGOSALESRT schemas.
Note: The owner of theGOSALES_SCHEMA will always be grantedSELECT, INSERT, DELETE, UPDATE andALTER privilege on all schemas.
GOSALESDW_GRANTEES GOSALESDW Used to enter the users that will haveSELECT, INSERT, DELETE, UPDATE andALTER permissions for GOSALESDWschema.
You can customize the sample configuration file to use settings other than the default values.
Chapter 2. Downloading and configuring the extended samples 25
The setup script creates the users and schemas specified in the configuration file. In most situations, youcan accept the default options. If you want to change the schema names or modify the users or groupsthat have permissions on the data, you must update the GOSalesConfig configuration file.
Edit the GOSalesConfig.bat or GOSalesConfig.sh configuration file by using a text editor.
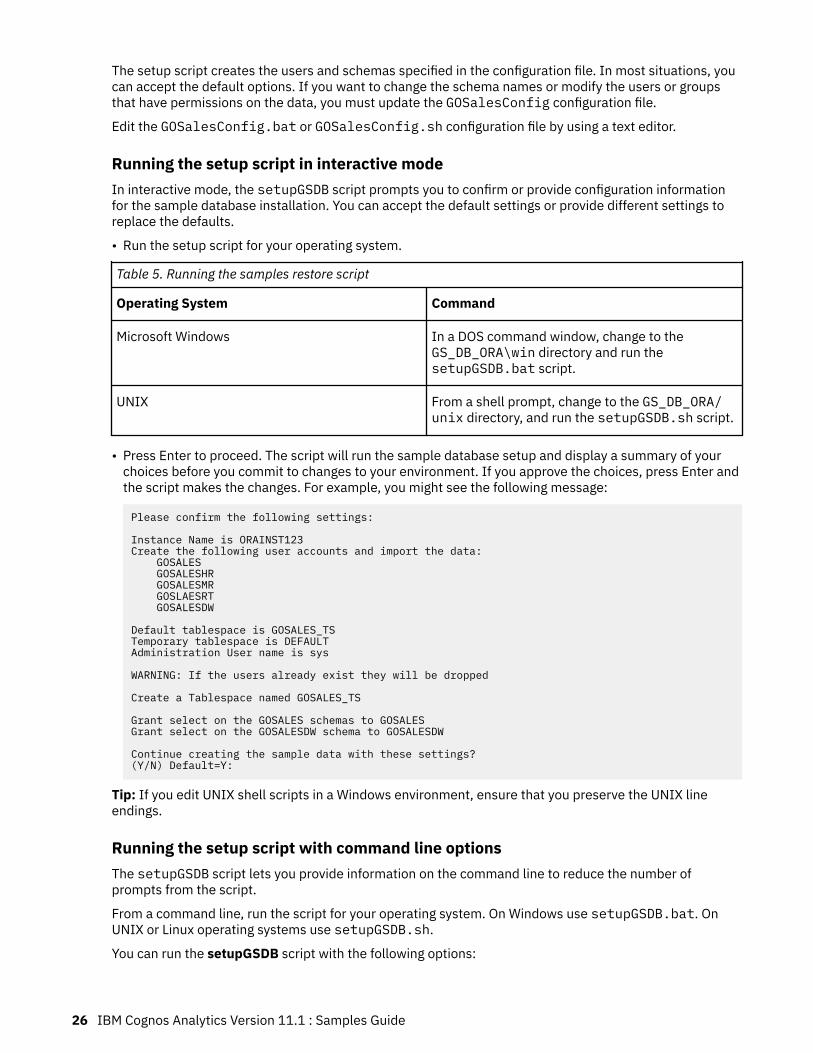
Running the setup script in interactive modeIn interactive mode, the setupGSDB script prompts you to confirm or provide configuration informationfor the sample database installation. You can accept the default settings or provide different settings toreplace the defaults.
• Run the setup script for your operating system.
Table 5. Running the samples restore script
Operating System Command
Microsoft Windows In a DOS command window, change to theGS_DB_ORA\win directory and run thesetupGSDB.bat script.
UNIX From a shell prompt, change to the GS_DB_ORA/unix directory, and run the setupGSDB.sh script.
• Press Enter to proceed. The script will run the sample database setup and display a summary of yourchoices before you commit to changes to your environment. If you approve the choices, press Enter andthe script makes the changes. For example, you might see the following message:
Please confirm the following settings: Instance Name is ORAINST123Create the following user accounts and import the data: GOSALES GOSALESHR GOSALESMR GOSLAESRT GOSALESDW Default tablespace is GOSALES_TSTemporary tablespace is DEFAULTAdministration User name is sys WARNING: If the users already exist they will be dropped Create a Tablespace named GOSALES_TS Grant select on the GOSALES schemas to GOSALESGrant select on the GOSALESDW schema to GOSALESDW Continue creating the sample data with these settings?(Y/N) Default=Y:
Tip: If you edit UNIX shell scripts in a Windows environment, ensure that you preserve the UNIX lineendings.
Running the setup script with command line optionsThe setupGSDB script lets you provide information on the command line to reduce the number ofprompts from the script.
From a command line, run the script for your operating system. On Windows use setupGSDB.bat. OnUNIX or Linux operating systems use setupGSDB.sh.
You can run the setupGSDB script with the following options:
26 IBM Cognos Analytics Version 11.1 : Samples Guide
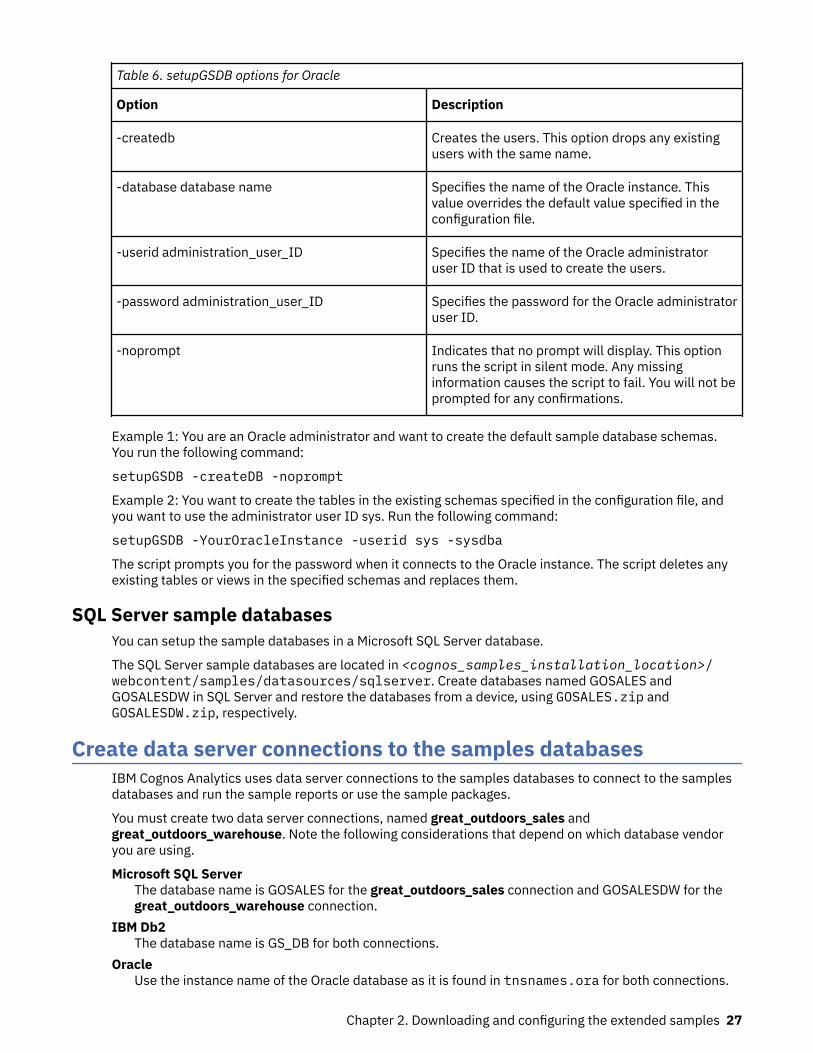
Table 6. setupGSDB options for Oracle
Option Description
-createdb Creates the users. This option drops any existingusers with the same name.
-database database name Specifies the name of the Oracle instance. Thisvalue overrides the default value specified in theconfiguration file.
-userid administration_user_ID Specifies the name of the Oracle administratoruser ID that is used to create the users.
-password administration_user_ID Specifies the password for the Oracle administratoruser ID.
-noprompt Indicates that no prompt will display. This optionruns the script in silent mode. Any missinginformation causes the script to fail. You will not beprompted for any confirmations.
Example 1: You are an Oracle administrator and want to create the default sample database schemas.You run the following command:
setupGSDB -createDB -noprompt
Example 2: You want to create the tables in the existing schemas specified in the configuration file, andyou want to use the administrator user ID sys. Run the following command:
setupGSDB -YourOracleInstance -userid sys -sysdba
The script prompts you for the password when it connects to the Oracle instance. The script deletes anyexisting tables or views in the specified schemas and replaces them.
SQL Server sample databasesYou can setup the sample databases in a Microsoft SQL Server database.
The SQL Server sample databases are located in <cognos_samples_installation_location>/webcontent/samples/datasources/sqlserver. Create databases named GOSALES andGOSALESDW in SQL Server and restore the databases from a device, using GOSALES.zip andGOSALESDW.zip, respectively.
Create data server connections to the samples databasesIBM Cognos Analytics uses data server connections to the samples databases to connect to the samplesdatabases and run the sample reports or use the sample packages.
You must create two data server connections, named great_outdoors_sales andgreat_outdoors_warehouse. Note the following considerations that depend on which database vendoryou are using.
Microsoft SQL ServerThe database name is GOSALES for the great_outdoors_sales connection and GOSALESDW for thegreat_outdoors_warehouse connection.
IBM Db2The database name is GS_DB for both connections.
OracleUse the instance name of the Oracle database as it is found in tnsnames.ora for both connections.
Chapter 2. Downloading and configuring the extended samples 27
Create the data server connections in one of two ways.
• If you will be using the IBM_Cognos_Samples_CQ_Legacy deployment, follow the steps in the topic oncreating a data source connection in the IBM Cognos Analytics Administration and Security Guide.
• If you will not be using the IBM_Cognos_Samples_CQ_Legacy deployment, follow the steps in the topicon creating a data server connection in the IBM Cognos Analytics Managing User Guide.
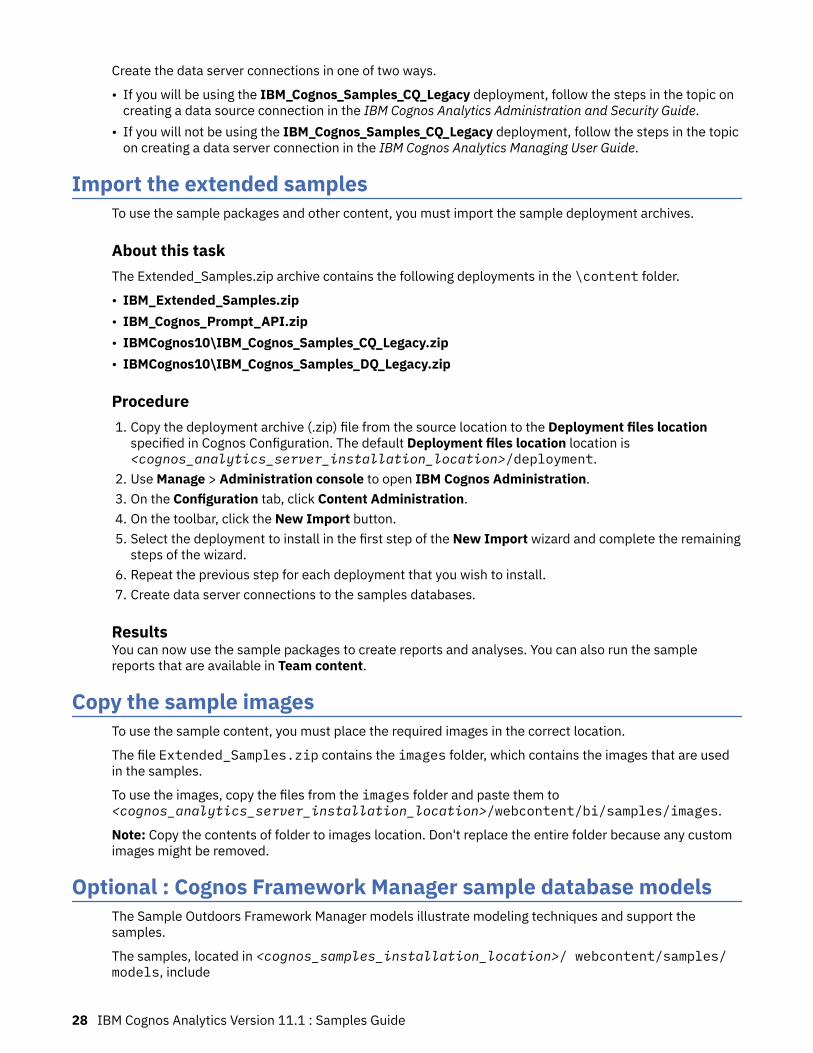
Import the extended samplesTo use the sample packages and other content, you must import the sample deployment archives.
About this taskThe Extended_Samples.zip archive contains the following deployments in the \content folder.
• IBM_Extended_Samples.zip• IBM_Cognos_Prompt_API.zip• IBMCognos10\IBM_Cognos_Samples_CQ_Legacy.zip• IBMCognos10\IBM_Cognos_Samples_DQ_Legacy.zip
Procedure1. Copy the deployment archive (.zip) file from the source location to the Deployment files location
specified in Cognos Configuration. The default Deployment files location location is<cognos_analytics_server_installation_location>/deployment.
2. Use Manage > Administration console to open IBM Cognos Administration.3. On the Configuration tab, click Content Administration.4. On the toolbar, click the New Import button.5. Select the deployment to install in the first step of the New Import wizard and complete the remaining
steps of the wizard.6. Repeat the previous step for each deployment that you wish to install.7. Create data server connections to the samples databases.
ResultsYou can now use the sample packages to create reports and analyses. You can also run the samplereports that are available in Team content.
Copy the sample imagesTo use the sample content, you must place the required images in the correct location.
The file Extended_Samples.zip contains the images folder, which contains the images that are usedin the samples.
To use the images, copy the files from the images folder and paste them to<cognos_analytics_server_installation_location>/webcontent/bi/samples/images.
Note: Copy the contents of folder to images location. Don't replace the entire folder because any customimages might be removed.
Optional : Cognos Framework Manager sample database modelsThe Sample Outdoors Framework Manager models illustrate modeling techniques and support thesamples.
The samples, located in <cognos_samples_installation_location>/ webcontent/samples/models, include
28 IBM Cognos Analytics Version 11.1 : Samples Guide
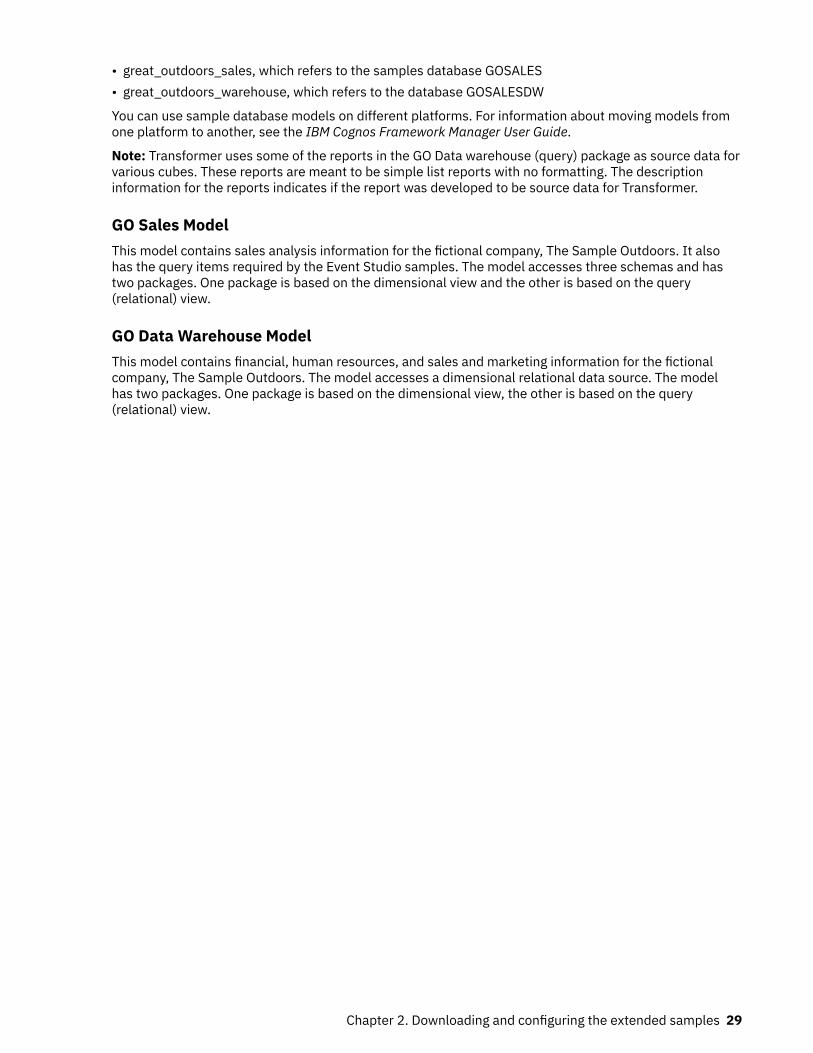
• great_outdoors_sales, which refers to the samples database GOSALES• great_outdoors_warehouse, which refers to the database GOSALESDW
You can use sample database models on different platforms. For information about moving models fromone platform to another, see the IBM Cognos Framework Manager User Guide.
Note: Transformer uses some of the reports in the GO Data warehouse (query) package as source data forvarious cubes. These reports are meant to be simple list reports with no formatting. The descriptioninformation for the reports indicates if the report was developed to be source data for Transformer.
GO Sales ModelThis model contains sales analysis information for the fictional company, The Sample Outdoors. It alsohas the query items required by the Event Studio samples. The model accesses three schemas and hastwo packages. One package is based on the dimensional view and the other is based on the query(relational) view.
GO Data Warehouse ModelThis model contains financial, human resources, and sales and marketing information for the fictionalcompany, The Sample Outdoors. The model accesses a dimensional relational data source. The modelhas two packages. One package is based on the dimensional view, the other is based on the query(relational) view.
Chapter 2. Downloading and configuring the extended samples 29

30 IBM Cognos Analytics Version 11.1 : Samples Guide
Chapter 3. Installing and configuring thesupplementary samples
The supplementary samples are samples that are no longer installed with the extended samples. You candownload and install these samples from the IBM Cognos Analytics web site.
To download the supplementary samples, go to Supplementary (Legacy) IBM Cognos Analytics 11Samples (https://www.ibm.com/communities/analytics/cognos-analytics-blog/supplementary-ibm-cognos-analytics-11-samples/) and download LegacySamples.zip. Extract the .zip file. It contains aSamples folder with sub-folders that contain the supplementary samples. The following topics explainhow to install and configure these samples.
Set Up Microsoft Analysis Services Cube SamplesThe supplementary samples include cubes for Microsoft Analysis Services (MSAS).
About this taskThe MSAS cubes can be found in Samples\datasources\cubes\MSAS and the MSAS deployments canbe found in Samples\content\MSAS.
For finance data, use the GO Finance Fact cube derived from the GOSALESDW database. This cubecontains year-to-date and monthly financial data for all accounts so that you can create financialstatements in Analysis Studio, Query Studio, and Reporting. The data is in actual US dollars submissionsfor 2004, 2005, 2006, or 2007 (7 months actual data only).
The MSAS2005 version is in the GOFinanceFact_XX.abf file. XX represents the language. For example, XXis replaced with EN which indicates English. The MSAS2008 version of cubes also exists, with reportcontent only for the 2005 version.
For sales data, use the GOSalesFact cube derived from the GOSalesFact_XX Analysis Services database,based on the GOSALESDW SQLSERVER Database. The cube contains measures such as unit cost, unitprice, quantity, and gross profit. Dimensions include Time, Product, and Retailers.
The MSAS2005 version is in the GOSalesFact_XX.abf restorable backup file.
The files must be restored to a Microsoft SQL Server database running the applicable Microsoft AnalysisServices and hosting the GOSALESDW database.
Note: Both Microsoft XML 6.0 Parser and Microsoft SQL 2005 Analysis Services 9.00 OLEDB Providermust be installed on the local client to establish data source connections to MSAS cubes.
Procedure1. Copy the GOSALESDW.cab and GOSALESDW.abf files to a directory that you can access from the
Analysis Manager console in the Analysis Servers of Microsoft SQL Server.2. Use the Microsoft Analysis Services Analysis Manager to restore the database from the
GOSALESDW.cab and GOSALESDW.abf files.
ResultsYou can now create the data source connections to these MSAS datasources in Cognos Administration byreferencing either the GOSalesFact_XX or GOFinanceFact_XX cubes you restored.
© Copyright IBM Corp. 2005, 2021 31
Set up the Essbase cube sampleThe supplementary samples include an Essbase cube sample.
About this taskThe cube samples are located in Samples\datasources\cubes\Essbase\Outlines_and_Raw_Data.
To set up the Essbase cube sample, you must have Oracle Essbase and Essbase Integration ServicesConsole installed. Alternatively, you can set up the smaller Essbase cube GODBReduced.zip which is afiltered version of the full version, GODWENU. To set up the small version, unzip GODBReduced.zip, loadthe otl and txt file in the Essbase environment before you follow the precedure.
Procedure1. Unzip the file for your language.
Each zip file contains the following two files:
• languageU_Data.txt, such as ENU_Data.txt or JAU_Data.txt.• GODWlanguageU.otl, such as GODWENU.otl or GODWJAU.otl.
2. Using block storage in Essbase, create a Unicode application.3. Within the application, create a new database.
You can use GODWlanguageU, such as GODWENU or GODWJAU, as your database name, or use thename of your choice.
4. Copy and paste the GODWlanguageU.otl file in your database directory.5. If the database name specified in step 4 is different than GODWlanguageU, rename theGODWlanguageU.otl file to match the database name that you created.
Confirm that you want to overwrite the otl file.6. In Essbase Administration Services console, open your database outline and save it.
Confirm that you want to save the outline even if it was not changed.7. Copy the languageU_Data.txt file and paste it in the same directory as the otl file.8. In Essbase Administration Services console, right-click the database you created and select Load
Data.9. Browse to the languageU_Data.txt file in your database directory, select the file, and click OK.
10. After the data loads successfully, right-click the database and select Execute Calculation.11. Select the default calculation, and click OK.
The calculation process may take up to 5 hours, depending on the computer where Essbase OLAPServer is installed.
ResultsYou can now create a data source connection to the cube.
Creating Data Source Connections to OLAP Data SourcesBefore users can access the data, you must create data source connections to the OLAP data sourcesamples. You must complete set up for Microsoft Analysis Services cube samples and the Oracle Essbasecube sample before creating data source connections.
Samples are accessible to everyone by default. To create customized data sources, you must haveexecute permissions for the Data Source Connections secured feature, and traverse permissions for theAdministration secured function. You must have write permissions for the Cognos namespace.
The following OLAP data sources are available in Samples\datasources\cubes.
32 IBM Cognos Analytics Version 11.1 : Samples Guide
• GO Sales Fact and GO Finance Fact Microsoft Analysis Services cubes• Sample Outdoors Company cubes which includes sales_and_marketing, employee_expenses,
go_accessories, go_americas, go_asia_pacific, and great_outdoors_sales_en.• Sample Outdoors Db2 cube
Create Data Source Connections to PowerCubesUse the following procedure to create a data source connection to a PowerCube.
Procedure1. In IBM Cognos Administration, click the Configuration tab.
2. Click the new data source button .3. To create a data source connection for the Sales and Marketing cube, type sales_and_marketing in
the Name box, and then click Next.4. In the connection page, under Type click IBM Cognos PowerCube, and then click Next.
The connection string page for the selected database appears.5. Optional: In the Read cache size (MB) box, type the cache size of the cube in megabytes.
To use the default value in the ppds_cfg.xml file, leave this field blank or type 0.6. In the Windows location box, type the location and name of the sales_and_marketing.mdc file for the
data source connection. For example, type
install_location/webcontent/samples/datasources/cubes/PowerCubes/En/Sales_and_Marketing.mdc
You can define a Microsoft Windows operating system path or a UNIX operating system path.
If you define a UNIX path and you plan to use Framework Manager, you must also define the Windowspath and ensure that the cube is also available in the Windows location. Framework Manager canaccess cubes only from Windows locations.
7. To test whether the parameters are correct, do the following:
• Click Test the connection.• Click Test.• When the test finishes, click Close twice.
8. Click Finish.
ResultsYou can now import the IBM_Cognos_Powercube.zip sample package for the PowerCube to use this datasource or you can create your own package using the cube.
Create Data Source Connections to Oracle Essbase CubesUse the following procedure to create a data source connection to an Oracle Essbase cube.
About this taskNote: To connect to an Oracle Essbase data source, the client software must be installed and configuredon the IBM Cognos Analytics server and in the same location as IBM Cognos Framework Manager.
Procedure1. In IBM Cognos Administration, click the Configuration tab.
2. Click the new data source button .
Chapter 3. Installing and configuring the supplementary samples 33
3. In the name and description page, type a unique name for the data source and, optionally, adescription and screen tip, and then select Next.
4. In the connection page, from the Type drop-down list, select Oracle Essbase, and then click Next.The connection string page appears.
5. Type the name of the Oracle Essbase sever.6. Select Signons, and then click Password and Create a signon the Everyone group can use.7. Type the User ID, Password, and then confirm the password for the cube.8. Select Test the connection, and then Test to test whether parameters are correct.
In the Status column, you can see if the connection was successful. If it was unsuccessful, selectClose, return to the previous steps, and verify your connection parameters. If it was successful, go tothe next step.
9. Click Finish.
ResultsTo use this data source, you must create a package using this data source in Framework Manager, andthen publish the package.
Create Data Source Connections to Microsoft Analysis Service CubesUse the following procedure to create a data source connection to a Microsoft Analysis Service cube.
Procedure1. In IBM Cognos Administration, click the Configuration tab.
2. Click the new data source button .3. In the Name box, type the name of the data source connection, and then click Next.
• For the GOFinanceFact cube, type GOFinanceFact_XX_MSAS2005.• For the GOSalesFact cube, type GOSalesFact_XX_MSAS2005.
4. In the Specify Connection page of the New Datasource Wizard, click Microsoft Analysis Services2005.
5. Click Next.6. In the Server Name box, type the name of the server where the restored databases are located. Back
slashes are not required.7. Under Signon, select the Password check box and then select the Create a signon that the
Everyone group can use check box. Type the user ID and password for the MSAS2005 database. ForMSAS2005, this is a network login.
8. Click Test the connection, and then click the Test button. Click Close.9. Click Finish. You are now prompted to create a package.
Alternatively, you can deploy an existing package from a sample deployment archive. The names ofthe deployment archives match the datasource connection names specified in step 4 and containsample reports that work with the associated cubes.
In Content Administration on the Configuration tab in IBM Cognos Administration, click New Import.The New Import Wizard prompts you to select a deployment archive. When you select a deploymentarchive, it is important to click Edit and specify a target name for the package to prevent an existingpackage from being overwritten.
10. To create a package, check Create a Package and then click OK.11. Specify a package name and then click OK.
• For the GO Finance Fact cube, type GOFinanceFact_XX_MSAS2005.• For the GO Sales Fact cube, type GOSalesFact_XX_MSAS2005.
34 IBM Cognos Analytics Version 11.1 : Samples Guide
12. Specify the Analysis Services database you restored either GOFinanceFact_XX or GoSalesFact_XX:
• For either the GOFinanceFact cube or the GOSalesFact cubes, type GOSALESDW.• For the GO Sales Fact cube, type GO Sales Fact.
13. Click the cube applicable to the database.14. Click Finish.
Import the supplementary samplesTo use the supplementary sample packages and other content, you must import the supplementarysample deployment archives.
Before you beginBefore you import the deployment archives other than IBM_Cognos_PowerCube.zip, you must restorethe databases. You must also create data source connections to the samples databases. Everydeployment requires a data source connection in order to run reports. For more information, see “Createdata server connections to the samples databases” on page 27.
Before you import the IBM_Cognos_PowerCube.zip deployment archive, you must create a databaseconnection to the appropriate PowerCube and select the language that you want to use. The languagethat you select must be supported by your locale.
About this taskThe following deployments can be found in Samples\content
• IBM_Cognos_DrillThroughSamples• IBM_Cognos_DynamicCube• IBM_Cognos_Metrics• IBM_Cognos_Office• IBM_Cognos_PowerCube• IBM_Cognos_PowerPlay
Procedure1. Copy the deployment archive (.zip) file from the source location to the Deployment files location
specified in Cognos Configuration. The default Deployment files location location is<cognos_analytics_server_installation_location>/deployment.
2. Use Manage > Administration console to open IBM Cognos Administration.3. On the Configuration tab, click Content Administration.4. On the toolbar, click the New Import button.5. Select the deployment to install in the first step of the New Import wizard and complete the remaining
steps of the wizard.6. Repeat the previous step for each deployment that you wish to install.
ResultsYou can now use the sample packages to create reports and analyses. You can also run the samplereports that are available in the Team content.
Chapter 3. Installing and configuring the supplementary samples 35
Setting up the samples for IBM Cognos Dynamic CubesYou can use the sample data to learn how to design and model dynamic cubes and use the data inreporting environments.
The IBM Cognos Dynamic Cubes samples are based on the model.fmd sample database model. Thismodel refers to the GOSALESDW database that contains sample data that other IBM Cognos productsuse. In Microsoft SQL Server, the dynamic cube uses the GOSALESDW database. In IBM Db2 and Oracle,the dynamic cube uses a single schema from the database.
The sample model is available in Samples\models\great_outdoors_dynamiccube.
Deploying sample dynamic cubesTo work with sample dynamic cubes in the IBM Cognos studios, use the IBM Cognos Cube Designer todeploy the sample dynamic cubes and make them available as data sources. The sample dynamic cubesare gosldw_sales, gosldw_target, and gosldw_sales_and_target.
Before you beginThe great_outdoors_warehouse data source connection must be set up before you deploy sampledynamic cubes.
If anonymous access is disabled, you must use the credentials that are associated with your account topublish cubes. Go to the Personal tab in the Set preferences dialog of the IBM Cognos Portal, and createyour credentials before you proceed.
About this taskYou do not have to publish a package to use the sample reports; the package is part of the sampledeployment.
Procedure1. From the Start menu, click Programs > IBM Cognos Cube Designer > IBM Cognos Cube Designer.
Tip: You can also start the IBM Cognos Cube Designer from IBM Cognos Framework Manager. Fromthe Tools menu, select Run IBM Cognos Cube Designer.
2. Open the project that contains the dynamic cube that you want to deploy and publish.
a) From the toolbar, click Open .b) Navigate to the location where you downloaded the sample model and open model.fmd
3. In the Project Explorer tree, expand the project and model.
Note: You may be prompted to log on to an IBM Cognos Analytics Server.4. Right-click the gosldw_sales dynamic cube, and select Publish.5. To deploy the dynamic cube and configure the cube as a data source, in the Publish window, expand
Additional Options and select the Add the dynamic cube to the default dispatcher check box.6. To start the dynamic cube, select the Start the dynamic cube check box.7. If anonymous access is disabled, make sure the Associate my account and signon with the cube
datasource check box is selected. For anonymous access, clear the check box.8. Repeat steps 4 - 7 for the cube gosldw_target, and lastly for the virtual cube gosldw_sales_and_target.9. Click OK.
ResultsIf the deployment and publish process is successful, no errors are reported. A message confirms that thecubes started successfully. You can now use the sample packages to create reports that rely on dynamiccube data sources. You can also run the sample reports that are available in Team content.
36 IBM Cognos Analytics Version 11.1 : Samples Guide
Chapter 4. Using the samplesThis content describes the sample data used in the IBM Cognos Analytics extended samples. Thesamples are based on the Sample Outdoors Company database. Here you will learn about its structure,databases, model and packages.
The samples described in this chapter are available to download from the IBM Cognos AnalyticsCommunity (https://community.ibm.com/community/user/businessanalytics/home).
The Sample Outdoors CompanyThe Sample Outdoors Company samples illustrate product features and technical and business bestpractices. You can also use them for experimenting with and sharing report design techniques and fortroubleshooting. As you use the samples, you can connect to features in the product.
The Sample Outdoors Company, or GO Sales, or any variation of the Sample Outdoors name, is the nameof a fictitious business operation whose sample data is used to develop sample applications for IBM andIBM customers. Its fictitious records include sample data for sales transactions, product distribution,finance, and human resources. Any resemblance to actual names, addresses, contact numbers, ortransaction values, is coincidental. Unauthorized duplication is prohibited.
Samples outlineThe samples consist of the following:
• Two databases that contain all corporate data, and the related sample models for query and analysis• Sample cubes and the related models• A metrics data source including associated metrics and a strategy map for the consolidated company,
and a model for Metric extracts.• Reports, queries, query templates, and workspaces
To run interactive reports, scripts are required. To see all the reports included in the samples packages,copy the files from the samples content installation into deployment folder and then import thedeployments into the IBM Cognos Business Intelligence product.
SecuritySamples are available to all users.
The Sample Outdoors Group of CompaniesTo make designing examples faster, especially financial examples, some general information about TheSample Outdoors Company is useful. To look for samples that use particular product features, see theindividual sample descriptions in this section.
Revenue for The Sample Outdoors Company comes from corporate stores and from franchise operations.The revenues are consolidated from the wholly-owned subsidiaries. There are six distinct organizations,each with its own departments and sales branches. Five of these are regionally-based companies.
The sixth company, GO Accessories:
• Has its own collection of products, differentiated from the other GO companies by brand, name, price,color and size.
• Sells from a single branch to all regions and retailers.• Functions both as an operating company based in Geneva, and as a part owner of the three GO
subsidiaries in Europe.
© Copyright IBM Corp. 2005, 2021 37
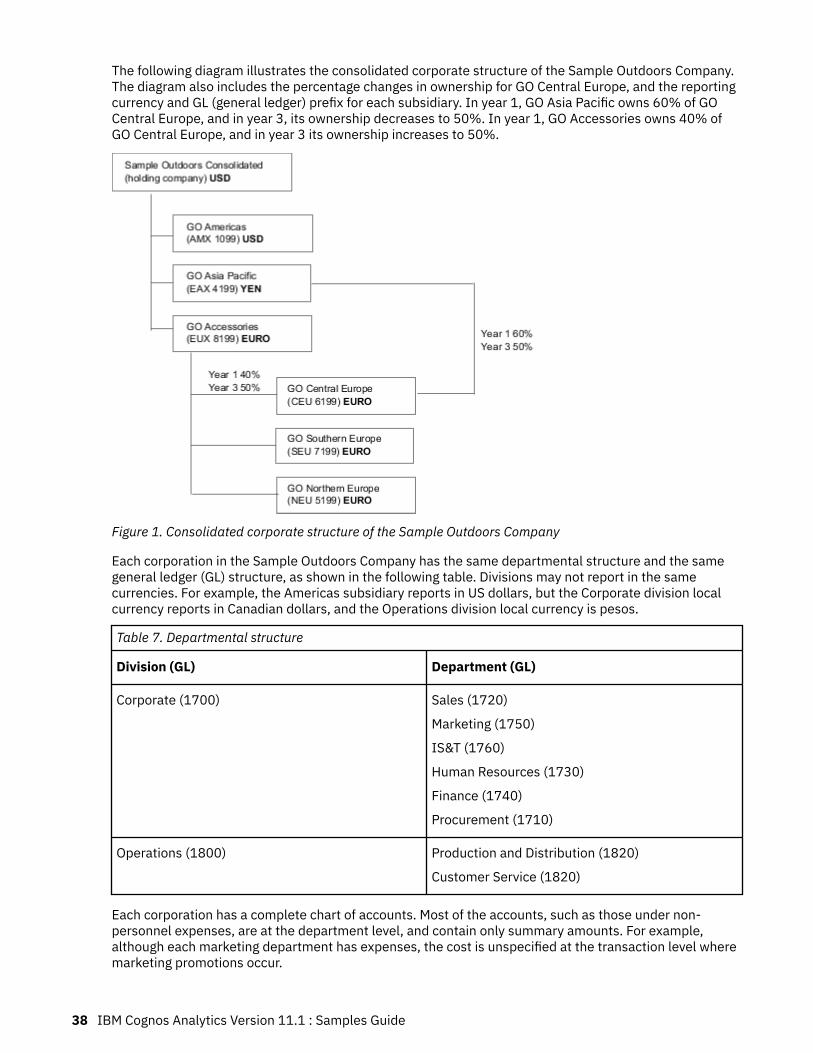
The following diagram illustrates the consolidated corporate structure of the Sample Outdoors Company.The diagram also includes the percentage changes in ownership for GO Central Europe, and the reportingcurrency and GL (general ledger) prefix for each subsidiary. In year 1, GO Asia Pacific owns 60% of GOCentral Europe, and in year 3, its ownership decreases to 50%. In year 1, GO Accessories owns 40% ofGO Central Europe, and in year 3 its ownership increases to 50%.
Figure 1. Consolidated corporate structure of the Sample Outdoors Company
Each corporation in the Sample Outdoors Company has the same departmental structure and the samegeneral ledger (GL) structure, as shown in the following table. Divisions may not report in the samecurrencies. For example, the Americas subsidiary reports in US dollars, but the Corporate division localcurrency reports in Canadian dollars, and the Operations division local currency is pesos.
Table 7. Departmental structure
Division (GL) Department (GL)
Corporate (1700) Sales (1720)
Marketing (1750)
IS&T (1760)
Human Resources (1730)
Finance (1740)
Procurement (1710)
Operations (1800) Production and Distribution (1820)
Customer Service (1820)
Each corporation has a complete chart of accounts. Most of the accounts, such as those under non-personnel expenses, are at the department level, and contain only summary amounts. For example,although each marketing department has expenses, the cost is unspecified at the transaction level wheremarketing promotions occur.
38 IBM Cognos Analytics Version 11.1 : Samples Guide
EmployeesThe Sample Outdoors data contains a full list of employees in all divisions, departments, and locations.
Data is available for reports about bonuses (Global Bonus report) and sales commissions (SalesCommissions for Central Europe report), training (Employee Training by Year report), and performancereviews and employee satisfaction surveys (Employee Satisfaction 2012). If you use Metric Studio,sample metrics for human resources are also available.
In the GO Data Warehouse (analysis) package, groups of measures and the related dimensions areorganized into folders. The employees are organized in hierarchies for region and manager, to makedifferent kinds of aggregation easy to report on. Aggregation has been defined for the Employee PositionSummary measures, so that Position count and Planned position count aggregate correctly at each levelof time: monthly, quarterly, or yearly. For example, see the Planned Headcount report.
The employees are also listed in a sample LDIF file which could be used for any LDAP IBM productauthentication including Tivoli®. This authentication directory is necessary for IBM Cognos Planningsamples. No other samples depend on security profiles.
Sales and marketingData about sales and marketing is available for all of the companies in the Sample Outdoors group.
GO Accessories has richer details to support analysis examples. For example, see the Revenue vs % ProfitMargin by Product Brand analysis, based on the Sales and Marketing cube. Marketing and salescampaigns are tied to the Sample Outdoors regional companies.
Overall, the GO companies have experienced solid growth across most product lines (Sales Growth YearOver Year), in all regions (Revenue by GO Subsidiary 2011), because of factors like an increase in repeatbusiness and new or improved products, such as the high margin sunglasses product line. In the productlines sold by the five regional companies (all but GO Accessories) promotions have had mixed success(Promotion Success by Campaign, Bundle and Quarter). If you use Metric Studio, this can also be seen inthe sample metrics.
Customer surveysThe data also contains information from customer surveys. For example, the product line that includesbug spray, sun screen, and so on has not been successful (Product Satisfaction - Outdoor Protection2011) and a source of retailer dissatisfaction may be the level of customer service rather than the returns(Customer Returns and Satisfaction). If you use Metric Studio, this information can also be monitored inmetrics.
Sales outletsRevenue from the corporate outlets is available at the transaction level. Revenue from the franchiseoutlets is available at the consolidated level only (Sales and Marketing cube). Metrics about retailers showthat the number of new retail outlets has dropped over the time period covered by this data.
GO Accessories sells worldwide, and sells only accessories. Transaction data for GO Accessories is theprimary source for analysis of product by brand, color and size. The other five subsidiaries in the group ofcompanies are regional and sell all product lines for retailers in their region. For example, the report Top10 Retailers in 2011 uses sparklines and list data to review revenues at the retailer level.
Sample Outdoors Company models, Powercubes, and packagesThe sample Outdoors Company Framework Manager models that are included with the extended samplesillustrate modeling techniques and support the samples. The models are based on the GO datawarehouse and the GO sales transactional databases and are the basis for the sample reports andqueries. Each model contains two packages for publishing analysis (dimensional) and query views of thedata.
Chapter 4. Using the samples 39
To look at the sample models, you must have access to Framework Manager, the modeling tool in IBMCognos Business Intelligence. You also need to set up the sample databases and connections. SeeChapter 2, “Downloading and configuring the extended samples,” on page 19.
GO Data Warehouse
The GO Data Warehouse model, great_outdoors_data_warehouse.cpf, is based on the databaseGOSALESDW. It contains data about human resources, sales and marketing, and finance, which isgrouped into business areas. In the Database view, the three business areas are grouped into separatenamespaces. The Database view contains a fourth namespace (GO Data) for the common information.
The Database view is similar to the structure of the underlying database. All tables (database querysubjects) are unchanged. This enables IBM Cognos Analytics to retrieve metadata directly from thepackage in most cases, instead of using a metadata call to the database. The following changes andadditions were made in the Database view:
• Joins were added as necessary.• To allow for aggregation at different levels of granularity, some model query subjects were created. For
example, see the relationships between Time and Sales or Sales fact.• To allow single joins to be made between the lookup tables and each level in a dimension, lookup tables
were copied. For example, see the Products look up tables.
The Business view contains only model query subjects, with no joins. The following changes and additionswere made in the Business view:
• Calculations were added to the model query subjects. For example, the time dimension containslanguage calculations.
• Where the database has multiple hierarchies, new dimensions were created to organize each hierarchy.For example, the employee hierarchies are organized into several categories, such as manager andregion.
The GO Sales transactional database
The GO Sales model, great_outdoors_sales.cpf, is based on the GOSALES database, which isstructured as a transactional database. It contains principally sales data.
The Database view is similar to the underlying database structure. The following changes and additionswere made in the Database view:
• To make it possible to join the fact tables to the time dimension, model query subjects and multipartjoins are used.
• Other joins were added as necessary.
The Business view contains only model query subjects, with no joins. The following changes and additionswere made in the Business view:
• Calculations were added to the model query subjects.• Model query subjects that were created in the Database view to enable joins on the time dimension
were linked as reference shortcuts.• Where the database has multiple hierarchies, new dimensions were created to organize each hierarchy.• Sales Staff is a subset of the slowly changing Employee dimension. There is no unique Employee key in
GO Sales, so a filter retrieves the current record only. This model does not use historical data.
The samples PowerCubes
40 IBM Cognos Analytics Version 11.1 : Samples Guide
The following cubes are delivered with the Sample Outdoors samples in English, French, German,Japanese, and Chinese:
• sales_and_marketing.mdc• employee_expenses.mdc• go_accessories.mdc• go_americas.mdc• go_asia_pacific.mdc• great_outdoors_sales_en.mdc• great_outdoors_7.mdc
The samples packages
The Sample Outdoors samples include six packages. A brief description of each available package isprovided.
Go Data Warehouse (analysis) is a dimensionally modeled view of the GOSALESDW database. Thispackage can be used in all studios, including IBM Cognos Analysis Studio. Using this package, you can drillup and down.
Go Sales (analysis) is a dimensionally modeled view of the GOSALES database. This package can be usedin all studios, including Analysis Studio. Using this package, you can drill up and down.
Go Data Warehouse (query) is a non-dimensional view of the GOSALESDW database. This package can beused in all studios except Analysis Studio, and is useful for reporting when there is no need for drilling upand down.
Go Sales (query) is a non-dimension view of the GOSALES database. This package can be used in allstudios except Analysis Studio, and is useful for reporting when there is no need for drilling up and down.
Sales and Marketing (cube) is an OLAP package, based on the sales_and_marketing.mdc cube.
Great Outdoor Sales (cube) is an OLAP package, based on the great_outdoors_sales_en.mdc cube.
Note: The OLAP packages, Great Outdoor Sales (cube), and Sales and Marketing (cube), are notmultilingual. The IBM_Cognos_PowerCube.zip archive contains five versions of each package; one inEnglish, French, German, Japanese, and Chinese. For more information aboutIBM_Cognos_PowerCube.zip, see Legacy Samples.
Sample audit model and audit reportsIBM Cognos Analytics audit samples include a sample model and sample audit reports.
Sample audit modelThe default location of the Framework Manager sample audit model Audit.cpf isinstallation_location/samples/Audit_samples/Audit.
Sample audit reportsThe default location of the audit samples deployment IBM_Cognos_Audit.zip isinstallation_location/samples/Audit_samples.
You must set up the sample audit reports before you can use them.
The following table lists the sample audit reports and describes the content of each report.
Chapter 4. Using the samples 41
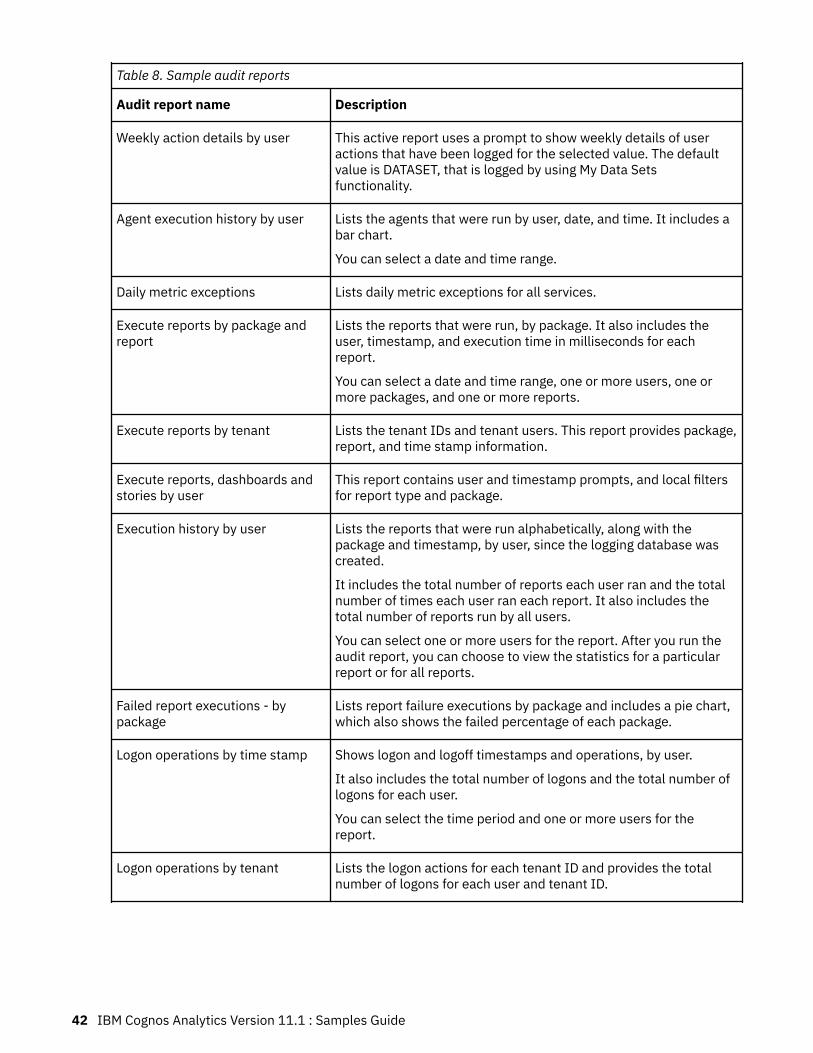
Table 8. Sample audit reports
Audit report name Description
Weekly action details by user This active report uses a prompt to show weekly details of useractions that have been logged for the selected value. The defaultvalue is DATASET, that is logged by using My Data Setsfunctionality.
Agent execution history by user Lists the agents that were run by user, date, and time. It includes abar chart.
You can select a date and time range.
Daily metric exceptions Lists daily metric exceptions for all services.
Execute reports by package andreport
Lists the reports that were run, by package. It also includes theuser, timestamp, and execution time in milliseconds for eachreport.
You can select a date and time range, one or more users, one ormore packages, and one or more reports.
Execute reports by tenant Lists the tenant IDs and tenant users. This report provides package,report, and time stamp information.
Execute reports, dashboards andstories by user
This report contains user and timestamp prompts, and local filtersfor report type and package.
Execution history by user Lists the reports that were run alphabetically, along with thepackage and timestamp, by user, since the logging database wascreated.
It includes the total number of reports each user ran and the totalnumber of times each user ran each report. It also includes thetotal number of reports run by all users.
You can select one or more users for the report. After you run theaudit report, you can choose to view the statistics for a particularreport or for all reports.
Failed report executions - bypackage
Lists report failure executions by package and includes a pie chart,which also shows the failed percentage of each package.
Logon operations by time stamp Shows logon and logoff timestamps and operations, by user.
It also includes the total number of logons and the total number oflogons for each user.
You can select the time period and one or more users for thereport.
Logon operations by tenant Lists the logon actions for each tenant ID and provides the totalnumber of logons for each user and tenant ID.
42 IBM Cognos Analytics Version 11.1 : Samples Guide
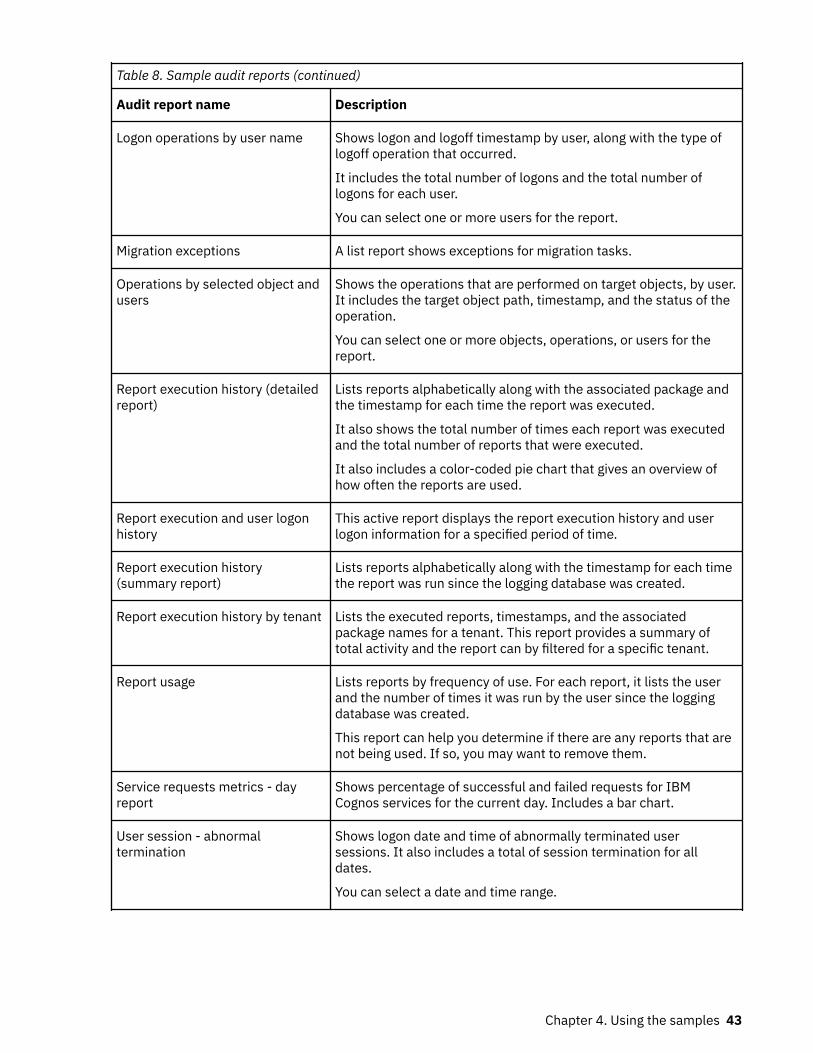
Table 8. Sample audit reports (continued)
Audit report name Description
Logon operations by user name Shows logon and logoff timestamp by user, along with the type oflogoff operation that occurred.
It includes the total number of logons and the total number oflogons for each user.
You can select one or more users for the report.
Migration exceptions A list report shows exceptions for migration tasks.
Operations by selected object andusers
Shows the operations that are performed on target objects, by user.It includes the target object path, timestamp, and the status of theoperation.
You can select one or more objects, operations, or users for thereport.
Report execution history (detailedreport)
Lists reports alphabetically along with the associated package andthe timestamp for each time the report was executed.
It also shows the total number of times each report was executedand the total number of reports that were executed.
It also includes a color-coded pie chart that gives an overview ofhow often the reports are used.
Report execution and user logonhistory
This active report displays the report execution history and userlogon information for a specified period of time.
Report execution history(summary report)
Lists reports alphabetically along with the timestamp for each timethe report was run since the logging database was created.
Report execution history by tenant Lists the executed reports, timestamps, and the associatedpackage names for a tenant. This report provides a summary oftotal activity and the report can by filtered for a specific tenant.
Report usage Lists reports by frequency of use. For each report, it lists the userand the number of times it was run by the user since the loggingdatabase was created.
This report can help you determine if there are any reports that arenot being used. If so, you may want to remove them.
Service requests metrics - dayreport
Shows percentage of successful and failed requests for IBMCognos services for the current day. Includes a bar chart.
User session - abnormaltermination
Shows logon date and time of abnormally terminated usersessions. It also includes a total of session termination for alldates.
You can select a date and time range.
Chapter 4. Using the samples 43
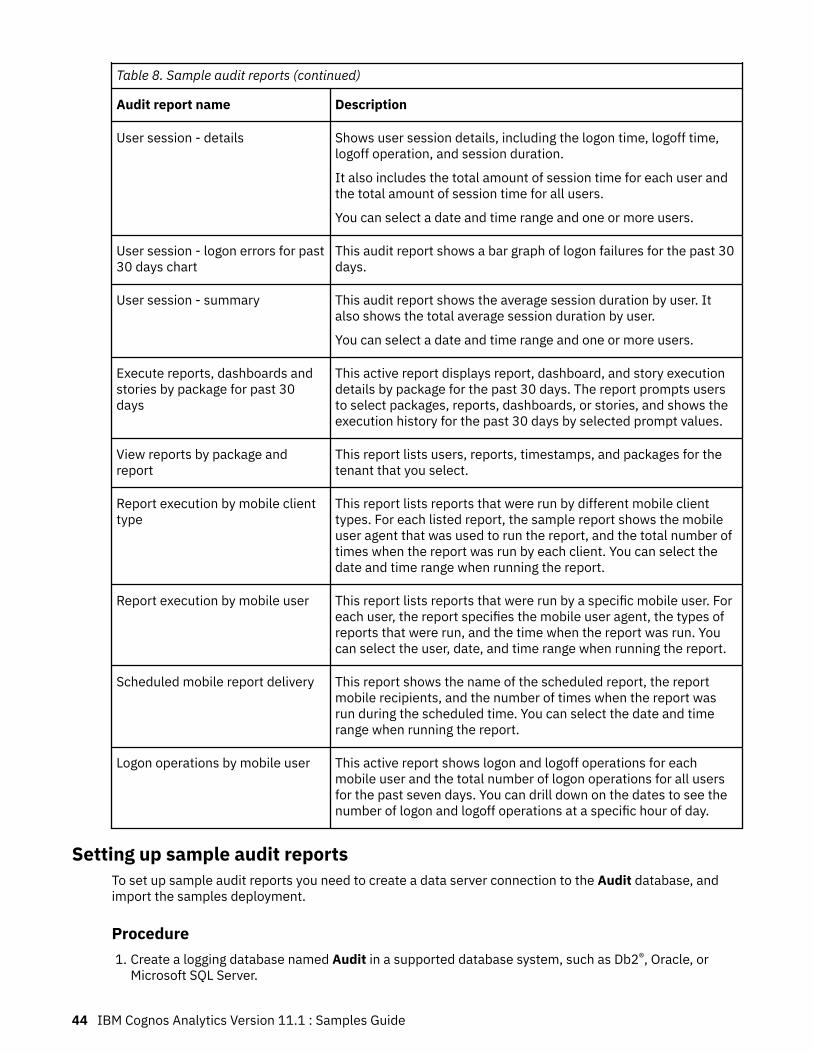
Table 8. Sample audit reports (continued)
Audit report name Description
User session - details Shows user session details, including the logon time, logoff time,logoff operation, and session duration.
It also includes the total amount of session time for each user andthe total amount of session time for all users.
You can select a date and time range and one or more users.
User session - logon errors for past30 days chart
This audit report shows a bar graph of logon failures for the past 30days.
User session - summary This audit report shows the average session duration by user. Italso shows the total average session duration by user.
You can select a date and time range and one or more users.
Execute reports, dashboards andstories by package for past 30days
This active report displays report, dashboard, and story executiondetails by package for the past 30 days. The report prompts usersto select packages, reports, dashboards, or stories, and shows theexecution history for the past 30 days by selected prompt values.
View reports by package andreport
This report lists users, reports, timestamps, and packages for thetenant that you select.
Report execution by mobile clienttype
This report lists reports that were run by different mobile clienttypes. For each listed report, the sample report shows the mobileuser agent that was used to run the report, and the total number oftimes when the report was run by each client. You can select thedate and time range when running the report.
Report execution by mobile user This report lists reports that were run by a specific mobile user. Foreach user, the report specifies the mobile user agent, the types ofreports that were run, and the time when the report was run. Youcan select the user, date, and time range when running the report.
Scheduled mobile report delivery This report shows the name of the scheduled report, the reportmobile recipients, and the number of times when the report wasrun during the scheduled time. You can select the date and timerange when running the report.
Logon operations by mobile user This active report shows logon and logoff operations for eachmobile user and the total number of logon operations for all usersfor the past seven days. You can drill down on the dates to see thenumber of logon and logoff operations at a specific hour of day.
Setting up sample audit reportsTo set up sample audit reports you need to create a data server connection to the Audit database, andimport the samples deployment.
Procedure1. Create a logging database named Audit in a supported database system, such as Db2®, Oracle, or
Microsoft SQL Server.
44 IBM Cognos Analytics Version 11.1 : Samples Guide
For more information, see the guidelines for creating a logging database in the IBM Cognos AnalyticsInstallation and Configuration Guide.
2. In IBM Cognos Configuration, configure the Audit database.a) Under Environment, right-click Logging.b) Select New resource > Destination. Type the name Audit, and choose the type Database. Click
OK.c) Right-click Audit, and select New resource > Database. Type the name Audit again, and choose
the database type that was used to create your logging database in step 1.d) Specify the required properties for the Audit database, including the user ID and password, and
test the database.e) Save the configuration, and re-start IBM Cognos service.
3. Create a data source connection to the Audit database.a) Go to Manage > Administration console.b) On the Configuration tab, select Data Source Connections.c) Follow the wizard to create a new data source connection. The database and data source must be
named Audit.4. Copy the samples deployment file IBM_Cognos_Audit.zip from the location where it was installed
to the ca_install_location/deployment directory.
Tip: By default, the IBM_Cognos_Audit.zip file is installed to the installation_location/samples/Audit_samples directory.
5. Import the audit deployment IBM_Cognos_Audit.zip file.a) Go to Manage > Administration console.b) On the Configuration tab, select Content Administration.c) Follow the import wizard to import IBM_Cognos_Audit.zip. Ensure that the Samples_Audit
folder is selected in one of the steps.After the import, the sample audit reports are available in the Team content > Samples_Audit > Auditfolder.
6. Test the audit reports.a) Check if audit reporting is enabled. To enable audit reporting, the logging level for selected IBM
Cognos services must be set to Basic (auditing enabled) or Request. If the logging level is set toMinimal, auditing is disabled. For more information, see the topic about setting up audit reportingin the IBM Cognos Analytics Administration and Security Guide.
b) Run some of your organization reports or dashboards from Team content. This step is needed tocollect some data that the sample audit reports can use when you run them for the first time.
c) Run the sample audit reports from Team content > Samples_Audit > Audit, and view theircontents.
Sample reports for the dynamic query modeSample models and reports that are optimized for the dynamic query mode are included with IBM CognosAnalytics.
When installed and deployed, you can find the samples in a folder named Samples_DQ. The updatedreports were also renamed with the suffix _DQ.
The samples were modified slightly to benefit from the key improvements of the dynamic query mode. Forexample, reports were updated to apply a specific sorting order and to specify an aggregation mode.
To access the dynamic query mode samples, you must modify the data source connections to two sampledata sources to enable JDBC connections and then import the updated samples deployment archive.
Chapter 4. Using the samples 45
Modify the data source connections to the sample data sourcesTo import and then use the dynamic query sample reports, you must modify the existing data sourceconnections to two sample relational databases to enable a JDBC connection.
Procedure1. In IBM Cognos Administration, click the Configuration tab and click Data Source Connections.
Note: To access this area in IBM Cognos Administration, you must have the required permissions forthe Administration tasks secured feature.
2. Click the great_outdoors_sales sample data source.3. In the Actions columns, click the Set properties icon for the great_outdoors_sales data source
connection.4. On the Connection tab, under Connection string, click the Edit the connection string icon.5. On the JDBC tab, select the Enable JDBC connection check box.6. Specify the JDBC connection parameters for the data source.7. Click Test the connection and click Test.
On the results page of the connection test, notice the JDBC results under the Type / Query Modecolumn.
8. Repeat the previous steps with the great_outdoors_warehouse sample data source connection.
Import the dynamic query samples content (packages) into the content storeAfter you have modified the data source connections to the sample data sources, you must import thedynamic query samples content, or packages from the sample deployment archive.
About this taskThe dynamic query samples are in the deployment archive namedIBM_Cognos_Samples_DQ_Legacy.zip.
For information about importing the deployment archive, see “Import the extended samples” on page 28.
IBM Cognos Analytics - Reporting samplesThe sample reports for IBM Cognos Analytics - Reporting are based on the fictional retail company that isnamed the Sample Outdoors Company, or on uploaded files.
Samples in the Sample Outdoors Sales (cube) packageThe following report is found in the Sample Outdoors Sales (cube) package.
Consecutive Periods ComparisonThis report shows the revenue and gross profit for Camping Equipment and Personal Accessories, as wellas quantity for Camping Equipment, in two consecutive periods selected by the user.
Samples in the Sales and Marketing (Cube) PackageThe following reports are some of the reports found in the Sales and Marketing (Cube) package.
Actual vs. Planned RevenueThis report shows the actual revenue versus planned revenue by order method and year. This report isalso a target for the measure based scope drill-through from other reports in the same package.
This report uses the following features:
46 IBM Cognos Analytics Version 11.1 : Samples Guide
• lists• filters• multiple prompts• grouping• sorting• summarizing
Historical RevenueThis prompted report shows a 13-month rolling forecast of monthly and year-to-date revenue.
This report uses the following features:
• filters• cascading prompts• combination charts• axis titles
Revenue by Date RangeThis report shows revenue for a date range that is specified on a prompt page.
This report uses the following features:
• lists• crosstabs• context filters• custom headers and footers• multiple prompts• calculations
Revenue by Product Brand (2011)This report shows the revenue and gross profit by product filtered by the product brand. There is alwaysproduct turnover, so the report conditionally highlights products that are discontinued.
This report uses the following features:
• lists• filters• prompts• combination charts• bar charts• HTML items• grouping• sorting• axis titles
Same Month Prior YearThis report shows sales volume by product line in one or more months. The report is filtered by a promptfor month. The report generates totals for the selected months and for the same months in the prior year.
This report uses the following features:
• crosstabs
Chapter 4. Using the samples 47
• prompts• custom headers and footers
Selected Retailer Country or RegionThis report uses the revenue from a selected country or region as a baseline value for a set of countries orregions. A chart shows the difference in revenue for each country and region as it compares to the basecountry and region. The report is filtered by a prompt for country and region.
This report uses the following features:
• crosstabs• bar charts• tables to control where objects appear
Top Retailers by Country or RegionThis report shows the top 10 retailers by country or region. It is used as source for drill-through to theTotal Revenue by Country or Region report.
This report uses the following features:
• crosstabs• prompts• filters• line charts• prompt pages• query calculations• calculations• singletons• bar charts• custom headers and footers
Samples in the GO Data Warehouse (analysis) PackageThe following reports are some of the reports found in the GO Data Warehouse (analysis) package.
Sample reports that were created in Reporting are located in the Active Report folder and the ReportingReport Samples folder.
Budget vs. ActualThis report shows three years of data by retailer and retailer site for the camping equipment product line.Each year includes budget and actual data.
This report uses the following features:
• summarizing• crosstabs• context filters
Core products resultsThis active report shows revenue data for the core products Camping Equipment and Golf Equipment.
This list report uses two drop-down list controls to filter data by the following criteria:
• core product
48 IBM Cognos Analytics Version 11.1 : Samples Guide
• country or region
Customer Returns and SatisfactionThis report shows the customer satisfaction survey results for Asia Pacific in 2013. It highlights thecustomers who are the least satisfied. It also provides information about customers with the highestnumber of product returns.
This report uses the following features:
• combination charts• customizing the color and size of a chart• lists• formatting a list• conditional highlighting• filters• custom headers and footers• colors• lineage• text items• grouping• baselines• summarizing• calculations• drilling through
Employee Satisfaction 2012This report shows employee satisfaction survey results by department, compared to targets and industrystandards. It also shows employee rankings and terminations.
This report uses the following features:
• crosstabs• conditional highlighting• combination charts• lineage• text items• calculations
Employee Training by YearThis report shows employee training data for the selected year and quarter(s). A bar chart shows trainingcosts by region and a crosstab shows data for the selected quarter(s).
This report uses the following features:
• context filters• cascading prompts• bar charts• customizing the color of a chart• crosstabs• calculations
Chapter 4. Using the samples 49
Eyewear Revenue by Brand and SizeThis report shows a summary of eyewear revenue by brand and compares two prompted retailer sites.The report is filtered by prompts for region, retailer type, and year.
This report uses the following features:
• prompts• bar charts• lists• conditional styles• calculations• text items• custom headers and footers• combination charts• axis titles• crosstabs• grouping
Global Bonus ReportThis list report shows employees who received more than $2,500 bonus in a year by region. It is groupedby country or region. It also shows how much the sales target was exceeded for each region.
This report uses the following features:
• lists• page sets (page breaks by country or region with different sorting and grouping)• multiple prompts and parameters• calculations• filters• conditional highlighting• hidden objects• lineage
GO Balance Sheet as at Dec 31 2012This is the Balance sheet report for Americas where current year data is compared to the previous yeardata. Analysts can see negative trends under Variance where negative percentages are highlighted.
This report uses the following features:
• conditional highlighting• padding• crosstabs• text items• context filters
Sample Outdoors Company Balance Sheet as at Dec 31 2012This report shows a simple balance sheet with assets, liabilities, and equity for 2012 with a 2011comparative. The IBM Cognos Analytics Getting Started guide provides a step-by-step example of how tocreate this report.
This report uses the following feature:
50 IBM Cognos Analytics Version 11.1 : Samples Guide
• crosstabs
Manager ProfileThis report shows information about managers, including salary, bonuses, and all compensations groupedby year.
This report uses the following features:
• column charts• lists• grouping• summarizing• custom chart palette• prompts
Planned HeadcountThis chart report shows headcount variance compared to the plan for each organization for 2013.
This report uses the following features:
• progressive column charts• templates• hidden objects• custom headers and footers• lists• baselines
Positions to FillThis report shows a list of department names, positions, longest days to fill the positions, and ranking.The report uses a prompt for the year and is a drill-through target for the Recruitment report.
This report uses the following features:
• combination charts• lists• prompts• baselines
Promotion Plan RevenueThis report shows the planned revenue for all the promotions of a selected campaign. It is a drill-throughtarget for the Top 10 Promotions by Retailer report that is based on the Sales and Marketing (cube)package.
This report uses the following features:
• prompts• bar charts• crosstabs• axis titles
Chapter 4. Using the samples 51
Promotion SuccessThis report shows the financial results of the company's promotions. It shows how much of thecompany's total revenue is attributable to each promotional campaign.
This report uses the following features:
• prompt pages• HTML items• summarizing• axis titles• bar charts• lists• grouping
Quantity Sold vs. Shipped and InventoryThis report compares the quantity of goods sold and shipped with the opening and closing inventorylevels.
This report uses the following features:
• filters• combination charts• defined y-axes• custom headers and footers
Recruitment ReportThis report shows a variety of recruitment techniques for certain positions or organizations.
This report uses the following features:
• drilling through• crosstabs• prompt pages• colors• floating object adjustment• custom headers and footers
Return Quantity by Order MethodThis report shows quantity sold, number of returns, and percentage of returns (with those greater than5% highlighted) by return reason for each product in the Outdoor Protection product line.
This report uses the following features:
• filters• lists• conditional highlighting• grouping
Returned ItemsThis report shows the number of returned items by return reason and retailer type. A column chart showsreturned items by product line and region for the selected date range.
This report uses the following features:
52 IBM Cognos Analytics Version 11.1 : Samples Guide
• date and time prompts• crosstabs• bar charts• drilling down• text items• sorting
Returns by Damage, Failed Orders and Complaints in 2012This report shows quality measures based on product returns.
This report uses the following features:
• pie charts• crosstabs• indented text• singletons• calculations• drilling through• text items• custom headers and footers
Returns by Failed Orders in 2012This report shows quality measures based on product returns and focuses on failed orders.
This report uses the following features:
• pie charts• crosstabs• indented text• singletons• drilling through• calculations, including the tuple function
Returns by Order MethodThis report shows product returns and reasons filtered on the order method. The Getting Started guideprovides a step-by-step example of how to create this report.
This report uses the following features:
• bar charts• prompts• crosstabs• filters• custom headers and footers
Returns by Order Method - Prompted ChartThis prompted chart report shows product returns and reasons filtered on a prompted order method.
This report uses the following features:
• bar charts
Chapter 4. Using the samples 53
• prompts• crosstabs• filters• custom headers and footers
Revenue by GO Subsidiary 2011This prompted chart report shows 2011 quarterly revenues for each GO subsidiary.
This report uses the following features:
• templates• colors• prompts• hyperlinks• customizing charts• singletons• bar charts• drilling through• layout calculations• pie charts• calculations• combination charts• text items• blocks• sorting
Sales Commissions for Central EuropeThis report shows an annual summary of sales commissions, revenues, and gross profit for each branch inCentral Europe. It also compares actual commission expenses with planned commission expenses.
This report uses the following features:
• prompts• calculations• bar charts• lists• conditional highlighting• drilling through• custom headers and footers• axis titles
Sales Growth Year Over YearThis report shows annual sales growth in both percentage and dollar amounts.
This report uses the following features:
• bar charts• lists• filters
54 IBM Cognos Analytics Version 11.1 : Samples Guide
• sorting• baselines• axis titles
Sales target by regionThis active report shows sales target by region, including the percentage differences between plannedand actual revenue.
Succession ReportThis report shows the succession data by department and status for percent ready in a column chart. Italso contains a detailed crosstab for the managers associated with the possible successors.
This report uses the following features:
• drilling through to the Manager Profile report• filters• lists• grouping
Top 10 Retailers for 2011This report shows the top 10 retailers for 2011 by revenue and sales target.
This report uses the following features:
• bar charts• lists• filters• multiple queries• combination charts• line charts• notes• axis titles• text items• custom headers and footers
Samples in the GO Data Warehouse (query) PackageThe following reports are some of the reports found in the GO Data Warehouse (query) package.
Sample reports that were created in Reporting are located in the Active Report folder and the ReportingReport Samples folder.
Advertising-cost vs revenueThis active report shows the advertising cost vs revenue by year. Tab controls are used for groupingsimilar report items.
Bursted Sales Performance ReportThis list report shows how to burst a product sales report to a sales manager for Northern Europe salesstaff. To successfully burst this report, IBM Cognos Analytics must be configured to use an email server.
This report uses the following features:
• lists
Chapter 4. Using the samples 55
• bursting• conditional highlighting• filters• calculations• summarizing• blocks• custom headers and footers• sorting• grouping
Revenue (by product)This active report shows the revenue by selected product. The sample report is developed for use on amobile phone device.
Employee Expenses (report)This report is used as a data source for the Employee Expenses Power Cube.
This report uses the following feature:
• lists
Health InsuranceThis report is used as a data source for the Employee Expenses Power Cube.
This report uses the following features:
• lists• filters
Pension PlanThis report is used as a data source for the Employee Expenses Power Cube.
This report uses the following features:
• lists• filters
Regular SalaryThis report is used as a data source for the Employee Expenses Power Cube.
This report uses the following features:
• lists• filters
TOC ReportThis report takes advantage of the bookmark object to allow a user to navigate through this report easily.This report should be run in PDF or saved HTML format. The report contents show a product order tableand an expected volume fact table.
This report uses the following features:
• lists• bookmarks
56 IBM Cognos Analytics Version 11.1 : Samples Guide
• background color• multiple pages• grouping
Total Revenue by Country or RegionThis report summarizes revenue for Retailer Country or Region and Product Line. It is also a drill-throughtarget for the Top Retailers by Country or Region and Revenue by Order Method reports.
This report uses the following features:
• crosstabs• combination charts• summarizing• tables to control where objects appear
Samples in the GO Sales (analysis) PackageThe following reports are some of the reports found in the GO Sales (analysis) package.
2011 Quarterly Sales ForecastThis report shows the sales forecast by product line and region for each quarter in 2011.
This report uses the following features:
• lists• summarizing• grouping• sorting
2011 Sales SummaryThis report summarizes revenue and gross profit for 2011 and shows the best sales representatives byrevenue and quantity sold.
This report uses the following features:
• lists• filters• combination charts• axis titles• custom headers and footers• conditions
Samples in the GO Sales (query) PackageThe following reports are some of the reports found in the GO Sales (query) package.
Sample reports that were created in Reporting are located in the Active Report folder and the ReportingReport Samples folder.
Chapter 4. Using the samples 57
Active Report TechniquesThis report demonstrates common active report and dashboard features and functionality.
Briefing BookThis report shows a Briefing Book style of report.
This report uses the following features:
• multiple pages• crosstabs• multiple queries• filters• pie charts• singletons• tables of contents• bookmarks• PDF options• horizontal pagination• sorting• custom headers and footers• text items
Film stripThis active report shows detailed sales facts in different charts. Deck controls are used for navigation.
Horizontal PaginationThis report shows crosstabs rendered across several horizontal pages. The first crosstab shows the fit-to-page behavior while the second crosstab shows the horizontal pagination.
This report uses the following features:
• multiple pages• horizontal pagination• crosstabs• custom headers and footers
Matrix-chart and graphThis active report shows a summary of sales facts for each province or state in the Americas. Clicking acategory in the map displays the data in a list.
Order Invoices - Donald Chow, Sales PersonThis report generates invoices for all the sales by Donald Chow.
This report uses the following features:
• lists• adding list row cells• calculations• formatting tables• calculations
58 IBM Cognos Analytics Version 11.1 : Samples Guide
• filters• grouping• tables to control where objects appear
No DataEach page of this report presents a different option for dealing with a No Data condition. It also generatesinvoices of sales for the Order Invoices - Donald Chow, Sales Person report in the GO Sales (query)package.
This report uses the following features:
• crosstabs• custom headers and footers• no data• lists
PDF Page PropertiesThe two pages of this report appear with different Page Orientation (portrait and landscape) when thereport is run in PDF format.
This report uses the following features:
• crosstabs• lists• page orientation• PDF options• custom headers and footers
Product detailsThis active report shows attributes as color, size, and description for products.
Sales analysisThis active report shows interactions with charts. Clicking a pie series in a chart filters the product lineselected.
Sales DashboardThis active report focuses on sales details by region and product brand. Describes the best performersand the best performance by region.
Singletons on Page BodyThis report uses singleton results to display information with no data relationship in the same layoutcontext.
This report uses the following features:
• singletons• tables• custom headers and footers
Chapter 4. Using the samples 59
Table of ContentsThis report shows two Tables of Contents: one for the main pages and another for the appendices.
This report uses the following features:
• crosstabs• pie charts• bookmarks• tables• tables of contents• custom headers and footers• hyperlinks
60 IBM Cognos Analytics Version 11.1 : Samples Guide
Prompt API samplesThe following reports are some of the reports found in the Samples_Prompt_API folder.
Clear prompt selectionsThis report demonstrates using the prompt API to clear selections from all prompts.
Date prompt presetsThis report uses the prompt API to provide the user with a set of prompt selection presets based ontoday's date.
Display all prompt values ignoring user selectionsThis report uses the prompt API to display all the values in the prompt, whether they are selected or not.
Display user selected prompt valuesThis report uses the prompt API to display the prompt values selected by the user.
Filter country by letterThis report uses a custom prompt control to provide parameters to filter the report.
Limit date prompt selection by database valueThis report demonstrates limiting the selection of a date to a value less than or equal to a latest datevalue in a query item.
Limit numeric prompt selection by database valueThis report demonstrates limiting the selection of a value less than or equal to a largest value in a queryitem.
Limit time between two datesThis report demonstrates preventing the user from selecting a date range greater than 10 days.
Limit user selection to two itemsThis report shows how to validate prompt values to stop the user from selecting more than two items.
Pass parameter via hidden promptThis report demonstrates setting the value of a hidden prompt.
Personal default prompt selections - set selectionsThis report allows the user to save a set of default prompt selections for use in subsequent reports. Theprompt selections are saved to browser cookies for reuse in other reports.
Personal default prompt selections - use selectionsThis report shows how to use the personal default prompt selections.
Validate prompt values when button pushedThis sample shows how to validate prompt values when a prompt button is clicked.
Chapter 4. Using the samples 61
Validate type-in postal code valuesThe report uses the prompt API to validate user input character by character as the user types to ensurethat a valid postal code is entered.
Validate type-in product line codeThe report uses the prompt API to validate user input as the user types.
Cognos Workspace samplesThe samples installation includes several IBM Cognos Workspace samples.
Samples in the GO Data Warehouse (analysis) packageThe following IBM Cognos Workspace report is found in the GO Data Warehouse (analysis) package.
Employee Satisfaction WorkspaceThis report shows different measures for employee satisfaction, such as investment in training, employeesurvey results (by department and by topic, including a comparison with the planned survey results), anda list of bonuses for employees, sorted by country or region. The slider filter applies to the bonus list.
Samples in the GO Data Warehouse (query) packageThe following workspaces are found in the GO Data Warehouse (query) package.
Marketing workspaceThis workspace shows the results of different promotional campaigns.
The select value filter for campaign name applies to the first two charts. The product line select valuefilter applies to the advertising cost chart, and the year slider filter applies to the advertising costcrosstab.
Recruitment workspaceThis workspace shows the recruitment results (average number of days to fill positions) for differentindicators: by organization, department, branch, and year, and detailed information about the success ofdifferent recruiting techniques.
Two select value filters control three of the widgets.
Revenue data workspaceThis workspace shows the revenue by location, product type, and order method.
The location and product type are controlled by a select value filter.
Sales By Year workspaceThis workspace shows different sales indicators for a year range controlled by the slider filter: profitmargin, gross profit, product cost, quantity sold, revenue by region, and a comparison between actual andplanned revenue.
The slider filter controls all widgets.
62 IBM Cognos Analytics Version 11.1 : Samples Guide
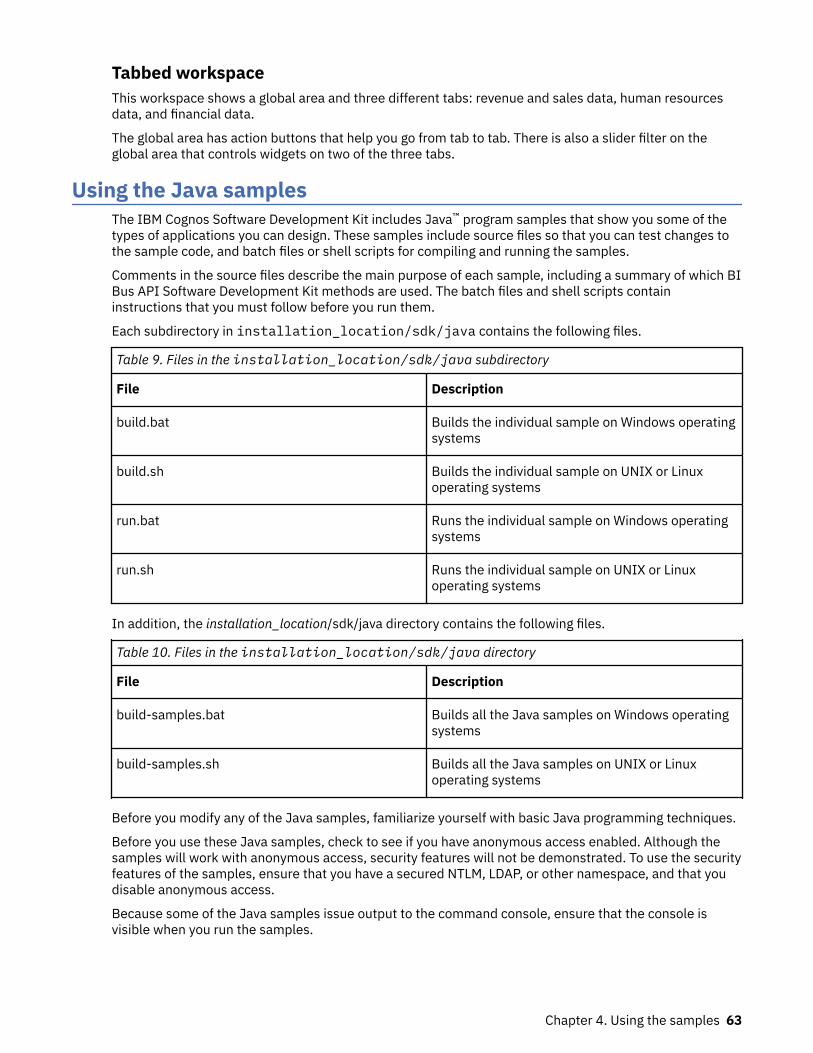
Tabbed workspaceThis workspace shows a global area and three different tabs: revenue and sales data, human resourcesdata, and financial data.
The global area has action buttons that help you go from tab to tab. There is also a slider filter on theglobal area that controls widgets on two of the three tabs.
Using the Java samplesThe IBM Cognos Software Development Kit includes Java™ program samples that show you some of thetypes of applications you can design. These samples include source files so that you can test changes tothe sample code, and batch files or shell scripts for compiling and running the samples.
Comments in the source files describe the main purpose of each sample, including a summary of which BIBus API Software Development Kit methods are used. The batch files and shell scripts containinstructions that you must follow before you run them.
Each subdirectory in installation_location/sdk/java contains the following files.
Table 9. Files in the installation_location/sdk/java subdirectory
File Description
build.bat Builds the individual sample on Windows operatingsystems
build.sh Builds the individual sample on UNIX or Linuxoperating systems
run.bat Runs the individual sample on Windows operatingsystems
run.sh Runs the individual sample on UNIX or Linuxoperating systems
In addition, the installation_location/sdk/java directory contains the following files.
Table 10. Files in the installation_location/sdk/java directory
File Description
build-samples.bat Builds all the Java samples on Windows operatingsystems
build-samples.sh Builds all the Java samples on UNIX or Linuxoperating systems
Before you modify any of the Java samples, familiarize yourself with basic Java programming techniques.
Before you use these Java samples, check to see if you have anonymous access enabled. Although thesamples will work with anonymous access, security features will not be demonstrated. To use the securityfeatures of the samples, ensure that you have a secured NTLM, LDAP, or other namespace, and that youdisable anonymous access.
Because some of the Java samples issue output to the command console, ensure that the console isvisible when you run the samples.
Chapter 4. Using the samples 63
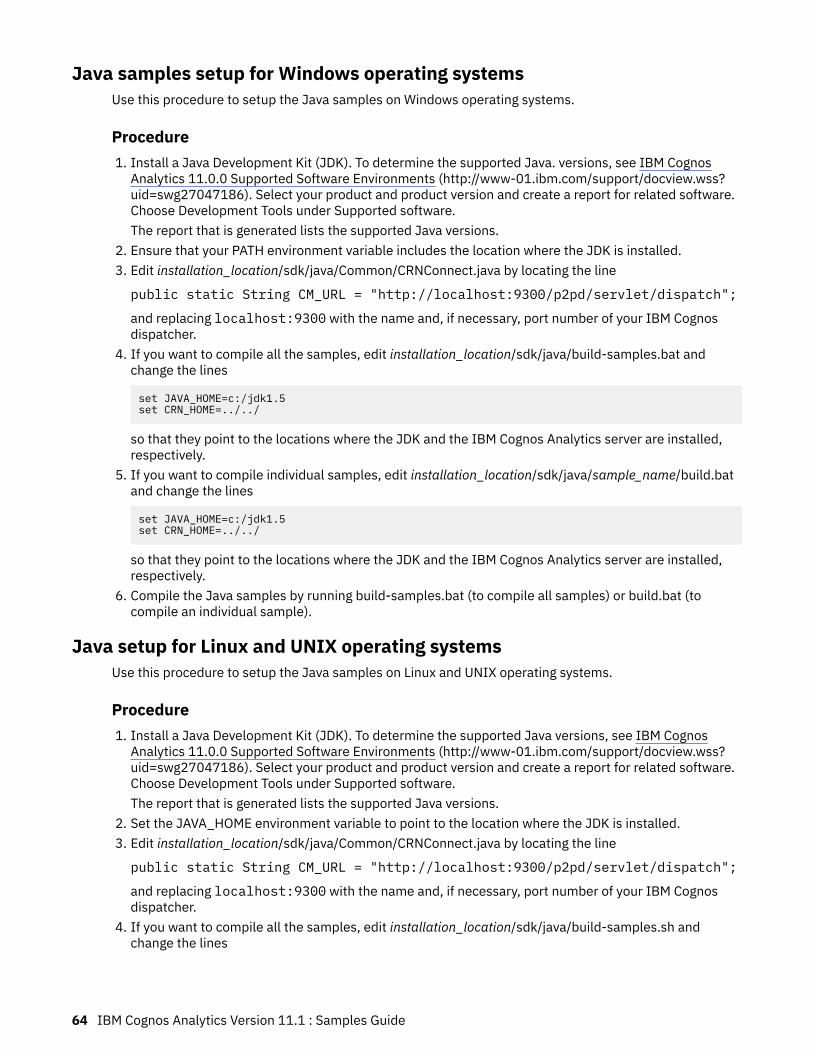
Java samples setup for Windows operating systemsUse this procedure to setup the Java samples on Windows operating systems.
Procedure1. Install a Java Development Kit (JDK). To determine the supported Java. versions, see IBM Cognos
Analytics 11.0.0 Supported Software Environments (http://www-01.ibm.com/support/docview.wss?uid=swg27047186). Select your product and product version and create a report for related software.Choose Development Tools under Supported software.The report that is generated lists the supported Java versions.
2. Ensure that your PATH environment variable includes the location where the JDK is installed.3. Edit installation_location/sdk/java/Common/CRNConnect.java by locating the line
public static String CM_URL = "http://localhost:9300/p2pd/servlet/dispatch";
and replacing localhost:9300 with the name and, if necessary, port number of your IBM Cognosdispatcher.
4. If you want to compile all the samples, edit installation_location/sdk/java/build-samples.bat andchange the lines
set JAVA_HOME=c:/jdk1.5set CRN_HOME=../../
so that they point to the locations where the JDK and the IBM Cognos Analytics server are installed,respectively.
5. If you want to compile individual samples, edit installation_location/sdk/java/sample_name/build.batand change the lines
set JAVA_HOME=c:/jdk1.5set CRN_HOME=../../
so that they point to the locations where the JDK and the IBM Cognos Analytics server are installed,respectively.
6. Compile the Java samples by running build-samples.bat (to compile all samples) or build.bat (tocompile an individual sample).
Java setup for Linux and UNIX operating systemsUse this procedure to setup the Java samples on Linux and UNIX operating systems.
Procedure1. Install a Java Development Kit (JDK). To determine the supported Java versions, see IBM Cognos
Analytics 11.0.0 Supported Software Environments (http://www-01.ibm.com/support/docview.wss?uid=swg27047186). Select your product and product version and create a report for related software.Choose Development Tools under Supported software.The report that is generated lists the supported Java versions.
2. Set the JAVA_HOME environment variable to point to the location where the JDK is installed.3. Edit installation_location/sdk/java/Common/CRNConnect.java by locating the line
public static String CM_URL = "http://localhost:9300/p2pd/servlet/dispatch";
and replacing localhost:9300 with the name and, if necessary, port number of your IBM Cognosdispatcher.
4. If you want to compile all the samples, edit installation_location/sdk/java/build-samples.sh andchange the lines
64 IBM Cognos Analytics Version 11.1 : Samples Guide
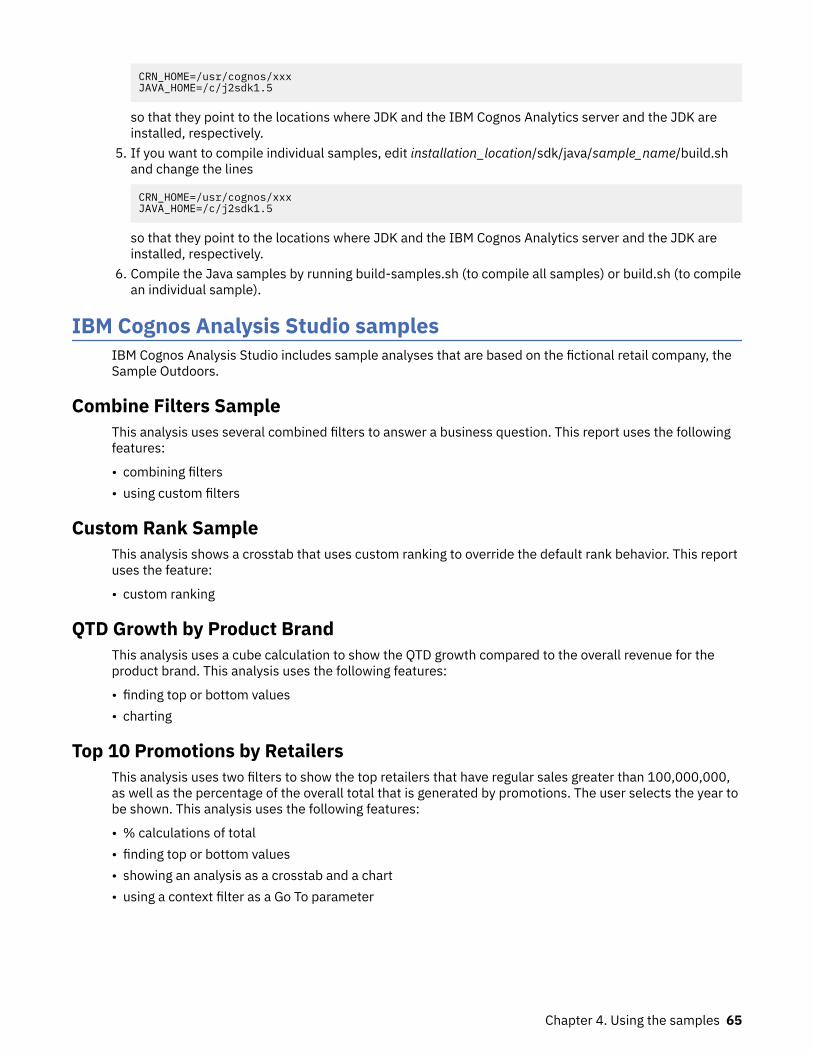
CRN_HOME=/usr/cognos/xxxJAVA_HOME=/c/j2sdk1.5
so that they point to the locations where JDK and the IBM Cognos Analytics server and the JDK areinstalled, respectively.
5. If you want to compile individual samples, edit installation_location/sdk/java/sample_name/build.shand change the lines
CRN_HOME=/usr/cognos/xxxJAVA_HOME=/c/j2sdk1.5
so that they point to the locations where JDK and the IBM Cognos Analytics server and the JDK areinstalled, respectively.
6. Compile the Java samples by running build-samples.sh (to compile all samples) or build.sh (to compilean individual sample).
IBM Cognos Analysis Studio samplesIBM Cognos Analysis Studio includes sample analyses that are based on the fictional retail company, theSample Outdoors.
Combine Filters SampleThis analysis uses several combined filters to answer a business question. This report uses the followingfeatures:
• combining filters• using custom filters
Custom Rank SampleThis analysis shows a crosstab that uses custom ranking to override the default rank behavior. This reportuses the feature:
• custom ranking
QTD Growth by Product BrandThis analysis uses a cube calculation to show the QTD growth compared to the overall revenue for theproduct brand. This analysis uses the following features:
• finding top or bottom values• charting
Top 10 Promotions by RetailersThis analysis uses two filters to show the top retailers that have regular sales greater than 100,000,000,as well as the percentage of the overall total that is generated by promotions. The user selects the year tobe shown. This analysis uses the following features:
• % calculations of total• finding top or bottom values• showing an analysis as a crosstab and a chart• using a context filter as a Go To parameter
Chapter 4. Using the samples 65
Difference between Actual and Planned RevenueThis analysis uses a crosstab to show the difference between Actual and Planned Revenue for the topthree camping equipment products. This analysis uses the following features:
• finding top or bottom values• showing an analysis as a crosstab and a chart• difference calculations
Revenue vs per cent Gross Profit by Product BrandThis analysis uses the Sales and Marketing (cube) package to show the revenue and percentage of grossprofit by product brand. This analysis uses the following features:
• charting• per cent calculation
IBM Cognos Query Studio samplesIBM Cognos Query Studio includes sample reports that are based on the fictional retail company, theSample Outdoors.
Samples in the Go Data Warehouse (analysis) PackageThe following reports are some of the reports found in the GO Data Warehouse (analysis) package.
Return Quantity by Product LineThis crosstab report shows return quantities of product lines for all subsidiaries.
Return Quantity by Product Line ChartThis pie chart report shows return quantities of product lines for all subsidiaries.
Returns by Product TypeThis report shows product type return quantities and lost revenue as a result of returns for allsubsidiaries.
Sample in the Go Sales (query) PackageThe following report is found in the GO Sales (query) package.
Gross Profit for Bella Eyewear BrandThis report shows the gross profit for the Bella eyewear brand. It uses a text filter to retrieve the brand,and a concatenation to get the unique combination of product name and color.
66 IBM Cognos Analytics Version 11.1 : Samples Guide
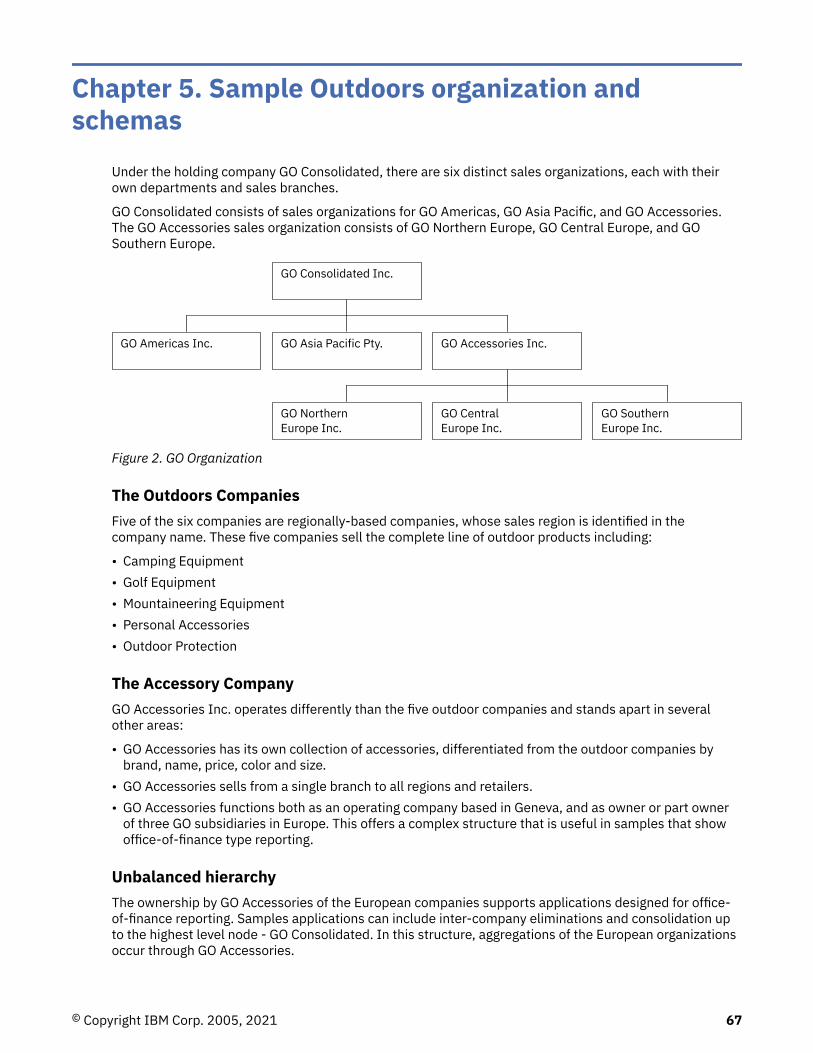
Chapter 5. Sample Outdoors organization andschemas
Under the holding company GO Consolidated, there are six distinct sales organizations, each with theirown departments and sales branches.
GO Consolidated consists of sales organizations for GO Americas, GO Asia Pacific, and GO Accessories.The GO Accessories sales organization consists of GO Northern Europe, GO Central Europe, and GOSouthern Europe.
GO Consolidated Inc.
GO Americas Inc. GO Asia Pacific Pty. GO Accessories Inc.
GO NorthernEurope Inc.
GO CentralEurope Inc.
GO SouthernEurope Inc.
Figure 2. GO Organization
The Outdoors CompaniesFive of the six companies are regionally-based companies, whose sales region is identified in thecompany name. These five companies sell the complete line of outdoor products including:
• Camping Equipment• Golf Equipment• Mountaineering Equipment• Personal Accessories• Outdoor Protection
The Accessory CompanyGO Accessories Inc. operates differently than the five outdoor companies and stands apart in severalother areas:
• GO Accessories has its own collection of accessories, differentiated from the outdoor companies bybrand, name, price, color and size.
• GO Accessories sells from a single branch to all regions and retailers.• GO Accessories functions both as an operating company based in Geneva, and as owner or part owner
of three GO subsidiaries in Europe. This offers a complex structure that is useful in samples that showoffice-of-finance type reporting.
Unbalanced hierarchyThe ownership by GO Accessories of the European companies supports applications designed for office-of-finance reporting. Samples applications can include inter-company eliminations and consolidation upto the highest level node - GO Consolidated. In this structure, aggregations of the European organizationsoccur through GO Accessories.
© Copyright IBM Corp. 2005, 2021 67
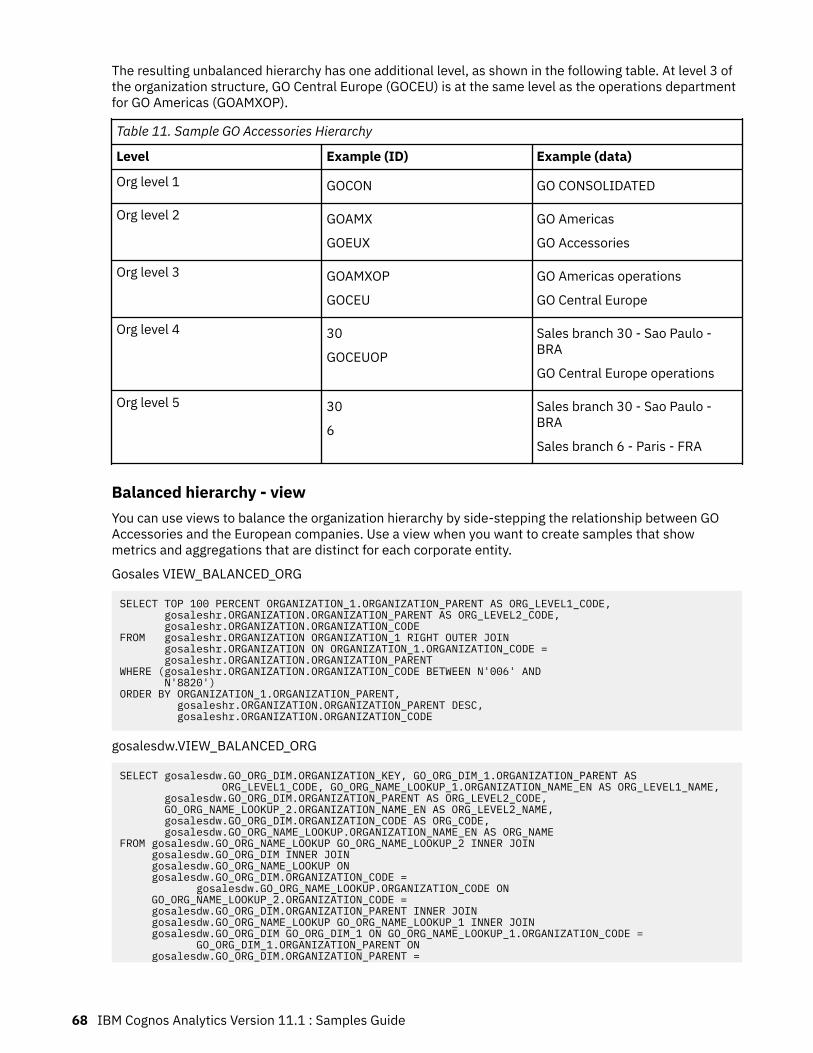
The resulting unbalanced hierarchy has one additional level, as shown in the following table. At level 3 ofthe organization structure, GO Central Europe (GOCEU) is at the same level as the operations departmentfor GO Americas (GOAMXOP).
Table 11. Sample GO Accessories Hierarchy
Level Example (ID) Example (data)
Org level 1 GOCON GO CONSOLIDATED
Org level 2 GOAMX
GOEUX
GO Americas
GO Accessories
Org level 3 GOAMXOP
GOCEU
GO Americas operations
GO Central Europe
Org level 4 30
GOCEUOP
Sales branch 30 - Sao Paulo -BRA
GO Central Europe operations
Org level 5 30
6
Sales branch 30 - Sao Paulo -BRA
Sales branch 6 - Paris - FRA
Balanced hierarchy - viewYou can use views to balance the organization hierarchy by side-stepping the relationship between GOAccessories and the European companies. Use a view when you want to create samples that showmetrics and aggregations that are distinct for each corporate entity.
Gosales VIEW_BALANCED_ORG
SELECT TOP 100 PERCENT ORGANIZATION_1.ORGANIZATION_PARENT AS ORG_LEVEL1_CODE, gosaleshr.ORGANIZATION.ORGANIZATION_PARENT AS ORG_LEVEL2_CODE, gosaleshr.ORGANIZATION.ORGANIZATION_CODEFROM gosaleshr.ORGANIZATION ORGANIZATION_1 RIGHT OUTER JOIN gosaleshr.ORGANIZATION ON ORGANIZATION_1.ORGANIZATION_CODE = gosaleshr.ORGANIZATION.ORGANIZATION_PARENTWHERE (gosaleshr.ORGANIZATION.ORGANIZATION_CODE BETWEEN N'006' AND N'8820')ORDER BY ORGANIZATION_1.ORGANIZATION_PARENT, gosaleshr.ORGANIZATION.ORGANIZATION_PARENT DESC, gosaleshr.ORGANIZATION.ORGANIZATION_CODE
gosalesdw.VIEW_BALANCED_ORG
SELECT gosalesdw.GO_ORG_DIM.ORGANIZATION_KEY, GO_ORG_DIM_1.ORGANIZATION_PARENT AS ORG_LEVEL1_CODE, GO_ORG_NAME_LOOKUP_1.ORGANIZATION_NAME_EN AS ORG_LEVEL1_NAME, gosalesdw.GO_ORG_DIM.ORGANIZATION_PARENT AS ORG_LEVEL2_CODE, GO_ORG_NAME_LOOKUP_2.ORGANIZATION_NAME_EN AS ORG_LEVEL2_NAME, gosalesdw.GO_ORG_DIM.ORGANIZATION_CODE AS ORG_CODE, gosalesdw.GO_ORG_NAME_LOOKUP.ORGANIZATION_NAME_EN AS ORG_NAMEFROM gosalesdw.GO_ORG_NAME_LOOKUP GO_ORG_NAME_LOOKUP_2 INNER JOIN gosalesdw.GO_ORG_DIM INNER JOIN gosalesdw.GO_ORG_NAME_LOOKUP ON gosalesdw.GO_ORG_DIM.ORGANIZATION_CODE = gosalesdw.GO_ORG_NAME_LOOKUP.ORGANIZATION_CODE ON GO_ORG_NAME_LOOKUP_2.ORGANIZATION_CODE = gosalesdw.GO_ORG_DIM.ORGANIZATION_PARENT INNER JOIN gosalesdw.GO_ORG_NAME_LOOKUP GO_ORG_NAME_LOOKUP_1 INNER JOIN gosalesdw.GO_ORG_DIM GO_ORG_DIM_1 ON GO_ORG_NAME_LOOKUP_1.ORGANIZATION_CODE = GO_ORG_DIM_1.ORGANIZATION_PARENT ON gosalesdw.GO_ORG_DIM.ORGANIZATION_PARENT =
68 IBM Cognos Analytics Version 11.1 : Samples Guide
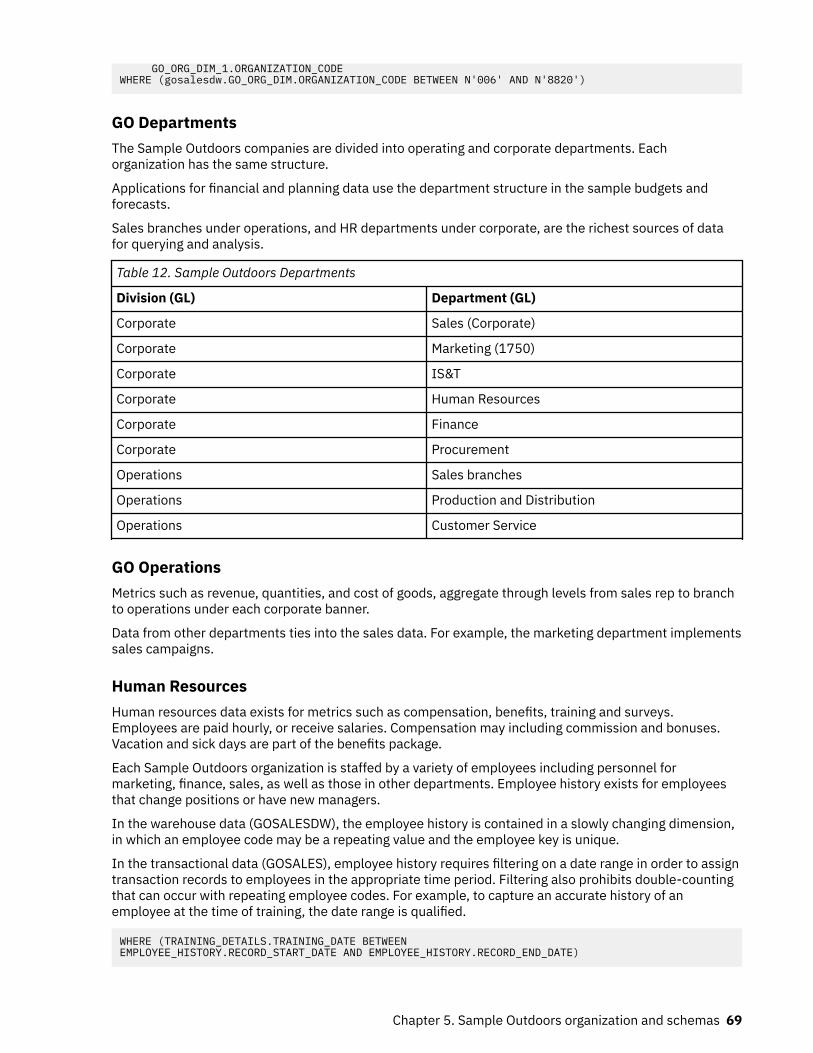
GO_ORG_DIM_1.ORGANIZATION_CODEWHERE (gosalesdw.GO_ORG_DIM.ORGANIZATION_CODE BETWEEN N'006' AND N'8820')
GO DepartmentsThe Sample Outdoors companies are divided into operating and corporate departments. Eachorganization has the same structure.
Applications for financial and planning data use the department structure in the sample budgets andforecasts.
Sales branches under operations, and HR departments under corporate, are the richest sources of datafor querying and analysis.
Table 12. Sample Outdoors Departments
Division (GL) Department (GL)
Corporate Sales (Corporate)
Corporate Marketing (1750)
Corporate IS&T
Corporate Human Resources
Corporate Finance
Corporate Procurement
Operations Sales branches
Operations Production and Distribution
Operations Customer Service
GO OperationsMetrics such as revenue, quantities, and cost of goods, aggregate through levels from sales rep to branchto operations under each corporate banner.
Data from other departments ties into the sales data. For example, the marketing department implementssales campaigns.
Human ResourcesHuman resources data exists for metrics such as compensation, benefits, training and surveys.Employees are paid hourly, or receive salaries. Compensation may including commission and bonuses.Vacation and sick days are part of the benefits package.
Each Sample Outdoors organization is staffed by a variety of employees including personnel formarketing, finance, sales, as well as those in other departments. Employee history exists for employeesthat change positions or have new managers.
In the warehouse data (GOSALESDW), the employee history is contained in a slowly changing dimension,in which an employee code may be a repeating value and the employee key is unique.
In the transactional data (GOSALES), employee history requires filtering on a date range in order to assigntransaction records to employees in the appropriate time period. Filtering also prohibits double-countingthat can occur with repeating employee codes. For example, to capture an accurate history of anemployee at the time of training, the date range is qualified.
WHERE (TRAINING_DETAILS.TRAINING_DATE BETWEENEMPLOYEE_HISTORY.RECORD_START_DATE AND EMPLOYEE_HISTORY.RECORD_END_DATE)
Chapter 5. Sample Outdoors organization and schemas 69
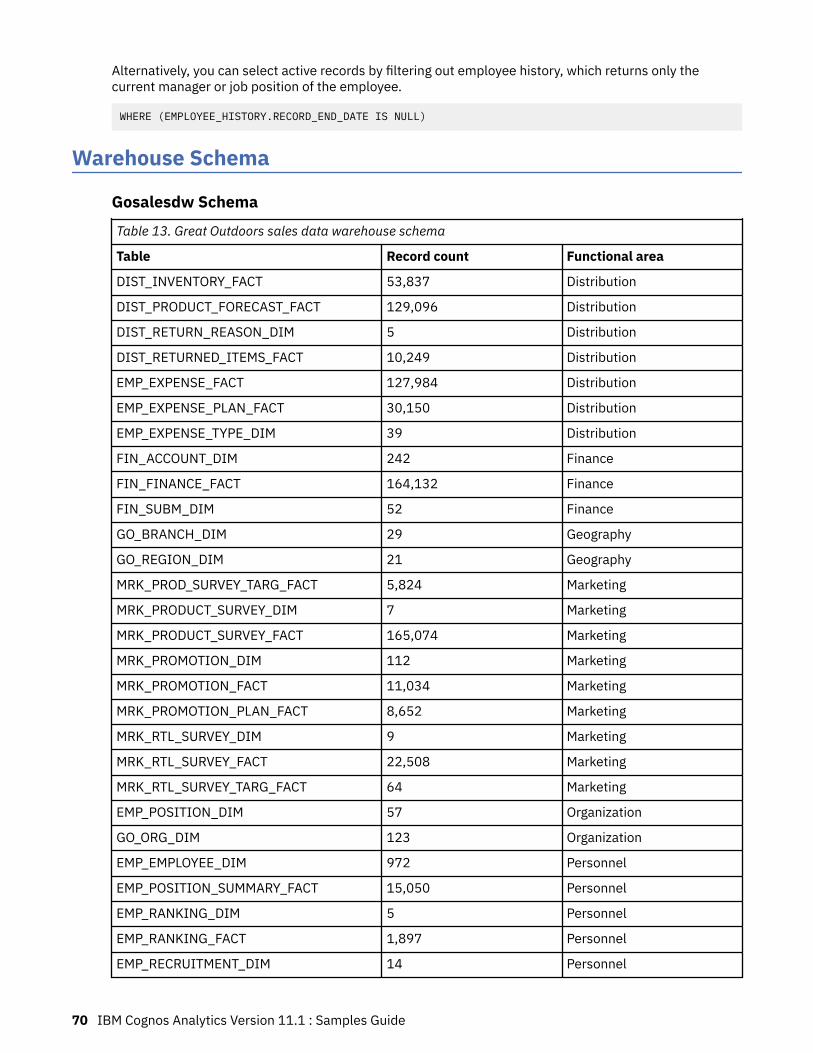
Alternatively, you can select active records by filtering out employee history, which returns only thecurrent manager or job position of the employee.
WHERE (EMPLOYEE_HISTORY.RECORD_END_DATE IS NULL)
Warehouse Schema
Gosalesdw SchemaTable 13. Great Outdoors sales data warehouse schema
Table Record count Functional area
DIST_INVENTORY_FACT 53,837 Distribution
DIST_PRODUCT_FORECAST_FACT 129,096 Distribution
DIST_RETURN_REASON_DIM 5 Distribution
DIST_RETURNED_ITEMS_FACT 10,249 Distribution
EMP_EXPENSE_FACT 127,984 Distribution
EMP_EXPENSE_PLAN_FACT 30,150 Distribution
EMP_EXPENSE_TYPE_DIM 39 Distribution
FIN_ACCOUNT_DIM 242 Finance
FIN_FINANCE_FACT 164,132 Finance
FIN_SUBM_DIM 52 Finance
GO_BRANCH_DIM 29 Geography
GO_REGION_DIM 21 Geography
MRK_PROD_SURVEY_TARG_FACT 5,824 Marketing
MRK_PRODUCT_SURVEY_DIM 7 Marketing
MRK_PRODUCT_SURVEY_FACT 165,074 Marketing
MRK_PROMOTION_DIM 112 Marketing
MRK_PROMOTION_FACT 11,034 Marketing
MRK_PROMOTION_PLAN_FACT 8,652 Marketing
MRK_RTL_SURVEY_DIM 9 Marketing
MRK_RTL_SURVEY_FACT 22,508 Marketing
MRK_RTL_SURVEY_TARG_FACT 64 Marketing
EMP_POSITION_DIM 57 Organization
GO_ORG_DIM 123 Organization
EMP_EMPLOYEE_DIM 972 Personnel
EMP_POSITION_SUMMARY_FACT 15,050 Personnel
EMP_RANKING_DIM 5 Personnel
EMP_RANKING_FACT 1,897 Personnel
EMP_RECRUITMENT_DIM 14 Personnel
70 IBM Cognos Analytics Version 11.1 : Samples Guide
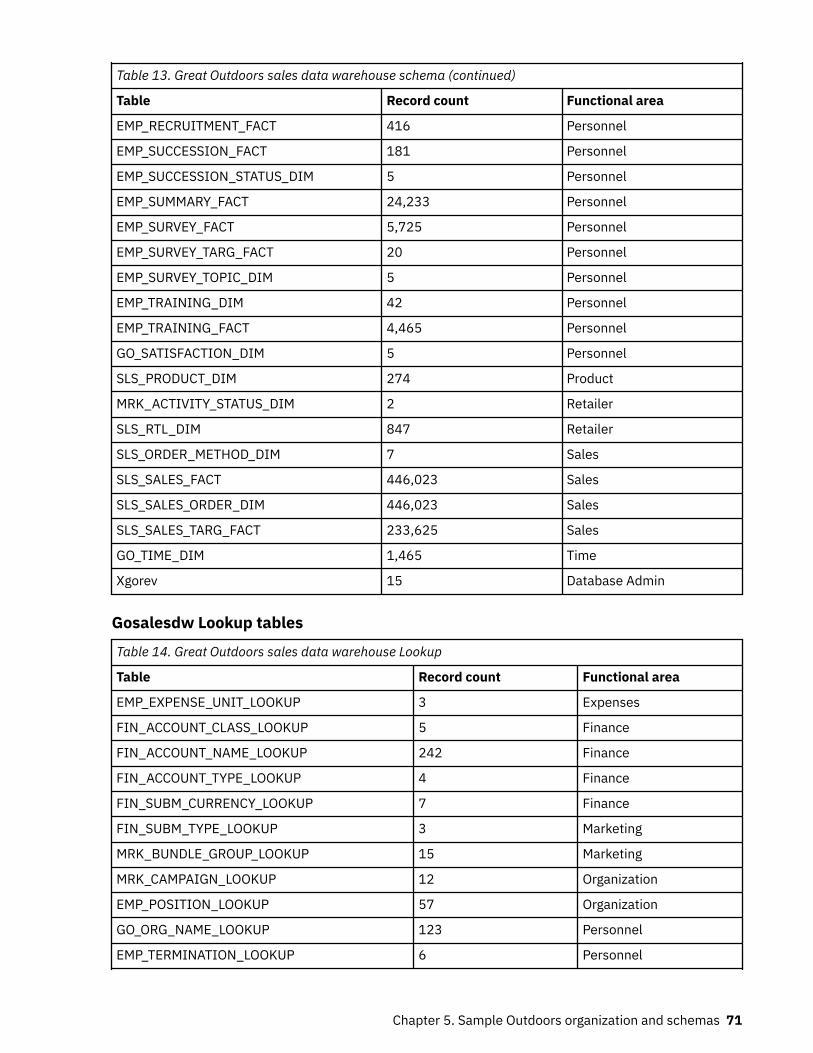
Table 13. Great Outdoors sales data warehouse schema (continued)
Table Record count Functional area
EMP_RECRUITMENT_FACT 416 Personnel
EMP_SUCCESSION_FACT 181 Personnel
EMP_SUCCESSION_STATUS_DIM 5 Personnel
EMP_SUMMARY_FACT 24,233 Personnel
EMP_SURVEY_FACT 5,725 Personnel
EMP_SURVEY_TARG_FACT 20 Personnel
EMP_SURVEY_TOPIC_DIM 5 Personnel
EMP_TRAINING_DIM 42 Personnel
EMP_TRAINING_FACT 4,465 Personnel
GO_SATISFACTION_DIM 5 Personnel
SLS_PRODUCT_DIM 274 Product
MRK_ACTIVITY_STATUS_DIM 2 Retailer
SLS_RTL_DIM 847 Retailer
SLS_ORDER_METHOD_DIM 7 Sales
SLS_SALES_FACT 446,023 Sales
SLS_SALES_ORDER_DIM 446,023 Sales
SLS_SALES_TARG_FACT 233,625 Sales
GO_TIME_DIM 1,465 Time
Xgorev 15 Database Admin
Gosalesdw Lookup tablesTable 14. Great Outdoors sales data warehouse Lookup
Table Record count Functional area
EMP_EXPENSE_UNIT_LOOKUP 3 Expenses
FIN_ACCOUNT_CLASS_LOOKUP 5 Finance
FIN_ACCOUNT_NAME_LOOKUP 242 Finance
FIN_ACCOUNT_TYPE_LOOKUP 4 Finance
FIN_SUBM_CURRENCY_LOOKUP 7 Finance
FIN_SUBM_TYPE_LOOKUP 3 Marketing
MRK_BUNDLE_GROUP_LOOKUP 15 Marketing
MRK_CAMPAIGN_LOOKUP 12 Organization
EMP_POSITION_LOOKUP 57 Organization
GO_ORG_NAME_LOOKUP 123 Personnel
EMP_TERMINATION_LOOKUP 6 Personnel
Chapter 5. Sample Outdoors organization and schemas 71
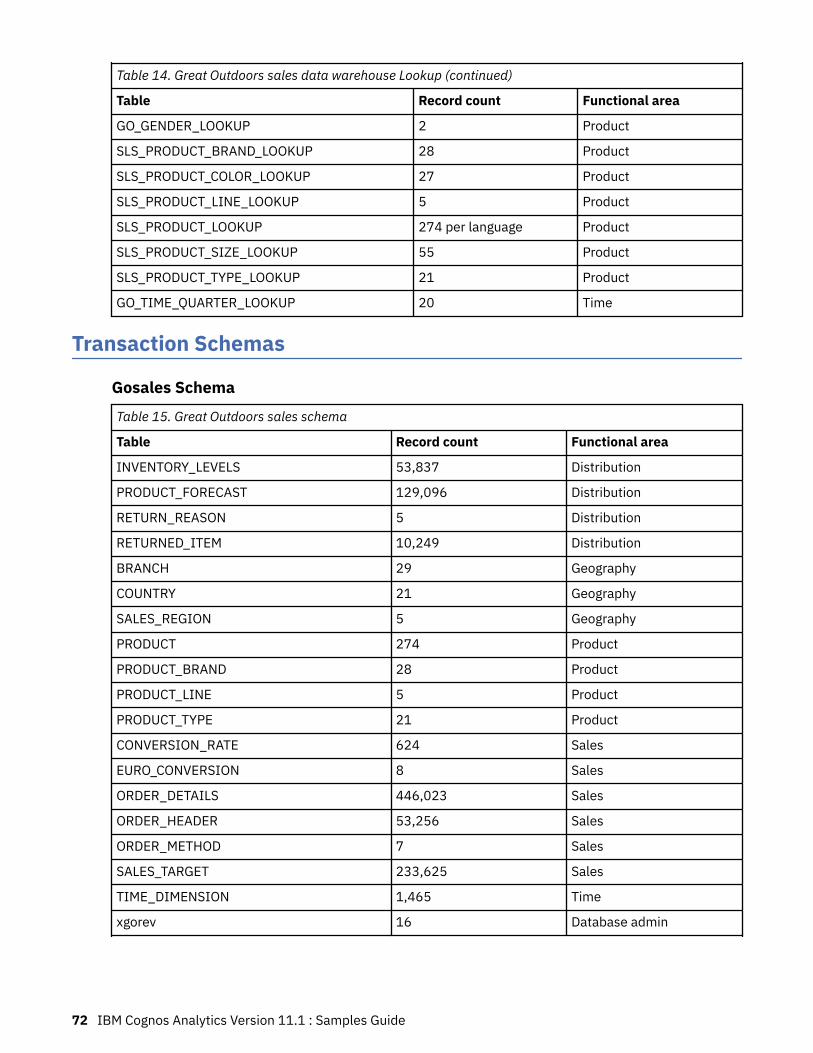
Table 14. Great Outdoors sales data warehouse Lookup (continued)
Table Record count Functional area
GO_GENDER_LOOKUP 2 Product
SLS_PRODUCT_BRAND_LOOKUP 28 Product
SLS_PRODUCT_COLOR_LOOKUP 27 Product
SLS_PRODUCT_LINE_LOOKUP 5 Product
SLS_PRODUCT_LOOKUP 274 per language Product
SLS_PRODUCT_SIZE_LOOKUP 55 Product
SLS_PRODUCT_TYPE_LOOKUP 21 Product
GO_TIME_QUARTER_LOOKUP 20 Time
Transaction Schemas
Gosales SchemaTable 15. Great Outdoors sales schema
Table Record count Functional area
INVENTORY_LEVELS 53,837 Distribution
PRODUCT_FORECAST 129,096 Distribution
RETURN_REASON 5 Distribution
RETURNED_ITEM 10,249 Distribution
BRANCH 29 Geography
COUNTRY 21 Geography
SALES_REGION 5 Geography
PRODUCT 274 Product
PRODUCT_BRAND 28 Product
PRODUCT_LINE 5 Product
PRODUCT_TYPE 21 Product
CONVERSION_RATE 624 Sales
EURO_CONVERSION 8 Sales
ORDER_DETAILS 446,023 Sales
ORDER_HEADER 53,256 Sales
ORDER_METHOD 7 Sales
SALES_TARGET 233,625 Sales
TIME_DIMENSION 1,465 Time
xgorev 16 Database admin
72 IBM Cognos Analytics Version 11.1 : Samples Guide
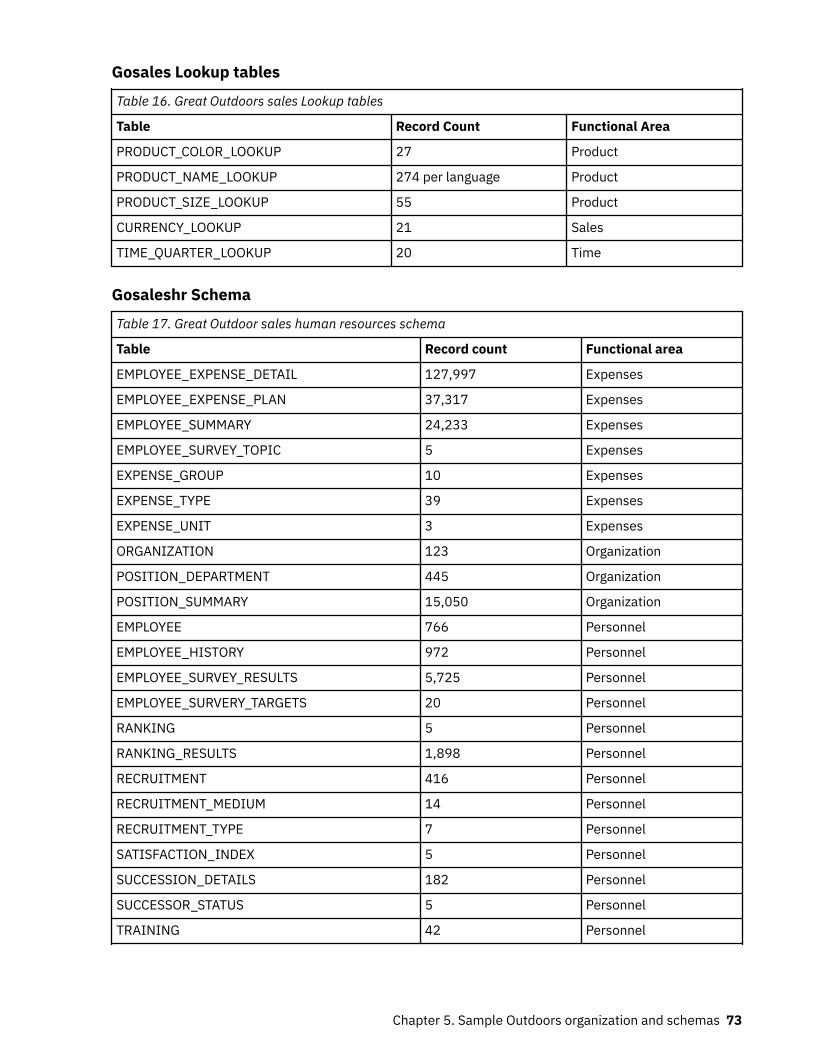
Gosales Lookup tablesTable 16. Great Outdoors sales Lookup tables
Table Record Count Functional Area
PRODUCT_COLOR_LOOKUP 27 Product
PRODUCT_NAME_LOOKUP 274 per language Product
PRODUCT_SIZE_LOOKUP 55 Product
CURRENCY_LOOKUP 21 Sales
TIME_QUARTER_LOOKUP 20 Time
Gosaleshr SchemaTable 17. Great Outdoor sales human resources schema
Table Record count Functional area
EMPLOYEE_EXPENSE_DETAIL 127,997 Expenses
EMPLOYEE_EXPENSE_PLAN 37,317 Expenses
EMPLOYEE_SUMMARY 24,233 Expenses
EMPLOYEE_SURVEY_TOPIC 5 Expenses
EXPENSE_GROUP 10 Expenses
EXPENSE_TYPE 39 Expenses
EXPENSE_UNIT 3 Expenses
ORGANIZATION 123 Organization
POSITION_DEPARTMENT 445 Organization
POSITION_SUMMARY 15,050 Organization
EMPLOYEE 766 Personnel
EMPLOYEE_HISTORY 972 Personnel
EMPLOYEE_SURVEY_RESULTS 5,725 Personnel
EMPLOYEE_SURVERY_TARGETS 20 Personnel
RANKING 5 Personnel
RANKING_RESULTS 1,898 Personnel
RECRUITMENT 416 Personnel
RECRUITMENT_MEDIUM 14 Personnel
RECRUITMENT_TYPE 7 Personnel
SATISFACTION_INDEX 5 Personnel
SUCCESSION_DETAILS 182 Personnel
SUCCESSOR_STATUS 5 Personnel
TRAINING 42 Personnel
Chapter 5. Sample Outdoors organization and schemas 73
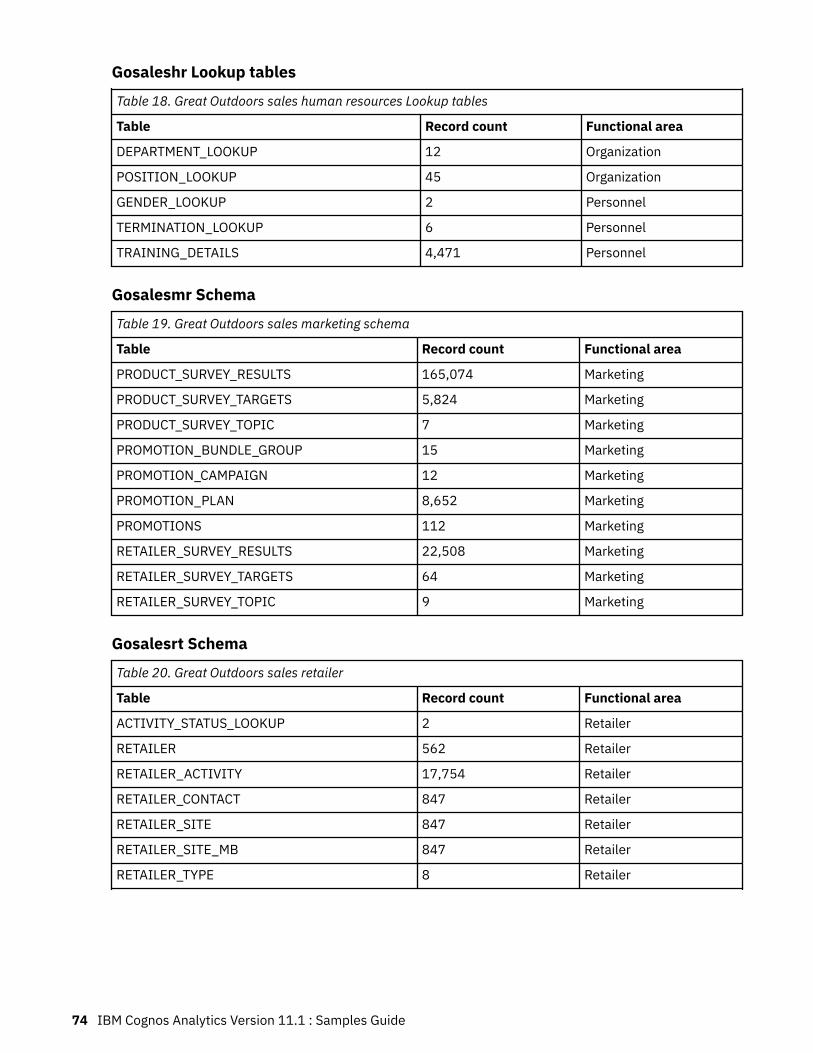
Gosaleshr Lookup tablesTable 18. Great Outdoors sales human resources Lookup tables
Table Record count Functional area
DEPARTMENT_LOOKUP 12 Organization
POSITION_LOOKUP 45 Organization
GENDER_LOOKUP 2 Personnel
TERMINATION_LOOKUP 6 Personnel
TRAINING_DETAILS 4,471 Personnel
Gosalesmr SchemaTable 19. Great Outdoors sales marketing schema
Table Record count Functional area
PRODUCT_SURVEY_RESULTS 165,074 Marketing
PRODUCT_SURVEY_TARGETS 5,824 Marketing
PRODUCT_SURVEY_TOPIC 7 Marketing
PROMOTION_BUNDLE_GROUP 15 Marketing
PROMOTION_CAMPAIGN 12 Marketing
PROMOTION_PLAN 8,652 Marketing
PROMOTIONS 112 Marketing
RETAILER_SURVEY_RESULTS 22,508 Marketing
RETAILER_SURVEY_TARGETS 64 Marketing
RETAILER_SURVEY_TOPIC 9 Marketing
Gosalesrt SchemaTable 20. Great Outdoors sales retailer
Table Record count Functional area
ACTIVITY_STATUS_LOOKUP 2 Retailer
RETAILER 562 Retailer
RETAILER_ACTIVITY 17,754 Retailer
RETAILER_CONTACT 847 Retailer
RETAILER_SITE 847 Retailer
RETAILER_SITE_MB 847 Retailer
RETAILER_TYPE 8 Retailer
74 IBM Cognos Analytics Version 11.1 : Samples Guide
Chapter 6. Cognos Analytics for Jupyter Notebooksamples
Before you can use the IBM Cognos Analytics for Jupyter Notebook samples, Cognos Analytics for JupyterNotebook must be enabled in your IBM Cognos Analytics environment.
Importing and configuring the Jupyter samplesTo set up the samples, you must perform several tasks, such as importing the Jupyter samples.
Before you beginBefore importing these samples, please ensure that you have installed and configured the JupyterNotebook server. For more information, see Installing IBM Cognos Analytics for Jupyter Notebook Server inthe Installing and configuring guide.
Steps for Cognos Analytics versions 11.1.0 to 11.1.41. Locate the deployment archive, IBM_Cognos_Notebook_Samples.zip, for the notebook samples in the
installation location: cognos_analytics_server_install_location\samples\notebooks.2. Copy the deployment file into your deployment folder:cognos_analytics_server_install_location\deployment.
3. Go to Manage > Administration console and open IBM Cognos Administration.4. On the Configuration tab, click Content Administration.
5. On the toolbar, click the New Import icon .6. Select IBM_Cognos_Notebook_Samples in the first step of the New Import wizard.7. At the Run with options screen, ensure that Do not Assign new IDs during import is selected. Click
Run and complete process using default settings.8. After the import is complete, you can navigate to the notebook samples by clicking Team content >
Samples > Notebooks.
Steps for Cognos Analytics versions 11.1.5 and higher1. Locate the deployment archive, IBM_Cognos_Notebook_Samples.zip, for the notebook samples in the
deployment folder: cognos_analytics_server_install_location\deployment.2. Go to Manage > Administration console and open IBM Cognos Administration.3. On the Configuration tab, click Content Administration.
4. On the toolbar, click the New Import icon .5. Select IBM_Cognos_Notebook_Samples in the first step of the New Import wizard.6. At the Run with options screen, ensure that Do not Assign new IDs during import is selected. Click
Run and complete process using default settings.7. After the import is complete, you can navigate to the notebook samples by clicking Team content >
Samples > By feature > Notebooks.
© Copyright IBM Corp. 2005, 2021 75
Jupyter notebook samplesThe notebook samples in this section are designed to provide ideas for using Jupyter notebooks with IBMCognos Analytics.
Flexible lightweight ETL notebook sampleThis sample demonstrates ETL tasks within Cognos Analytics for Jupyter Notebook.
This sample notebook demonstrates how to conduct lightweight ETL (extract, transform, and load) tasksby connecting to an external data asset, performing some data cleansing, and writing the data into aCognos Analytics asset.
This sample can be found here: Team content > Samples > Notebooks > Flexiblelightweight ETL
Time series analysis notebook sampleUse an external CSV file in Cognos Analytics for Jupyter Notebook.
This sample notebook demonstrates how to connect to an external CSV file, display the data, write thedata as a Cognos Analytics asset, modify the presentation of the data, and create a visualization.
Team content > Samples > Notebooks > IoT time series analysis
Visualization creation notebook sampleThis sample notebook demonstrates how to connect to a local data file and create several visualizations(bar, column, line, pie, and bubble).
Sample can be found in Team content > Samples > Notebooks > Visualization notebook.
Retailer dashboard notebook sampleThis sample demonstrates the integration of notebooks and dashboards.
Sample report can be found here: Team content > Samples > Notebooks > Retailerdashboard
Telecom data analysis notebook sample This sample notebook demonstrates how to perform customer churn analysis on a sample dataset.
Predictive analytics models are used to predict customer churn by evaluating their probability of risk tochurn.
This sample can be found here: Team content > Samples > By feature > Notebooks >Notebooks.
Telecom data visualizations notebook sample This sample notebook demonstrates how to explore data and create visualizations in the context of
a fictional telecommunications company.
This sample can be found here: Team content > Samples > By feature > Notebooks >Notebooks
Unit infection data notebook sample This sample notebook demonstrates how to create a dataset and use visualization with a slider to
display the rates of infection in a group of fictional hospital units over a given time period.
This sample can be found here: Team content > Samples > By feature > Notebooks >Notebooks.
76 IBM Cognos Analytics Version 11.1 : Samples Guide
Data quality template notebook sample This notebook template can be applied to any dataset. It demonstrates how to read, review, quality
check, and clean data.
This sample can be found here: Team content > Samples > By feature > Notebooks >Notebooks.
Schedule data creation notebook sample This sample notebook demonstrates patient visit and nurse shift data at a fictional hospital.
This sample can be found here: Team content > Samples > By feature > Notebooks >Notebooks.
Schedule data creation notebook widget sample This sample report demonstrates how to add notebook widgets to a report. These widgets display
fictional health insurance coverage data from a notebook.
This sample can be found here: Team content > Samples > By feature > Notebooks >Reports.
Health insurance coverage analysis notebook sample This sample notebook demonstrates how to create and merge geographic data with other data,
modify the presentation of the data, and create map and trend line visualizations.
This sample can be found here: Team content > Samples > By feature > Notebooks >Notebooks.
Retailer report notebook widget sample This sample report demonstrates how to add notebook widgets to a report. These widgets display
fictional health insurance coverage data from a notebook.
This sample can be found here: Team content > Samples > By feature > Notebooks >Reports.
Chapter 6. Cognos Analytics for Jupyter Notebook samples 77

78 IBM Cognos Analytics Version 11.1 : Samples Guide
Chapter 7. The Weather Company sampleThe Weather Company sample includes metadata corresponding to The Weather Company analytictooling services. This data module can be joined to other data modules to create relationships betweenyour application tables and data from The Weather Company.
Importing The Weather Company sampleThe Weather Company sample demonstrates how to use The Weather Company data.
Before you beginYou must have a Weather Company API key. For more information, see Weather Data Packages (https://business.weather.com/products/weather-data-packages). If you want historical weather data, then youmust have the History on Demand Data Package. If you want forecast data, then you must have theEnhanced Forecast Weather Data Package.
Procedure1. Go to https://public.dhe.ibm.com/software/data/sw-library/cognos/mobile/C11/TWC/ and download
the file called The_Weather_Company.zip to thecognos_analytics_server_install_location\deployment folder.
2. Go to Manage > Administration console and open IBM Cognos Administration.3. On the Configuration tab, click Content Administration.
4. On the toolbar, click the New Import icon .5. Select The_Weather_Company.zip in the first step of the New Import wizard and complete the
remaining steps of the wizard using the defaults.6. Update the IBM Weather Company data source connection signon with your Weather Company API
key as the password.For information about how to update the signon, see Creating a data server connection in the ManagingUser Guide.
ResultsThe sample appears in the Team content > The Weather Company, an IBM business > The WeatherCompany folder. It contains the following objects:Boston 311 calls data module
Created from the Boston_311_calls.xlsx uploaded file. It is one of the sources in Boston 311plus weather data module.
Boston 311 plus weather data moduleDemonstrates how to combine business data (Boston 311 calls data module) and weather data (TheWeather Company data module) into a single data module using filter joins.
Boston_311_calls.xlsxDemonstrates how to add date and postalKey fields to support weather analytics. The file contains311 calls to the city of Boston, MA. Like many other cities, Boston logs hundreds of thousands ofrequests each year for 311 services such as snow plowing, street cleaning, and pot hole repair.Source: City of Boston.
Historical weather reportDemonstrates weather analytics in the context of a report.
© Copyright IBM Corp. 2005, 2021 79
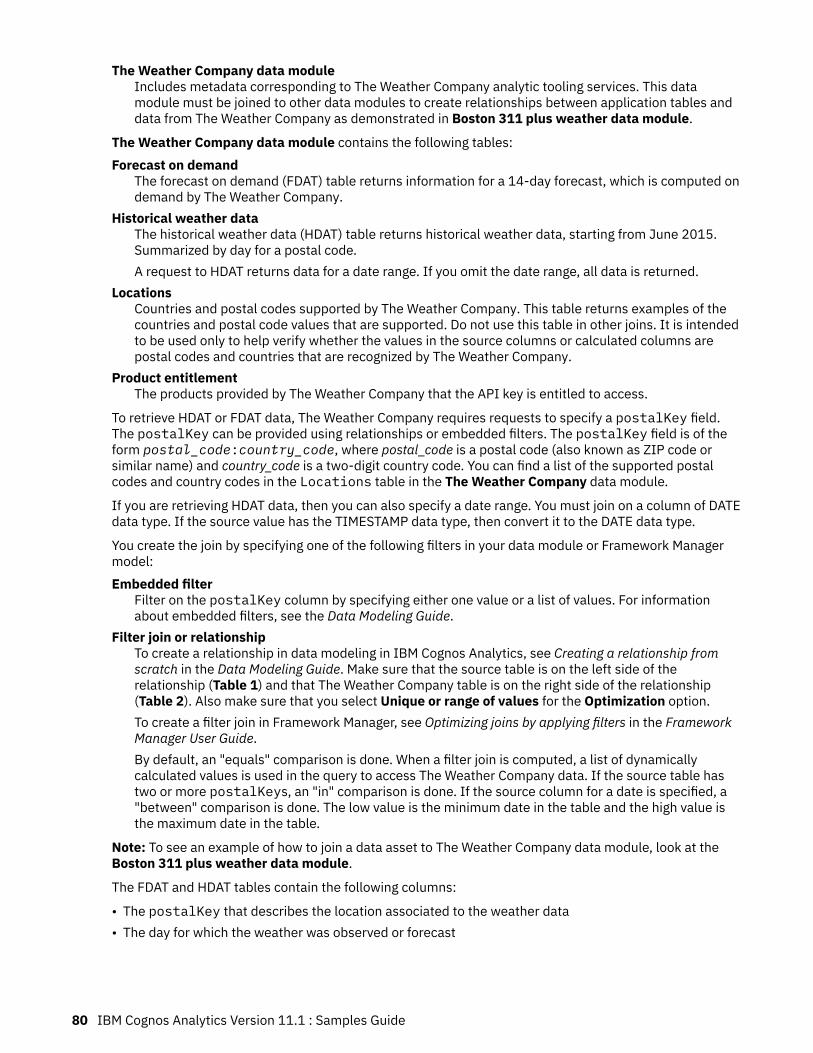
The Weather Company data moduleIncludes metadata corresponding to The Weather Company analytic tooling services. This datamodule must be joined to other data modules to create relationships between application tables anddata from The Weather Company as demonstrated in Boston 311 plus weather data module.
The Weather Company data module contains the following tables:Forecast on demand
The forecast on demand (FDAT) table returns information for a 14-day forecast, which is computed ondemand by The Weather Company.
Historical weather dataThe historical weather data (HDAT) table returns historical weather data, starting from June 2015.Summarized by day for a postal code.A request to HDAT returns data for a date range. If you omit the date range, all data is returned.
LocationsCountries and postal codes supported by The Weather Company. This table returns examples of thecountries and postal code values that are supported. Do not use this table in other joins. It is intendedto be used only to help verify whether the values in the source columns or calculated columns arepostal codes and countries that are recognized by The Weather Company.
Product entitlementThe products provided by The Weather Company that the API key is entitled to access.
To retrieve HDAT or FDAT data, The Weather Company requires requests to specify a postalKey field.The postalKey can be provided using relationships or embedded filters. The postalKey field is of theform postal_code:country_code, where postal_code is a postal code (also known as ZIP code orsimilar name) and country_code is a two-digit country code. You can find a list of the supported postalcodes and country codes in the Locations table in the The Weather Company data module.
If you are retrieving HDAT data, then you can also specify a date range. You must join on a column of DATEdata type. If the source value has the TIMESTAMP data type, then convert it to the DATE data type.
You create the join by specifying one of the following filters in your data module or Framework Managermodel:Embedded filter
Filter on the postalKey column by specifying either one value or a list of values. For informationabout embedded filters, see the Data Modeling Guide.
Filter join or relationshipTo create a relationship in data modeling in IBM Cognos Analytics, see Creating a relationship fromscratch in the Data Modeling Guide. Make sure that the source table is on the left side of therelationship (Table 1) and that The Weather Company table is on the right side of the relationship(Table 2). Also make sure that you select Unique or range of values for the Optimization option.To create a filter join in Framework Manager, see Optimizing joins by applying filters in the FrameworkManager User Guide.By default, an "equals" comparison is done. When a filter join is computed, a list of dynamicallycalculated values is used in the query to access The Weather Company data. If the source table hastwo or more postalKeys, an "in" comparison is done. If the source column for a date is specified, a"between" comparison is done. The low value is the minimum date in the table and the high value isthe maximum date in the table.
Note: To see an example of how to join a data asset to The Weather Company data module, look at theBoston 311 plus weather data module.
The FDAT and HDAT tables contain the following columns:
• The postalKey that describes the location associated to the weather data• The day for which the weather was observed or forecast
80 IBM Cognos Analytics Version 11.1 : Samples Guide
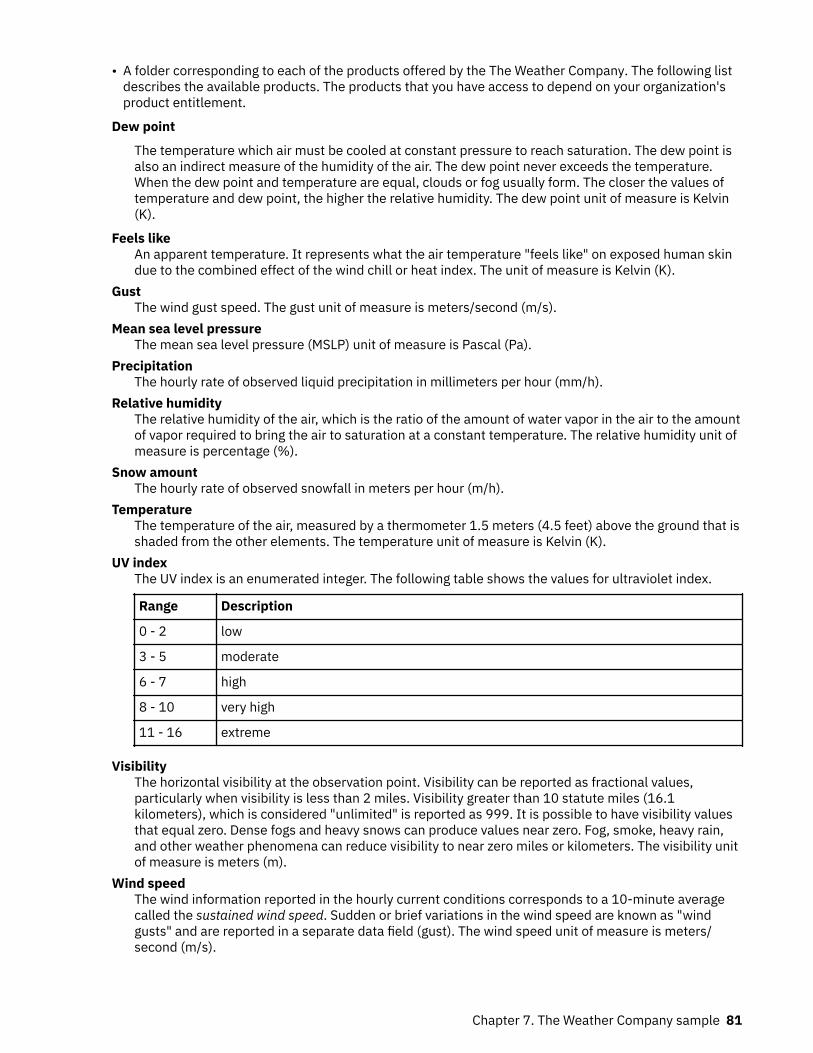
• A folder corresponding to each of the products offered by the The Weather Company. The following listdescribes the available products. The products that you have access to depend on your organization'sproduct entitlement.
Dew point
The temperature which air must be cooled at constant pressure to reach saturation. The dew point isalso an indirect measure of the humidity of the air. The dew point never exceeds the temperature.When the dew point and temperature are equal, clouds or fog usually form. The closer the values oftemperature and dew point, the higher the relative humidity. The dew point unit of measure is Kelvin(K).
Feels likeAn apparent temperature. It represents what the air temperature "feels like" on exposed human skindue to the combined effect of the wind chill or heat index. The unit of measure is Kelvin (K).
GustThe wind gust speed. The gust unit of measure is meters/second (m/s).
Mean sea level pressureThe mean sea level pressure (MSLP) unit of measure is Pascal (Pa).
PrecipitationThe hourly rate of observed liquid precipitation in millimeters per hour (mm/h).
Relative humidityThe relative humidity of the air, which is the ratio of the amount of water vapor in the air to the amountof vapor required to bring the air to saturation at a constant temperature. The relative humidity unit ofmeasure is percentage (%).
Snow amountThe hourly rate of observed snowfall in meters per hour (m/h).
TemperatureThe temperature of the air, measured by a thermometer 1.5 meters (4.5 feet) above the ground that isshaded from the other elements. The temperature unit of measure is Kelvin (K).
UV indexThe UV index is an enumerated integer. The following table shows the values for ultraviolet index.
Range Description
0 - 2 low
3 - 5 moderate
6 - 7 high
8 - 10 very high
11 - 16 extreme
VisibilityThe horizontal visibility at the observation point. Visibility can be reported as fractional values,particularly when visibility is less than 2 miles. Visibility greater than 10 statute miles (16.1kilometers), which is considered "unlimited" is reported as 999. It is possible to have visibility valuesthat equal zero. Dense fogs and heavy snows can produce values near zero. Fog, smoke, heavy rain,and other weather phenomena can reduce visibility to near zero miles or kilometers. The visibility unitof measure is meters (m).
Wind speedThe wind information reported in the hourly current conditions corresponds to a 10-minute averagecalled the sustained wind speed. Sudden or brief variations in the wind speed are known as "windgusts" and are reported in a separate data field (gust). The wind speed unit of measure is meters/second (m/s).
Chapter 7. The Weather Company sample 81
Each product (for example, snow amount) is returned as an aggregate value such as sum if applicable,minimum, maximum, and average, based on the following definitions:Day
Measurements from 00:00 hours to 24:00 hours.Daytime
Measurements from 07:00 hours up to 19:00 hours.Nighttime
Measurements from 09:00 hours up to 07:00 hours of the next day.Morning
Measurements from 07:00 hours up to 13:00 hours.Afternoon
Measurements from 13:00 hours up to 19:00 hours.Evening
Measurements from 19:00 hours up to 01:00 hours of the next day.Overnight
Measurements from 01:00 hours up to 07:00 hours in the following day.
82 IBM Cognos Analytics Version 11.1 : Samples Guide
Index
Special Characters.otl files 32
Aaggregation
samples and time dimensions 39Analysis Studio
samples 65audit reports 41
Bbase samples 2
CCognos Analytics,, See IBM Cognos AnalyticsCognos Workspace samples 62connections
OLAP data sources 32
Ddata
IBM Cognos Analytics Jupyter Notebook samples 75IBM Cognos samples 19
database models 36databases
IBM Cognos samples 19deploying dynamic cubes 36deploying sample cube 36deploying sample data 36dynamic cubes 36
EEssbase
cube sample 32
FFramework Manager
sample models 28
Ggosldw_sales sample dynamic cube 36gosldw_sales_and_target sample dynamic cube 36gosldw_target sample dynamic cube 36
IIBM Cognos
IBM Cognos (continued)samples 19, 75
IBM Cognos samples 19, 75importing
samples 28, 35
JJava
setup procedures 64using the samples 63
MMicrosoft Analysis Services
setting up MSAS cube samples 31model.fmd 36models
database samples 28modifying for samples 28, 35sample models and packages 39samples 45
OOLAP data sources
connections 32
Ppackages
samples 45
QQuery Studio
samples 66
RReporting
samples 46reports
samples 45restoring
samples databases 19
SSample Outdoors Company
databases, models, and packages 39samples 37
Sample Outdoors,, See IBM Cognos samplessamples
Analysis Studio 65
Index 83
samples (continued)audit reports 41Cognos Workspace 62cubes 40data source connections 46database, models, and packages 39dynamic cubes 36employees 39Essbase cubes 32GO data warehouse 40GO Data Warehouse (analysis) package 48GO Data Warehouse (query) package 55GO Sales (analysis) package 57GO Sales (query) package 57GO Sales transactional database 40importing 28, 35, 46Java setup steps 64Metric Designer 19models 28MSAS cube 31OLAP data sources 32packages 41Prompt API folder 61Query Studio 66Reporting 46restoring backup files using scripts for Db2 20restoring backup files using scripts for oracle 24restoring samples databases 19Sales and Marketing (Cube) package 46sales and marketing data 39Sample Outdoors Sales (cube) package 46setting up 19, 75
setting upsamples 19, 75
setup proceduresJava 64
84 IBM Cognos Analytics Version 11.1 : Samples Guide


IBM®


