40
IBM Retail Business Intelligence Solutions Retail RBIS/Cognos Solutions Overview
| Date post: | 06-Mar-2018 |
| Category: |
Documents |
| Upload: | nguyendung |
| View: | 213 times |
| Download: | 1 times |
IBM Retail Business Intelligence Solutions
Retail RBIS/Cognos Solutions Overview

Agenda
• Information Management Approach• Overview of RBIS and Cognos• Case Study• Value Proposition

“I see different promotions online and in the store for
the same item”Separate marketing
plans by channel
“I can’t find clothing items that fit my
particular lifestyle or needs”
Assortment planning doesn’t reflect customer
needs
No access to inventory
availability; staffing based solely on
cost
“I wasn’t able to reserve an item from the website and then
go pick it up in the store”
Inventory management doesn’t span
channels“The emails I receive from
this store are usually a waste of time”
Mass market approach to promotions
Becoming customer focused requires bringing together a “customer view” with a traditional “product” view
Marketing plans coordinated across
channels
Inventory management
across channels
Inventory availability provided to associates; staffing balances cost with customer needs
Assortment planning reflects local market and customer needs
Promotions and offers tailored to each customer
segment
Traditional inside-out view is constrained by organizational silos and only product focused
Adding the ‘Customer View’ creates a cross organizational common view of the customer and business
“I can never find anyone to help me and if I do they can’t tell me whether a product is in stock or
not”
What the Customer Sees
Add & Integrate the Customer View
“Promotions are the same on the website as
in the store”
“I can always find clothing that suits my tastes and
needs”
“I can reserve items or purchase items online and
pickup them up in the store”
“The emails I receive from this store are always relevant to what I have
purchased or might need”
“I can always find someone to answer my questions and tell me whether the product
is in stock or not”
Creating Advocates

• Multiple versions of the truth– Problems managing customer, item, vendor, and location data and interactions – Regulatory compliance inhibited by poor transparency
• Lack of trusted information– Incomplete, out-of-date, inaccurate, misinterpreted data– Difficult to understand or control how information is used
• Too much information and not knowing what’s important– Not using demand signals to drive supply chain– Not using customer analysis to tailor marketing and sales– Not leveraging valuable unstructured information
• Lack of agility– Inability to take advantage of opportunities for innovation– Escalating costs due to inflexible systems and changing needs
Customer focus and detailed views of information highlight common fundamental information issues
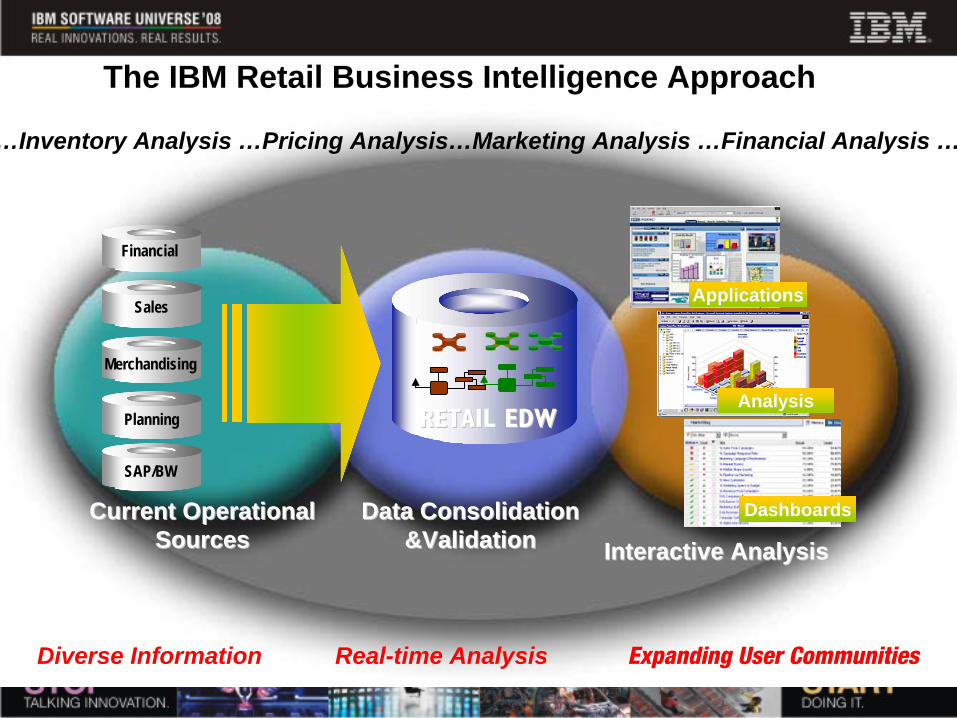
Diverse Information Real-time Analysis Expanding User Communities
Current Operational Current Operational SourcesSources
Data Consolidation Data Consolidation &Validation&Validation Interactive AnalysisInteractive Analysis
…Inventory Analysis …Pricing Analysis…Marketing Analysis …Financial Analysis …
The IBM Retail Business Intelligence Approach
Financial
Sales
Merchandising
Planning
SAP/BW
RETAIL EDWRETAIL EDW
Applications
Dashboards
Analysis

Retail Data WarehouseEnterprise WideConsistent ReportingReuse of extracts from Operational SourcesCost Effective ReportingSupport all types of Sources & Reporting Apps Proven Scalability
Sales
CreditCard
Inventory
Purchsg
Order Mgmt
GeneralLedger
OperationalSources
OtherApps
Hr
Payroll
CashMgmt
Investmnts
Sales
CreditCard
Inventory
Purchsg
Order Mgmt
GeneralLedger
OperationalSources
OtherApps
Hr
Payroll
CashMgmt
Investmnts
CustomerManagement
StoreOperations
Product & ServicesManagement
CorporateFinance
MerchandisingManagement
CustomerManagement
CustomerManagement
StoreOperations
Product & ServicesManagement
CorporateFinance
MerchandisingManagement
StoreOperations
StoreOperations
Product & ServicesManagement
Product & ServicesManagement
CorporateFinance
CorporateFinance
MerchandisingManagement
MerchandisingManagement
Why do I need a data warehouse?

Retail Business Intelligence Solution includes hardware, software and services packaged to deliver targeted retail functionality and insight
RDW Relational Model (RDWM)Data Warehouse Structures and Summaries – Logical Reference Architecture
RDWM
Retail Business Solution Templates (RBST)Pre-defined Accelerators/Cubes and Reports
BST: MOLAP Models and Cubes BST: Reports and Graphs
Retail Services Data Model (RSDM)Industry Definitions, Concepts and Classifications – Metadata
TSDM
GBS Retail And Business Intelligence Services
Retail and BI ISV’s
Balanced Configuration Unit (BCU) -Retail Optimized Business Intelligence Infrastructure (integrated and performance optimized - server, storage and software)
p/xSeries ServerTotal Storage
BCU 1
p/xSeries ServerTotal Storage
BCU 2
p/xSeries ServerTotal Storage
BCU N
IBM Information ServerDB2 Data Warehouse Edition
Intelligent Miner

Merchandising
“MaximizeMerchandise”
Supply Chain
“Focus the Supply Chain”
Stores/Channels
“Revolutionizethe Experience”
Customer Mgmt. and Marketing
“MotivateShoppers”
Retail Major Analytic Process Areas
•Store Location•Store Optimization•Suspicious Activity•Activity Based Costing•Location Exposure•Location profitability•Loss Prevention
•Campaign & Promotion•Cross Purchase Behavior•Cross Sell•Cust Attrition•Cust Complaints•Cust Credit Risk Profile•Cust Delinquency•Cust Interaction
•Business Performance•Planning•Forecasting•Product profitability
•Assortment •Allocation•Inventory •Physical Merch •Space Mgmt •Pricing•Promotion
Retail Business Intelligence

Embedded mining used to get deeper insights
Market Basket Analysis• Avoid OOS for associated items during promotions• Shelf/Web/Flyer… layout• Increase high margin item pull
Store Segmentation• Individual view of store for category managers.• Automatic planogram creation• New store assortment
Next Logical Purchase• Promotion Targeting• “Easy” way to predict purchases
Customer Segmentation• Target marketing• Define offerings to attract desirable segments• Tiered loyalty• Programs to migrate customers to more profitable segments
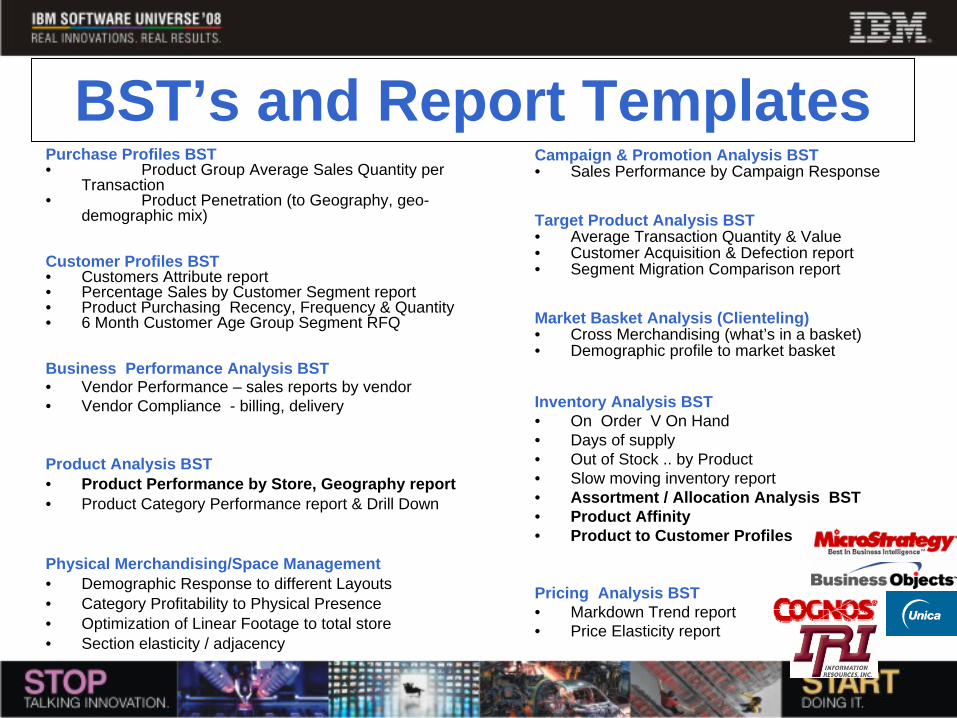
BST’s and Report TemplatesPurchase Profiles BST• Product Group Average Sales Quantity per
Transaction• Product Penetration (to Geography, geo-
demographic mix)
Customer Profiles BST• Customers Attribute report• Percentage Sales by Customer Segment report• Product Purchasing Recency, Frequency & Quantity • 6 Month Customer Age Group Segment RFQ
Business Performance Analysis BST• Vendor Performance – sales reports by vendor• Vendor Compliance - billing, delivery
Product Analysis BST• Product Performance by Store, Geography report• Product Category Performance report & Drill Down
Physical Merchandising/Space Management• Demographic Response to different Layouts• Category Profitability to Physical Presence• Optimization of Linear Footage to total store• Section elasticity / adjacency
Campaign & Promotion Analysis BST• Sales Performance by Campaign Response
Target Product Analysis BST• Average Transaction Quantity & Value• Customer Acquisition & Defection report• Segment Migration Comparison report
Market Basket Analysis (Clienteling)• Cross Merchandising (what’s in a basket)• Demographic profile to market basket
Inventory Analysis BST• On Order V On Hand• Days of supply• Out of Stock .. by Product• Slow moving inventory report• Assortment / Allocation Analysis BST• Product Affinity• Product to Customer Profiles
Pricing Analysis BST• Markdown Trend report• Price Elasticity report

How do I get Started?
• Reporting is Typical First Agenda Leading Business Intelligence Initiatives
• Reporting-led business intelligence initiatives provide a proven, pragmatic approach to implement Performance Management
• Initial focus is on meeting the organizations’ reporting needs• Most organizations are still in stage 1 or 2 in their journey but
recognize the need to move to 3 and 4
1 2 3 4ADDRESSInitial ReportingNeeds
DRIVEInsight throughBI
EXTENDBIEnterprise-Wide
ADVANCEPerformanceManagement

Introducing IBM Cognos Business Intelligence
• Complete range of BI capabilities in a single product, on a single proven Web services architecture
• Zero-footprint, Web interface for all users• Standardizes the delivery of information to accelerate
and improve decision-making• Foundation for performance management
ReportingReporting AnalysisAnalysis DashboardsDashboards ScorecardingScorecarding
Why? How are we doing?
WebWeb OfficeOffice SearchSearchMobileMobile

Managed
Breadth and Depth of Reporting
Ad-hoc
Production
Operational & Transactional
Analytical

Managed Reporting
“…the ability to create standard reports every quarter for our account managers,
branches and regions….”
Bank of Austria Creditanstalt

Managed Reporting
• Requirements– “One to many reporting…”– Flexible prompting and bursting
• Users– Professional author design– Distribution across the enterprise
• Primary Data Sources – Data Warehouse – Operational Stores
“We cannot keep up with the user requests”Example: Sales Report By Region

Business/Ad Hoc Reporting
“End users no longer have to wait for IT to build a report. Instead they can author their
own reports at any time.”
Mold Masters
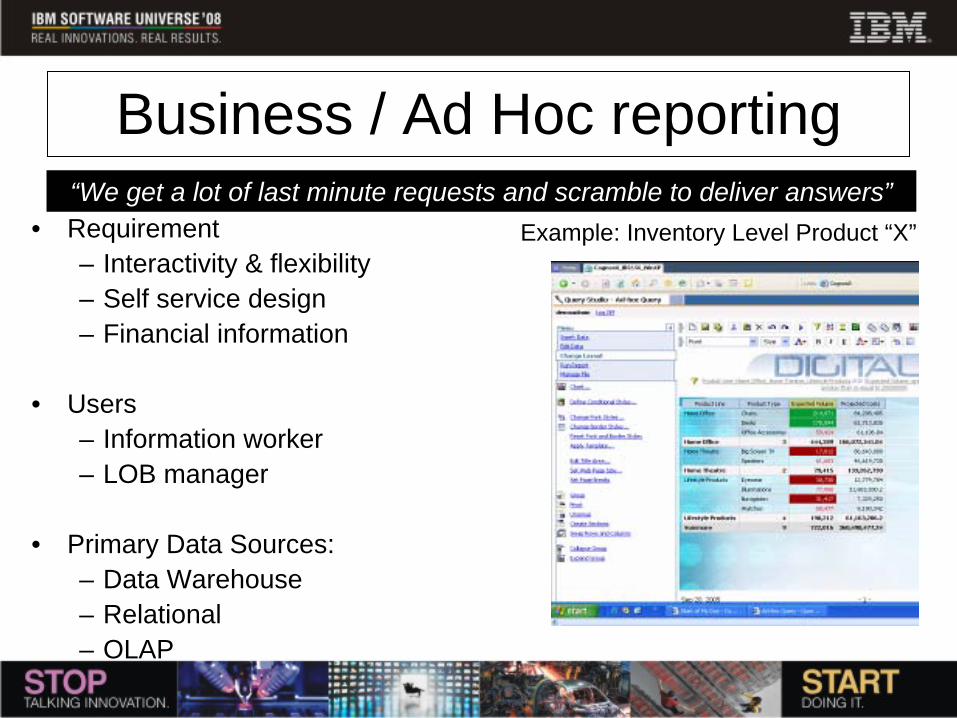
Business / Ad Hoc reporting
• Requirement – Interactivity & flexibility– Self service design– Financial information
• Users – Information worker– LOB manager
• Primary Data Sources: – Data Warehouse– Relational – OLAP
“We get a lot of last minute requests and scramble to deliver answers”Example: Inventory Level Product “X”

Production Reporting
“…we register more than 46,000 transactions every day and the sheer quantity of data makes it essential for us to know exactly where follow-ups
are needed ….”
DHL Worldwide

Production Reporting
• Requirement – Large volumes– High fidelity formatting
• Users– Designed by IT developer– Consumed by customers,
suppliers• Data Sources:
– Transactional sources – e.g. Operational data stores
“We need to provide high quality detailed reports both internally & externally”
Example: Invoice for Purchases

Analytical Reporting
“… “Managers can slice and dice this information to reveal key trends such as
changes in average wage per store year-over-year and productivity per sales associate hour”
American Eagle Outfitters
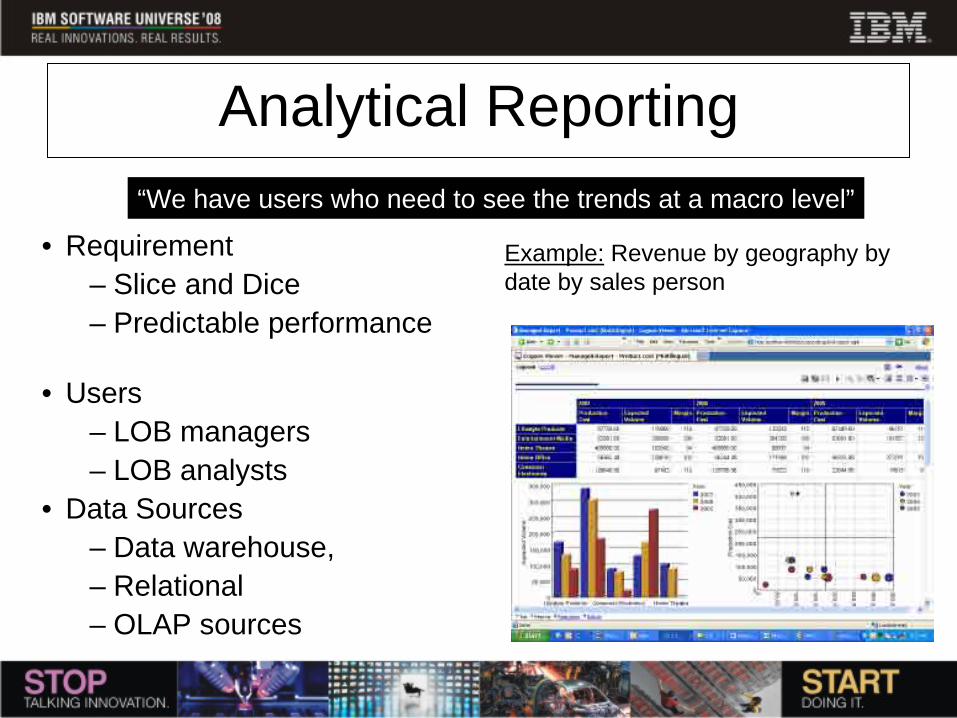
Analytical Reporting
• Requirement– Slice and Dice– Predictable performance
• Users– LOB managers – LOB analysts
• Data Sources– Data warehouse, – Relational – OLAP sources
“We have users who need to see the trends at a macro level”
Example: Revenue by geography by date by sales person
Operational & Transactional Reporting
“… “Our customers want immediate access to their records & profiles to help make financial
decisions…”
Blue Cross Blue Shield Tennessee

Operational & Transactional Reporting
• Sweet Spots– Integration & Access to core
systems– Leverage enterprise architecture
• Users– Designed by professional authors– Distribution across the enterprise
• Primary Data Sources– Transactional– Financial Systems (P/L reports)
“We have many requests for up to the minute data”
Example: List of Product Transactions

Cognos 8 BI
All BI Capabilities in One Product
• Query• Reporting• Dashboarding• Analysis
Full range of BI capabilities needed to improve decision-making and manage performance
Eliminates need for multiple BI tools, lowering costs and easing standardization
• Scorecards• Event Management• Planning

• Browser based self-service reporting for end users who like to create their own reports or collaborate with others
Query
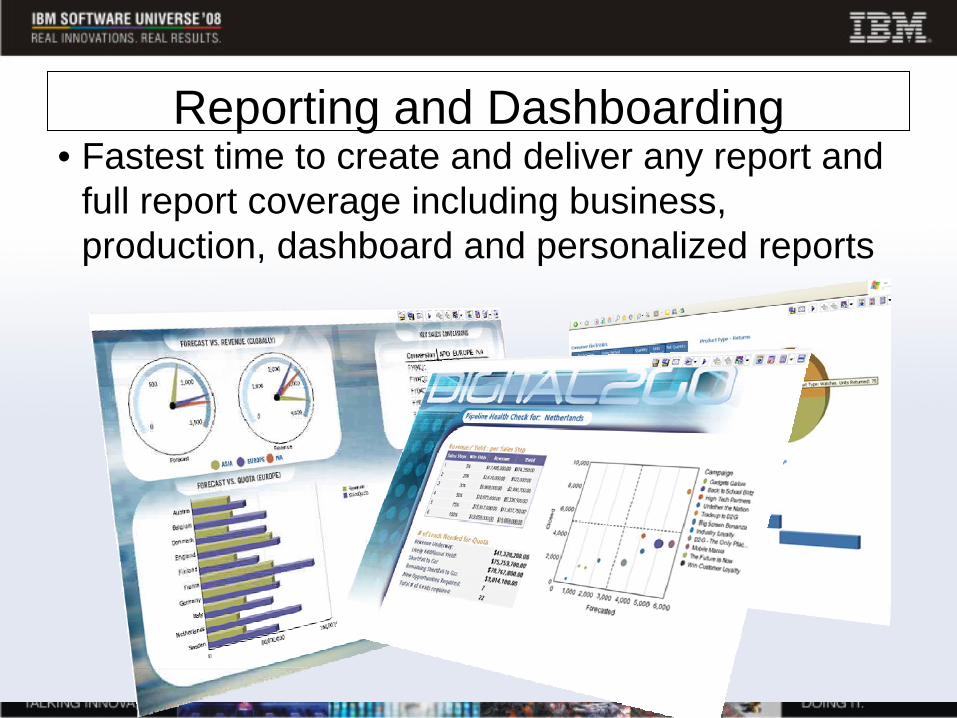
Reporting and Dashboarding• Fastest time to create and deliver any report and
full report coverage including business, production, dashboard and personalized reports

Analysis• Guided multidimensional exploration as
well as comparative capabilities for faster more manageable analysis

Scorecarding• Align individuals on the key business metrics and drive users to
understand what is happening, who is accountable and who is taking action

Event Management• Alerting and Process Integration for automatic
management and fastest time to action

Planning Integration with Cognos 8
• All BI capabilities against all planning data
– Live plan, published plan, workflow
• Standardized delivery of planning information
• Planning data united with all other enterprise data sources
Cognos 8 BI provides the foundation for performance management

Microsoft Go! Office• Extend the reach to business users who live in Microsoft
Office through a live and smart client application
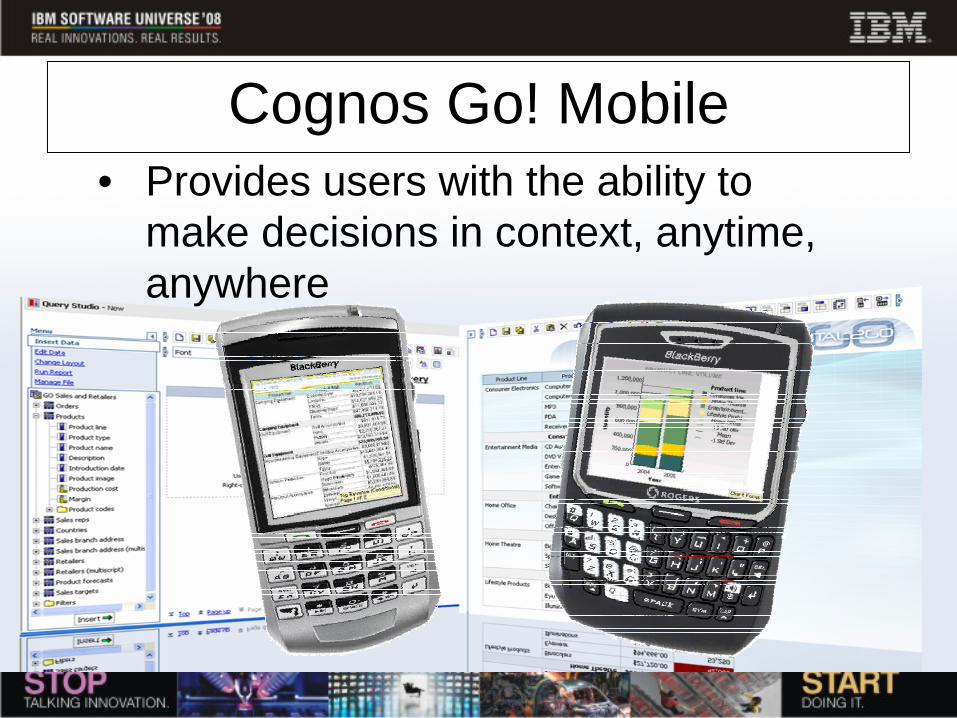
Cognos Go! Mobile• Provides users with the ability to
make decisions in context, anytime, anywhere

One Product, One Architecture
Warehouses (Relational & OLAP)
Transaction Systems
Flat, Legacy or Modern
USER
Purpose-Built WebServices Architecture
SERVICES
Zero Footprint Task-Based Interfaces
Open Data AccessDATA
INFORMATION MANAGEMENT FRAMEWORK
REPORTING DASHBOARDS SCORECARDSQUERY ANALYSIS
WEB, OFFICE, MOBILE, SEARCH…

• Store P&L Operations– Revenue, Labor, Controllable
Expenses, Initiatives
• Store Development– New stores, upgrades, remodels
• Promotion Planning– Marketing spend, campaigns,
vendor trade fund compliance
• Strategic Merchandise Planning– Annual target setting by division,
channel– Calendaring, spreading of targets– Merchandise financial planning– Stock valuation
Retail Performance Blueprints

Performance Management Success in RetailGeneral Retail Food & Drug Restaurant Chains
Sample Case Study :Retail Business Intelligence Solution at Target
• Challenge– Create support for and implement an enterprise data
warehouse solution including:• CRM Analytics• Financials Analytics • Credit Analytics• Others (e.g. Merchandising) on the horizon
• Solution– IBM’s Retail Business Intelligence Solution
• Retail Data Warehouse Model (RDW), Retail Business Solutions Templates (RBSTs), Retail Services Data Model (RSDM)
– Consulting Services – DB2 Data Warehouse Edition
• Benefits– Integrated view across the company– Visibility to complete profitability picture

Gartner - Magic Quadrant for Business intelligence services, 2007
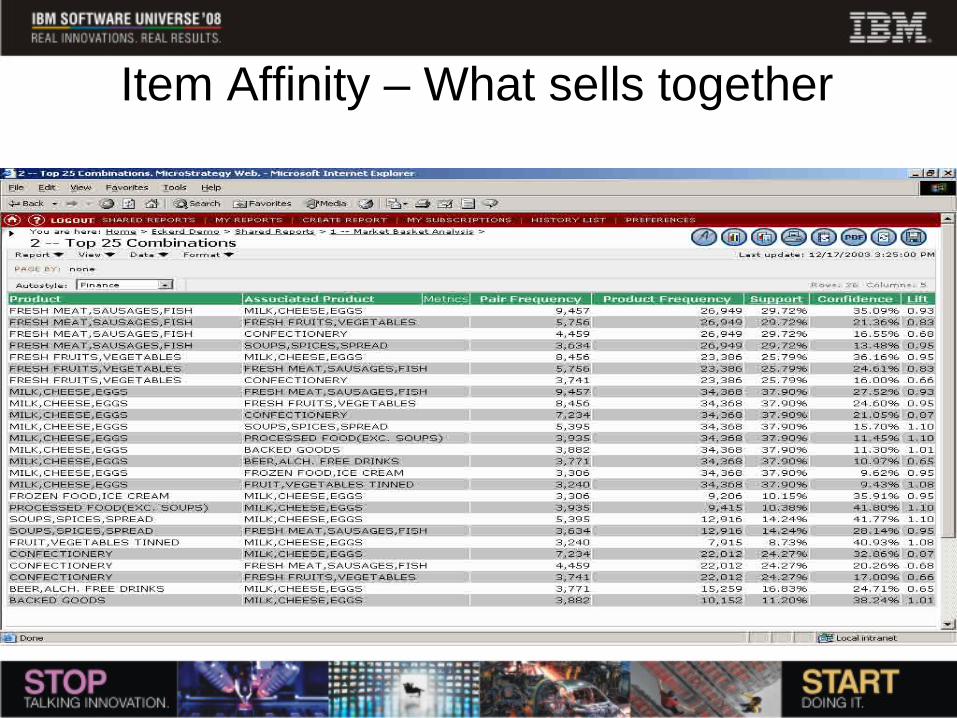
Item Affinity – What sells together

Days of Supply Drill Down

Where clients see value• Targeted analysis for Merchandising, Supply Chain, Multi-Channel and Store Applications
• Faster Time to Value– Retail Model, Pre-built BSTs and implementation methodology are proven accelerators– Mining capabilities are embedded in the DB and thus do not need 3rd party tools
• Lower TCO – Look at all costs and over a 3 – 5 year time horizon– Open standards & Industry Standards– Expanding ecosystem of Application tool providers
• Solution Performance– DB2 and System P at the core are proven, scalable products– Hardware and Software have been optimized for data warehousing
• Long Term Viability – Competitors have numerous distractions (spin-offs, IPO, etc.)– IBM has invested over $1.5B in Information Management in the last 18 months


