88
IBM System Dashboard for Enterprise Content Management User’s Guide 4.5.1 SC19-2763-02

IBM System Dashboard for Enterprise Content Management
User’s Guide
4.5.1
SC19-2763-02
���

IBM System Dashboard for Enterprise Content Management
User’s Guide
4.5.1
SC19-2763-02
���

Note:Before using this information and the product it supports, read the information in “Notices” on page 80.
This edition applies to version 4.5.1 of IBM System Dashboard for Enterprise Content Management (productnumber 5724-R95) and to all subsequent releases and modifications until otherwise indicated in new editions.
© Copyright International Business Machines Corporation 2005, 2009.US Government Users Restricted Rights – Use, duplication or disclosure restricted by GSA ADP Schedule Contractwith IBM Corp.
Table of Contents IBM System Dashboard for Enterprise Content Management .......................................................8 Overview..........................................................................................................................................8 System Dashboard Features...........................................................................................................8 System Dashboard components .....................................................................................................9
Supported products......................................................................................................................9 Installing the Dashboard................................................................................................................10
UNIX installation procedure .......................................................................................................11 Windows installation procedure .................................................................................................12 Supported JVMs ........................................................................................................................13
Uninstalling the Dashboard ...........................................................................................................14 UNIX uninstall procedure ...........................................................................................................14 Windows uninstall procedure.....................................................................................................14
Dashboard views ...........................................................................................................................15 Summary view............................................................................................................................16 Details view................................................................................................................................16 Clusters view..............................................................................................................................17 Alerts view..................................................................................................................................17 Reports view ..............................................................................................................................17
Configuring the Dashboard............................................................................................................18 Defining a cluster ...........................................................................................................................18 Starting the Listener on Image Services servers and Process Engine servers ............................19 Customizing the service selection and time range........................................................................20
Service Selection .......................................................................................................................20 Time Range................................................................................................................................21 Viewing data...............................................................................................................................21 Accessing Listener tasks ...........................................................................................................22
Deleting urgent messages.............................................................................................................22 Working with a report template......................................................................................................23 Saving a report template ...............................................................................................................23 Editing a report template ...............................................................................................................23 Running a report ............................................................................................................................24 Running a Scout report..................................................................................................................25 Archiving Manager.........................................................................................................................26
Archiving Manager syntax..........................................................................................................26 Archiving Manager flags ............................................................................................................26 Opening an archive file ..............................................................................................................27
Interpreting counters......................................................................................................................28 Content Engine counters ...........................................................................................................28
Centera counters....................................................................................................................29 CBR/Verity counters...............................................................................................................29 CFS-IS Import Agent counters ...............................................................................................30 Content Retrieval counters.....................................................................................................30 Content Upload counters........................................................................................................31 Content Update counters (Roll Forward Processing) Requests Processed ..........................31 Content Update counters (Roll Forward Processing) Requests Queued ..............................32 Database counters .................................................................................................................33 FSB/Snaplock counters..........................................................................................................33 Image Services counters........................................................................................................34 Independent Repository Objects counters .............................................................................35 Non-Repository Object Retrieval, Database calls, and Marking Set cache counters ............36 Object Stores counters...........................................................................................................37 Roll Forward Dispatcher counters..........................................................................................39 RPC counters .........................................................................................................................40 Snaplock Specific counters ....................................................................................................41
August 2009 IBM System Dashboard for Enterprise Content Management User’s Guide 5

Table of Contents
Storage Area Summary counters...........................................................................................41 Dashboard counters...................................................................................................................42
Environmental Information .....................................................................................................42 CPU counters .........................................................................................................................43
CPU Utilization counters.....................................................................................................43 CPU Event counters ...........................................................................................................43 Java-specific CPU counters................................................................................................44
Disk counters..........................................................................................................................44 Network I/O counters..............................................................................................................44 User counters .........................................................................................................................45
Garbage Collectors.............................................................................................................45 Image Services counters ...........................................................................................................46
Disk counters..........................................................................................................................46 Document Services counters .................................................................................................47 Event Logging Abstract (ELA) Events....................................................................................52 File System counters..............................................................................................................53 Miscellaneous Static Variables counters................................................................................54 MKF counters .........................................................................................................................55 Network counters ...................................................................................................................61 OSAR Server counters...........................................................................................................67 PPM counters .........................................................................................................................67 RPC counters .........................................................................................................................68
DOC counters .....................................................................................................................68 System counters.....................................................................................................................68 Virtual Memory counters ........................................................................................................72 WorkFlo counters ...................................................................................................................76
Process Engine counters ...........................................................................................................77 Error counters.........................................................................................................................77 RPC counters .........................................................................................................................79
Notices...........................................................................................................................................80 Trademarks ................................................................................................................................81 U. S. Patents Disclosure ............................................................................................................82
Glossary.........................................................................................................................................83 Index ..............................................................................................................................................85
August 2009 IBM System Dashboard for Enterprise Content Management User’s Guide 6

Document revision history Version Date Comment 4.5.0 March 2009 Initial release.
4.5.0 May 2009 Changed references to the IBM FileNet Dashboard to IBM System Dashboard for Enterprise Content Management.
Changed references to the IBM FileNet P8 Usage Reporter to IBM System Usage Reporter.
Updated the file names of the Dashboard installers.
4.5.1 August 2009 Added a statement that previous versions of the Dashboard must be uninstalled before installing Dashboard 4.5.1.
Added information on silent installation and the options.txt files.
Added several Process Engine counters.
August 2009 IBM System Dashboard for Enterprise Content Management User’s Guide 7

IBM System Dashboard for Enterprise Content Management
Overview The IBM® System Dashboard for Enterprise Content Management is a performance monitoring tool that IBM distributes with many of its FileNet products and suites for both Windows® and UNIX® servers. The Dashboard displays real-time performance data that system administrators and operators can use to proactively identify and resolve potential performance problems before they occur. The performance data can also be archived for management reporting and trend analysis.
In addition, the IBM System Usage Reporter is also installed with the Dashboard. The Usage Reporter is an administrative tool that monitors the number of users who access FileNet products and provides both near real-time and historical usage information. You can find more information about this application in the IBM System Usage Reporter Reference Guide (Usage_Reporter.pdf).
IBM also offers the IBM FileNet System Monitor. While the Dashboard is a performance monitoring tool that tracks information such as application-specific events, the System Monitor continually monitors the health of FileNet systems and alerts administrators to critical errors.
System Dashboard Features The System Dashboard includes the following features:
• Real-time data from multiple components, such as Content Engine and Process Engine, can be viewed concurrently
• Capture and display of operating system statistics and environmental data:
Operating system name and version number Number and architecture of CPUs CPU load Disk I/O Network I/O Memory utilization (amount of memory available)
• Capture and display of FileNet-specific data:
RPC counts and durations Application-specific Events, such as “Document Creations” in the Content Engine Application-specific Metrics, such as "Folder Cache Entries” in the Content Engine
• Capture and display of environmental data:
Configuration Version and patch level Java® applications will provide information about the Java Runtime version number and maximum memory
• User-defined charts of summary and detailed data
• Alerts tab that displays all urgent messages received from applications and when connection to applications is lost
• Ability to define and run reports and save them into comma-separated value (CSV) files
• Data can be archived/saved for historical analysis and management reporting
August 2009 IBM System Dashboard for Enterprise Content Management User’s Guide 8

IBM System Dashboard for Enterprise Content Management
• Minimal overhead in production environments – listeners are built into the ECM components
• Listener agents that can gather data from other applications that can be displayed in the Dashboard
System Dashboard components The Listener is a software component that receives a stream of events and other information from an individual FileNet application. It is the equivalent of an “agent” in the SNMP world. Listeners wait passively for Managers to connect to them and inquire about their performance counter values. In the absence of a Manager connection, the presence of the Listener component is nearly invisible to an outside observer. Listeners are implemented in the various FileNet components and products listed below. The Listener API is available in C++ and Java.
The Dashboard is a Java-based application that provides a graphical interface of your current FileNet systems. The Dashboard is compatible with the various FileNet suites and products listed in the next section.
Supported products The following products support the Dashboard:
Product Components Included
Business Process Manager (BPM) • Listeners for the Application Engine, Content Engine, and Process Engine
• Dashboard
Content Federation Services - Image Services (CFS-IS)
• Listener for CFS-IS • Dashboard
Content Manager (CM) • Listeners for the Application Engine, Content Engine and Process Engine
• Dashboard
Image Manager (IM) • Listener for Image Services (IS) • Dashboard
Image Services Resource Adapter (ISRA)
• Listener for ISRA • Dashboard
Records Manager (RM) • Listener for RM • Dashboard
IDM Web Services/Open Client • Listener for Web Services and Open Client • Dashboard
Workplace • Listener for Workplace • Dashboard
Workplace XT • Listener for Workplace XT • Dashboard
August 2009 IBM System Dashboard for Enterprise Content Management User’s Guide 9

IBM System Dashboard for Enterprise Content Management
Installing the Dashboard You can install Dashboard 4.5.1 as a fresh installation on a new FileNet server or as an upgrade to a previous version of the Dashboard.
Important: Before you upgrade to Dashboard 4.5.1, you must uninstall the current version. See Uninstalling the Dashboard for more information.
Dashboard 4.5.1 uses the InstallShield MultiPlatfrom (ISMP) installer, which relies on the presence of a suitable Java Virtual Machine (JVM) on the target system to support the installation process. JVM version 1.4 or higher is required.
Supported JVMs The set of JVMs supported by InstallShield varies by operating system. The installer searches only a set of standard locations to find a suitable JVM to use. See the table of Supported JVMs for each operating system.
If you have a supported JVM installed, but it is not found automatically, you can use a command-line flag to specify the location, which must contain only one of the listed JVM versions. The following example is for Solaris:
./SOL_ECMDashboard.bin -is:javahome directory_path
where directory_path is the root directory of the Java installation, not the bin sub-directory.
Graphical and Silent Installation You can install the Dashboard in standard graphical mode or in silent mode. In graphical mode, the installation program prompts you for information. In silent mode, the installation program gets the information it needs from an options.txt file—nothing displays on your screen.
To install the Dashboard silently, that is, with no screen output, add the –silent and –options flags to the command:
./SOL_ECMDashboard.bin -silent -options file_path
where file_path is the full path of the installation options file, including the file name.
The Dashboard software contains two options.txt files: Unix/options.txt and Windows/options.txt. The options file contains the standard responses to the installation program's prompts.
1. Locate the appropriate file for your server in the Dashboard directory.
2. View the options and their default values, which are fully described in the file.
3. If you decide to modify any of the defaults for your Dashboard installation, copy the file to a temporary directory. (You can rename the file to something shorter, such as opt.txt.) Use your preferred text editor to make the changes and save the file.
Keep in mind that the command you enter depends on the operating system of your server. On Windows servers, the directory separator character is a back slash (\) as opposed to a forward slash (/) for UNIX servers.
Note: The System Usage Reporter is automatically installed with the Dashboard. See the IBM System Usage Reporter Reference Guide (Usage_Reporter.pdf) for more information.
August 2009 IBM System Dashboard for Enterprise Content Management User’s Guide 10

IBM System Dashboard for Enterprise Content Management
UNIX installation procedure You can be logged in as any user to perform the installation.
However, if you install the Dashboard on an AIX server as a user other than root, you will not be able to use the AIX system management tools, such as SMITTY, to remove the Dashboard or display information about it.
To install in a UNIX environment:
1. If an earlier release of Dashboard is already installed on your server, uninstall it by following the steps in the section, Uninstalling the Dashboard.
2. Locate the installer that matches the operating system on your server. Graphical installation Start the installer by entering the appropriate command at the system prompt:
• AIX_ECMDashboard.bin
• HPUX11_ECMDashboard.bin
• Linux_ECMDashboard.bin
• SOL_ECMDashboard.bin
Silent installation To install the Dashboard silently (with no screen output), add the –silent and –options flags to the command. The following example is for AIX:
./AIX_ECMDashboard.bin -silent -options /Dashboard/Unix/options.txt If you copied and modified the options.txt file, the command might look like this: ./AIX_ECMDashboard.bin -silent -options /fnsw/local/tmp/opt.txt
Be sure to specify the full path to the options.txt file.
During a silent installation, the following prompts do not display.
3. At the Welcome page, click Next.
4. Accept the license agreement terms, and click Next.
5. Specify the location where you want to install the Dashboard, and click Next.
6. Choose the type of installation, either Typical or Custom, and click Next.
7. Review the summary information, and click Next.
8. Click Finish to complete the installation process.
August 2009 IBM System Dashboard for Enterprise Content Management User’s Guide 11
IBM System Dashboard for Enterprise Content Management
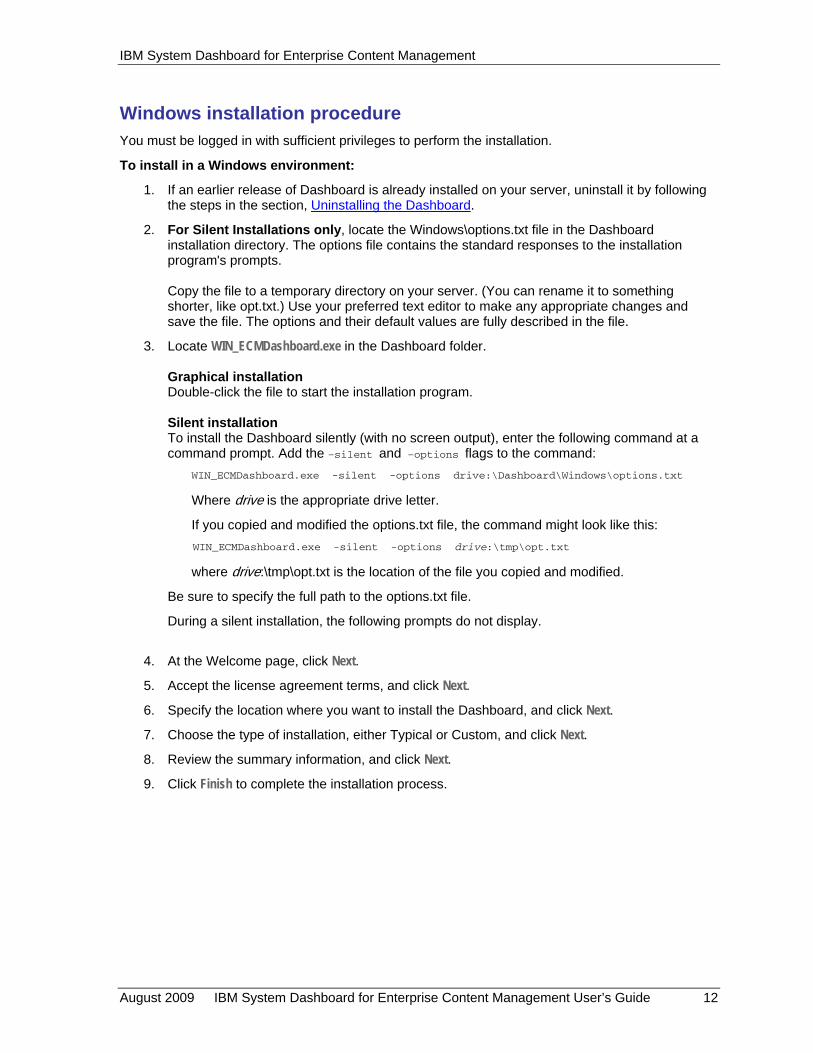
Windows installation procedure You must be logged in with sufficient privileges to perform the installation.
To install in a Windows environment:
1. If an earlier release of Dashboard is already installed on your server, uninstall it by following the steps in the section, Uninstalling the Dashboard.
2. For Silent Installations only, locate the Windows\options.txt file in the Dashboard installation directory. The options file contains the standard responses to the installation program's prompts. Copy the file to a temporary directory on your server. (You can rename it to something shorter, like opt.txt.) Use your preferred text editor to make any appropriate changes and save the file. The options and their default values are fully described in the file.
3. Locate WIN_ECMDashboard.exe in the Dashboard folder. Graphical installation Double-click the file to start the installation program. Silent installation To install the Dashboard silently (with no screen output), enter the following command at a command prompt. Add the –silent and –options flags to the command:
WIN_ECMDashboard.exe -silent -options drive:\Dashboard\Windows\options.txt
Where drive is the appropriate drive letter.
If you copied and modified the options.txt file, the command might look like this: WIN_ECMDashboard.exe -silent -options drive:\tmp\opt.txt
where drive:\tmp\opt.txt is the location of the file you copied and modified.
Be sure to specify the full path to the options.txt file.
During a silent installation, the following prompts do not display.
4. At the Welcome page, click Next.
5. Accept the license agreement terms, and click Next.
6. Specify the location where you want to install the Dashboard, and click Next.
7. Choose the type of installation, either Typical or Custom, and click Next.
8. Review the summary information, and click Next.
9. Click Finish to complete the installation process.
August 2009 IBM System Dashboard for Enterprise Content Management User’s Guide 12

IBM System Dashboard for Enterprise Content Management
Supported JVMs AIX Solaris HP-UX
aix_power\ibm_aix_14.jvm aix_power\ibm_aix_141.jvm aix_power\ibm_aix_142.jvm aix_power\ibm_aix_142_64.jvm aix_power\ibm_aix_14x.jvm aix_power\ibm_aix_14x_64.jvm aix_power\ibm_aix_15x.jvm aix_power\ibm_aix_15x_64.jvm aix_power\ibm_aix_16x.jvm aix_power\ibm_aix_16x_64.jvm
solaris\sun.jdk.1.4.2.solaris.jvm solaris\sun.jre.1.4.0.solaris.jvm solaris\sun.jre.1.4.1.solaris.jvm solaris\sun.jre.1.4.1.solaris64.jvm solaris\sun.jre.1.4.2.solaris.jvm solaris\sun.jre.1.4.2.solaris64.jvm solaris\sun.jre.1.4x.solaris.jvm solaris\sun.jre.1.5.0.solaris.jvm solaris\sun.jre.1.5.0.solaris64.jvm solaris\sun.jre.1.5x.solaris.jvm solaris\sun.jre.1.5x.solaris64.jvm solaris\sun.jre.1.6x.solaris.jvm solaris\sun.jre.1.6x.solaris64.jvm
hpux\hp_hpux_14x.jvm hpux\hp_hpux_15x.jvm
Linux Windows
linux\ibmjre140.jvm linux\ibmjre141.jvm linux\ibmjre142.jvm linux\ibmjre14X.jvm linux\ibmjre15X.jvm linux\ibmjre16X.jvm linux\sunjdk14.jvm linux\sunjdk141.jvm linux\sunjdk142.jvm linux\sunjdk15.jvm linux\sunjdk16.jvm linux\sunjre14.jvm linux\sunjre141.jvm linux\sunjre142.jvm linux\sunjre15.jvm linux\sunjre16.jvm
win32\ibm_win32_14.jvm win32\ibm_win32_142.jvm win32\ibm_win32_16x.jvm win32\sun_win32_14.jvm win32\sun_win32_141.jvm win32\sun_win32_142.jvm win32\sun_win32_14x.jvm win32\sun_win32_15.jvm win32\sun_win32_15x.jvm win32\sun_win32_16x.jvm
August 2009 IBM System Dashboard for Enterprise Content Management User’s Guide 13
IBM System Dashboard for Enterprise Content Management
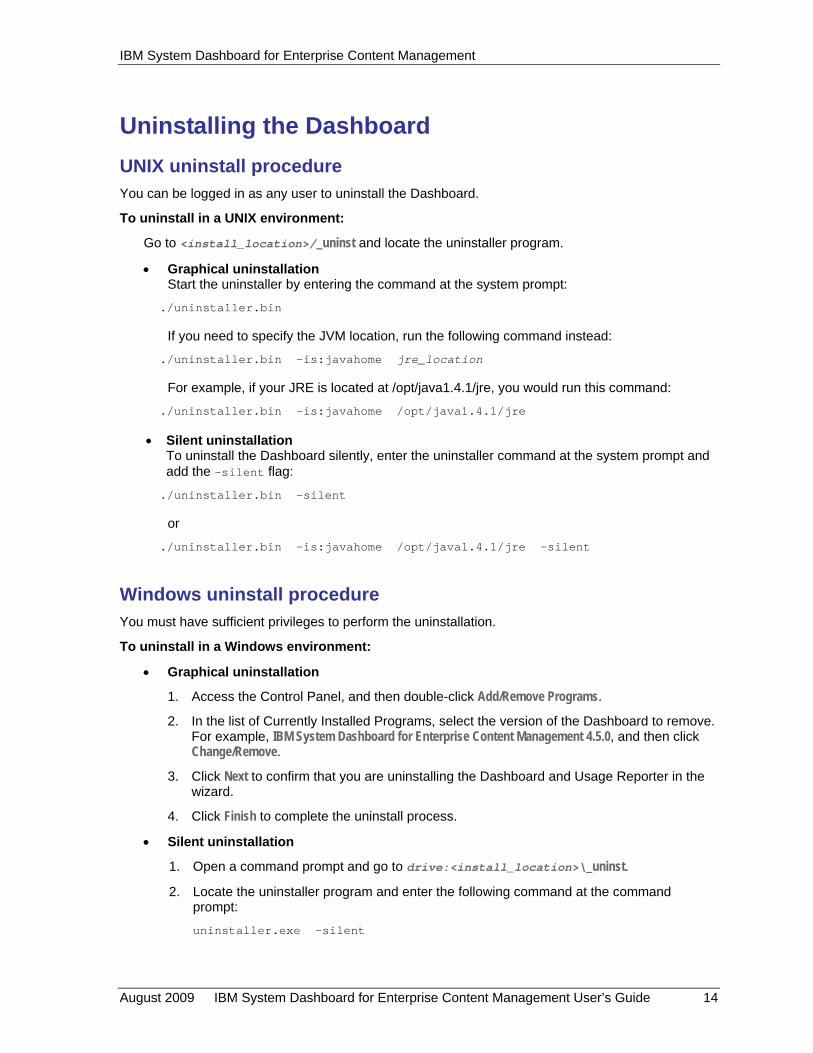
Uninstalling the Dashboard UNIX uninstall procedure You can be logged in as any user to uninstall the Dashboard.
To uninstall in a UNIX environment:
Go to <install_location>/_uninst and locate the uninstaller program.
• Graphical uninstallation Start the uninstaller by entering the command at the system prompt:
./uninstaller.bin
If you need to specify the JVM location, run the following command instead:
./uninstaller.bin -is:javahome jre_location
For example, if your JRE is located at /opt/java1.4.1/jre, you would run this command:
./uninstaller.bin -is:javahome /opt/java1.4.1/jre
• Silent uninstallation To uninstall the Dashboard silently, enter the uninstaller command at the system prompt and add the –silent flag:
./uninstaller.bin -silent
or
./uninstaller.bin -is:javahome /opt/java1.4.1/jre -silent
Windows uninstall procedure You must have sufficient privileges to perform the uninstallation.
To uninstall in a Windows environment:
• Graphical uninstallation
1. Access the Control Panel, and then double-click Add/Remove Programs.
2. In the list of Currently Installed Programs, select the version of the Dashboard to remove. For example, IBM System Dashboard for Enterprise Content Management 4.5.0, and then click Change/Remove.
3. Click Next to confirm that you are uninstalling the Dashboard and Usage Reporter in the wizard.
4. Click Finish to complete the uninstall process.
• Silent uninstallation
1. Open a command prompt and go to drive:<install_location>\_uninst.
2. Locate the uninstaller program and enter the following command at the command prompt:
uninstaller.exe -silent
August 2009 IBM System Dashboard for Enterprise Content Management User’s Guide 14

IBM System Dashboard for Enterprise Content Management
Dashboard views Dashboard provides the following five views:
Views Description
Summary This is the default view. After the appropriate parameters are configured, the Summary view provides “high-level” status of the health of the entire collection of servers being monitored. See Summary view for more information.
Details This view provides real-time data that is updated at the intervals you have configured. Available data includes both system and application-specific metrics. See Details view for more information.
Clusters This view is used to configure the servers that you want the Dashboard to monitor. You can define one or more clusters (collections of hosts) to monitor. Each cluster definition can also include an Interval setting, which defines how frequently you want to sample data from the applications within that cluster. Cluster definitions can be saved for future use. See Clusters view for more information.
Alerts This view displays urgent messages that notify administrators of possible problems, such as a lost connection to a listener. See Alerts view for more information.
Reports This view allows you to define or modify report templates and run reports against data available in the Details view. The reports are written to comma-separated-value (CSV) files that can easily be imported into other tools, such as spreadsheets, for analysis. See Reports view for more information.
In addition to the five views, a Messages box is always present, regardless of the view you access. The Message box displays messages that identify the Listeners to which the Dashboard connects, fails to connect to, or to which the connection is lost.
Any custom messages, heartbeat results, or up time results received from Listeners are displayed in the Messages box as they are received.
The File menu allows you to save, and open previously configured cluster settings and reports.
August 2009 IBM System Dashboard for Enterprise Content Management User’s Guide 15
IBM System Dashboard for Enterprise Content Management
Summary view The Summary view provides a high-level view of the current health of the system. It displays two separate graphs:
• The first graph plots the average response time (in milliseconds) for all the enabled Remote Procedure Calls (RPCs).
• The second graph displays the most recently received average response time and average CPU utilization of the servers within the specified cluster.
Before accessing this view, make sure the Dashboard is configured to collect data from a system. Use the Cluster view to create and edit existing hosts you want to monitor.
After you configure the Dashboard, you can specify cluster and server information from which you want to chart data in the two graphs displayed on this view. See Accessing a cluster and Customizing service selection and time range for more information.
Details view The Details view provides a hierarchical view of all the performance data received from listeners found within the defined clusters. See Viewing data and Accessing Listener tasks for more information.
Note Highlight, and then right-click the Listener type nodes to access additional Listener tasks. See Accessing Listener tasks for descriptions of the tasks and more information.
This view is set up with the structure:
Cluster node – Corresponds to the clusters created.
Server node – Corresponds to the servers configured for monitoring.
Listener type – Matches the service of the application being monitored.
RPC – List of the available Remote Procedure Calls for monitoring. RPC duration is measured in nanoseconds in the Details view.
DISK – List of the available storage-related metrics.
NETWORK – List of the available network-related metrics.
CPU – List of the available CPU-related metrics.
USER – List of the non-RPC metrics being collected by the application.
Environment – Lists the Environmental and Static data received from this listener.
August 2009 IBM System Dashboard for Enterprise Content Management User’s Guide 16

IBM System Dashboard for Enterprise Content Management
Clusters view Use this view to configure the Dashboard and specify the servers that need to be monitored. You define one or more clusters (collections of hosts) that you want to monitor in this view. You can save the cluster definitions for future use.
You also determine the schedule in which information is collected. You define how often (in seconds) and how much data (default is 500 values) is collected from the clusters you are monitoring in this view.
Configure the Dashboard before using the other views.
See Configuring Dashboard and Defining a cluster for more information.
Alerts view The Alerts view displays all urgent messages. For example, if a connection to a listener is lost, an alert message in red appears in this view notifying you of the problem. The urgent messages remain in this view until you manually delete them.
In addition to listing lost connections in the Urgent Message section, any critical levels above Info appear in red in the Message section. They also appear in the Urgent Message section with warnings and more information. The importance of each message is also displayed and appear in red or black text.
See Deleting urgent messages for more information on deleting messages from this view.
Reports view The Reports view works similarly to the Clusters view. You can:
• create new report templates.
• add and delete metrics from defined templates.
• create reports using a template and data captured from a Listener.
• create a special report that can be used as input to Scout (a system capacity planning tool). This report does not require a custom report template.
Currently, a report must be run against the data from a single Listener. See Working with a report template for more information on generating reports. For more information on generating a Scout report, see Running a Scout Report.
August 2009 IBM System Dashboard for Enterprise Content Management User’s Guide 17

IBM System Dashboard for Enterprise Content Management
Configuring the Dashboard Before you can use the Dashboard, you must first configure it to collect data from a system.
To start the Dashboard:
• In a Windows environment, highlight Programs from the Start menu, click IBM FileNet P8 Platform, and then select Dashboard.
• In a UNIX environment, launch the manager shell script called Dashboard from the directory containing the required jar files.
Use the Clusters view to create and edit existing cluster definitions, which list the hosts you want to monitor.
Defining a cluster You work with clusters in the Clusters view. Defining a cluster means you can:
• adding a new cluster
• adding servers you want to monitor
• saving a cluster
• accessing an existing cluster
You can also access the cluster you define from the Summary view and Details view. See Summary view and Details view for more information.
To add a cluster:
1. Click the Clusters view, and then click New to create a new cluster.
2. In the Add Cluster dialog box, enter a name for the cluster for which you are defining, and then click OK. The name is usually related to the function of the cluster, such as “Customer Account Self Service”.
To add servers that you want to monitor:
1. Under Defined Clusters, highlight the cluster you just created, and then click Edit. You can also double-click the cluster’s name.
2. In the Edit Cluster dialog box, click Add to select the servers you want to monitor.
Notes:
o You can enter the collection interval (in seconds) in the Interval (seconds) parameter box. Specifying a collection interval can help make the task of analyzing data for an entire cluster much easier because the times reported will be the same as will the information produced and collected during a specific interval. If you leave this field blank, the Dashboard will not change the aggregation intervals of the Listeners it connects to within this cluster. Instead it will receive data from them on their existing collection schedule.
o The interval setting is ignored by the Image Manager and Process Engine Listeners. Their interval is determined by the polling schedule set in the configuration file perf_mon.script.
o You can configure the number of data points, regardless of the collection interval, the Dashboard will save in memory. By default, the Dashboard stores 500 data points. You can configure this parameter by editing the value under the Maximum data points parameter.
August 2009 IBM System Dashboard for Enterprise Content Management User’s Guide 18

IBM System Dashboard for Enterprise Content Management
3. In the Host Information dialog box, enter the name or IP address of the server you want monitored under the Add Host parameter. Normally, the TCP port number displayed does not need to be changed, as it is the default value used by the Listeners.
4. Click OK to add this host to the list of hosts in this cluster. Repeat steps 5 and 6 until all hosts within this cluster are added.
To save a cluster:
Your existing clusters appear under Defined Clusters in the Cluster view. You can save your cluster settings for future use and they can be saved from any of the views. Cluster settings are saved to an XML file. Clusters you save can be accessed later from the Summary view and Details view. See Summary view and Details view for more information.
• From the File menu, click Save Clusters. Enter the name and location to you which you want to save the file.
To access existing clusters:
1. From the File menu, click Open Clusters.
2. Navigate to the folder containing the saved Cluster settings.
Highlight the appropriate XML file, and then click Open.
Starting the Listener on Image Services servers and Process Engine servers Most FileNet products that support the Dashboard, such as CM, ISRA, RM, and so on, make the Listener active by default. However, you must activate the Listener explicitly on an Image Services server or a Process Engine server. To turn on the Listener automatically whenever Image Services or Process Engine is started, complete the following steps.
1. Go the /fnsw/local/sd directory (UNIX) or drive:\fnsw_loc\sd (Windows) to see if a perf_mon.script file exists.
• If a perf_mon.script already exists, skip to Step 2.
• If a perf_mon.script does not exist, create one by copying it from /fnsw/lib/perf/ (UNIX) or drive:\fnsw\lib\perf (Windows).
cp /fnsw/lib/perf/perf_mon.script /fnsw/local/sd/perf_mon.script
(Copy to drive:\fnsw_loc\sd on a Windows server.)
August 2009 IBM System Dashboard for Enterprise Content Management User’s Guide 19
IBM System Dashboard for Enterprise Content Management
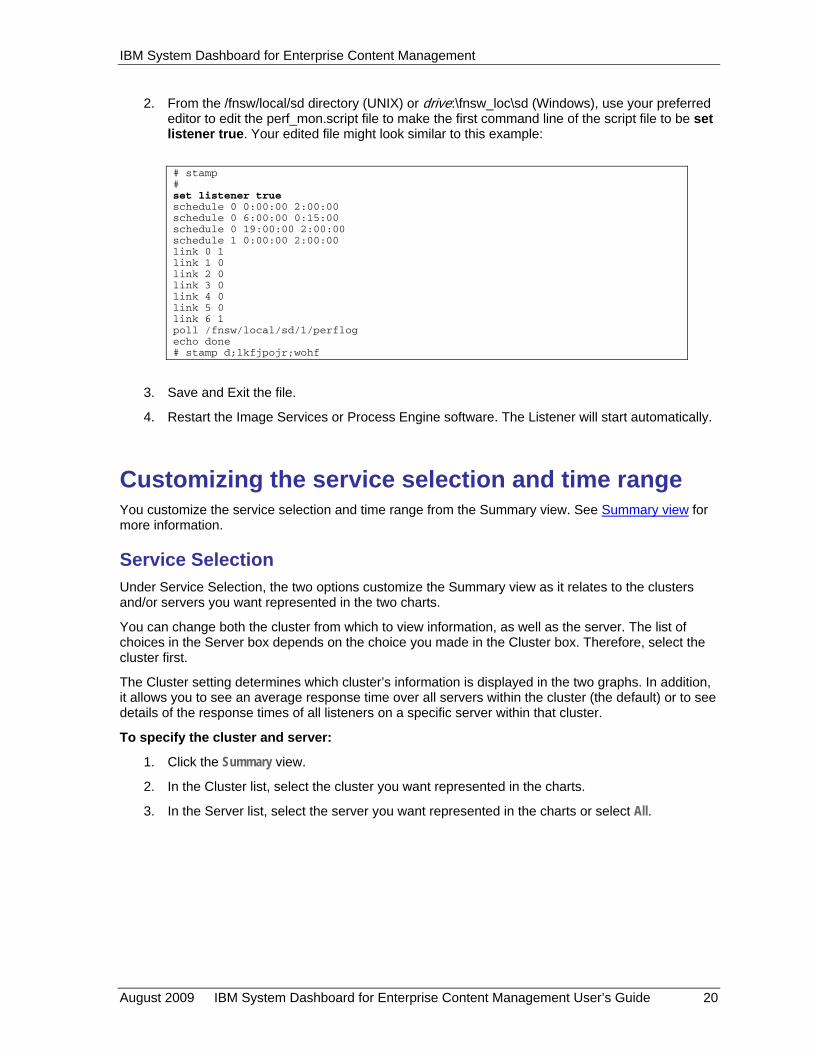
2. From the /fnsw/local/sd directory (UNIX) or drive:\fnsw_loc\sd (Windows), use your preferred editor to edit the perf_mon.script file to make the first command line of the script file to be set listener true. Your edited file might look similar to this example:
# stamp # set listener true schedule 0 0:00:00 2:00:00 schedule 0 6:00:00 0:15:00 schedule 0 19:00:00 2:00:00 schedule 1 0:00:00 2:00:00 link 0 1 link 1 0 link 2 0 link 3 0 link 4 0 link 5 0 link 6 1 poll /fnsw/local/sd/1/perflog echo done # stamp d;lkfjpojr;wohf
3. Save and Exit the file.
4. Restart the Image Services or Process Engine software. The Listener will start automatically.
Customizing the service selection and time range You customize the service selection and time range from the Summary view. See Summary view for more information.
Service Selection Under Service Selection, the two options customize the Summary view as it relates to the clusters and/or servers you want represented in the two charts.
You can change both the cluster from which to view information, as well as the server. The list of choices in the Server box depends on the choice you made in the Cluster box. Therefore, select the cluster first.
The Cluster setting determines which cluster’s information is displayed in the two graphs. In addition, it allows you to see an average response time over all servers within the cluster (the default) or to see details of the response times of all listeners on a specific server within that cluster.
To specify the cluster and server:
1. Click the Summary view.
2. In the Cluster list, select the cluster you want represented in the charts.
3. In the Server list, select the server you want represented in the charts or select All.
August 2009 IBM System Dashboard for Enterprise Content Management User’s Guide 20

IBM System Dashboard for Enterprise Content Management
Time Range You specify a range of time you want reflected in the Average Response Time chart.
To select a time range:
1. Click the Summary view.
2. In the Start list, select the starting time.
3. In the End list, select the ending time.
Viewing data You access data from the Details view. See Details view for more information.
Note Highlight, and then right-click the Listener type nodes to access additional Listener tasks. See Accessing Listener tasks for descriptions of the tasks and more information.
To view data:
1. Click the Details view.
2. Double-click the cluster node containing the servers from which you want to obtain data.
3. Expand the nodes corresponding to the servers from which you want to obtain data.
4. Expand the Listener node.
5. Expand the Event Classes nodes to view the statistics from the metric of interest.
6. Highlight the metric to view the data.
Nodes in the tree that represent containers (logical groupings of Events and Meters) do not display any data in the window on the right.
Listener, Event, Meter, and Accumulator nodes display data in the window on the right. Notice that Events, Meters, and Accumulators display different columns in the table on the right.
Note: Currently, the implementation of the Listener for Image Services and the Performance Engine do not report min, max, or standard deviation for Meters and Accumulators; therefore, these columns are filled in with values from the Value or Average columns or zeros, as appropriate.
To chart data:
1. Right-click the metric, and then select Chart <NodeType> Data.
Notes:
o When rate data is available, you can graph it by selecting Chart Event Rate Data.
o Multiple charts can be displayed concurrently, and they update automatically as new data is received.
2. From the Chart menu, click Options to customize your charts.
August 2009 IBM System Dashboard for Enterprise Content Management User’s Guide 21

IBM System Dashboard for Enterprise Content Management
Accessing Listener tasks You access Listener tasks from the Details view. See Details view for more information.
You can perform a number of tasks on a listener and access the tasks from the Listener node.
To access listener tasks:
1. Click the Details view.
2. Right-click a Listener node in the tree and refer to the following table for a list of tasks and descriptions:
Task Description
Disconnect this Listener Disconnect from that listener (useful particularly for a listener that has gone down and whose historical data is no longer needed).
Request heartbeat Query the listener for the health status of its application (heartbeat).
Request uptime Query the listener for its application’s uptime.
Send custom message Send a custom message to that listener.
Archive History Allows you to save off the historical data maintained by this listener. To read the archived data, see Opening an archive file.
Request user list (Content Engine 4.5 or higher only) Display a list of currently logged in users and the number of RPCs.
Deleting urgent messages You access urgent messages from the Alerts view. The messages remain in this view until you manually delete them. See Alerts view for more information.
To delete urgent messages:
1. Click the Alerts view.
2. Highlight the messages you want to delete, and then click Dismiss.
August 2009 IBM System Dashboard for Enterprise Content Management User’s Guide 22

IBM System Dashboard for Enterprise Content Management
Working with a report template A report template defines the metrics whose values you want to include in your reports. Each template has a name that you can define. You can save in a single XML file, and later reload, a set of report templates that can be used repeatedly.
You define reports from the Reports view. See Reports view for more information.
To define a report template:
1. Click the Reports view.
2. Click New to create a report template.
3. Enter a name for the report, and then click OK.
4. Highlight the created report, and then click Edit. Alternatively, double-click the report’s name.
5. Highlight the Event, Meter, or Accumulator you want to report.
6. Do one of the following actions:
o To add only that metric, click Add to Template.
o To add that metric, as well as any subordinate metrics, click Add with children. The Add with children button can also be used when an Event Class (such as “CPU”) or a Listener name is selected in the tree.
7. Repeat the previous steps until all of the metrics are added.
8. After you add all the metrics to the template, click OK.
9. Save the template.
Saving a report template To save a report template:
• From the File menu, click Save Report Templates to save your new template definition.
Editing a report template You access a report from the Reports view. See Reports view for more information.
To edit a report template:
1. Click the Reports view.
2. Highlight the created report, and then click Edit. Alternatively, double-click the report’s name.
3. In the tree view on the left, find the Event, Meter, or Accumulator that you wish to report and highlight it.
4. To add only that metric, click Add to Template. To add that metric, as well as any subordinate metrics, click Add with children. The Add with children button may also be used when an Event Class (such as “CPU”) or a Listener name is selected in the tree.
5. Repeat step the previous step until all metrics are added.
6. Once you’ve added all the metrics to the template, click OK.
7. Save the revised template. See Saving a report template for more information.
August 2009 IBM System Dashboard for Enterprise Content Management User’s Guide 23

IBM System Dashboard for Enterprise Content Management
Running a report Running a report allows you to export the captured data to a comma-delimited file. Prior to running a report, make sure the data captured covers the time period of interest. For example, if you want to restrict the length of the report to the past 24 hours, specify the 24-hour period you are interested in. The amount of data collected in the report is dependent on the time period you specify prior to running the report and the schedule in which information is collected defined in the Clusters view.
Note: If you are running the Dashboard on a different system from the host that is being analyzed, Dashboard synchronizes the time, regardless of time zones, for all of the Listeners within a cluster. Specifying a collection interval can help make the task of analyzing data for an entire cluster much easier because the times reported will be the same as will the information produced and collected during a specific interval. Keep in mind that the interval setting defined in the Clusters view is ignored by the Image Manager and Process Engine Listeners. Their interval is determined by the polling schedule set in the configuration file perf_mon.script.
You run a report from the Reports view. See Reports view for more information.
To run a report:
1. From the Reports view, highlight the report template you want to use, and then click Run.
2. From the tree view on the left, select the Listener from which you want the report to be run. You can also use the check boxes under the Options parameter to send additional information to the report.
3. On the right side, select the length of the report in hours under Length in hours.
4. Under To, select the end of the time period for which to report the data.
Use both the Length in hours and To fields to restrict the length of the report to focus on a specific time period.
5. Under Output To, specify the path and output file name of the generated report. You can also click the ellipsis button to specify a location. The format of the generated report is a comma-separated-value (CSV) file, so an extension of .csv is recommended. If you do not specify an extension for the report you are generating, a default .csv extension is used for the reports.
6. To generate the report, click Run. The report is created and the Run Report dialog box is closed. If any errors occur, they are reported and the dialog box remains on screen allowing you to fix the errors and try again.
You can open your finished report with software tools from other vendors, such as a spreadsheet program, allowing you to further analyze the information and create charts of the data.
August 2009 IBM System Dashboard for Enterprise Content Management User’s Guide 24

IBM System Dashboard for Enterprise Content Management
Running a Scout report Running a Scout report allows you to export the captured data to a comma-delimited file that can be used as input to the FileNet Scout system configuration and output tool. Your IBM FileNet representative can give you more information about the Scout tool, which is used by field service personnel for forecasting and planning system capacity requirements.
You might run a Scout report if you are planning to expand your IBM FileNet system. For example, you might want to determine how many more CPUs you would need if your work load increased by 40% in the next year. The Scout report gives a baseline measurement of your current system configuration that field service personnel can input to the Scout tool to do the projection.
The process of running a Scout report is very similar to the process of running a regular report. However, the Scout report uses a standard template, so you do not define which metrics are collected and you do not use a report template.
Note: If you are running the Dashboard on a different system from the host that is being analyzed, Dashboard synchronizes the time, regardless of time zones, for all of the Listeners within a cluster. Specifying a collection interval can help make the task of analyzing data for an entire cluster much easier because the times reported will be the same as will the information produced and collected during a specific interval. Keep in mind that the interval setting defined in the Clusters view is ignored by the Image Manager and Process Engine Listeners. Their interval is determined by the polling schedule that is set in the configuration file perf_mon.script.
You run a Scout report from the Reports view. See Reports view for more information.
To run a Scout report:
1. From the Reports view, click Scout. The Scout report uses a standard report template so you do not need to select a custom report template.
2. When the Scout window displays, select the Listener from which you want the report to be run.
3. On the right side, select the length of the report in hours under Length in hours.
4. Under To, select the end of the time period for which to report the data.
Use both the Length in hours and To fields to restrict the length of the report to focus on a specific time period.
5. Under Output To, specify the path and output file name of the generated report. You can also click the ellipsis button to specify a location. The format of the generated report is a comma-separated-value (CSV) file, so an extension of .csv is recommended. If you do not specify an extension for the report you are generating, a default .csv extension is used for the reports.
6. To generate the report, click Run. The report is created and the Scout dialog box closes. If any errors occur, they are reported and the dialog box remains on screen allowing you to fix the errors and try again.
Your finished report can then be used as input to the Scout tool, which can estimate your future system requirements, based on the current configuration of your system.
August 2009 IBM System Dashboard for Enterprise Content Management User’s Guide 25
IBM System Dashboard for Enterprise Content Management
Archiving Manager The Archiving Manager is a command-line utility that gathers data needed for later analysis. Specifically, the Archiving Manager collects data from either a listener or a collection of listeners as defined in a cluster definition. The Archiving Manager can be run from any server able to connect to the specified listeners. It saves data in a format recognized by the Dashboard.
See Archiving Manager flags and Opening an archive file for more information.
Archiving Manager syntax The Archiving Manager uses the following syntax:
java –jar archiver.jar [flags] cluster.xml
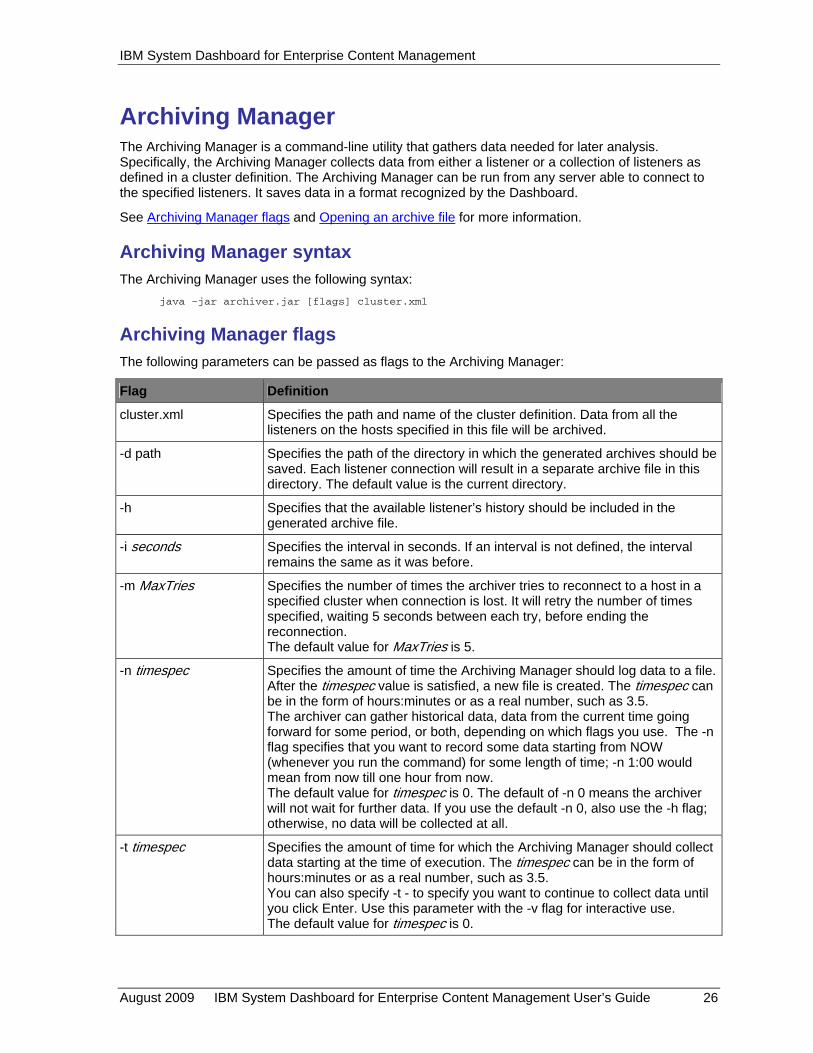
Archiving Manager flags The following parameters can be passed as flags to the Archiving Manager:
Flag Definition
cluster.xml Specifies the path and name of the cluster definition. Data from all the listeners on the hosts specified in this file will be archived.
-d path Specifies the path of the directory in which the generated archives should be saved. Each listener connection will result in a separate archive file in this directory. The default value is the current directory.
-h Specifies that the available listener’s history should be included in the generated archive file.
-i seconds Specifies the interval in seconds. If an interval is not defined, the interval remains the same as it was before.
-m MaxTries Specifies the number of times the archiver tries to reconnect to a host in a specified cluster when connection is lost. It will retry the number of times specified, waiting 5 seconds between each try, before ending the reconnection. The default value for MaxTries is 5.
-n timespec Specifies the amount of time the Archiving Manager should log data to a file. After the timespec value is satisfied, a new file is created. The timespec can be in the form of hours:minutes or as a real number, such as 3.5. The archiver can gather historical data, data from the current time going forward for some period, or both, depending on which flags you use. The -n flag specifies that you want to record some data starting from NOW (whenever you run the command) for some length of time; -n 1:00 would mean from now till one hour from now. The default value for timespec is 0. The default of -n 0 means the archiver will not wait for further data. If you use the default -n 0, also use the -h flag; otherwise, no data will be collected at all.
-t timespec Specifies the amount of time for which the Archiving Manager should collect data starting at the time of execution. The timespec can be in the form of hours:minutes or as a real number, such as 3.5. You can also specify -t - to specify you want to continue to collect data until you click Enter. Use this parameter with the -v flag for interactive use. The default value for timespec is 0.
August 2009 IBM System Dashboard for Enterprise Content Management User’s Guide 26

IBM System Dashboard for Enterprise Content Management
Flag Definition
-v Specifies a verbose mode, where you can indicate when an archiver is receiving data. This setting is useful when you use the Archive Manager interactively and identify when an activity is occurring.
Opening an archive file You can open an archive file for analysis within the Dashboard.
To open an archive file:
• From the File menu, select the Open Archive option.
After the archive file is loaded, its data is placed in a virtual cluster named “Archives.” You can then manipulate the data in the same manner as data received from Listener connections. You can also open more than one archive.
August 2009 IBM System Dashboard for Enterprise Content Management User’s Guide 27

IBM System Dashboard for Enterprise Content Management
Interpreting counters Dashboard exposes counters that are generated by the various FileNet software products you want to monitor. For each product, related counters and their definitions are listed in the following topics. Use the information for each product to help you interpret the counters that are displayed by the Dashboard.
• Content Engine counters
• Dashboard counters
• Image Services counters
• Process Engine counters
Content Engine counters The following CE counters are defined:
• Centera Counters
• CBR/Verity counters
• CFS-IS Import Agent Counters
• Content Retrieval Counters
• Content Upload Counters
• Content Update Counters (Roll Forward Processing) Requests Processed
• Content Update Counters (Roll Forward Processing) Requests Queued
• Database Counters
• FSB-Snaplock Counters
• Image Services Counters
• Independent Repository Object Counters
• Non-Repository Object Retrieval, Database Calls, and Marking Set Cache Counters
• Object Stores Counters
• Roll Forward Dispatcher Counters
• RPC Counters
• Snaplock Specific Counters
• Storage Area Summary Counters
August 2009 IBM System Dashboard for Enterprise Content Management User’s Guide 28
IBM System Dashboard for Enterprise Content Management
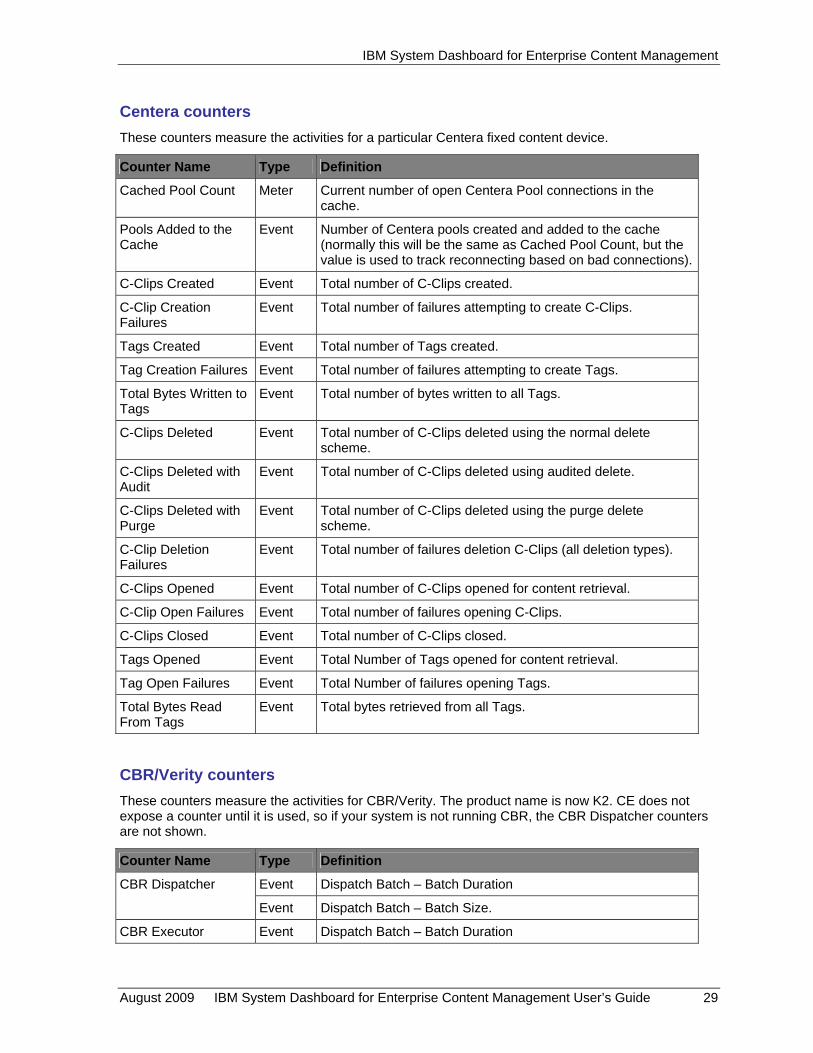
Centera counters These counters measure the activities for a particular Centera fixed content device.
Counter Name Type Definition
Cached Pool Count Meter Current number of open Centera Pool connections in the cache.
Pools Added to the Cache
Event Number of Centera pools created and added to the cache (normally this will be the same as Cached Pool Count, but the value is used to track reconnecting based on bad connections).
C-Clips Created Event Total number of C-Clips created.
C-Clip Creation Failures
Event Total number of failures attempting to create C-Clips.
Tags Created Event Total number of Tags created.
Tag Creation Failures Event Total number of failures attempting to create Tags.
Total Bytes Written to Tags
Event Total number of bytes written to all Tags.
C-Clips Deleted Event Total number of C-Clips deleted using the normal delete scheme.
C-Clips Deleted with Audit
Event Total number of C-Clips deleted using audited delete.
C-Clips Deleted with Purge
Event Total number of C-Clips deleted using the purge delete scheme.
C-Clip Deletion Failures
Event Total number of failures deletion C-Clips (all deletion types).
C-Clips Opened Event Total number of C-Clips opened for content retrieval.
C-Clip Open Failures Event Total number of failures opening C-Clips.
C-Clips Closed Event Total number of C-Clips closed.
Tags Opened Event Total Number of Tags opened for content retrieval.
Tag Open Failures Event Total Number of failures opening Tags.
Total Bytes Read From Tags
Event Total bytes retrieved from all Tags.
CBR/Verity counters These counters measure the activities for CBR/Verity. The product name is now K2. CE does not expose a counter until it is used, so if your system is not running CBR, the CBR Dispatcher counters are not shown.
Counter Name Type Definition
Event Dispatch Batch – Batch Duration CBR Dispatcher
Event Dispatch Batch – Batch Size.
CBR Executor Event Dispatch Batch – Batch Duration
August 2009 IBM System Dashboard for Enterprise Content Management User’s Guide 29

IBM System Dashboard for Enterprise Content Management
Counter Name Type Definition
Event Dispatch Batch – Batch Size.
Event Delete Batch – Batch Duration
Event Delete Batch Items – Batch Item Duration
Event Index Optimization - Duration
Event Insert Batch – Batch Duration
Event Insert Batch Items – Batch Item Duration
Event Verity Index Batch – Batch Duration
CBR Executor for Verity
Event Verity Index Batch Items – Batch Item Duration
CFS-IS Import Agent counters These counters measure the activities for the CFS-IS Import Agent.
Counter Name Type Definition
Event Total number of CFS-IS documents processed.
Inserts Event Total number of documents inserted.
Exports Event Total number of documents exported.
Updates Event Total number of documents updated.
Documents Processed
Deletes Event Total number of documents deleted.
Event Total number of CFS-IS annotations processed.
Inserts Event Total number of annotations inserted.
Exports Event Total number of annotations exported.
Updates Event Total number of annotations updated.
Annotations Processed
Deletes Event Total number of annotations deleted.
Content Retrieval counters These counters measure the content retrieval activities for the life of a server instance for a given storage area.
Counter Name Type Definition
Content Elements Retrieved Event Total number of content elements retrieved from the Storage Area, by this Virtual Server instance.
Total Size of Content Retrieved
Event Total size (in KB) of all content elements retrieved from the Storage Area, by this virtual server instance (this should be the actual bytes read, not the size of the content requested).
Abandoned Retrieval Requests
Event Number of content retrieval requests that were never closed by the client.
August 2009 IBM System Dashboard for Enterprise Content Management User’s Guide 30

IBM System Dashboard for Enterprise Content Management
Content Upload counters These counters measure the content upload activities for the life of a server instance for a given storage area.
Counter Name Type Definition
Content Elements Uploaded Event Total number of content elements successfully uploaded to the Storage Area, by this Virtual Server instance. Note that this count (and size below) is independent of the number of content elements actually committed to the system (aborted transactions are not accounted for).
Total Size of Content Uploaded
Event Total size (in kilobytes) of all content elements uploaded to the Storage Area by this virtual server instance.
Abandoned Upload Requests Event Number of content upload requests that were successfully started but never completed.
Content Update counters (Roll Forward Processing) Requests Processed These counters measure the Content Roll Forward processing activities (request processed) for the life of a server instance for a given storage area.
Counter Name Type Definition
Finalize New Element Count Event Total number of content elements finalized (committed to the system) for the Storage Area.
Finalize Moved Element Count Event Total number of content elements finalized (committed to the system) as the target of a move content operation for the Storage Area.
Delete Element Count Event Total number of independent content elements deleted for the Storage Area. This is the count of elements deleted individually, and not as part of the deletion of the parent document.
Delete All Elements Count Event Total number of dependent content elements deleted for the Storage Area. This is the count of elements deleted as part of the deletion of the parent document.
Migrate Element Count Event Total number of content elements migrated to a fixed content device for the Storage Area.
Migration Count Event Total number of logical or physical document objects created on the fixed device for the Storage Area.
Delete Fixed Element Count Event Total number of content elements deleted from a fixed content device for the Storage Area.
August 2009 IBM System Dashboard for Enterprise Content Management User’s Guide 31

IBM System Dashboard for Enterprise Content Management
Counter Name Type Definition
Delete Fixed Count Event Total number of logical or physical document objects deleted from the fixed device for the Storage Area.
Federated Lockdown Count Event Total number of federated document objects locked down for this fixed device.
Content Update counters (Roll Forward Processing) Requests Queued These counters measure the Content Roll Forward processing activities (requests queued) for the life of a server instance for a given storage area.
Counter Name Type Definition
Finalize New Element Count Event Total number of content elements finalized (committed to the system) for the Storage Area.
Finalize Moved Element Count Event Total number of content elements finalized (committed to the system) as the target of a move content operation for the Storage Area.
Delete Element Count Event Total number of independent content elements deleted for the Storage Area. This is the count of elements deleted individually, and not as part of the deletion of the parent document.
Delete All Elements Count Event Total number of dependent content elements deleted for the Storage Area. This is the count of elements deleted as part of the deletion of the parent document.
Migrate Element Count Event Total number of content elements migrated to a fixed content device for the Storage Area.
Migration Count Event Total number of logical or physical document objects created on the fixed device for the Storage Area.
Delete Fixed Element Count Event Total number of content elements deleted from a fixed content device for the Storage Area.
Delete Fixed Count Event Total number of logical or physical document objects deleted from the fixed device for the Storage Area.
Federated Lockdown Count Event Total number of federated document objects locked down for this fixed device.
August 2009 IBM System Dashboard for Enterprise Content Management User’s Guide 32

IBM System Dashboard for Enterprise Content Management
Database counters
Group Variable Counter Definition
Select Event The total number of database selects.
Insert Event The total number of database inserts.
Delete Event The total number of database deletes.
Update Event The total number of database updates.
Select Duration
Duration The time for each select call.
Insert Duration
Duration The time for each insert call.
Delete Duration
Duration The time for each delete call.
Database
Update Duration
Duration The time for each update call.
FSB/Snaplock counters
Counter Name Type Definition
Logon Count Event Total number of successful logon calls.
Logon Failures Event Total number of failures attempting to logon.
Files Created Event Total number of Files created.
File Creation Failures
Event Total number of failures attempting to create Files
Total Bytes Written to Files
Event Total number of bytes written to all Files
Files Opened Event Total number of Files opened for content retrieval.
File Open Failures Event Total number of failures attempting to open file for content retrieval.
Total Bytes Read From Files
Event Total number of bytes read from files
Files Closed Event Total number of Files (opened for reading) closed.
Files Deleted Event Total number of Files deleted using the Normal delete scheme
Files Deleted with Purge
Event Total number of Files deleted using the Purge delete scheme
Files Deleted with Destroy
Event Total number of Files deleted using the Destroy delete scheme
File Deletion Failures
Event Total number of failures attempting to delete files.
August 2009 IBM System Dashboard for Enterprise Content Management User’s Guide 33

IBM System Dashboard for Enterprise Content Management
Image Services counters These counters measure the activities for a particular Image Services fixed content device.
Counter Name Type Definition
Number of IS Logons Performed Event Total number of logons performed to the IS device. <ssi.logon>
Number of IS Logoffs Performed Event Total number of logoffs performed to the IS device. <ssi.logoff>
Documents Created Event Total number of IS Documents created. <ssi.saveNewDocument>.
Document Creation Failures Event Total number of failures attempting to create IS Documents. <ssi.saveNewDocument>.
Pages Created Event Total number of Pages created within IS Documents. (No separate ssi call).
Documents Deleted Event Total number of native (to FileNet) IS Documents deleted. <ssi.deleteDocuments>
Federated Documents Deleted Event Total number of federated IS Documents deleted. <ssi.deleteDocuments>
Annotations Deleted Event Total number of IS Annotations deleted.
Document Deletion Failures Event Total number of failures deleting native (to FileNet) IS Documents. <ssi.deleteDocuments>
Federated Document Deletion Failures
Event Total number of failures deleting federated IS Documents. <ssi.deleteDocuments>
Annotation Deletion Failures Event Total number of failures deleting IS Annotations <ssi.deleteAnnotation>
Federated Documents Locked Event Total number of federated documents locked down. <ssi.lockdown>
Pages Opened Event Total number of IS Document Pages opened for content retrieval. < ssi.getContentElt>
Page Open Failures Event Total number of failures opening IS Document Pages. <ssi.getContentElt>
Pages Closed Event Total number of IS Document Pages closed. <currentSSI_CE.close>
Total Bytes Read From IS Event Total bytes retrieved from all IS Documents. <currentSSI_CE.read>
August 2009 IBM System Dashboard for Enterprise Content Management User’s Guide 34

IBM System Dashboard for Enterprise Content Management
Independent Repository Objects counters
Group Variable Counter
Action Loads Event
Action Consumer Loads Event
Annotation Loads Event
Choice List Loads Event
Class Definition Loads Event
Class Description Loads Event
Custom Object Loads Event
Document Lifecycle Action Event
Event Loads Event
Folder Loads Event
Link Loads Event
Property Template Loads Event
Queue Item Loads Event
Relationship Loads Event
Security Policy Loads Event
Storage Policy Loads Event
Storage Area Loads Event
Table Definition Loads Event
Version Series Loads Event
Independent Object Retrieval
Versionable Loads Event
August 2009 IBM System Dashboard for Enterprise Content Management User’s Guide 35
IBM System Dashboard for Enterprise Content Management
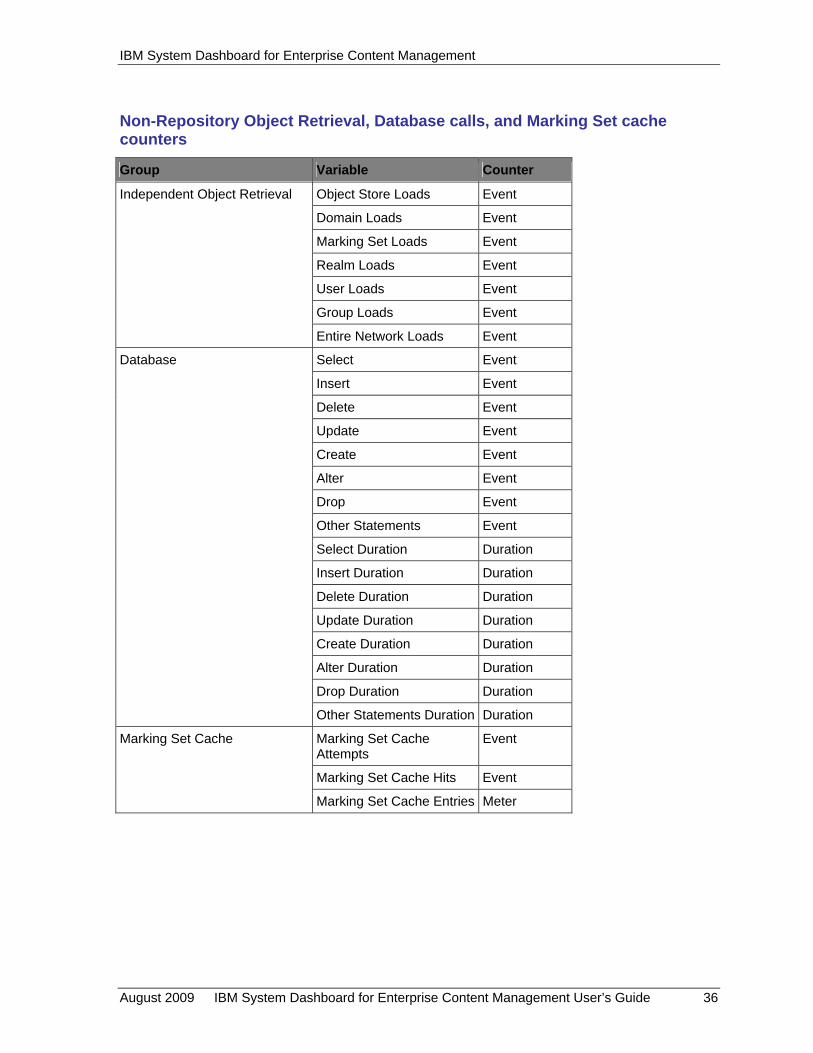
Non-Repository Object Retrieval, Database calls, and Marking Set cache counters
Group Variable Counter
Object Store Loads Event
Domain Loads Event
Marking Set Loads Event
Realm Loads Event
User Loads Event
Group Loads Event
Independent Object Retrieval
Entire Network Loads Event
Select Event
Insert Event
Delete Event
Update Event
Create Event
Alter Event
Drop Event
Other Statements Event
Select Duration Duration
Insert Duration Duration
Delete Duration Duration
Update Duration Duration
Create Duration Duration
Alter Duration Duration
Drop Duration Duration
Database
Other Statements Duration Duration
Marking Set Cache Attempts
Event
Marking Set Cache Hits Event
Marking Set Cache
Marking Set Cache Entries Meter
August 2009 IBM System Dashboard for Enterprise Content Management User’s Guide 36

IBM System Dashboard for Enterprise Content Management
Object Stores counters
Group Variable Counter Definition
Creations Event The total number of objects created.
Modifications Event The total number of objects modified.
Deletions Event The total number of objects deleted.
Annotation
Loads Event The total number of objects loaded.
Creations Event The total number of objects created.
Modifications Event The total number of objects modified.
Deletions Event The total number of objects deleted.
Class Definition
Loads Event The total number of objects loaded.
Creations Event The total number of objects created.
Modifications Event The total number of objects modified.
Deletions Event The total number of objects deleted.
Content Element
Loads Event The total number of objects loaded.
Creations Event The total number of objects created.
Modifications Event The total number of objects modified.
Deletions Event The total number of objects deleted.
Custom Object
Loads Event The total number of objects loaded.
Creations Event The total number of objects created.
Modifications Event The total number of objects modified.
Deletions Event The total number of objects deleted.
Document
Loads Event The total number of objects loaded.
Creations Event The total number of objects created.
Modifications Event The total number of objects modified.
Deletions Event The total number of objects deleted.
Folder
Loads Event The total number of objects loaded.
Creations Event The total number of objects created.
Modifications Event The total number of objects modified.
Deletions Event The total number of objects deleted.
Property Template
Loads Event The total number of objects loaded.
Creations Event The total number of objects created.
Modifications Event The total number of objects modified.
Deletions Event The total number of objects deleted.
RCR
Loads Event The total number of objects loaded.
Ad Hoc Query Ad Hoc Queries Event The total number of ad hoc queries executed.
August 2009 IBM System Dashboard for Enterprise Content Management User’s Guide 37

IBM System Dashboard for Enterprise Content Management
Group Variable Counter Definition
Ad Hoc Query Continuations
Event The total number of query continuations.
Ad Hoc Query Row Results
Event The total number of result rows returned by ad hoc queries.
In Progress Queries
Meter The total number of queries currently in progress.
Changes Succeeded
Event The count of each individual execute change that succeeded. (create, update, or delete).
Changes Failed Event The count of each individual execute change that failed. (create, update, or delete).
Changes
Changes In Progress
Meter The count of each individual execute change in progress. (create, update, or delete).
Repository Objects Created
Event The total number of repository objects created.
Repository Objects Deleted
Event The total number of repository objects deleted.
Repository Objects Updated
Event The total number of repository objects updated.
Repository Object
Repository Objects Loaded
Event The total number of repository objects loaded.
Security Cache Attempts
Event The total number of security cache requests.
Security Cache Hits
Event The total number of security cache hits.
Security Cache
Security Cache Entries
Meter The total number of security descriptors currently in the security cache.
Folder Cache Total Requests
Event The total number of folder cache requests.
Folder Cache Hit Count
Event The total number of folder cache hits.
Folder Cache Miss Count
Event The total number of folder name misses within the Folder Cache.
Folder Cache Flush Count
Event The total number of times the Folder Cache has been flushed.
Folder Cache
Folder Cache Entries
Meter The total number of entries currently in the Folder Cache.
Queue Items Inserted
Event The total number of queue items inserted. Queue Items
Queue Items Processed
Event The total number of queue items processed.
August 2009 IBM System Dashboard for Enterprise Content Management User’s Guide 38

IBM System Dashboard for Enterprise Content Management
Group Variable Counter Definition
Queue Items Failed
Event The total number of queue items failed.
Poison Queue Items
Event The total number of poison queue items.
Select Event The total number of DB selects.
Insert Event The total number of DB insertions.
Delete Event The total number of DB deletions.
Database
Update Event The total number of DB updates.
Enumerations Event The total number of enumerations performed.
Enumeration Continuations
Event The total number of enumeration continuations.
Synchronous Events
Event The total number of synchronous events fired.
Asynchronous Events
Event The total number of asynchronous events fired.
Others
Document Classifications Requested
Event The total number of document classifications requested.
Roll Forward Dispatcher counters These counters measure the content queue batching process activities for a particular object store.
Counter Name Type Definition
Batch Update and Selection Count
Event Total number of batch update and selection statements issued for the Content Queue table.
Batch Update and Selection Row Count
Event Total number of rows updated and selected from the Content Queue table.
Batch Update Failure Count Event Number of failures encountered updating batches in the Content Queue table.
Batch Selection Failure Count Event Number of failures encountered selecting batches in the Content Queue table.
Expired Batch Update Count Event Total number of expired batch update statements issued for the Content Queue table.
Expired Batch Update Row Count
Event Total number of expired rows updated in the Content Queue table.
Expired Batch Update Failure Count
Event Number of failures encountered updating expired batches in the Content Queue table.
Pending Batch Count Meter Current number of pending batches in the dispatcher's queue.
Resolution Pending Batch Count
Meter Current number of completed batches in the dispatcher's resolution queue.
August 2009 IBM System Dashboard for Enterprise Content Management User’s Guide 39

IBM System Dashboard for Enterprise Content Management
Counter Name Type Definition
Active Worker Thread Count Meter Current number of active Content Queue Worker threads.
Batches Added to the Queue Event Total batches added to the dispatcher's queue.
Requests Added to the Queue Event Total requests added to the dispatcher's queue.
Batches Resolved Event Total number of batches resolved.
Requests Resolved Event Total number of requests resolved.
Requests Re-Queued for Retry Event Total number of requests re-queued for retry (not actually re-added to the queue, simply left in the queue for a future retry attempt).
Requests For Deleted Area Purged
Event Total number of requests purge due to the storage area being deleted.
Worker Thread Startup Count Event Total number of Content Queue Worker Threads started.
Worker Thread Completion Count
Event Total number of Content Queue Worker Threads that reached the completed state.
RPC counters
Variable Counter
ExecuteChanges Requests Event
ExecuteChanges Requests In Progress Meter
ExecuteSearch Requests Event
ExecuteSearch Requests In Progress Meter
GetObjects Requests Event
GetObjects Requests In Progress Meter
GetSearchMetadata Requests Event
GetSearchMetadata Requests In Progress
Meter
ExecuteChanges Requests Failed Event
ExecuteSearch Requests Failed Event
GetObjects Requests Failed Event
GetSearchMetadata Requests Failed Event
ExecuteChanges Time Accumulator/Duration
ExecuteSearch Time Accumulator/Duration
GetObjects Time Accumulator/Duration
GetSearchMetadata Time Accumulator/Duration
Queue Items Processed Event
Queue Items Failed Event
August 2009 IBM System Dashboard for Enterprise Content Management User’s Guide 40
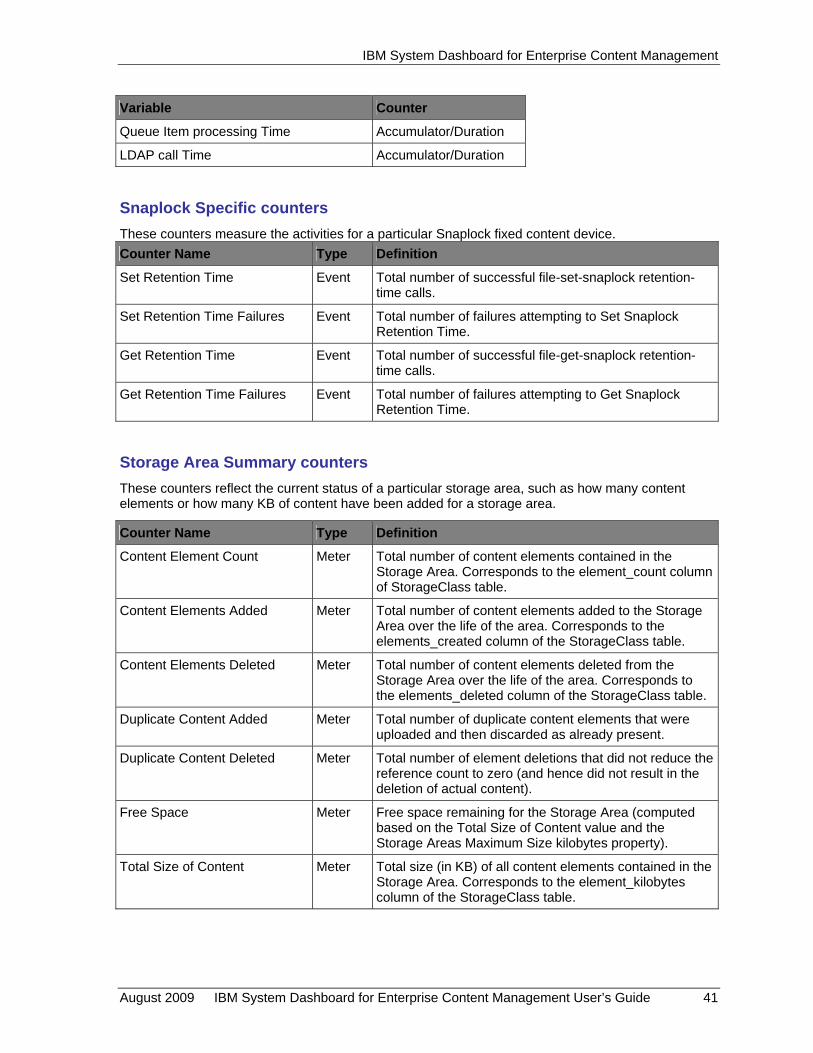
IBM System Dashboard for Enterprise Content Management
Variable Counter
Queue Item processing Time Accumulator/Duration
LDAP call Time Accumulator/Duration
Snaplock Specific counters These counters measure the activities for a particular Snaplock fixed content device. Counter Name Type Definition
Set Retention Time Event Total number of successful file-set-snaplock retention-time calls.
Set Retention Time Failures Event Total number of failures attempting to Set Snaplock Retention Time.
Get Retention Time Event Total number of successful file-get-snaplock retention-time calls.
Get Retention Time Failures Event Total number of failures attempting to Get Snaplock Retention Time.
Storage Area Summary counters These counters reflect the current status of a particular storage area, such as how many content elements or how many KB of content have been added for a storage area.
Counter Name Type Definition
Content Element Count Meter Total number of content elements contained in the Storage Area. Corresponds to the element_count column of StorageClass table.
Content Elements Added Meter Total number of content elements added to the Storage Area over the life of the area. Corresponds to the elements_created column of the StorageClass table.
Content Elements Deleted Meter Total number of content elements deleted from the Storage Area over the life of the area. Corresponds to the elements_deleted column of the StorageClass table.
Duplicate Content Added Meter Total number of duplicate content elements that were uploaded and then discarded as already present.
Duplicate Content Deleted Meter Total number of element deletions that did not reduce the reference count to zero (and hence did not result in the deletion of actual content).
Free Space Meter Free space remaining for the Storage Area (computed based on the Total Size of Content value and the Storage Areas Maximum Size kilobytes property).
Total Size of Content Meter Total size (in KB) of all content elements contained in the Storage Area. Corresponds to the element_kilobytes column of the StorageClass table.
August 2009 IBM System Dashboard for Enterprise Content Management User’s Guide 41

IBM System Dashboard for Enterprise Content Management
Dashboard counters The Listener component automatically gathers information about the operating environment of an application. The counters gathered are the same, with few exceptions, regardless of the operating system in use.
Environmental Information The environmental information collected by the Listener includes any static data about the application or the computer.
Property Description
app_name The name of the application
app_version The version and patch level numbers of the application
hostname The primary host name of the system where the application is running
java.runtime.version (Java only) Version number of the JVM
jvm_max_memory (Java only, 1.4 or higher JVM) The maximum memory setting for the JVM in bytes
os.arch The architecture of the computer's processor
os.name The name of the operating system, such as Windows 2003
os.version The version number of the operating system
pagesize (C++ only) The size of a page of memory in bytes
processors The number of processors, of all types, found in the computer. For Java, reported for JVM 1.4 or higher.
protocol The internal protocol that the Dashboard uses to communicate with the Listeners. Dashboard 3.5.1 introduced 1.0 Dashboard 4.0.0 introduced 1.1 Dashboard 4.5.0 introduces 1.2. Dashboard 4.5.1 can connect to any previous Listener version; it will communicate with 1.0 and 1.1 listeners simultaneously with 1.2 listeners. In summary, Dashboard 4.5.1 is compatible with all Listeners back to the original 3.5.1 release.
sun.os.patch.level (Java only; Sun JVM only) Patch level of the operating system
time The time, in seconds, since Jan 1, 1970 UTC sent by the Listener. The Dashboard computer might have a slightly different time setting, as might other Listeners, so the Dashboard calculates the difference between the Listeners and its own time setting and automatically adjusts its own timestamps. As a result, if the Dashboard is monitoring two or more Listeners, the timestamps of the Listeners are comparable. For example, 1234567890 occurred at 3:31 p.m. on Friday, Feb. 13, 2009.
user.language (Java only) Default locale for the JVM
August 2009 IBM System Dashboard for Enterprise Content Management User’s Guide 42
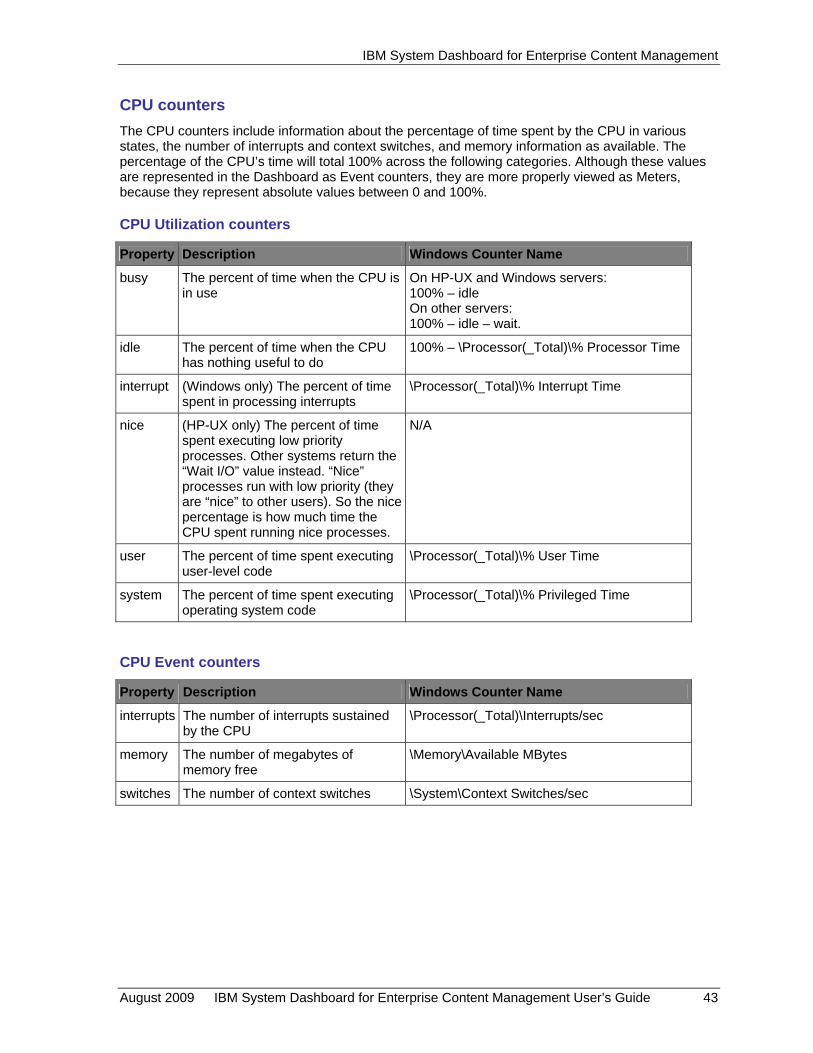
IBM System Dashboard for Enterprise Content Management
CPU counters The CPU counters include information about the percentage of time spent by the CPU in various states, the number of interrupts and context switches, and memory information as available. The percentage of the CPU’s time will total 100% across the following categories. Although these values are represented in the Dashboard as Event counters, they are more properly viewed as Meters, because they represent absolute values between 0 and 100%.
CPU Utilization counters
Property Description Windows Counter Name
busy The percent of time when the CPU is in use
On HP-UX and Windows servers: 100% – idle On other servers: 100% – idle – wait.
idle The percent of time when the CPU has nothing useful to do
100% – \Processor(_Total)\% Processor Time
interrupt (Windows only) The percent of time spent in processing interrupts
\Processor(_Total)\% Interrupt Time
nice (HP-UX only) The percent of time spent executing low priority processes. Other systems return the “Wait I/O” value instead. “Nice” processes run with low priority (they are “nice” to other users). So the nice percentage is how much time the CPU spent running nice processes.
N/A
user The percent of time spent executing user-level code
\Processor(_Total)\% User Time
system The percent of time spent executing operating system code
\Processor(_Total)\% Privileged Time
CPU Event counters
Property Description Windows Counter Name
interrupts The number of interrupts sustained by the CPU
\Processor(_Total)\Interrupts/sec
memory The number of megabytes of memory free
\Memory\Available MBytes
switches The number of context switches \System\Context Switches/sec
August 2009 IBM System Dashboard for Enterprise Content Management User’s Guide 43
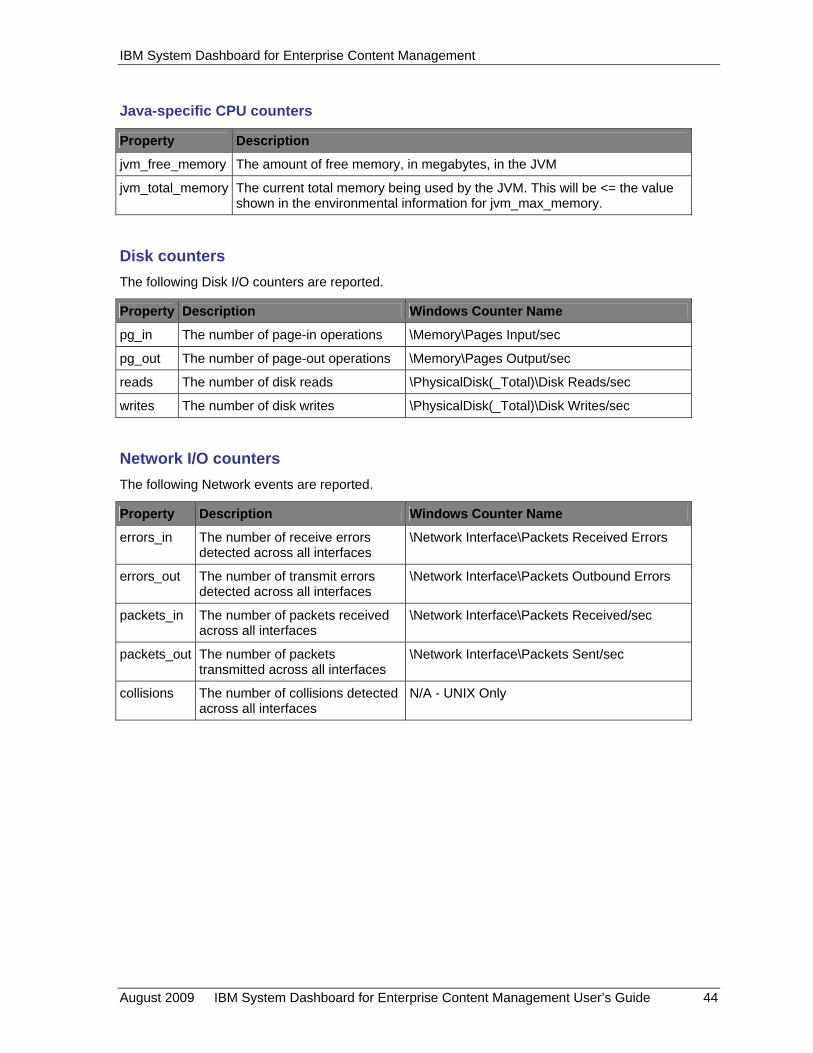
IBM System Dashboard for Enterprise Content Management
Java-specific CPU counters
Property Description
jvm_free_memory The amount of free memory, in megabytes, in the JVM
jvm_total_memory The current total memory being used by the JVM. This will be <= the value shown in the environmental information for jvm_max_memory.
Disk counters The following Disk I/O counters are reported.
Property Description Windows Counter Name
pg_in The number of page-in operations \Memory\Pages Input/sec
pg_out The number of page-out operations \Memory\Pages Output/sec
reads The number of disk reads \PhysicalDisk(_Total)\Disk Reads/sec
writes The number of disk writes \PhysicalDisk(_Total)\Disk Writes/sec
Network I/O counters The following Network events are reported.
Property Description Windows Counter Name
errors_in The number of receive errors detected across all interfaces
\Network Interface\Packets Received Errors
errors_out The number of transmit errors detected across all interfaces
\Network Interface\Packets Outbound Errors
packets_in The number of packets received across all interfaces
\Network Interface\Packets Received/sec
packets_out The number of packets transmitted across all interfaces
\Network Interface\Packets Sent/sec
collisions The number of collisions detected across all interfaces
N/A - UNIX Only
August 2009 IBM System Dashboard for Enterprise Content Management User’s Guide 44

IBM System Dashboard for Enterprise Content Management
User counters The Dashboard provides several Garbage Collector counters. Each collector is represented as an event, the count indicates how many times that particular collector was run, followed by the duration accumulator that shows the average amount of time spent running those garbage collections.
Garbage Collectors
Property Description
Copy duration (Java only; JVM 1.5 or higher) The amount of time spent running Copy activities.
MarkSweepCompact duration
(Java only; JVM 1.5 or higher) The amount of time spent running MarkSweepCompact collection activities.
August 2009 IBM System Dashboard for Enterprise Content Management User’s Guide 45

IBM System Dashboard for Enterprise Content Management
Image Services counters Image Services counters also run on Process Engine (PE) and are identified as IS (mini) counters. The counters that exist on PE are identical to their counterparts on IS. The following IS counters are defined:
• Disk Counters
• Document Services Counters
• Event Logging Abstract (ELA) Events
• File System Counters
• Miscellaneous Static Variables Counters
• MKF Counters
• Network Counters
• OSAR Server Counters
• PPM Counters
• RPC counters
• System Counters
• Virtual Memory Counters
• Workflo Counters
Disk counters
Soft Report Symbol Definition Counter
Mapping to an external variable
disk.rdblks blocks read from magnetic disk DK_READCNT FDOS only
disk.rdops read operations from magnetic disk DK_READOPS FDOS only
disk.rderrs errors reading from magnetic disk DK_READERRS FDOS only
disk.wtblks blocks written to magnetic disk DK_WRITECNT FDOS only
disk.wtops write operations to magnetic disk DK_WRITEOPS FDOS only
disk.wterrs errors writing to magnetic disk DK_WRITEERRS FDOS only
disk.ops total number of operations DK_OPS
disk.timeactive percentage of time disk was busy DK_TIMEACTIVE AIX only
disk.KB KB read and written DK_KBXFERRED AIX only
disk.cumseekd
DK_CUMSEEKD AIX only
disk.KBrd KB read DK_KBREAD AIX only
disk.KBwrt KB written DK_KBWRITTEN AIX only
disk.xfrcap transfer capacity to device DK_TRANSFERCAP AIX only
disk.blocksize blocksize of device DK_BLOCKSIZE AIX only
August 2009 IBM System Dashboard for Enterprise Content Management User’s Guide 46
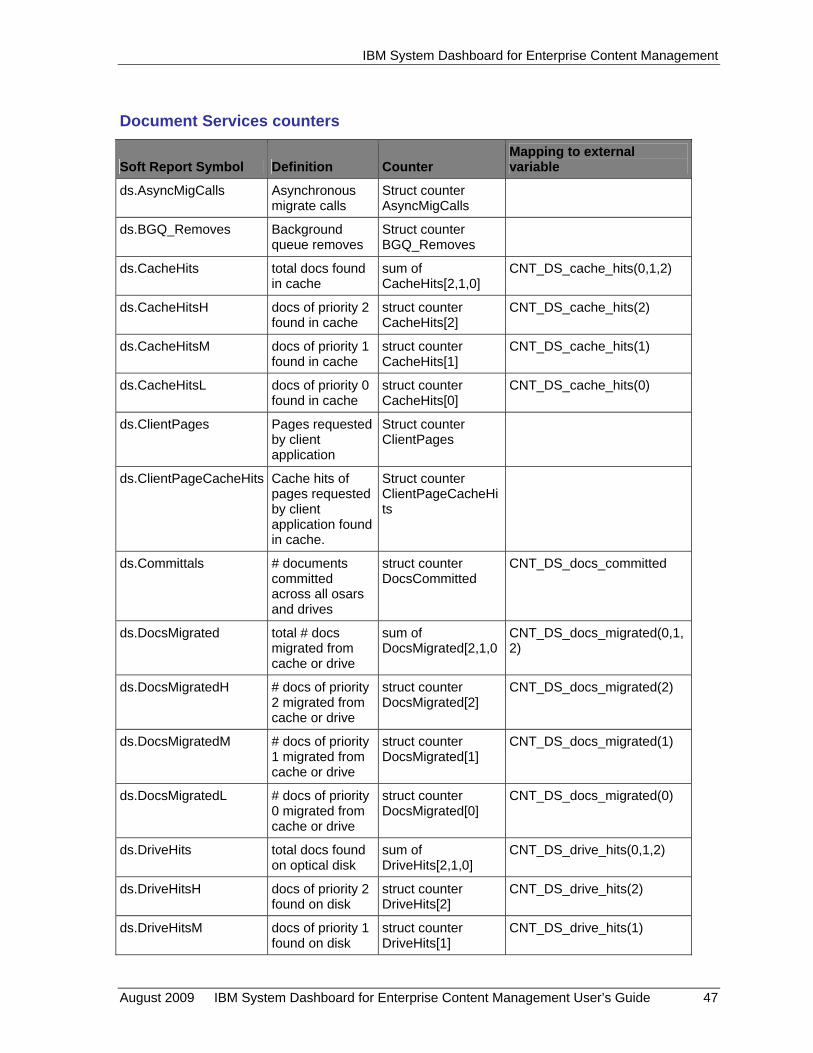
IBM System Dashboard for Enterprise Content Management
Document Services counters
Soft Report Symbol Definition Counter Mapping to external variable
ds.AsyncMigCalls Asynchronous migrate calls
Struct counter AsyncMigCalls
ds.BGQ_Removes Background queue removes
Struct counter BGQ_Removes
ds.CacheHits total docs found in cache
sum of CacheHits[2,1,0]
CNT_DS_cache_hits(0,1,2)
ds.CacheHitsH docs of priority 2 found in cache
struct counter CacheHits[2]
CNT_DS_cache_hits(2)
ds.CacheHitsM docs of priority 1 found in cache
struct counter CacheHits[1]
CNT_DS_cache_hits(1)
ds.CacheHitsL docs of priority 0 found in cache
struct counter CacheHits[0]
CNT_DS_cache_hits(0)
ds.ClientPages Pages requested by client application
Struct counter ClientPages
ds.ClientPageCacheHits Cache hits of pages requested by client application found in cache.
Struct counter ClientPageCacheHits
ds.Committals # documents committed across all osars and drives
struct counter DocsCommitted
CNT_DS_docs_committed
ds.DocsMigrated total # docs migrated from cache or drive
sum of DocsMigrated[2,1,0
CNT_DS_docs_migrated(0,1,2)
ds.DocsMigratedH # docs of priority 2 migrated from cache or drive
struct counter DocsMigrated[2]
CNT_DS_docs_migrated(2)
ds.DocsMigratedM # docs of priority 1 migrated from cache or drive
struct counter DocsMigrated[1]
CNT_DS_docs_migrated(1)
ds.DocsMigratedL # docs of priority 0 migrated from cache or drive
struct counter DocsMigrated[0]
CNT_DS_docs_migrated(0)
ds.DriveHits total docs found on optical disk
sum of DriveHits[2,1,0]
CNT_DS_drive_hits(0,1,2)
ds.DriveHitsH docs of priority 2 found on disk
struct counter DriveHits[2]
CNT_DS_drive_hits(2)
ds.DriveHitsM docs of priority 1 found on disk
struct counter DriveHits[1]
CNT_DS_drive_hits(1)
August 2009 IBM System Dashboard for Enterprise Content Management User’s Guide 47

IBM System Dashboard for Enterprise Content Management
Mapping to external Soft Report Symbol Definition Counter variable
ds.DriveHitsL docs of priority 0 found on disk
struct counter DriveHits[0]
CNT_DS_drive_hits(0)
ds.FastBatches # fast batches committed
struct counter FastBatchCount
CNT_DS_fast_batch_count
ds.FastDocs # fast batch docs committed
struct counter FastBatchDocs
CNT_DS_fast_batch_docs
ds.FastPages #fast batch pages committed
struct counter FastBatchPages
CNT_DS_fast_batch_pages
ds.HRDQ_Removes High priority read queue removes
ds.ImportDocs Requests for document imports
ds.Imports docs inserted in DOCS by import
struct counter ImportInserts
CNT_DS_import_inserts
ds.LRDQ_Removes Low priority read queue removes
ds.MigrateCalls Migrate requests
ds.MRDQ_Removes Medium priority read queue removes
ds.NFailed notify timeouts, which means that after the migrate was complete, the ds_notify process tried to do a TPISendPEPReq call and it failed.
struct counter NotifyTimeouts
CNT_DS_notify_timeouts
ds.ODrivePageReads [osar=x][drive=y]
total page reads done on drive x and osar y, or across all drives and osars if no params specified
sum of PageHighReads, PageMedReads, and PageLowReads
CNT_DS_DrPageHiReads(osar,drive)+ CNT_DS_DrPageMidReads(osar,drive)+ CNT_DS_DrPageLoReads(osar,drive)
ds.ODrivePageReadsH [osar=x][drive=y]
priority 2 page reads done on drive x and osar y, or across all drives and osars if no params specified
struct counter, struct Drive_counters PageHighReads
CNT_DS_DrPageHiReads(osar,drive)
August 2009 IBM System Dashboard for Enterprise Content Management User’s Guide 48
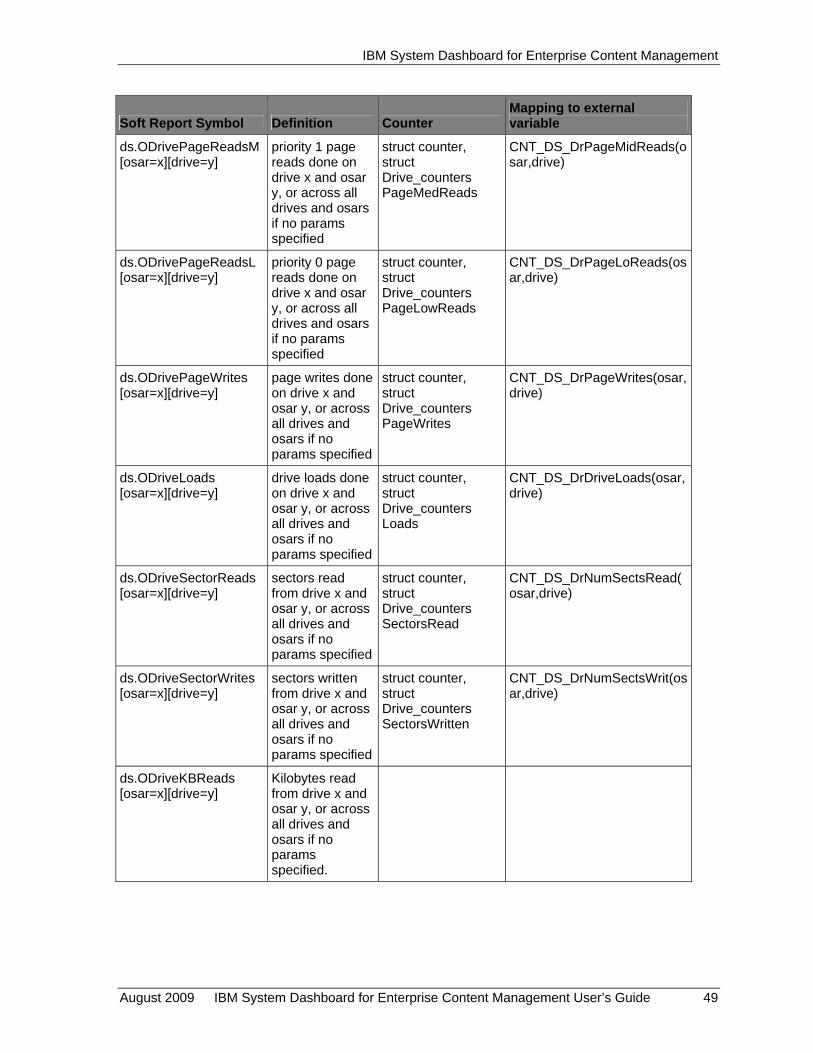
IBM System Dashboard for Enterprise Content Management
Mapping to external Soft Report Symbol Definition Counter variable
ds.ODrivePageReadsM [osar=x][drive=y]
priority 1 page reads done on drive x and osar y, or across all drives and osars if no params specified
struct counter, struct Drive_counters PageMedReads
CNT_DS_DrPageMidReads(osar,drive)
ds.ODrivePageReadsL [osar=x][drive=y]
priority 0 page reads done on drive x and osar y, or across all drives and osars if no params specified
struct counter, struct Drive_counters PageLowReads
CNT_DS_DrPageLoReads(osar,drive)
ds.ODrivePageWrites [osar=x][drive=y]
page writes done on drive x and osar y, or across all drives and osars if no params specified
struct counter, struct Drive_counters PageWrites
CNT_DS_DrPageWrites(osar,drive)
ds.ODriveLoads [osar=x][drive=y]
drive loads done on drive x and osar y, or across all drives and osars if no params specified
struct counter, struct Drive_counters Loads
CNT_DS_DrDriveLoads(osar,drive)
ds.ODriveSectorReads [osar=x][drive=y]
sectors read from drive x and osar y, or across all drives and osars if no params specified
struct counter, struct Drive_counters SectorsRead
CNT_DS_DrNumSectsRead(osar,drive)
ds.ODriveSectorWrites [osar=x][drive=y]
sectors written from drive x and osar y, or across all drives and osars if no params specified
struct counter, struct Drive_counters SectorsWritten
CNT_DS_DrNumSectsWrit(osar,drive)
ds.ODriveKBReads [osar=x][drive=y]
Kilobytes read from drive x and osar y, or across all drives and osars if no params specified.
August 2009 IBM System Dashboard for Enterprise Content Management User’s Guide 49
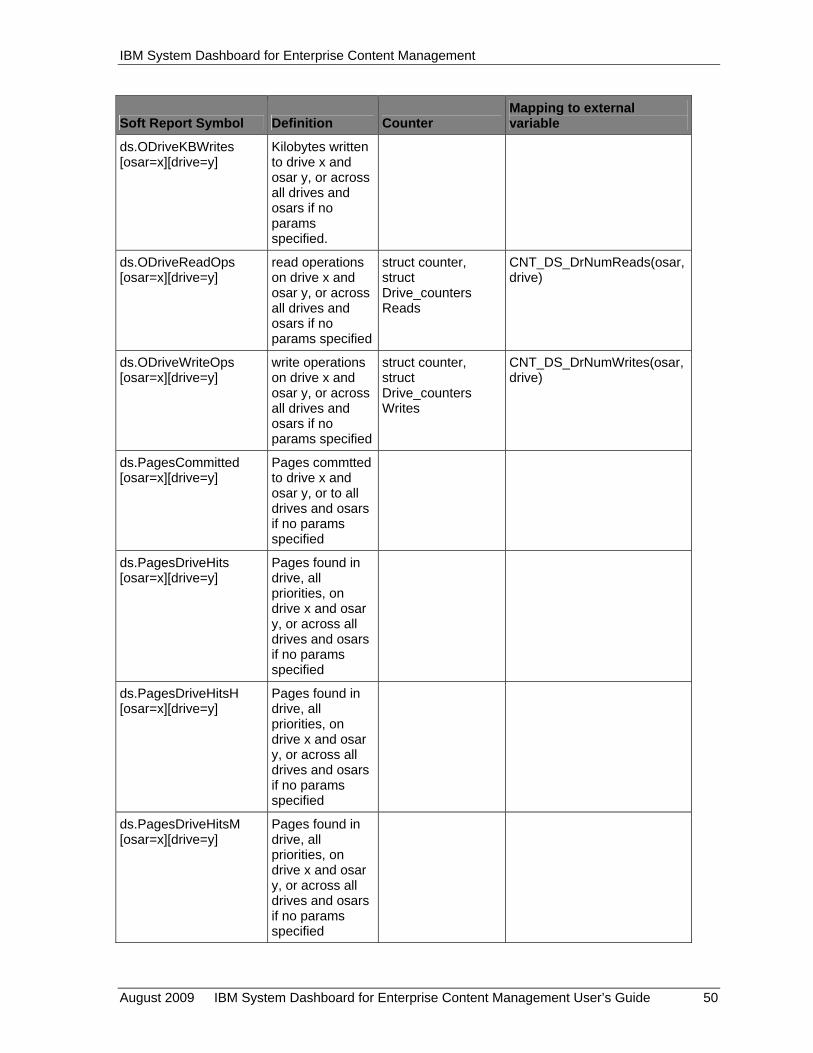
IBM System Dashboard for Enterprise Content Management
Mapping to external Soft Report Symbol Definition Counter variable
ds.ODriveKBWrites [osar=x][drive=y]
Kilobytes written to drive x and osar y, or across all drives and osars if no params specified.
ds.ODriveReadOps [osar=x][drive=y]
read operations on drive x and osar y, or across all drives and osars if no params specified
struct counter, struct Drive_counters Reads
CNT_DS_DrNumReads(osar,drive)
ds.ODriveWriteOps [osar=x][drive=y]
write operations on drive x and osar y, or across all drives and osars if no params specified
struct counter, struct Drive_counters Writes
CNT_DS_DrNumWrites(osar,drive)
ds.PagesCommitted [osar=x][drive=y]
Pages commtted to drive x and osar y, or to all drives and osars if no params specified
ds.PagesDriveHits [osar=x][drive=y]
Pages found in drive, all priorities, on drive x and osar y, or across all drives and osars if no params specified
ds.PagesDriveHitsH [osar=x][drive=y]
Pages found in drive, all priorities, on drive x and osar y, or across all drives and osars if no params specified
ds.PagesDriveHitsM [osar=x][drive=y]
Pages found in drive, all priorities, on drive x and osar y, or across all drives and osars if no params specified
August 2009 IBM System Dashboard for Enterprise Content Management User’s Guide 50

IBM System Dashboard for Enterprise Content Management
Mapping to external Soft Report Symbol Definition Counter variable
ds.PagesDriveHitsL [osar=x][drive=y]
Pages found in drive, all priorities, on drive x and osar y, or across all drives and osars if no params specified
ds.PagesCacheHits total pages migrated from cache or drive
sum of PagesMigrated[2,1,0]
CNT_DS_pages_migrated(0,1,2)
ds.PagesCacheHitsH # pages of priority 2 migrated from cache or drive
struct counter PagesMigrated[2]
CNT_DS_pages_migrated(2)
ds.PagesCacheHitsM # pages of priority 1 migrated from cache or drive
struct counter PagesMigrated[1]
CNT_DS_pages_migrated(1)
ds.PagesCacheHitsL # pages of priority 0 migrated from cache or drive
struct counter PagesMigrated[0]
CNT_DS_pages_migrated(0)
ds.PagesMigrated total pages migrated from cache or drive
sum of PagesMigrated[2,1,0]
CNT_DS_pages_migrated(0,1,2)
ds.PagesMigratedH # pages of priority 2 migrated from cache or drive
struct counter PagesMigrated[2]
CNT_DS_pages_migrated(2)
ds.PagesMigratedM # pages of priority 1 migrated from cache or drive
struct counter PagesMigrated[1]
CNT_DS_pages_migrated(1)
ds.PagesMigratedL # pages of priority 0 migrated from cache or drive
struct counter PagesMigrated[0]
CNT_DS_pages_migrated(0)
ds.PrefetchCalls Prefetch calls counted by document services
ds.WRQ_Removes Write queue removal requests.
August 2009 IBM System Dashboard for Enterprise Content Management User’s Guide 51

IBM System Dashboard for Enterprise Content Management
Event Logging Abstract (ELA) Events The following table lists the names and short descriptions of ELA event names of remote procedures for which you can collect data on both server and client systems (client procedures are identified with a suffix of ‘c’):
ELA Event Name Description
BES/BESc Batch Entry Service RPCs
CSM/CSMc Cache Services Manager RPCs
DOC/DOCc Document Services RPCs
INX/INXc Index Services RPCs
PSM/PSMc Print Services Manager RPCs
PQM/PQMc Printer Service RPCs
SEC/SECc Security Service RPCs
WQM/WQMc WorkFlo Queue Manager RPCs
WQS/WQSc WorkFlo Services RPCs
August 2009 IBM System Dashboard for Enterprise Content Management User’s Guide 52
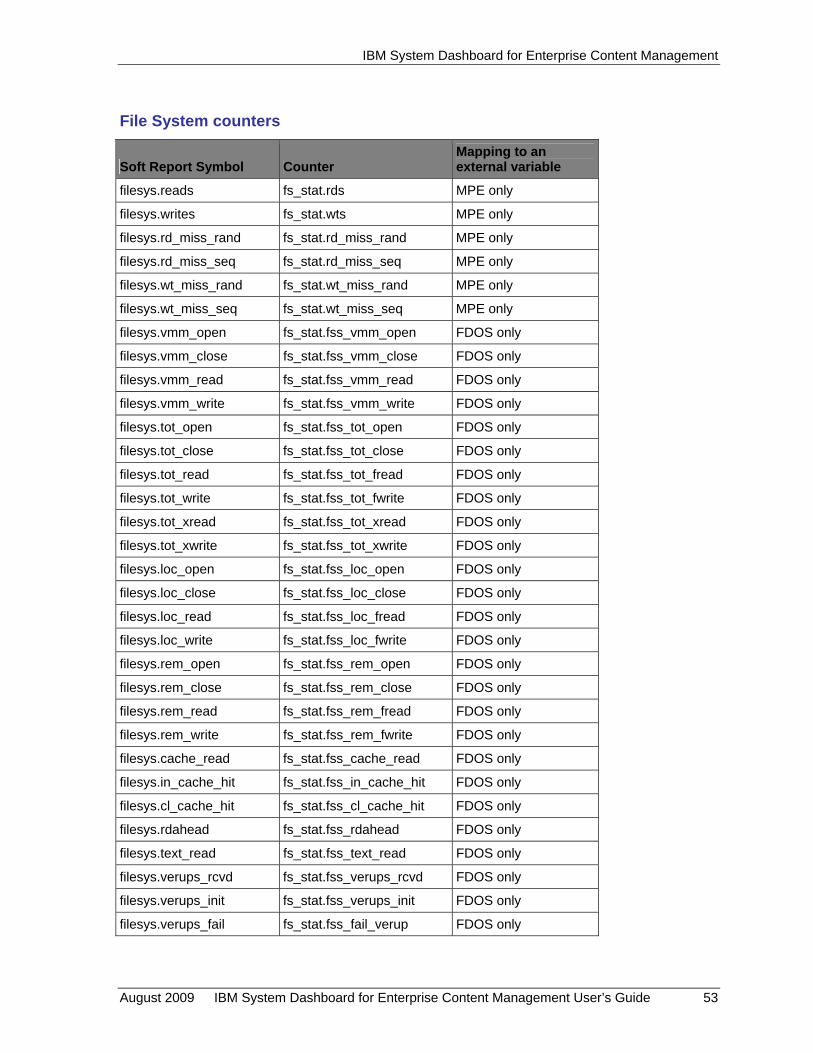
IBM System Dashboard for Enterprise Content Management
File System counters
Soft Report Symbol Counter Mapping to an external variable
filesys.reads fs_stat.rds MPE only
filesys.writes fs_stat.wts MPE only
filesys.rd_miss_rand fs_stat.rd_miss_rand MPE only
filesys.rd_miss_seq fs_stat.rd_miss_seq MPE only
filesys.wt_miss_rand fs_stat.wt_miss_rand MPE only
filesys.wt_miss_seq fs_stat.wt_miss_seq MPE only
filesys.vmm_open fs_stat.fss_vmm_open FDOS only
filesys.vmm_close fs_stat.fss_vmm_close FDOS only
filesys.vmm_read fs_stat.fss_vmm_read FDOS only
filesys.vmm_write fs_stat.fss_vmm_write FDOS only
filesys.tot_open fs_stat.fss_tot_open FDOS only
filesys.tot_close fs_stat.fss_tot_close FDOS only
filesys.tot_read fs_stat.fss_tot_fread FDOS only
filesys.tot_write fs_stat.fss_tot_fwrite FDOS only
filesys.tot_xread fs_stat.fss_tot_xread FDOS only
filesys.tot_xwrite fs_stat.fss_tot_xwrite FDOS only
filesys.loc_open fs_stat.fss_loc_open FDOS only
filesys.loc_close fs_stat.fss_loc_close FDOS only
filesys.loc_read fs_stat.fss_loc_fread FDOS only
filesys.loc_write fs_stat.fss_loc_fwrite FDOS only
filesys.rem_open fs_stat.fss_rem_open FDOS only
filesys.rem_close fs_stat.fss_rem_close FDOS only
filesys.rem_read fs_stat.fss_rem_fread FDOS only
filesys.rem_write fs_stat.fss_rem_fwrite FDOS only
filesys.cache_read fs_stat.fss_cache_read FDOS only
filesys.in_cache_hit fs_stat.fss_in_cache_hit FDOS only
filesys.cl_cache_hit fs_stat.fss_cl_cache_hit FDOS only
filesys.rdahead fs_stat.fss_rdahead FDOS only
filesys.text_read fs_stat.fss_text_read FDOS only
filesys.verups_rcvd fs_stat.fss_verups_rcvd FDOS only
filesys.verups_init fs_stat.fss_verups_init FDOS only
filesys.verups_fail fs_stat.fss_fail_verup FDOS only
August 2009 IBM System Dashboard for Enterprise Content Management User’s Guide 53
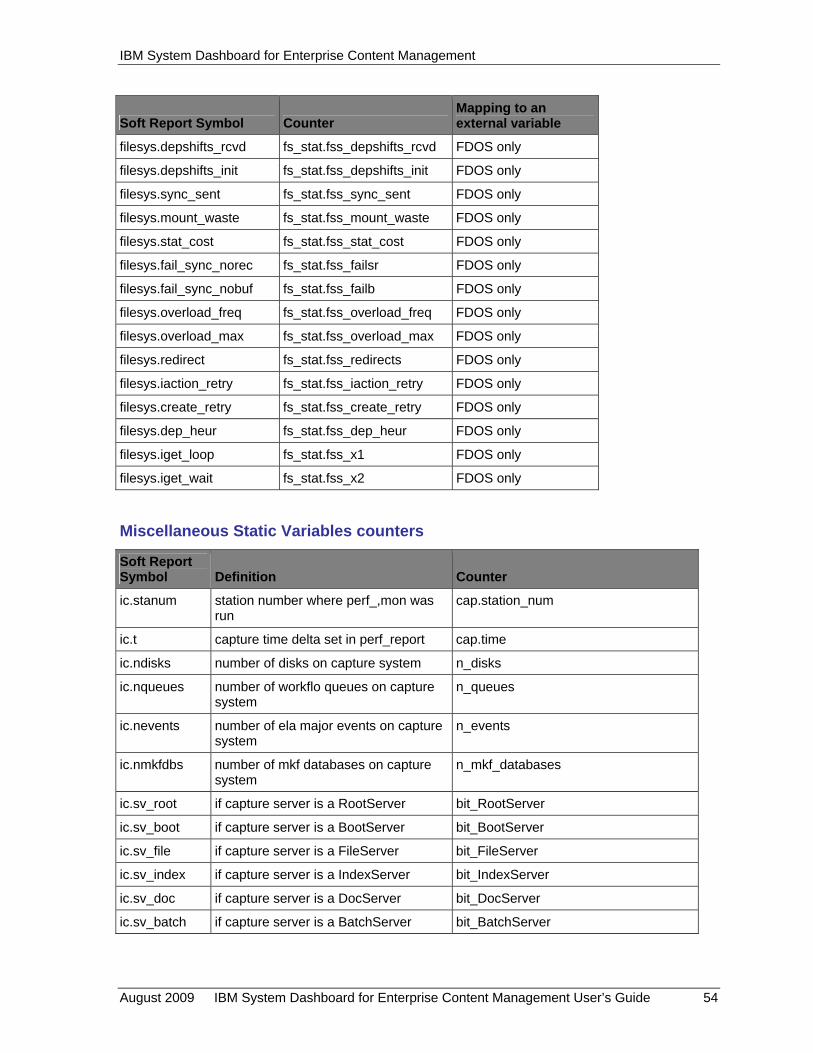
IBM System Dashboard for Enterprise Content Management
Mapping to an Soft Report Symbol Counter external variable
filesys.depshifts_rcvd fs_stat.fss_depshifts_rcvd FDOS only
filesys.depshifts_init fs_stat.fss_depshifts_init FDOS only
filesys.sync_sent fs_stat.fss_sync_sent FDOS only
filesys.mount_waste fs_stat.fss_mount_waste FDOS only
filesys.stat_cost fs_stat.fss_stat_cost FDOS only
filesys.fail_sync_norec fs_stat.fss_failsr FDOS only
filesys.fail_sync_nobuf fs_stat.fss_failb FDOS only
filesys.overload_freq fs_stat.fss_overload_freq FDOS only
filesys.overload_max fs_stat.fss_overload_max FDOS only
filesys.redirect fs_stat.fss_redirects FDOS only
filesys.iaction_retry fs_stat.fss_iaction_retry FDOS only
filesys.create_retry fs_stat.fss_create_retry FDOS only
filesys.dep_heur fs_stat.fss_dep_heur FDOS only
filesys.iget_loop fs_stat.fss_x1 FDOS only
filesys.iget_wait fs_stat.fss_x2 FDOS only
Miscellaneous Static Variables counters
Soft Report Symbol Definition Counter
ic.stanum station number where perf_,mon was run
cap.station_num
ic.t capture time delta set in perf_report cap.time
ic.ndisks number of disks on capture system n_disks
ic.nqueues number of workflo queues on capture system
n_queues
ic.nevents number of ela major events on capture system
n_events
ic.nmkfdbs number of mkf databases on capture system
n_mkf_databases
ic.sv_root if capture server is a RootServer bit_RootServer
ic.sv_boot if capture server is a BootServer bit_BootServer
ic.sv_file if capture server is a FileServer bit_FileServer
ic.sv_index if capture server is a IndexServer bit_IndexServer
ic.sv_doc if capture server is a DocServer bit_DocServer
ic.sv_batch if capture server is a BatchServer bit_BatchServer
August 2009 IBM System Dashboard for Enterprise Content Management User’s Guide 54

IBM System Dashboard for Enterprise Content Management
Soft Report Definition Counter Symbol
ic.sv_cache if capture server is a CacheServer bit_CacheServer
ic.sv_print if capture server is a PrintServServer bit_PrintServServer
ic.sv_osar if capture server is a OsarServer bit_OsarServer
ic.sv_skf if capture server is a SKFServer bit_SKFServer
ic.sv_wfl if capture server is a WorkFloServer bit_WorkFloServer
ic.sv_dtars if capture server is a DTARSServer bit_DTARSServer
ic.sv_nch if capture server is a NCHServer bit_NCHServer
ic.sv_sort if capture server is a SortServer bit_SortServer
MKF counters
Soft Report Symbol Definition Counter Mapping to external variable
mkf.find[BaseFile=x] find operation on the database
MKF_FIND See MKF.definitions
mkf.sop_find[BaseFile=x] find on the database that occurred in a single operation
MKF_SOP_FIND See MKF.definitions
mkf.insert[BaseFile=x] insert operation on the database
MKF_INSERT See MKF.definitions
mkf.sop_insert[BaseFile=x] insert on the database that occurred in a single operation
MKF_SOP_INSERT See MKF.definitions
mkf.update[BaseFile=x] update operation on the database
MKF_UPDATE See MKF.definitions
mkf.delete[BaseFile=x] delete operation on the database
MKF_DELETE See MKF.definitions
mkf.set_position[BaseFile=x]
call to set forward or backward find on database
MKF_SET_POSITION See MKF.definitions
mkf.begin_trans[BaseFile=x] There are transactions which provide locking around the database operations.
MKF_BEGIN_TRANS See MKF.definitions
August 2009 IBM System Dashboard for Enterprise Content Management User’s Guide 55
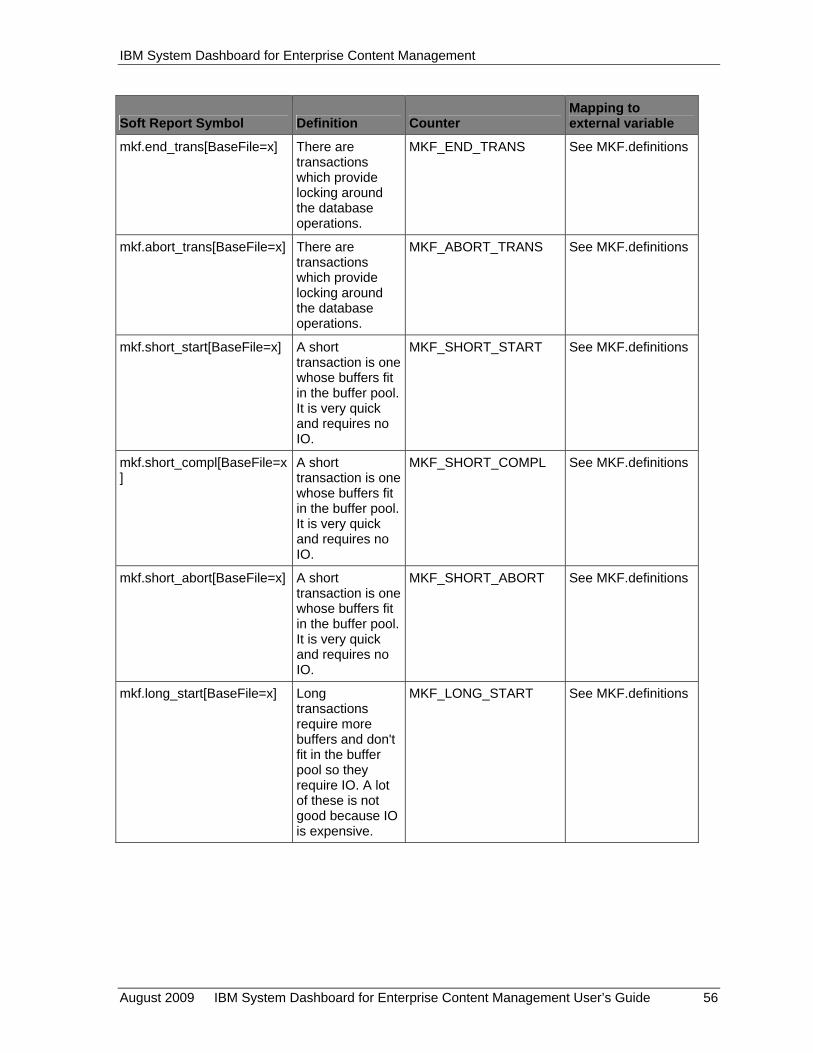
IBM System Dashboard for Enterprise Content Management
Mapping to Soft Report Symbol Definition Counter external variable
mkf.end_trans[BaseFile=x] There are transactions which provide locking around the database operations.
MKF_END_TRANS See MKF.definitions
mkf.abort_trans[BaseFile=x] There are transactions which provide locking around the database operations.
MKF_ABORT_TRANS See MKF.definitions
mkf.short_start[BaseFile=x] A short transaction is one whose buffers fit in the buffer pool. It is very quick and requires no IO.
MKF_SHORT_START See MKF.definitions
mkf.short_compl[BaseFile=x]
A short transaction is one whose buffers fit in the buffer pool. It is very quick and requires no IO.
MKF_SHORT_COMPL See MKF.definitions
mkf.short_abort[BaseFile=x] A short transaction is one whose buffers fit in the buffer pool. It is very quick and requires no IO.
MKF_SHORT_ABORT See MKF.definitions
mkf.long_start[BaseFile=x] Long transactions require more buffers and don't fit in the buffer pool so they require IO. A lot of these is not good because IO is expensive.
MKF_LONG_START See MKF.definitions
August 2009 IBM System Dashboard for Enterprise Content Management User’s Guide 56

IBM System Dashboard for Enterprise Content Management
Mapping to Soft Report Symbol Definition Counter external variable
mkf.long_compl[BaseFile=x] Long transactions require more buffers and don't fit in the buffer pool so they require IO. A lot of these is not good because IO is expensive.
MKF_LONG_COMPL See MKF.definitions
mkf.long_abort[BaseFile=x] Long transactions require more buffers and don't fit in the buffer pool so they require IO. A lot of these is not good because IO is expensive.
MKF_LONG_ABORT See MKF.definitions
mkf.short->long[BaseFile=x] Sometimes a short transaction is converted to a long one, short->long
MKF_SHORT2LONG See MKF.definitions
mkf.short->longok[BaseFile=x]
Whether short-> long transaction conversion was successful
MKF_SHORT2LONGOK See MKF.definitions
mkf.deadlocks[BaseFile=x] When two transactions are both locked on each others buffers so one transaction must be aborted to start over. A high number of these is inefficient and occurs when too many maximum concurrent transactions are being used or when the database is very small and the few transactions access the same blocks alot.
MKF_DEADLOCKS See MKF.definitions
August 2009 IBM System Dashboard for Enterprise Content Management User’s Guide 57

IBM System Dashboard for Enterprise Content Management
Mapping to Soft Report Symbol Definition Counter external variable
mkf.readblock[BaseFile=x] blocks read from the B-tree into the buffer pool
MKF_READBLOCK See MKF.definitions
mkf.cachehits[BaseFile=x] times the blocks were found in the buffer pool already is called cache hits
MKF_CACHEHITS See MKF.definitions
mkf.buffers[BaseFile=x] buffer pool MKF_BUFFERS See MKF.definitions
mkf.aij_read[BaseFile=x] after image journal reads
MKF_AIJ_READ See MKF.definitions
mkf.b_aij_read[BaseFile=x] after image journal blocks read
MKF_B_AIJ_READ See MKF.definitions
mkf.aij_write[BaseFile=x] after image journal writes
MKF_AIJ_WRITE See MKF.definitions
mkf.b_aij_write[BaseFile=x] after image journal blocks written
MKF_B_AIJ_WRITE See MKF.definitions
mkf.bij_read[BaseFile=x] before image journal reads
MKF_BIJ_READ See MKF.definitions
mkf.b_bij_read[BaseFile=x] before image journal blocks read
MKF_B_BIJ_READ See MKF.definitions
mkf.bij_write[BaseFile=x] before image journal writes
MKF_BIJ_WRITE See MKF.definitions
mkf.b_bij_write[BaseFile=x] before image journal blocks written
MKF_B_BIJ_WRITE See MKF.definitions
mkf.data_read[BaseFile=x] database reads MKF_DATA_READ See MKF.definitions
mkf.data_write[BaseFile=x] database blocks read
MKF_DATA_WRITE See MKF.definitions
mkf.b_data_read[BaseFile=x]
database writes MKF_B_DATA_READ See MKF.definitions
mkf.b_data_write[BaseFile=x]
database blocks written
MKF_B_DATA_WRITE See MKF.definitions
mkf.shutdown[BaseFile=x] database shutdown calls
MKF_SHUTDOWN See MKF.definitions
mkf.open[BaseFile=x] occur once per startup
MKF_OPEN See MKF.definitions
mkf.close[BaseFile=x] occur once per startup
MKF_CLOSE See MKF.definitions
August 2009 IBM System Dashboard for Enterprise Content Management User’s Guide 58
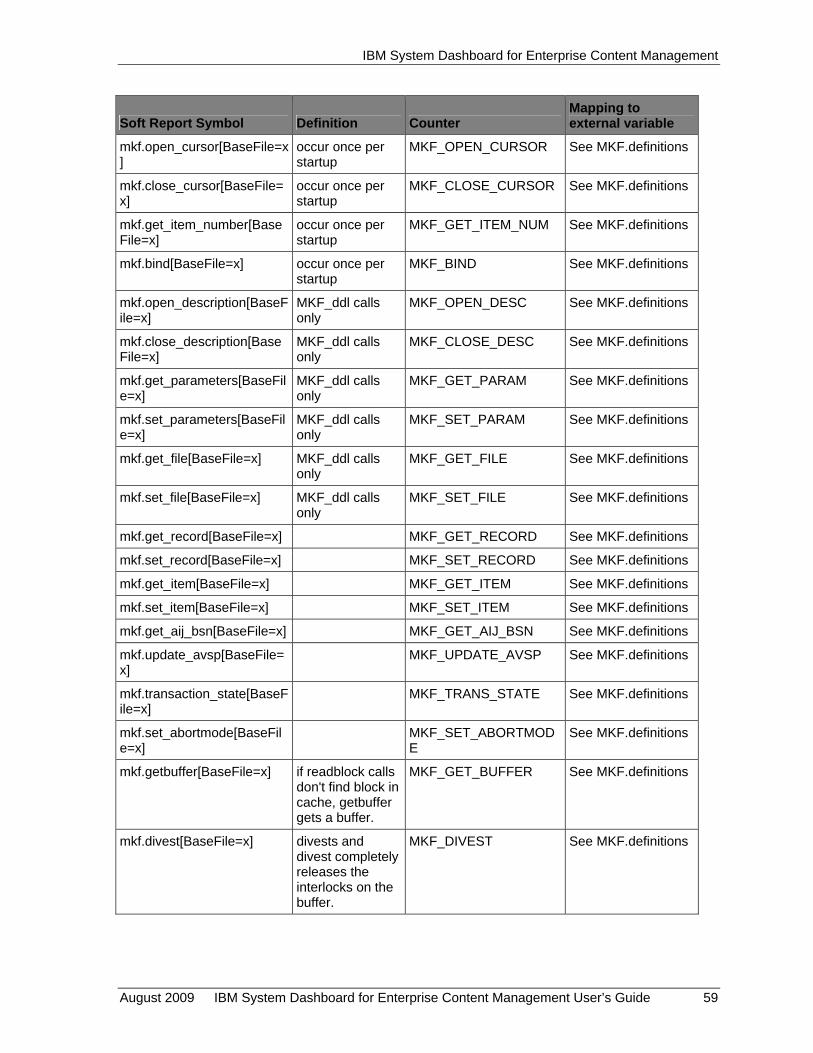
IBM System Dashboard for Enterprise Content Management
Mapping to Soft Report Symbol Definition Counter external variable
mkf.open_cursor[BaseFile=x]
occur once per startup
MKF_OPEN_CURSOR See MKF.definitions
mkf.close_cursor[BaseFile=x]
occur once per startup
MKF_CLOSE_CURSOR See MKF.definitions
mkf.get_item_number[BaseFile=x]
occur once per startup
MKF_GET_ITEM_NUM See MKF.definitions
mkf.bind[BaseFile=x] occur once per startup
MKF_BIND See MKF.definitions
mkf.open_description[BaseFile=x]
MKF_ddl calls only
MKF_OPEN_DESC See MKF.definitions
mkf.close_description[BaseFile=x]
MKF_ddl calls only
MKF_CLOSE_DESC See MKF.definitions
mkf.get_parameters[BaseFile=x]
MKF_ddl calls only
MKF_GET_PARAM See MKF.definitions
mkf.set_parameters[BaseFile=x]
MKF_ddl calls only
MKF_SET_PARAM See MKF.definitions
mkf.get_file[BaseFile=x] MKF_ddl calls only
MKF_GET_FILE See MKF.definitions
mkf.set_file[BaseFile=x] MKF_ddl calls only
MKF_SET_FILE See MKF.definitions
mkf.get_record[BaseFile=x] MKF_GET_RECORD See MKF.definitions
mkf.set_record[BaseFile=x] MKF_SET_RECORD See MKF.definitions
mkf.get_item[BaseFile=x] MKF_GET_ITEM See MKF.definitions
mkf.set_item[BaseFile=x] MKF_SET_ITEM See MKF.definitions
mkf.get_aij_bsn[BaseFile=x] MKF_GET_AIJ_BSN See MKF.definitions
mkf.update_avsp[BaseFile=x]
MKF_UPDATE_AVSP See MKF.definitions
mkf.transaction_state[BaseFile=x]
MKF_TRANS_STATE See MKF.definitions
mkf.set_abortmode[BaseFile=x]
MKF_SET_ABORTMODE
See MKF.definitions
mkf.getbuffer[BaseFile=x] if readblock calls don't find block in cache, getbuffer gets a buffer.
MKF_GET_BUFFER See MKF.definitions
mkf.divest[BaseFile=x] divests and divest completely releases the interlocks on the buffer.
MKF_DIVEST See MKF.definitions
August 2009 IBM System Dashboard for Enterprise Content Management User’s Guide 59

IBM System Dashboard for Enterprise Content Management
Mapping to Soft Report Symbol Definition Counter external variable
mkf.divestcompletely[BaseFile=x]
divests and divest ompletely releases the interlocks on the buffer.
MKF_DIVESTCOMPL See MKF.definitions
mkf.search[BaseFile=x] search is the call to walk the B-tree
MKF_SEARCH See MKF.definitions
mkf.searchfirst[BaseFile=x] first try is when the find is complete by the end of the search without having to split
MKF_SEARCHFIRST See MKF.definitions
mkf.searchupdate[BaseFile=x]
for update is when the B-tree search is done to update the B-tree
MKF_SEARCHUPDATE See MKF.definitions
mkf.searchtable[BaseFile=x] search table is the number of tables searched in the B-tree
MKF_SEARCHTABLE See MKF.definitions
mkf.insertkey[BaseFile=x] insert key and delete key indicate operations to the B-tree
MKF_INSERTKEY See MKF.definitions
mkf.deletekey[BaseFile=x] insert key and delete key indicate operations to the B-tree
MKF_DELETEKEY See MKF.definitions
mkf.mergecalls[BaseFile=x] merge calls occur when partially full tables are to be merged
MKF_MERGECALL See MKF.definitions
mkf.tablemerges[BaseFile=x]
table merges are the number that are actually merged
MKF_TABLEMERGE See MKF.definitions
mkf.tablesplits[BaseFile=x] table splits are when a table splits because the key did not fit
MKF_TABLESPLIT See MKF.definitions
August 2009 IBM System Dashboard for Enterprise Content Management User’s Guide 60

IBM System Dashboard for Enterprise Content Management
Network counters
Soft Report Symbol Definition Counter
Mapping to external variable
net.SPPpktsout Sequenced packet protocol outgoing packets- This is what's used for bulk data transfer (images and such)
net_stat.no_stat.sppPktCount FDOS only
net.SPPpktsin Sequenced packet protocol incoming packets- This is what's used for bulk data transfer (images and such)
net_stat.ni_stat.sppPktCount FDOS only
net.DGPpktsin DGP = Datagram protocol incoming packets - This was used in FDOS
net_stat.ni_stat.dgpPktCount FDOS only
net.DGPpktsout DGP = Datagram protocol outgoing packets- This was used in FDOS
net_stat.no_stat.dgpPktCount FDOS only
net.ERRpktsin Error = Error packet incoming packets - Some application errors are reported via this field
net_stat.ni_stat.erpPktCount FDOS only
net.ERRpktsout Error = Error packet outgoing packets - Some application errors are reported via this field
net_stat.no_stat.erpPktCount FDOS only
net.PEPpktsin PEP = Packet exchange protocol incoming packets- This would show the Clearinghouse traffic for locating a server or asynchronous responses for doc services
net_stat.ni_stat.pepPktCount FDOS only
net.PEPpktsout PEP = Packet exchange protocol outgoing packets - This would show the Clearinghouse traffic for locating a server or asynchronous responses for doc services
net_stat.no_stat.pepPktCount FDOS only
August 2009 IBM System Dashboard for Enterprise Content Management User’s Guide 61
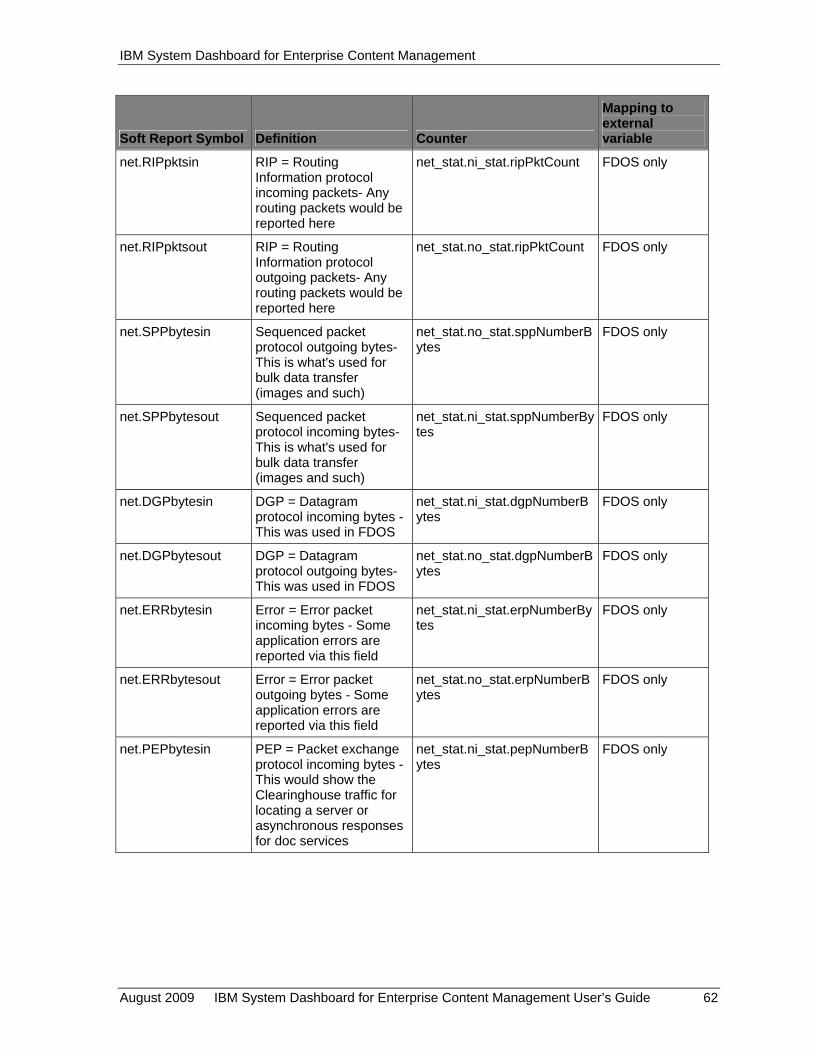
IBM System Dashboard for Enterprise Content Management
Mapping to external
Soft Report Symbol Definition Counter variable
net.RIPpktsin RIP = Routing Information protocol incoming packets- Any routing packets would be reported here
net_stat.ni_stat.ripPktCount FDOS only
net.RIPpktsout RIP = Routing Information protocol outgoing packets- Any routing packets would be reported here
net_stat.no_stat.ripPktCount FDOS only
net.SPPbytesin Sequenced packet protocol outgoing bytes- This is what's used for bulk data transfer (images and such)
net_stat.no_stat.sppNumberBytes
FDOS only
net.SPPbytesout Sequenced packet protocol incoming bytes- This is what's used for bulk data transfer (images and such)
net_stat.ni_stat.sppNumberBytes
FDOS only
net.DGPbytesin DGP = Datagram protocol incoming bytes - This was used in FDOS
net_stat.ni_stat.dgpNumberBytes
FDOS only
net.DGPbytesout DGP = Datagram protocol outgoing bytes- This was used in FDOS
net_stat.no_stat.dgpNumberBytes
FDOS only
net.ERRbytesin Error = Error packet incoming bytes - Some application errors are reported via this field
net_stat.ni_stat.erpNumberBytes
FDOS only
net.ERRbytesout Error = Error packet outgoing bytes - Some application errors are reported via this field
net_stat.no_stat.erpNumberBytes
FDOS only
net.PEPbytesin PEP = Packet exchange protocol incoming bytes - This would show the Clearinghouse traffic for locating a server or asynchronous responses for doc services
net_stat.ni_stat.pepNumberBytes
FDOS only
August 2009 IBM System Dashboard for Enterprise Content Management User’s Guide 62
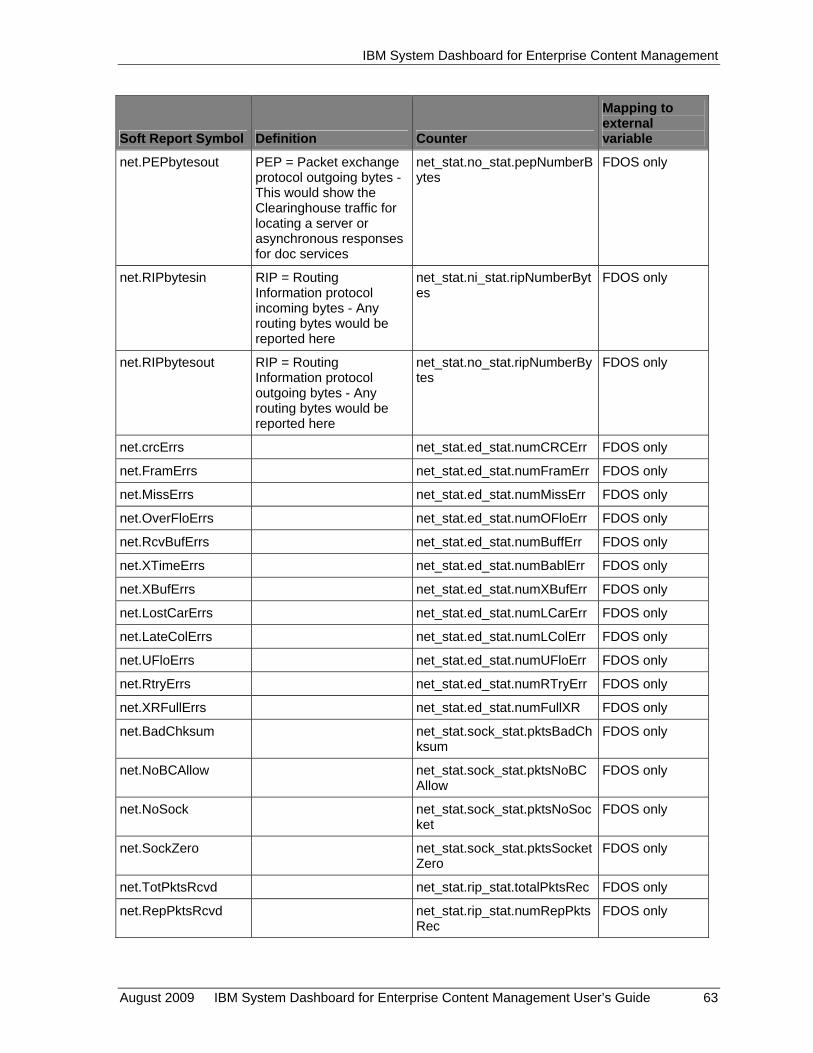
IBM System Dashboard for Enterprise Content Management
Mapping to external
Soft Report Symbol Definition Counter variable
net.PEPbytesout PEP = Packet exchange protocol outgoing bytes - This would show the Clearinghouse traffic for locating a server or asynchronous responses for doc services
net_stat.no_stat.pepNumberBytes
FDOS only
net.RIPbytesin RIP = Routing Information protocol incoming bytes - Any routing bytes would be reported here
net_stat.ni_stat.ripNumberBytes
FDOS only
net.RIPbytesout RIP = Routing Information protocol outgoing bytes - Any routing bytes would be reported here
net_stat.no_stat.ripNumberBytes
FDOS only
net.crcErrs net_stat.ed_stat.numCRCErr FDOS only
net.FramErrs net_stat.ed_stat.numFramErr FDOS only
net.MissErrs net_stat.ed_stat.numMissErr FDOS only
net.OverFloErrs net_stat.ed_stat.numOFloErr FDOS only
net.RcvBufErrs net_stat.ed_stat.numBuffErr FDOS only
net.XTimeErrs net_stat.ed_stat.numBablErr FDOS only
net.XBufErrs net_stat.ed_stat.numXBufErr FDOS only
net.LostCarErrs net_stat.ed_stat.numLCarErr FDOS only
net.LateColErrs net_stat.ed_stat.numLColErr FDOS only
net.UFloErrs net_stat.ed_stat.numUFloErr FDOS only
net.RtryErrs net_stat.ed_stat.numRTryErr FDOS only
net.XRFullErrs net_stat.ed_stat.numFullXR FDOS only
net.BadChksum net_stat.sock_stat.pktsBadChksum
FDOS only
net.NoBCAllow net_stat.sock_stat.pktsNoBCAllow
FDOS only
net.NoSock net_stat.sock_stat.pktsNoSocket
FDOS only
net.SockZero net_stat.sock_stat.pktsSocketZero
FDOS only
net.TotPktsRcvd net_stat.rip_stat.totalPktsRec FDOS only
net.RepPktsRcvd net_stat.rip_stat.numRepPktsRec
FDOS only
August 2009 IBM System Dashboard for Enterprise Content Management User’s Guide 63
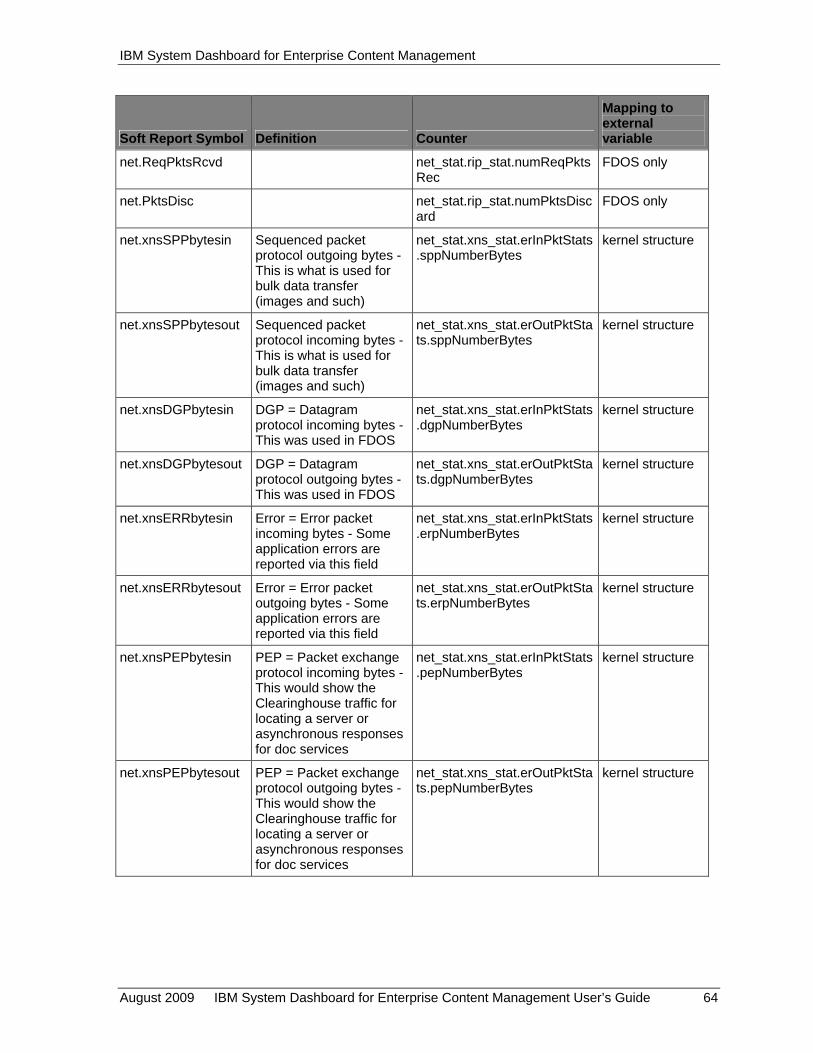
IBM System Dashboard for Enterprise Content Management
Mapping to external
Soft Report Symbol Definition Counter variable
net.ReqPktsRcvd net_stat.rip_stat.numReqPktsRec
FDOS only
net.PktsDisc net_stat.rip_stat.numPktsDiscard
FDOS only
net.xnsSPPbytesin Sequenced packet protocol outgoing bytes - This is what is used for bulk data transfer (images and such)
net_stat.xns_stat.erInPktStats.sppNumberBytes
kernel structure
net.xnsSPPbytesout Sequenced packet protocol incoming bytes - This is what is used for bulk data transfer (images and such)
net_stat.xns_stat.erOutPktStats.sppNumberBytes
kernel structure
net.xnsDGPbytesin DGP = Datagram protocol incoming bytes - This was used in FDOS
net_stat.xns_stat.erInPktStats.dgpNumberBytes
kernel structure
net.xnsDGPbytesout DGP = Datagram protocol outgoing bytes - This was used in FDOS
net_stat.xns_stat.erOutPktStats.dgpNumberBytes
kernel structure
net.xnsERRbytesin Error = Error packet incoming bytes - Some application errors are reported via this field
net_stat.xns_stat.erInPktStats.erpNumberBytes
kernel structure
net.xnsERRbytesout Error = Error packet outgoing bytes - Some application errors are reported via this field
net_stat.xns_stat.erOutPktStats.erpNumberBytes
kernel structure
net.xnsPEPbytesin PEP = Packet exchange protocol incoming bytes - This would show the Clearinghouse traffic for locating a server or asynchronous responses for doc services
net_stat.xns_stat.erInPktStats.pepNumberBytes
kernel structure
net.xnsPEPbytesout PEP = Packet exchange protocol outgoing bytes - This would show the Clearinghouse traffic for locating a server or asynchronous responses for doc services
net_stat.xns_stat.erOutPktStats.pepNumberBytes
kernel structure
August 2009 IBM System Dashboard for Enterprise Content Management User’s Guide 64
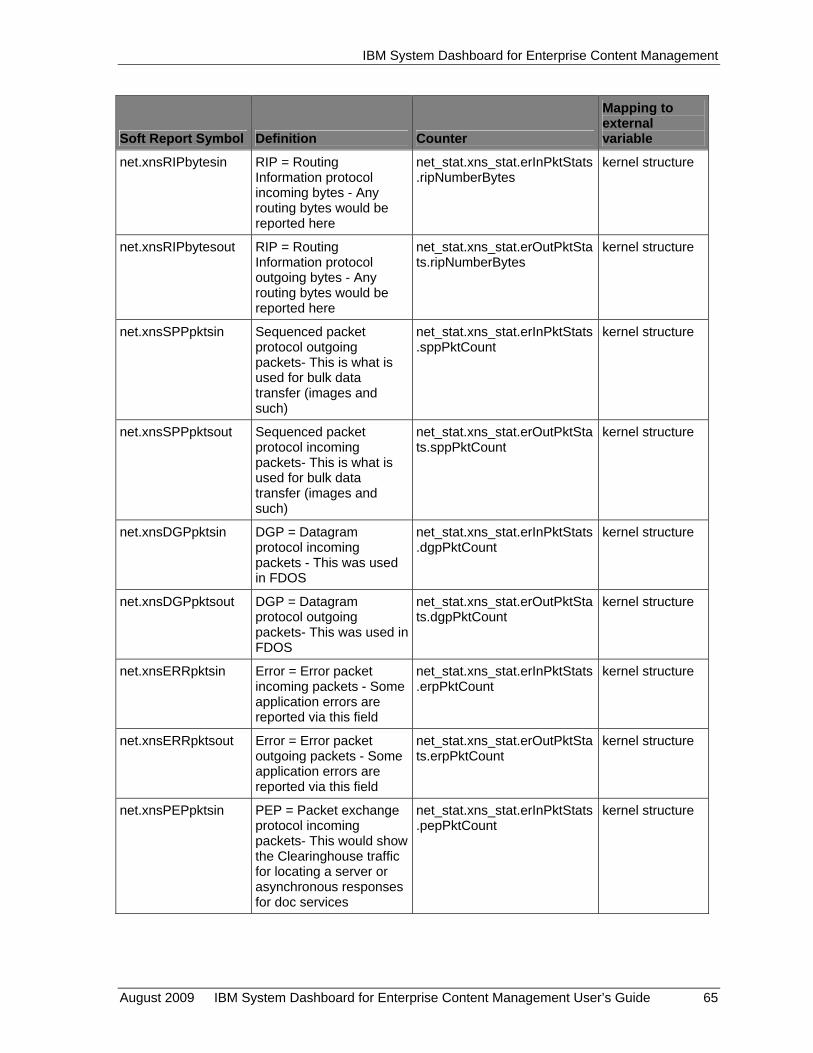
IBM System Dashboard for Enterprise Content Management
Mapping to external
Soft Report Symbol Definition Counter variable
net.xnsRIPbytesin RIP = Routing Information protocol incoming bytes - Any routing bytes would be reported here
net_stat.xns_stat.erInPktStats.ripNumberBytes
kernel structure
net.xnsRIPbytesout RIP = Routing Information protocol outgoing bytes - Any routing bytes would be reported here
net_stat.xns_stat.erOutPktStats.ripNumberBytes
kernel structure
net.xnsSPPpktsin Sequenced packet protocol outgoing packets- This is what is used for bulk data transfer (images and such)
net_stat.xns_stat.erInPktStats.sppPktCount
kernel structure
net.xnsSPPpktsout Sequenced packet protocol incoming packets- This is what is used for bulk data transfer (images and such)
net_stat.xns_stat.erOutPktStats.sppPktCount
kernel structure
net.xnsDGPpktsin DGP = Datagram protocol incoming packets - This was used in FDOS
net_stat.xns_stat.erInPktStats.dgpPktCount
kernel structure
net.xnsDGPpktsout DGP = Datagram protocol outgoing packets- This was used in FDOS
net_stat.xns_stat.erOutPktStats.dgpPktCount
kernel structure
net.xnsERRpktsin Error = Error packet incoming packets - Some application errors are reported via this field
net_stat.xns_stat.erInPktStats.erpPktCount
kernel structure
net.xnsERRpktsout Error = Error packet outgoing packets - Some application errors are reported via this field
net_stat.xns_stat.erOutPktStats.erpPktCount
kernel structure
net.xnsPEPpktsin PEP = Packet exchange protocol incoming packets- This would show the Clearinghouse traffic for locating a server or asynchronous responses for doc services
net_stat.xns_stat.erInPktStats.pepPktCount
kernel structure
August 2009 IBM System Dashboard for Enterprise Content Management User’s Guide 65

IBM System Dashboard for Enterprise Content Management
Mapping to external
Soft Report Symbol Definition Counter variable
net.xnsPEPpktsout PEP = Packet exchange protocol outgoing packets - This would show the Clearinghouse traffic for locating a server or asynchronous responses for doc services
net_stat.xns_stat.erOutPktStats.pepPktCount
kernel structure
net.xnsRIPpktsin RIP = Routing Information protocol incoming packets- Any routing packets would be reported here
net_stat.xns_stat.erInPktStats.ripPktCount
kernel structure
net.xnsRIPpktsout RIP = Routing Information protocol outgoing packets- Any routing packets would be reported here
net_stat.xns_stat.erOutPktStats.ripPktCount
kernel structure
net.tcppktsin packets received by device
net_stat.tcp_stat.tcps_rcvpack
kernel structure
net.tcppktsout packets received by device
net_stat.tcp_stat.tcps_sndpack
kernel structure
net.tcpbytesin bytes received by device net_stat.tcp_stat.tcps_rcvbyte kernel structure
net.tcpbytesout bytes transmitted by device
net_stat.tcp_stat.tcps_sndbyte
kernel structure
net.tcppktsrexmts packets retransmitted net_stat.tcp_stat.tcps_sndrexmitpack
kernel structure
net.tcppktoutoforder out of order packets received
net_stat.tcp_stat.tcps_rcvoopack
kernel structure
net.tcpconnattempts connection attempts net_stat.tcp_stat.tcps_connattempt
kernel structure
net.tcpconnaccepts connection accepts net_stat.tcp_stat.tcps_accepts
kernel structure
net.tcpconns connections made net_stat.tcp_stat.tcps_connects
kernel structure
net.tcpconncloses connections closed net_stat.tcp_stat.tcps_closed kernel structure
net.tcpkeepdrops connections dropped in keepalive
net_stat.tcp_stat.tcps_keepdrops
kernel structure
net.tcptimeoutdrops connections dropped in retransmit timeout
net_stat.tcp_stat.tcps_timeoutdrop
kernel structure
net.tcpembconndrops embryonic connections dropped
net_stat.tcp_stat.tcps_conndrops
kernel structure
August 2009 IBM System Dashboard for Enterprise Content Management User’s Guide 66
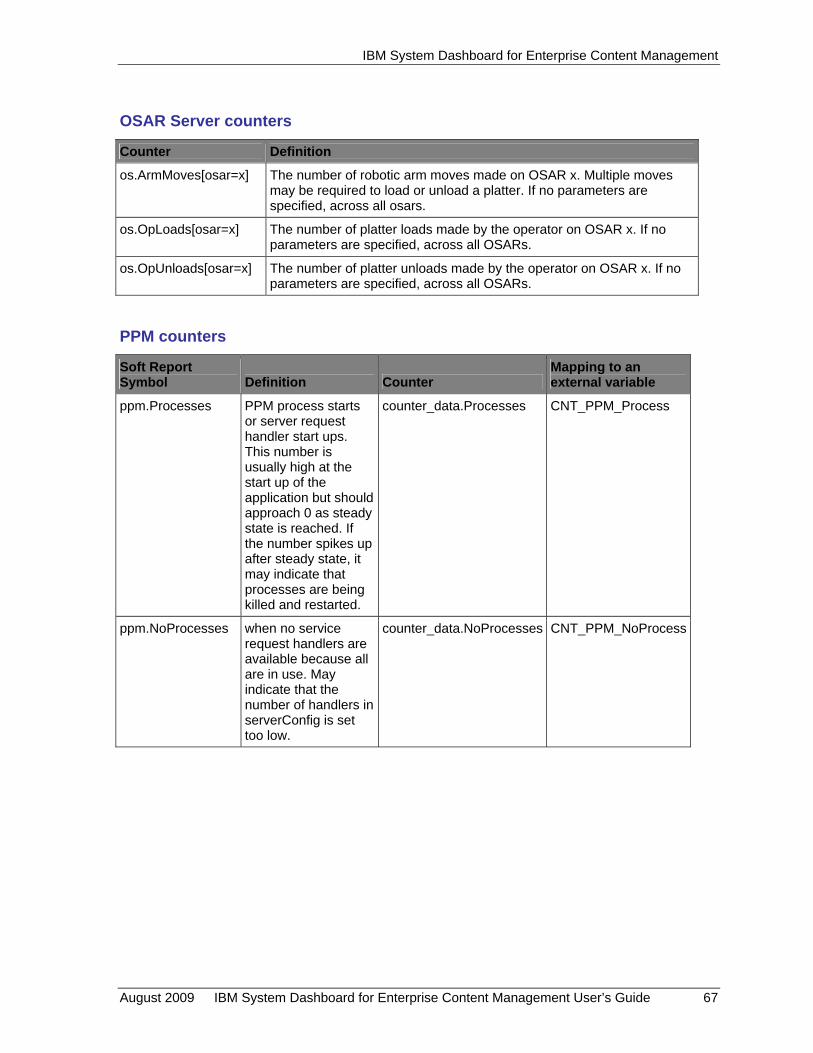
IBM System Dashboard for Enterprise Content Management
OSAR Server counters
Counter Definition
os.ArmMoves[osar=x] The number of robotic arm moves made on OSAR x. Multiple moves may be required to load or unload a platter. If no parameters are specified, across all osars.
os.OpLoads[osar=x] The number of platter loads made by the operator on OSAR x. If no parameters are specified, across all OSARs.
os.OpUnloads[osar=x] The number of platter unloads made by the operator on OSAR x. If no parameters are specified, across all OSARs.
PPM counters
Soft Report Symbol Definition Counter
Mapping to an external variable
ppm.Processes PPM process starts or server request handler start ups. This number is usually high at the start up of the application but should approach 0 as steady state is reached. If the number spikes up after steady state, it may indicate that processes are being killed and restarted.
counter_data.Processes CNT_PPM_Process
ppm.NoProcesses when no service request handlers are available because all are in use. May indicate that the number of handlers in serverConfig is set too low.
counter_data.NoProcesses CNT_PPM_NoProcess
August 2009 IBM System Dashboard for Enterprise Content Management User’s Guide 67

IBM System Dashboard for Enterprise Content Management
RPC counters
DOC counters
Property Description
AllocateIds The range of contiguous image IDs allocated per system base.
BatchClose The number of batches closed.
BatchCreate The number of batches created.
BatchWrite The number of batches written to media.
DeleteDocuments The number of documents deleted.
GetServerInfo Network address and default cache name for a specific storage library server.
Logoff Major Code: Identifies the service in the Event Logging Abstract (ELA). The major numbers are listed in the /fnsw/lib/perf/ela/elacodes file. Max Minor: The maximum number of minor events (RPCs) within a service. This number is defined in the /fnsw/lbi/perf/ela/elacodes file as the second number on the event line.
Logon Major Code: Identifies the service in the Event Logging Abstract (ELA). The major numbers are listed in the /fnsw/lib/perf/ela/elacodes file. Max Minor: The maximum number of minor events (RPCs) within a service. This number is defined in the /fnsw/lbi/perf/ela/elacodes file as the second number on the event line.
ModifyDocumentAt Num Minors:
System counters
Soft Report Symbol Definition Counter Mapping to an external variable
sys.idle clock ticks whenever the wait process is the current running process
sys_stat.sysinfo.cpu[0] /usr/include/sys/sysinfo.h structure cpu[0]
sys.kernel clock ticks when current process is executing in the kernel mode
sys_stat.sysinfo.cpu[2] /usr/include/sys/sysinfo.h structure cpu[2]
sys.user clock ticks when current process is executing in the user mode
sys_stat.sysinfo.cpu[1] /usr/include/sys/sysinfo.h structure cpu[1]
sys.wait clock ticks when the current process is waiting for a block i/o request to complete
sys_stat.sysinfo.cpu[3] /usr/include/sys/sysinfo.h structure cpu[3]
August 2009 IBM System Dashboard for Enterprise Content Management User’s Guide 68

IBM System Dashboard for Enterprise Content Management
Mapping to an Soft Report Symbol Definition Counter external variable
sys.swapins system requests initiating a transfer to the swap device
sys_stat.sysinfo.swapin FDOS only /usr/include/sys/sysinfo.h structure swapin
sys.swapouts system requests initiating a transfer from the swap device
sys_stat.sysinfo.swapout FDOS only/usr/include/sys/sysinfo.h structure swapout
sys.sysopen file system opens fs_stat.fss_sys_open FDOS only
sys.sysclose file system closes fs_stat.fss_sys_close FDOS only
sys.procs current processes sys_stat.sysinfo.numprocs
MPE only
sys.pready processes in the ready queue
sys_stat.sysinfo.pready MPE only
sys.pcreates processes created sys_stat.sysinfo.pcreates MPE only
sys.plaunches process launches sys_stat.sysinfo.plaunches
MPE only
sys.breads read operations from block devices
sys_stat.sysinfo.bread /usr/include/sys/sysinfo.h structure bread
sys.creads bytes transferred by read system calls
sys_stat.sysinfo.readch OLI or FDOS only /usr/include/sys/sysinfo.h structure readch
sys.cwrite bytes transferred by write system calls
sys_stat.sysinfo.writech OLI or FDOS only /usr/include/sys/sysinfo.h structure writech
sys.readch bytes transferred by read system calls
sys_stat.sysinfo.readch not Oli or FDOS /usr/include/sys/sysinfo.h structure readch
sys.writech bytes transferred by write system calls
sys_stat.sysinfo.writech not Oli or FDOS /usr/include/sys/sysinfo.h structure writech
sys.lread logical read requests issued by the system to block devices
sys_stat.sysinfo.lread /usr/include/sys/sysinfo.h structure lread
sys.sysread system read calls sys_stat.sysinfo.sysread /usr/include/sys/sysinfo.h structure sysread
August 2009 IBM System Dashboard for Enterprise Content Management User’s Guide 69

IBM System Dashboard for Enterprise Content Management
Mapping to an Soft Report Symbol Definition Counter external variable
sys.bwrite write operations to block devices
sys_stat.sysinfo.bwrite /usr/include/sys/sysinfo.h structure bwrite
sys.lwrite logical write requests issued by the system to block devices
sys_stat.sysinfo.lwrite /usr/include/sys/sysinfo.h structure lwrite
sys.syswrite system write calls sys_stat.sysinfo.syswrite /usr/include/sys/sysinfo.h structure syswrite
sys.bswapin bytes of data transferred to the swap device
sys_stat.sysinfo.bswapin FDOS only /usr/include/sys/sysinfo.h structure bswapin
sys.bswapout bytes of data transferred from the swap device
sys_stat.sysinfo.bswapout
FDOS only /usr/include/sys/sysinfo.h structure bswapout
sys.pswitches process switches sys_stat.sysinfo.pswitch /usr/include/sys/sysinfo.h structure pswitch
sys.calls system calls sys_stat.sysinfo.syscall /usr/include/sys/sysinfo.h structure syscall
sys.forks forks sys_stat.sysinfo.sysfork /usr/include/sys/sysinfo.h structure sysforkl
sys.execs system execs sys_stat.sysinfo.sysexec /usr/include/sys/sysinfo.h structure sysexe
sys.runque cumulative total, at one second intervals, of the processes ready to run
sys_stat.sysinfo.runque /usr/include/sys/sysinfo.h structure runque
sys.runocc times runque was updated
sys_stat.sysinfo.runocc /usr/include/sys/sysinfo.h structure runocc
sys.swpque cumulative total, at 1 second intervals, of processes waiting to be swapped in
sys_stat.sysinfo.swpque /usr/include/sys/sysinfo.h structure swpque
sys.swpocc times swpque was updated
sys_stat.sysinfo.swpocc /usr/include/sys/sysinfo.h structure swpocc
sys.sema semaphore operations
sys_stat.sysinfo.sema /usr/include/sys/sysinfo.h structure sema
August 2009 IBM System Dashboard for Enterprise Content Management User’s Guide 70

IBM System Dashboard for Enterprise Content Management
Mapping to an Soft Report Symbol Definition Counter external variable
sys.msg message sending and receiving activities
sys_stat.sysinfo.msg /usr/include/sys/sysinfo.h structure msg
sys.rcvint hardware interrupts on the receiver
sys_stat.sysinfo.rcvint /usr/include/sys/sysinfo.h structure rcvint
sys.xmtint hardware interrupts on the transmitter
sys_stat.sysinfo.xmtint /usr/include/sys/sysinfo.h structure xmtint
sys.mdmint hardware interrupts on the modem
sys_stat.sysinfo.mdmint /usr/include/sys/sysinfo.h structure mdmint
sys.rawch characters in the raw queue
sys_stat.sysinfo.rawch /usr/include/sys/sysinfo.h structure rawch
sys.outch characters in the output queue
sys_stat.sysinfo.outch /usr/include/sys/sysinfo.h structure outch
sys.phread read requests issued by the system to raw devices
sys_stat.sysinfo.phread /usr/include/sys/sysinfo.h structure phread
sys.phwrite write requests issued by the system to raw devices
sys_stat.sysinfo.phwrite /usr/include/sys/sysinfo.h structure phwrite
sys.canch characters in the canonical queue
sys_stat.sysinfo.canch /usr/include/sys/sysinfo.h structure canch
sys.dirblk directory block reads sys_stat.sysinfo.dirblk /usr/include/sys/sysinfo.h structure dirblk
sys.kprocscreated kernel processes created
sys_stat.sysinfo.ksched AIX only /usr/include/sys/sysinfo.h structure ksched
sys.kprocsoverflow times the creation of a kernel process fails because the max forks or processes has been reached
sys_stat.sysinfo.koverf AIX only /usr/include/sys/sysinfo.h structure koverf
sys.kzombies times the kernel process has become a zombie
sys_stat.sysinfo.kexit AIX only /usr/include/sys/sysinfo.h structure kexit
August 2009 IBM System Dashboard for Enterprise Content Management User’s Guide 71

IBM System Dashboard for Enterprise Content Management
Mapping to an Soft Report Symbol Definition Counter external variable
sys.remreadreqs remote read requests sys_stat.sysinfo.rbread AIX only /usr/include/sys/sysinfo.h structure rbread
sys.remreadsfromcache reads from remote cache
sys_stat.sysinfo.rcread AIX only /usr/include/sys/sysinfo.h structure rcread
sys.remwritereqs remote write requests sys_stat.sysinfo.rbwrt AIX only /usr/include/sys/sysinfo.h structure rbwrt
sys.remwritesfromcache
cached remote writes sys_stat.sysinfo.rcwrt AIX only /usr/include/sys/sysinfo.h structure rcwrt
sys.deviceintrpts device interrupts sys_stat.sysinfo.devintrs AIX only /usr/include/sys/sysinfo.h structure devintrs
sys.softwareintrpts software interrupts sys_stat.sysinfo.softintrs AIX only /usr/include/sys/sysinfo.h structure softintrs
sys.traps traps sys_stat.sysinfo.traps AIX only /usr/include/sys/sysinfo.h structure traps
Virtual Memory counters
Soft Report Symbol Definition Counter Mapping to external variable
vmm.pagefaults page faults vmm_stat.pgexct AIX only /usr/include/sys/vminfo.h structure pgexct
vmm.reclaims page reclaims vmm_stat.pgrclm AIX only /usr/include/sys/vminfo.h structure pgrclm
vmm.lockmisses lockmisses vmm_stat.lockexct AIX only /usr/include/sys/vminfo.h structure lockexct
August 2009 IBM System Dashboard for Enterprise Content Management User’s Guide 72
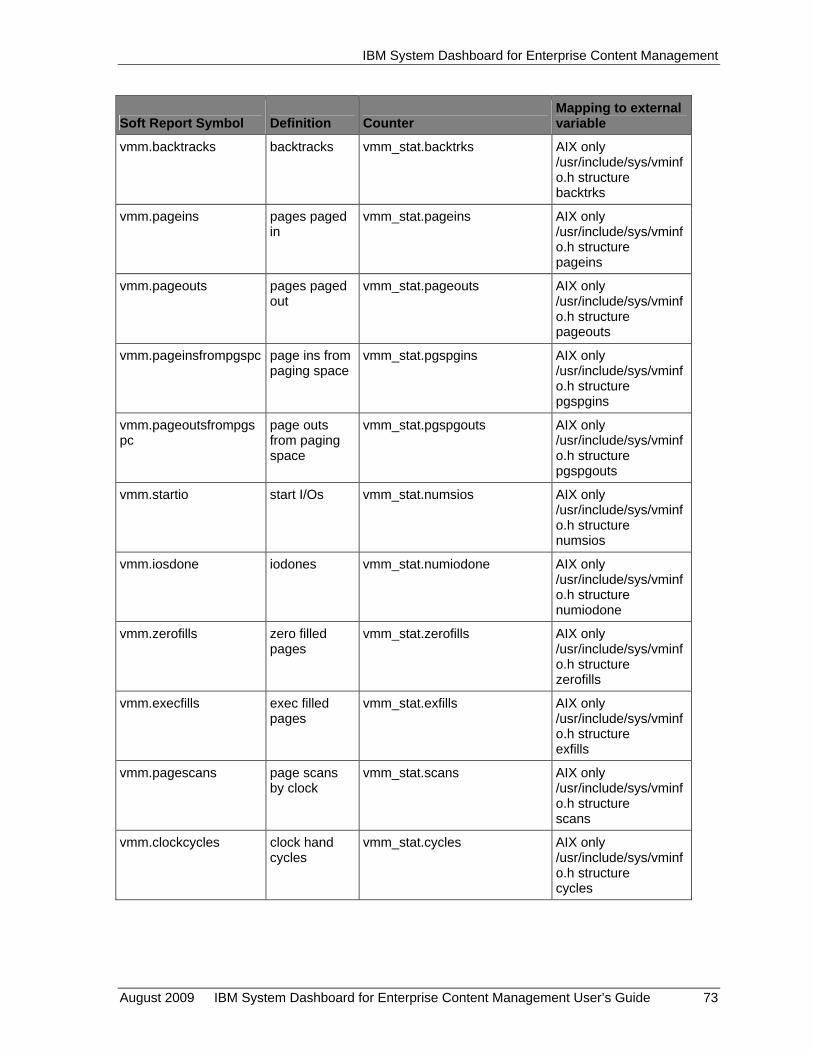
IBM System Dashboard for Enterprise Content Management
Mapping to external Soft Report Symbol Definition Counter variable
vmm.backtracks backtracks vmm_stat.backtrks AIX only /usr/include/sys/vminfo.h structure backtrks
vmm.pageins pages paged in
vmm_stat.pageins AIX only /usr/include/sys/vminfo.h structure pageins
vmm.pageouts pages paged out
vmm_stat.pageouts AIX only /usr/include/sys/vminfo.h structure pageouts
vmm.pageinsfrompgspc page ins from paging space
vmm_stat.pgspgins AIX only /usr/include/sys/vminfo.h structure pgspgins
vmm.pageoutsfrompgspc
page outs from paging space
vmm_stat.pgspgouts AIX only /usr/include/sys/vminfo.h structure pgspgouts
vmm.startio start I/Os vmm_stat.numsios AIX only /usr/include/sys/vminfo.h structure numsios
vmm.iosdone iodones vmm_stat.numiodone AIX only /usr/include/sys/vminfo.h structure numiodone
vmm.zerofills zero filled pages
vmm_stat.zerofills AIX only /usr/include/sys/vminfo.h structure zerofills
vmm.execfills exec filled pages
vmm_stat.exfills AIX only /usr/include/sys/vminfo.h structure exfills
vmm.pagescans page scans by clock
vmm_stat.scans AIX only /usr/include/sys/vminfo.h structure scans
vmm.clockcycles clock hand cycles
vmm_stat.cycles AIX only /usr/include/sys/vminfo.h structure cycles
August 2009 IBM System Dashboard for Enterprise Content Management User’s Guide 73

IBM System Dashboard for Enterprise Content Management
Mapping to external Soft Report Symbol Definition Counter variable
vmm.pgsteals page steals vmm_stat.pgsteals AIX only /usr/include/sys/vminfo.h structure pgsteals
vmm.freewaits free frame waits
vmm_stat.freewts AIX only /usr/include/sys/vminfo.h structure freewts
vmm.extendwaits extend XPT waits
vmm_stat.extendwts AIX only /usr/include/sys/vminfo.h structure extendwts
vmm.pendiowaits pending I/O waits
vmm_stat.pendiowts AIX only /usr/include/sys/vminfo.h structure pendiowts
vmm.pings ping-pongs, source to alias
vmm_stat.pings AIX only /usr/include/sys/vminfo.h structure pings
vmm.pongs ping-pongs, alias to source
vmm_stat.pongs AIX only /usr/include/sys/vminfo.h structure pongs
vmm.pangs ping-pongs, alias to alias
vmm_stat.pangs AIX only /usr/include/sys/vminfo.h structure pangs
vmm.wpongs ping-pongs, alias page delete
vmm_stat.wpongs AIX only /usr/include/sys/vminfo.h structure wpongs
vmm.dpongs ping-pongs, alias page writes
vmm_stat.dpongs AIX only /usr/include/sys/vminfo.h structure dpongs
vmm.cacheflushes ping-pong cache flushes
vmm_stat.cachef AIX only /usr/include/sys/vminfo.h structure cachef
vmm.cacheinvalids ping-pong cache invalidates
vmm_stat.cachei AIX only /usr/include/sys/vminfo.h structure cachei
vmm.pageins See Olivetti kernel definitions
vmm_stat.v_pgin Olivetti only
August 2009 IBM System Dashboard for Enterprise Content Management User’s Guide 74

IBM System Dashboard for Enterprise Content Management
Mapping to external Soft Report Symbol Definition Counter variable
vmm.pageouts See Olivetti kernel definitions
vmm_stat.v_pgout Olivetti only
vmm.pageinsfrompgspc See Olivetti kernel definitions
vmm_stat.v_pgpgin Olivetti only
vmm.pageoutsfrompgspc
See Olivetti kernel definitions
vmm_stat.v_pgpgout Olivetti only
vmm.swapins See Olivetti kernel definitions
vmm_stat.v_swpin Olivetti only
vmm.swapouts See Olivetti kernel definitions
vmm_stat.v_swpout Olivetti only
vmm.pgswapins See Olivetti kernel definitions
vmm_stat.v_pswpin Olivetti only
vmm.pgswapouts See Olivetti kernel definitions
vmm_stat.v_pswpout Olivetti only
vmm.pfaults See Olivetti kernel definitions
vmm_stat.v_pfault Olivetti only
vmm.vfaults See Olivetti kernel definitions
vmm_stat.v_vfault Olivetti only
vmm.pagesize lvmm_stat.page_size FDOS only
vmm.cputype lvmm_stat.cpu_type FDOS only
vmm.pagescore lvmm_stat.core_total FDOS only
vmm.pagesfree lvmm_stat.coremap_free FDOS only
vmm.pagesshared lvmm_stat.shared_total FDOS only
vmm.pagessharedfree lvmm_stat.page_size FDOS only
vmm.max_pagesused lvmm_stat.coremap_used_max FDOS only
vmm.min_pagesfree lvmm_stat.coremap_free_min FDOS only
vmm.max_pagesshared lvmm_stat.shmap_used_max FDOS only
vmm.min_pagesshared lvmm_stat.shmap_free_min FDOS only
vmm.shmem_req lvmm_stat.shmem_req FDOS only
vmm.shmem_ret lvmm_stat.shmem_ret FDOS only
vmm.stack_grow lvmm_stat.stack_grow FDOS only
vmm.proc_exit lvmm_stat.proc_exit FDOS only
August 2009 IBM System Dashboard for Enterprise Content Management User’s Guide 75

IBM System Dashboard for Enterprise Content Management
Mapping to external Soft Report Symbol Definition Counter variable
vmm.absloads lvmm_stat.absload FDOS only
vmm.absunloads lvmm_stat.absunload FDOS only
vmm.abslinks lvmm_stat.abslink FDOS only
vmm.absunlinks lvmm_stat.absunlink FDOS only
vmm.absswapins lvmm_stat.absswapin FDOS only
vmm.absswapouts lvmm_stat.absswapout FDOS only
vmm.rswapins lvmm_stat.rswapin FDOS only
vmm.rswapouts lvmm_stat.rswapout FDOS only
vmm.rbswapins lvmm_stat.rbswapin FDOS only
vmm.rbswapouts lvmm_stat.rbswapout FDOS only
WorkFlo counters
Soft Report Symbol Definition Counter
Mapping to external variable
wfl.CreateQueue [Queue=x]
calls to create a WorkFlo queue
WQS_create_queue_func See WQS definitions
wfl.DeleteQueue [Queue=x]
calls to delete a WorkFlo queue
WQS_delete_queue_func See WQS definitions
wfl.GetQueueDesc [Queue=x]
calls to get queue description
WQS_get_queue_desc_func See WQS definitions
wfl.UpdateQueue [Queue=x]
calls to update a queue
WQS_update_queue_func See WQS definitions
wfl.OpenQueue [Queue=x]
calls to open a queue
WQS_open_queue_func See WQS definitions
wfl.CloseQueue [Queue=x]
calls to close a queue
WQS_close_queue_func See WQS definitions
wfl.CountEntries [Queue=x]
calls to count the entries in a queue
WQS_count_entries_func See WQS definitions
wfl.ReadQueue [Queue=x]
calls to fetch an entry in a queue
WQS_read_queue_func See WQS definitions
wfl.ReadEntry [Queue=x]
WQS_read_entry_func See WQS definitions
wfl.InsertEntry [Queue=x]
calls to insert an entry in a queue
WQS_insert_entry_func See WQS definitions
wfl.DeleteEntry [Queue=x]
calls to delete an entry in a queue
WQS_delete_entry_func See WQS definitions
wfl.UpdateEntry [Queue=x]
calls to update an entry in a queue
WQS_update_entry_func See WQS definitions
August 2009 IBM System Dashboard for Enterprise Content Management User’s Guide 76

IBM System Dashboard for Enterprise Content Management
Soft Report Mapping to external Definition Counter Symbol variable
wfl.StartDump [Queue=x]
startdump calls, must be called to run ReadDump
WQS_start_dump_func See WQS definitions
wfl.ReadDump [Queue=x]
read dump calls to read entries in a queue
WQS_read_dump_func See WQS definitions
wfl.EndDump [Queue=x]
end dump calls, called after ReadDump calls
WQS_end_dump_func See WQS definitions
Process Engine counters Image Services counters also run on Process Engine (PE) and are identified as IS (mini) counters. The IS mini counters on PE are identical to their counterparts on IS. See Image Services counters for more information.
The following PE counters are also defined:
• Error counters
• RPC counters
Error counters
Property Description
Authentication errors The number of authentication errors due to no permission.
Authentication token timeouts
The number of authenication token timeouts.
Database reconnect The number of times a database reconnection occurred.
E-mail notification errors
The number of errors that have occurred while attempting to send an e-mail notification.
Exceed the isolated region cache
The number of times the system has exceeded the suggested maximum number of cached isolated regions.
Exceed the workspace cache
The number of times the system has had to replace an item in the workspace cache because the cache was full.
Lock work object errors The number of times an attempt has been made to lock a work item, and that attempt has failed because the work item was already locked, did not exist, or had been updated since the query was done. If this counter increments excessively, try changing the work performers so that they browse and lock in the same API call (use the "query specifier" APIs), instead of reading the work item in one API call and locking it in another. See Help for Process Development for further information.
Move work objects duplicates errors
The number of times an attempt has been made to put a work item into a queue on a different PE server , but the work item already existed on that queue. This error occurs occasionally during normal operation if a work item repeatedly moves between two queues on different PE
August 2009 IBM System Dashboard for Enterprise Content Management User’s Guide 77

IBM System Dashboard for Enterprise Content Management
Property Description
servers. This error occurs rapidly if: a. The databases get out of sync because a database restore was done on one or more PE servers without running the vwverify utility or … b. Someone uses a low-level database tool such as Oracle SQL*Plus or Microsoft SQL Server isql and modifies the database. For example, using a low-level database tool to remove the "system locked" status of a work item causes this error. Note: The use of such low-level database tools to modify the database in any way is not supported.) If this error occurs excessively, use the vwverify utility to verify the WorkFlo database.
Move work object to new server errors
The number of times an attempt has been made to put a work item into a queue on a different PE server, but the PE server or database was unavailable. If this error occurs frequently, check that all PE servers are up and the PE software is running on all servers. Fix any errors reported in the system error logs. See Help for Process Task Manager for more information about event logs.
Timer manager update errors
The number of times the timer software tried to time out a work item, but was unable to do so because the work item was locked or missing. This error occurs occasionally during normal operation when the timer software and a user-defined work performer try to access a work item at the same time. If this error occurs excessively, restructure your workflow so that work items do not time out as frequently while they are locked.
Transaction deadlock errors
The number of times a database transaction has been aborted and retried due to a database deadlock error. If this error occurs frequently, report this condition to IBM Software Support. There is no field remedy for frequent occurrences of this error.
Work objects skipped due to security errors
The number of times the timer software tried to time out a work item, but was unable to do so because the work item was locked or missing. This error occurs occasionally during normal operation when the timer software and a user-defined work performer try to access a work item at the same time. If this error occurs excessively, restructure your workflow so that work items do not time out as frequently while they are locked. The number of times a work item was omitted from the results of a query because the caller did not have read or write access. Excessive numbers of these errors result in lower performance because PE is reading significantly more data than is being returned to the user. This error occurs under the following circumstances: - A record is read from the event log, but the user does not have read access as defined in the work class for the event log. - A record is read from a queue, but the user does not have read or write access as defined in the work class for the work item. - A record is read from the roster, but the user does not have read access as defined in the work class for the roster record. If this error happens frequently, allow more access rights to work object data by means of the work class, and possibly restrict access to the work item data by means of security on queues or rosters.
August 2009 IBM System Dashboard for Enterprise Content Management User’s Guide 78

IBM System Dashboard for Enterprise Content Management
RPC counters
Property Description
Executed regular steps The number of regular steps completed.
Executed system steps The number of system steps completed.
External RPCs The number of RPCs that come only from the client.
Internal RPCs The number of RPCs that come only from another Process Engine (PE) server (that is, communication to the VWSs process from VWRs, VWKs, vwtool, and others).
Java RMI RPCs The number of Java API calls that have been processed.
Object Service RPCs The number of RPCs that come from PE servers and clients, and are used to read objects (such as work classes, work performer classes, or instruction sheets) that are contained in BLOB format.
Work Object Inject RPCs
The number of calls to the work item inject (create) RPC.
Queue Query RPCs The number of calls to the queue query RPCs.
Roster Query RPCs The number of calls to the roster query RPCs.
Lock Work Object RPCs
The number of calls to the lock work item RPC
Update Work Object RPCs
The number of calls to the update (or dispatch) Work Object RPCs.
Invoke Web Services Instructions
The number of Invoke Web service instructions executed.
Receive Web Services Instructions
The number of Receive Web service instructions executed.
August 2009 IBM System Dashboard for Enterprise Content Management User’s Guide 79

IBM System Dashboard for Enterprise Content Management
Notices This information was developed for products and services offered in the U.S.A.
IBM may not offer the products, services, or features discussed in this document in other countries. Consult your local IBM representative for information on the products and services currently available in your area. Any reference to an IBM product, program, or service is not intended to state or imply that only that IBM product, program, or service may be used. Any functionally equivalent product, program, or service that does not infringe any IBM intellectual property right may be used instead. However, it is the user’s responsibility to evaluate and verify the operation of any non-IBM product, program, or service.
IBM may have patents or pending patent applications covering subject matter described in this document. The furnishing of this document does not grant you any license to these patents. You can send license inquiries, in writing, to:
IBM Director of Licensing IBM Corporation North Castle Drive Armonk, NY 10504-1785 U.S.A.
For license inquiries regarding double-byte (DBCS) information, contact the IBM Intellectual Property Department in your country or send inquiries, in writing, to:
Intellectual Property Licensing Legal and Intellectual Property Law IBM Japan, Ltd. 3-2-12, Roppongi, Minato-ku, Tokyo 106-8711 Japan
The following paragraph does not apply to the United Kingdom or any other country where such provisions are inconsistent with local law: INTERNATIONAL BUSINESS MACHINES CORPORATION PROVIDES THIS PUBLICATION “AS IS” WITHOUT WARRANTY OF ANY KIND, EITHER EXPRESS OR IMPLIED, INCLUDING, BUT NOT LIMITED TO, THE IMPLIED WARRANTIES OF NON-INFRINGEMENT, MERCHANTABILITY OR FITNESS FOR A PARTICULAR PURPOSE. Some states do not allow disclaimer of express or implied warranties in certain transactions, therefore, this statement may not apply to you.
This information could include technical inaccuracies or typographical errors. Changes are periodically made to the information herein; these changes will be incorporated in new editions of the publication. IBM may make improvements and/or changes in the product(s) and/or the program(s) described in this publication at any time without notice.
Any references in this information to non-IBM Web sites are provided for convenience only and do not in any manner serve as an endorsement of those Web sites. The materials at those Web sites are not part of the materials for this IBM product and use of those Web sites is at your own risk.
IBM may use or distribute any of the information you supply in any way it believes appropriate without incurring any obligation to you.
Licensees of this program who wish to have information about it for the purpose of enabling: (i) the exchange of information between independently created programs and other programs (including this one) and (ii) the mutual use of the information which has been exchanged, should contact:
August 2009 IBM System Dashboard for Enterprise Content Management User’s Guide 80
IBM System Dashboard for Enterprise Content Management
IBM Corporation J46A/G4 555 Bailey Avenue San Jose, CA 95141-1003 U.S.A.
Such information may be available, subject to appropriate terms and conditions, including in some cases, payment of a fee.
The licensed program described in this document and all licensed material available for it are provided by IBM under terms of the IBM Customer Agreement, IBM International Program License Agreement or any equivalent agreement between us.
Any performance data contained herein was determined in a controlled environment. Therefore, the results obtained in other operating environments may vary significantly. Some measurements may have been made on development-level systems and there is no guarantee that these measurements will be the same on generally available systems. Furthermore, some measurements may have been estimated through extrapolation. Actual results may vary. Users of this document should verify the applicable data for their specific environment.
Information concerning non-IBM products was obtained from the suppliers of those products, their published announcements or other publicly available sources. IBM has not tested those products and cannot confirm the accuracy of performance, compatibility or any other claims related to non-IBM products. Questions on the capabilities of non-IBM products should be addressed to the suppliers of those products.
All statements regarding IBM’s future direction or intent are subject to change or withdrawal without notice, and represent goals and objectives only.
This information contains examples of data and reports used in daily business operations. To illustrate them as completely as possible, the examples include the names of individuals, companies, brands, and products. All of these names are fictitious and any similarity to the names and addresses used by an actual business enterprise is entirely coincidental.
COPYRIGHT LICENSE:
This information contains sample application programs in source language, which illustrate programming techniques on various operating platforms. You may copy, modify, and distribute these sample programs in any form without payment to IBM, for the purposes of developing, using, marketing or distributing application programs conforming to the application programming interface for the operating platform for which the sample programs are written. These examples have not been thoroughly tested under all conditions. IBM, therefore, cannot guarantee or imply reliability, serviceability, or function of these programs. The sample programs are provided "AS IS", without warranty of any kind. IBM shall not be liable for any damages arising out of your use of the sample programs.
Trademarks IBM, the IBM logo, and ibm.com are trademarks or registered trademarks of International Business Machines Corp., registered in many jurisdictions worldwide. Other product and service names might be trademarks of IBM or other companies. A current list of IBM trademarks is available on the Web at "Copyright and trademark information” at www.ibm.com/legal/copytrade.shtml.
Microsoft and Windows are trademarks of Microsoft Corporation in the United States, other countries, or both.
UNIX is a registered trademark of The Open Group in the United States and other countries.
Java is a trademark of Sun Microsystems, Inc. in the United States, other countries, or both.
August 2009 IBM System Dashboard for Enterprise Content Management User’s Guide 81

IBM System Dashboard for Enterprise Content Management
Other company, product, or service names may be trademarks or service marks of others.
U. S. Patents Disclosure This product incorporates technology covered by one or more of the following patents: U.S. Patent Numbers: 6,094,505; 5,768,416; 5,625,465; 5,369,508; 5,258,855.
August 2009 IBM System Dashboard for Enterprise Content Management User’s Guide 82

Glossary
A accumulator: An Accumulator is a counter which is a defined subordinate to an Event. The
application adds values to the Accumulator that typically represent a measured value associated with the transpiring of the Event, and the Listener library automatically computes the total of the squares of the presented values, and the minimum and maximum values presented during each Aggregation Interval. The Manager API will use the count represented by the Event to compute an average value of the item represented by the Accumulator and the standard deviation of the values over the Aggregation Interval. An example of an Accumulator would be the duration of a particular operation; the corresponding Event would count the number of times that operation was performed.
aggregation time: The interval over which the Listener accumulates performance data before sending a summary of it to the Manager. If 0, then the Listener is in pass-through mode and sends all events to the Manager as quickly as possible, without aggregating them. For some event parameters like count, aggregation is a summation, but for other parameters like duration, the aggregation is really an averaging.
application: The FileNet product whose performance is being monitored.
C cluster: A user-defined collection of servers.
containers: Logical groupings of Events and Meters.
E event: An "event" is an occurrence that happens in the application that is deemed to be
significant. Events can have "duration" (a parameter which tells how long it took the application to perform the action associated with the event, such as a database lookup), or they can be "single" events with no associated duration.
event class: A logical collection of metrics available from a server.
J JMX: Java Management Extension technology provides the tools for building distributed, web-
based, modular and dynamic solutions for managing and monitoring devices, applications, and service-driven networks. By design, this standard is suitable for adapting legacy systems, implementing new management and monitoring solutions, and plugging into those of the future.
L listener: The Listener is the piece of software that offers the application a standard API for
providing performance data, optionally accumulates and aggregates that data, and sends it to the Manager for analysis and storage.
August 2009 IBM System Dashboard for Enterprise Content Management User’s Guide 83

IBM System Dashboard for Enterprise Content Management
M message box: A status box at the bottom of the System Manager providing user with a high-level
connectivity status.
meter: A Meter represents an absolute value, such as a measurement made by the Application or a current value, rather than a counter. Since there is only a current value, no standard deviation information is maintained, but the minimum and maximum values over each Aggregation Interval are calculated. An example of a Meter would be the amount of RAM allocated to a cache.
P product: In this context, a "product" is a FileNet application, such as the Content Engine, from
which performance data is gathered. That is, the product is the managed resource.
R RMI: Remote Method Invocation is the standard high-level Java mechanism for working with Java
objects on remote machines as if they were local, making it easy to write distributed applications.
S server: A computer or software application that provides services to other computers connected
via a network.
SNMP: The Simple Network Management Protocol, a standard for gathering statistical data about network traffic and the behavior of network components. SNMP uses management information bases (MIBs), which define what information is available from any manageable resource, and management consoles to gather and display the data and alarms. SNMP is not widely used for application management; it is more commonly used to manage hardware devices in a network. SNMP model is more suited to hardware resources, since it requires that operations be represented as configurable attributes. On the other hand, SNMP is very widely deployed.
August 2009 IBM System Dashboard for Enterprise Content Management User’s Guide 84

Index
Index
A Accessing Listener tasks ..................................22 accumulator ......................................................83 aggregation time ...............................................83 Alerts view.........................................................17 application.........................................................83 Archiving Manager ............................................26
flags ..............................................................26 syntax ...........................................................26
C CBR/Verity counters .........................................29 CE counters ......................................................28 Centera counters ..............................................29 CFS-IS Import Agent counters ..........................30 cluster ...............................................................83 Clusters view.....................................................17 components ........................................................9 Configuring the Dashboard ...............................18 containers .........................................................83 Content Retrieval counters................................30 Content Update counters ............................31, 32 Content Upload counters ..................................31 CPU counters....................................................43 CPU Event counters .........................................43 CPU Utilization counters ...................................43
D Dashboard counters..........................................42 Dashboard views ..............................................15 Database counters............................................33 Defining a cluster ..............................................18 Deleting urgent messages ................................22 Details view.......................................................16 Disk counters ..............................................44, 46 DOC counters ...................................................68 Document Services counters ............................47
E Editing a report template...................................23 Environmental Information ................................42 Error counters ...................................................77 event .................................................................83 event class ........................................................83 Event Logging Abstract (ELA) Events...............52
F features...............................................................8 File menu ..........................................................15 File System counters ........................................53 FSB/Snaplock counters ....................................33
G Garbage Collectors ...........................................45 Glossary............................................................83
I Image Services
starting the Listener.......................................19 Image Services counters.............................34, 46 Independent Repository Objects counters ........35 Installing the Dashboard ...................................10 InstallShield MultiPlatfrom.................................10 Interpreting counters .........................................28 IS (mini) counters ........................................46, 77 ISMP .................... See InstallShield MultiPlatform
J Java Management Extension technology..........83 Java Virtual Machine.........................................10 Java-specific CPU counters ..............................44 JMX................. See Java Management Extension JVM..............................See Java Virtual Machine
L Listener .........................................................9, 83
M message box.....................................................84 meter.................................................................84 Miscellaneous Static Variables counters...........54 MKF counters....................................................55
N Network counters ..............................................61 Network I/O counters ........................................44 Notices ..............................................................80
O Object Stores counters......................................37 Opening an archive file .....................................27 options.txt file ........................................10, 11, 12 OSAR Server counters......................................67 Overview ............................................................ 8
P Patents Disclosure ............................................82 perf_mon.script file............................................19 PPM counters....................................................67
August 2009 IBM System Dashboard for Enterprise Content Management User’s Guide 85

IBM System Dashboard for Enterprise Content Management
Process Engine (PE)...................................46, 77 product ..............................................................84
R Remote Method Invocation ...............................84 report template..................................................23 Reports view .....................................................17 RMI .....................See Remote Method Invocation Roll Forward Dispatcher counters.....................39 Roll Forward Processing...................................31 RPC counters........................................40, 68, 79 Running a report ...............................................24 Running a Scout report .....................................25
S Saving a report template...................................23 Scout report ......................................................25 Service Selection ..............................................20 silent installation....................................10, 11, 12 Simple Network Management Protocol .............84 Snaplock Specific counters ...............................41 SNMP ............ See Simple Network Management
Protocol Storage Area Summary counters......................41 Summary view ..................................................16 System counters ...............................................68
System Monitor .................................................. 8
T Time Range ......................................................21 Trademarks.......................................................81
U Uninstalling the Dashboard ...............................14 Upgrading the Dashboard .................................10 urgent messages
deleteing .......................................................22 Usage Reporter.................................................. 8 User counters....................................................45
V Viewing data .....................................................21 Virtual Memory counters ...................................72
W WorkFlo counters ..............................................76 Working with a report template..........................23
August 2009 IBM System Dashboard for Enterprise Content Management User’s Guide 86


����
Program Number: 5724-R95
Printed in USA
SC19-2763-02


