ICADE – 2014 FULL-YEAR RESULTS A YEAR OF SUCCESS AND A PREPARED FUTURE A refocused and adapted portfolio Improvement in the average cost of debt (−76bp) and LTV (−60bp) Increase in EPRA Earnings from property investment (+6.4%) and Group net current cash flow (+0.7%) 2015 leasing renewals anticipated Change in governance In spite of a lacklustre economic environment, Icade’s first year post-merger with Silic has validated the relevance and potential of its model. 1. Leasing activity sustained 2014 was marked by the near total leasing of EQHO space. In fact, in addition to the leasing in June 2014 of over 40,000 m² with KPMG, in the second half of 2014, Icade announced the signing of two leases covering over 16,000 m² with exclusive tenants. Today the rental dynamic is maintained since 3,724 m² of additional space, i.e. two floors, were signed on 13 February with UBAF, a French bank financing trade between Asia, Europe and the Middle East, for a fixed term of six years starting on 1 September 2015. The balance, which represents around 15,000 m², is the subject of advanced negotiations which confirm the goal of full leased occupancy by 30 June 2015. In 2014, Icade also initiated renewals of 73,200 m² securing €14 million in rent over a fixed period of around five years. Furthermore, it has broadly anticipated the primary rental challenges of 2015 and 2016 in securing over half of the expiration of leases. 31/12/2014 31/12/2013 restated Change Group net current cash flow per share (a) €4.31 €4.28 +0.7 % EPRA Earnings from property investment per share €3.66 €3.44 +6.4 % NAV per share €78.4 €78.9 (0.6) % NNNAV per share €75.2 €77.3 (2.7) % Cost of net debt 3.07% 3.83% (76) pb LTV 36.9% 37.5% (60) pb (a) The changes in fair value of derivatives, previously included in the Group net current cash flow, have been excluded since 30 June 2014. PRESS RELEASE Paris, 17 February 2015
Transcript
ICADE – 2014 FULL-YEAR RESULTS A YEAR OF SUCCESS AND A PREPARED FUTURE
A refocused and adapted portfolio Improvement in the average cost of debt (−76bp) and LTV (−60bp) Increase in EPRA Earnings from property investment (+6.4%) and Group net
current cash flow (+0.7%) 2015 leasing renewals anticipated Change in governance
In spite of a lacklustre economic environment, Icade’s first year post-merger with Silic has validated the relevance and potential of its model.
1. Leasing activity sustained
2014 was marked by the near total leasing of EQHO space. In fact, in addition to the leasing in June 2014 of over 40,000 m² with KPMG, in the second half of 2014, Icade announced the signing of two leases covering over 16,000 m² with exclusive tenants. Today the rental dynamic is maintained since 3,724 m² of additional space, i.e. two floors, were signed on 13 February with UBAF, a French bank financing trade between Asia, Europe and the Middle East, for a fixed term of six years starting on 1 September 2015. The balance, which represents around 15,000 m², is the subject of advanced negotiations which confirm the goal of full leased occupancy by 30 June 2015.
In 2014, Icade also initiated renewals of 73,200 m² securing €14 million in rent over a fixed period of around five years. Furthermore, it has broadly anticipated the primary rental challenges of 2015 and 2016 in securing over half of the expiration of leases.
31/12/2014 31/12/2013 restated
Change
Group net current cash flow per share(a) €4.31 €4.28 +0.7 % EPRA Earnings from property investment per share €3.66 €3.44 +6.4 % NAV per share €78.4 €78.9 (0.6) % NNNAV per share €75.2 €77.3 (2.7) % Cost of net debt 3.07% 3.83% (76) pb LTV 36.9% 37.5% (60) pb
(a) The changes in fair value of derivatives, previously included in the Group net current cash flow, have been excluded since 30 June 2014.
PRESS RELEASE
Paris, 17 February 2015
2. Rationalisation and opportunism in portfolio management
2014 has been marked by the following major sales motivated both by the continuation of the disposal policy of non-strategic assets and the will to seize market opportunities:
- the total withdrawal from Germany; - the exit of the retail segment through the sale of the Mr Bricolage portfolio; - the crystallisation of significant value with the disposal of the Link building (15th
district of Paris).
These disposals were carried out under very satisfactory financial conditions; for the sole commercial property portfolio, they totalled over the year €464.3 million which represents an overall premium of 5.01% on the latest fair values. Strategic assets now account for 98% of the total portfolio.
Investments over the period were concentrated on assets in development (€205.9 million) and the strengthening of Icade Santé’s leading position through the acquisition of 12 clinics (€390.5 million).
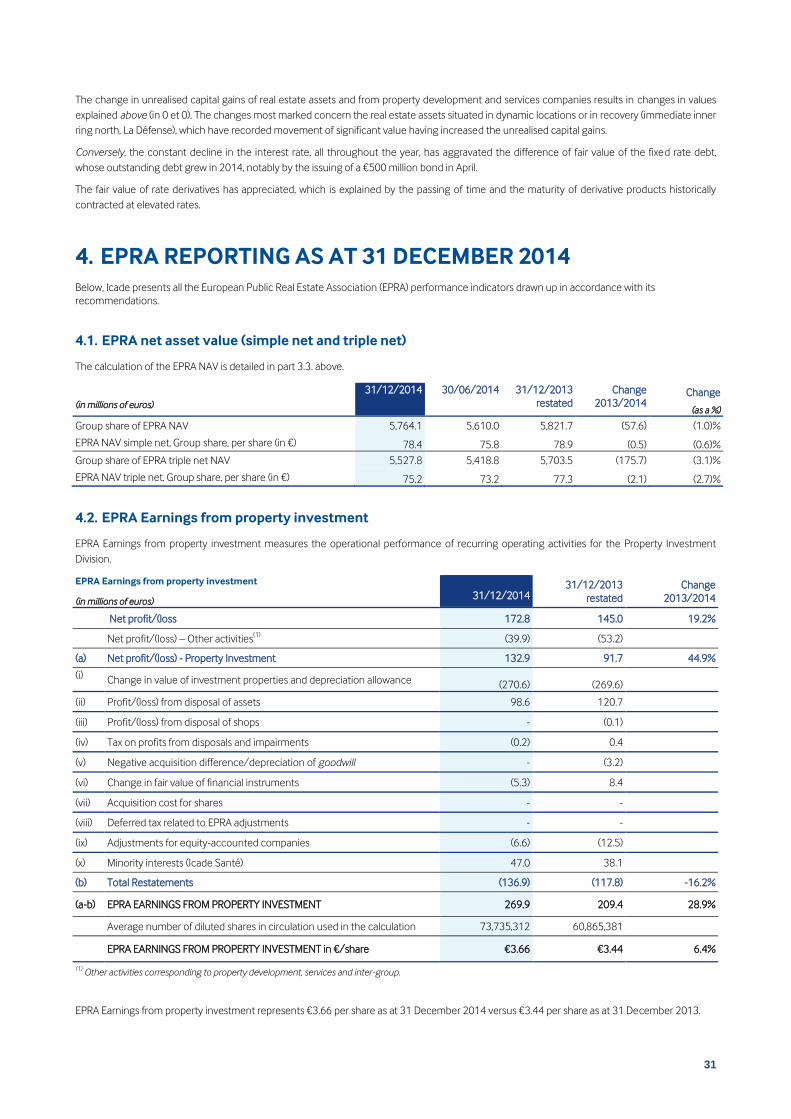
EPRA triple net asset value stood at €75.2 per share on 31 December 2014, down 2.7% compared to 31 December 2013 (€77.3). Several assets, mainly those located in prime or rebounding areas where yields have compressed (Paris and inner northern suburbs) have seen their value rise sharply; other assets, particularly those located in the outer Paris suburbs, in contrast, have seen their value decline slightly. However, it is mainly the very steep contraction of interest rates increasing the fair value of Icade’s fixed rate debt which explains the change in triple net asset value. In fact, the simple net asset value marks only a slight drop of 0.6% to €78.4.
3. Proactive debt management
Icade has been able to take advantage of attractive financing conditions to lower its average cost of debt to 3.07% (down 76bp compared to 2013) and to diversify through the launching of a treasury bill program and a new, widely subscribed seven-year bond issue of €500 million with a 2.25% coupon.
The volatility of the group’s liabilities has also been decreased thanks to the repurchase of a large share of its “ORNANEs” convertible bonds maturing in 2017. The outstanding bonds after this transaction represent only 25.7% of the initial series issued by Silic.
4. Solidity of the income statement of property investment
Rental income produced by the property investment division during 2014 totalled €556.0 million, i.e. an increase of €105 million compared to 2013 (+23.3%) due mainly to the acquisition of Silic (+€96.8 million). On a like-for-like basis, rental income has remained stable in an unfavourable environment for the office and business park sector.
EPRA Earnings from property investment are up 28.9% at €269.9 million, demonstrating the ability of the group to adapt to this environment. Per share, these earnings posted a growth of 6.4% to €3.66 compared to €3.44 in 2013.
2
As far as property development is concerned, Icade has maintained the level of its reservations of housing units and signed several major commercial operations (Le Garance and Panorama T6 in Paris, Îlot A3 in Lyons).
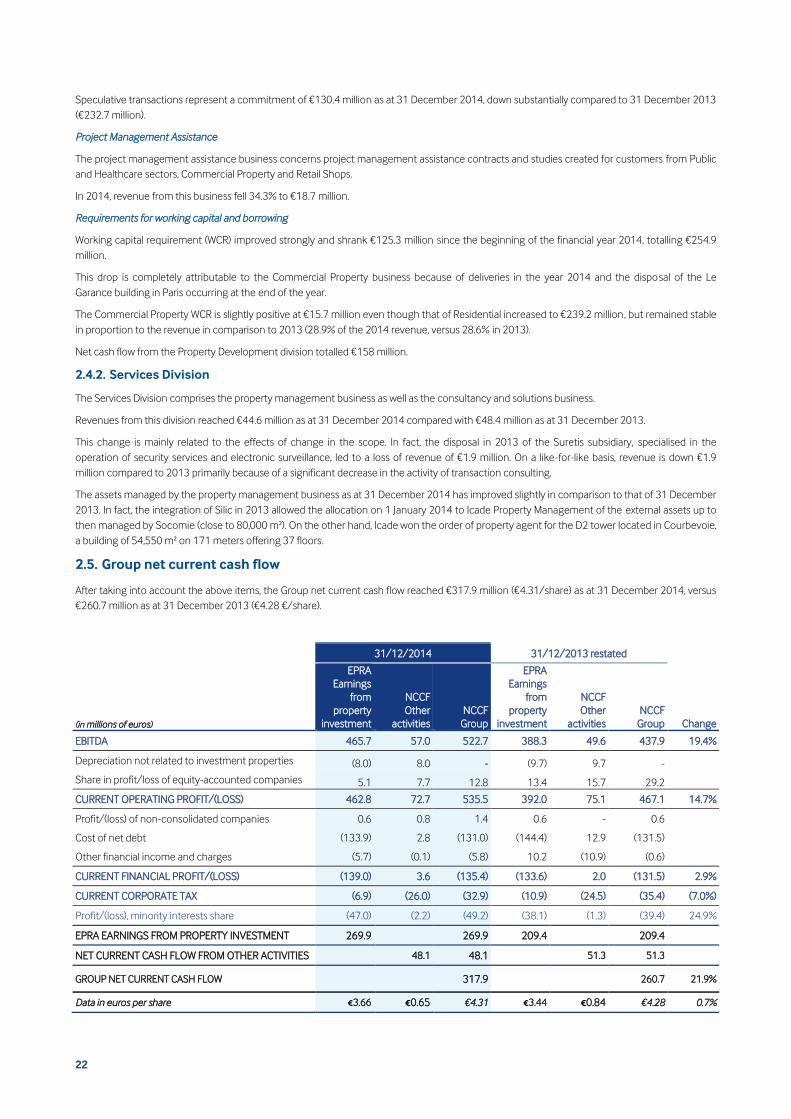
Group net current cash flow, which includes ERPA Earnings from property investment and cash flow from other activities, totalled €317.9 million as at 31 December 2014 versus €260.7 million as at 31 December 2013, a 21.9% increase. Per share, it totalled €4.31, up 0.7% (€4.28 in 2013).
5. Dividend up
Considering these sound results, Icade will propose to the shareholders a dividend up 1.6% at €3.73 per share at the shareholders’ meeting which will be held on 29 April 2015. The dividend payment will take place on 7 May 2015.
6. Outlook
In 2015 and 2016, Icade should see an increase in its EPRA Earnings from property investment, through the marketing of EQHO and the delivery of secured projects (le Monet in Saint-Denis in 2015 and the head office of Veolia in Aubervilliers in 2016).
2015 EPRA Earnings from property investment, and therefore the 2015 dividend, should be up slightly compared to 2014 :
- thanks to increased marketing efforts across the whole portfolio in order to raise the financial occupancy rate to above 90%;
- thanks to control over operational costs, particularly under the effect of cost synergies as a result of the merger with Silic;
- in spite of the likely acquisition of “Millénaire 3” by the French Government; - maintenance of LTV at around 40% and the continued reduction of the average
cost of debt through greater financial disintermediation.
2015 Group net current cash flow will change related to the performance of the property development activity.
7. Governance
Following Serge Grzybowski’s resignation announced today, the Board of directors of Icade has put in place, on a temporary basis, a new governance scheme entering into force as of today:
- the functions of Chairman and Chief Executive Officer are dissociated; - Jean-Paul Faugère, Chairman of the Board of CNP Assurances and Director of
Icade representing Caisse des Dépôts, is appointed acting Chairman of the Board of Icade;
- Nathalie Palladitcheff, until now member of Icade’s executive committee in charge of finance, legal and IT, is appointed acting CEO of Icade.
3
The Board of Icade has set itself the goal to approve a definitive governance scheme before the next shareholders’ meeting which is to vote on the 2014 financial statements on 29 April 2015.
The consolidated statements have been audited by the statutory auditors.
This communication does not constitute an offer or a solicitation of offer of sale or exchange of shares, nor a recommendation subscription, purchase or sale of Icade shares. The distribution of this communication may be limited in certain countries by legislation or regulations. The persons entering by consequence in position of this communication must be informed and observe these restrictions. Within the limits authorized by applicable law, Icade declines any responsibility or any commitment in the violation of these restrictions by any person whatsoever.
Nathalie Palladitcheff and Julien Goubault will present the 2014 annual results to the analysts on 18 February 2015 at 8:30 a.m. The presentation will be available on the internet site: In French: http://www.icade.fr/finance/resultats-publications/presentations-financieres In English: http://www.icade.fr/en/finance/results-and-publications/financial-presentations Live broadcasting with synchronised slides will be accessible beginning at 8:00 a.m. (Paris time), on the internet site via the following link: In French: https://engage.vevent.com/rt/icade/index.jsp?seid=83 Conference ID: SFAF Icade French: 950699 In English: https://engage.vevent.com/rt/icade/index.jsp?seid=79 Conference ID: SFAF Icade English: 950700
ABOUT ICADE Listed real-estate investment company and subsidiary of the Caisse des Dépôts, Icade is a major player of Grand Paris and of the territorial development able to bring global, sustainable and innovative solutions adapted to the needs of its customers and issues of the city of tomorrow. Premiere property investment company of Europe offices, in 2014 Icade recorded a EPRA earnings of €270 million euros As at 31 December 2014, EPRA adjusted net asset value (triple net) reached €5,528 million, or €75.2 per share.
The text of this communication is available on Icade's internet site: www.icade.fr.
1. Profit/(loss) and cash flows ............................................................................................................................ 7
1.1. Property Investment Income statement as at 31 December 2014 ...................................................................................................................................................................... 7 1.2. Cash flows ................................................................................................................................................................................................................................................................................................... 7
2. Activity and profit/(loss).................................................................................................................................. 8
2.1. Highlights .................................................................................................................................................................................................................................................................................................... 8 2.2. Outlook ........................................................................................................................................................................................................................................................................................................ 8 2.3. Property Investment Division ......................................................................................................................................................................................................................................................... 9 2.4. Other activities ...................................................................................................................................................................................................................................................................................... 17 2.5. Group net current cash flow ........................................................................................................................................................................................................................................................ 22 2.6. Obligation of the SIIC regime and distribution ................................................................................................................................................................................................................. 23 2.7. Non tax deductible charges ......................................................................................................................................................................................................................................................... 24 2.8. Contracts .................................................................................................................................................................................................................................................................................................. 24
3. Net asset value as at 31 December 2014 ................................................................................................... 25
3.1. Valuation of property assets ........................................................................................................................................................................................................................................................ 25 3.2. Valuation of property development and services businesses ................................................................................................................................................................................ 29 3.3. Calculating EPRA net asset value.............................................................................................................................................................................................................................................. 30
4. EPRA reporting as at 31 December 2014 ................................................................................................... 31
4.1. EPRA net asset value (simple net and triple net)............................................................................................................................................................................................................. 31 4.2. EPRA Earnings from property investment .......................................................................................................................................................................................................................... 31 4.3. EPRA rate of return ............................................................................................................................................................................................................................................................................ 32 4.4. EPRA vacancy rate ............................................................................................................................................................................................................................................................................. 32 4.5. EPRA cost ratio (Property Investment) .................................................................................................................................................................................................................................. 33
5.1. Liquidity .................................................................................................................................................................................................................................................................................................... 34 5.2. Debt structure as at 31 December 2014 ............................................................................................................................................................................................................................. 34 5.3. Financial rating ..................................................................................................................................................................................................................................................................................... 37 5.4. Financial structure.............................................................................................................................................................................................................................................................................. 37
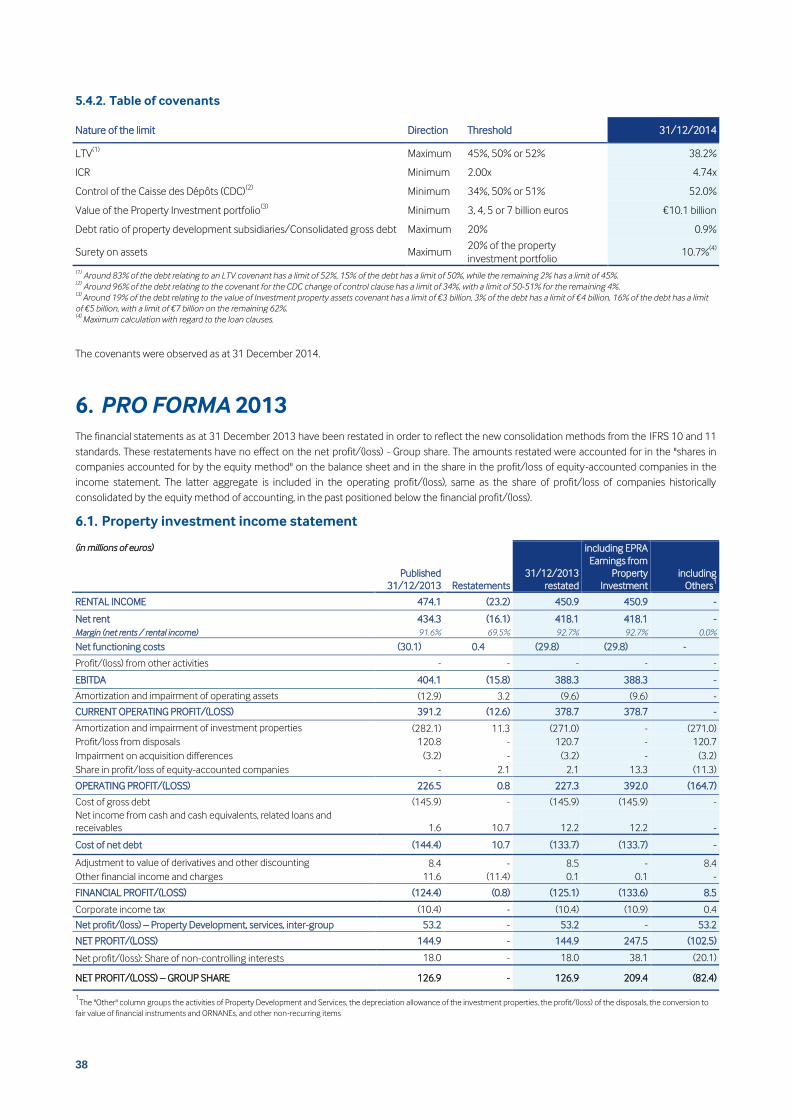
6. Pro forma 2013 ............................................................................................................................................ 38
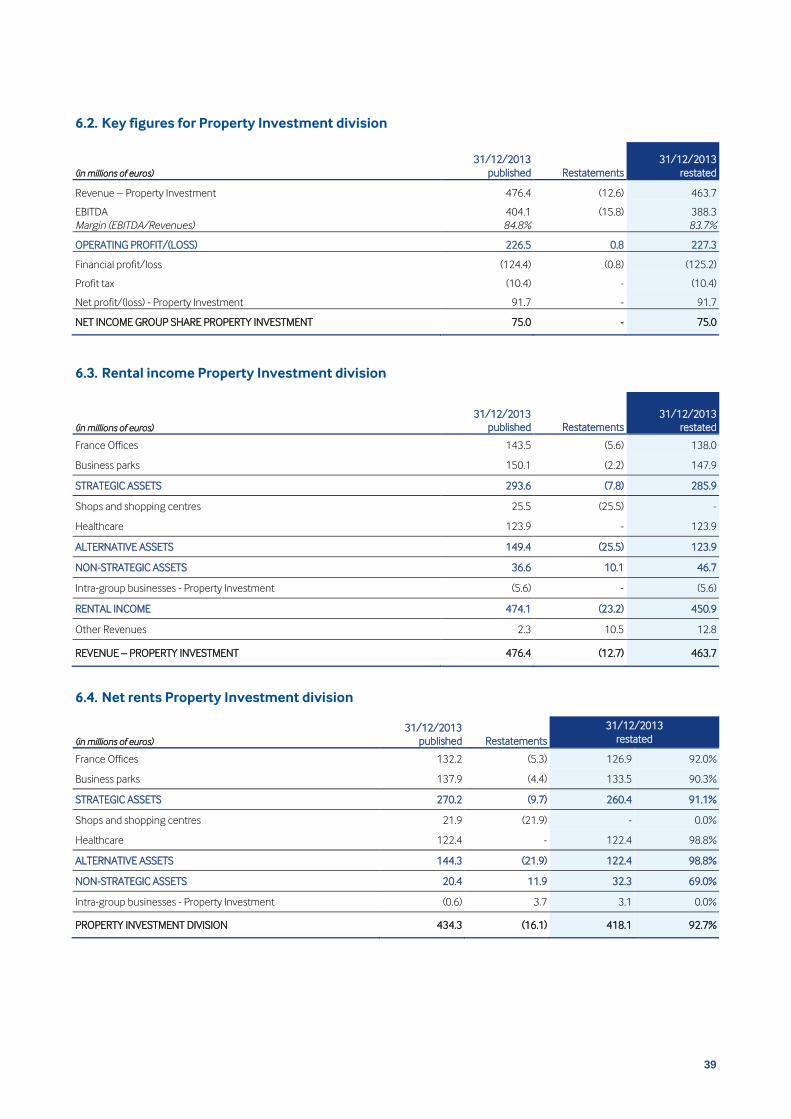
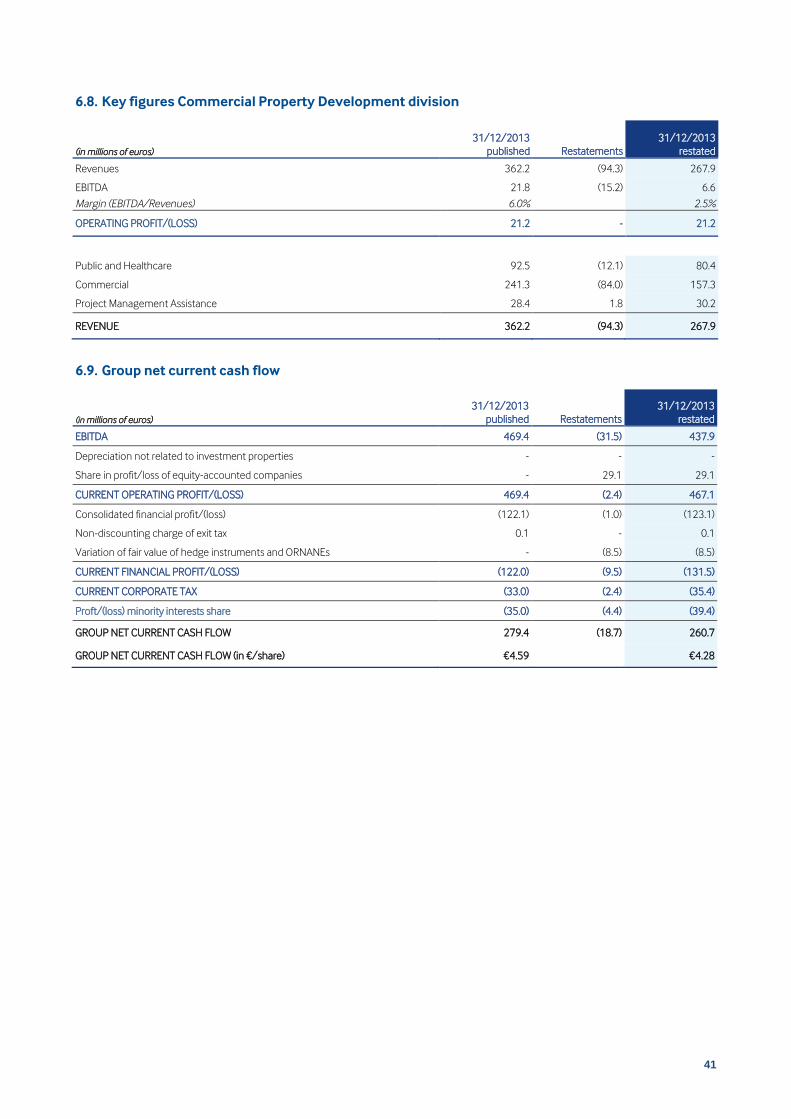
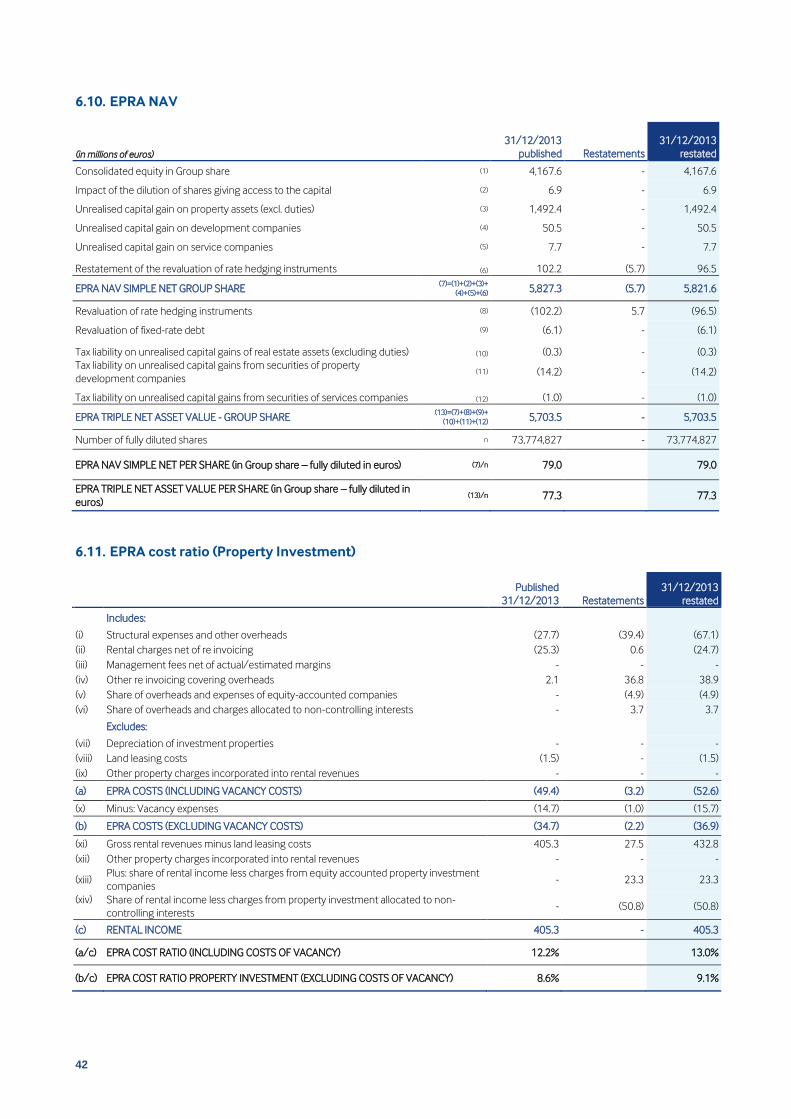
6.1. Property investment income statement ............................................................................................................................................................................................................................. 38 6.2. Key figures for Property Investment division .................................................................................................................................................................................................................... 39 6.3. Rental income Property Investment division .................................................................................................................................................................................................................... 39 6.4. Net rents Property Investment division ................................................................................................................................................................................................................................ 39 6.5. EPRA Earnings from property investment .......................................................................................................................................................................................................................... 40 6.6. Key figures other activities ............................................................................................................................................................................................................................................................ 40 6.7. Key figures Housing Property Development division .................................................................................................................................................................................................. 40 6.8. Key figures Commercial Property Development division ......................................................................................................................................................................................... 41 6.9. Group net current cash flow ........................................................................................................................................................................................................................................................ 41 6.10. EPRA NAV ............................................................................................................................................................................................................................................................................................. 42 6.11. EPRA cost ratio (Property Investment) ............................................................................................................................................................................................................................... 42
7
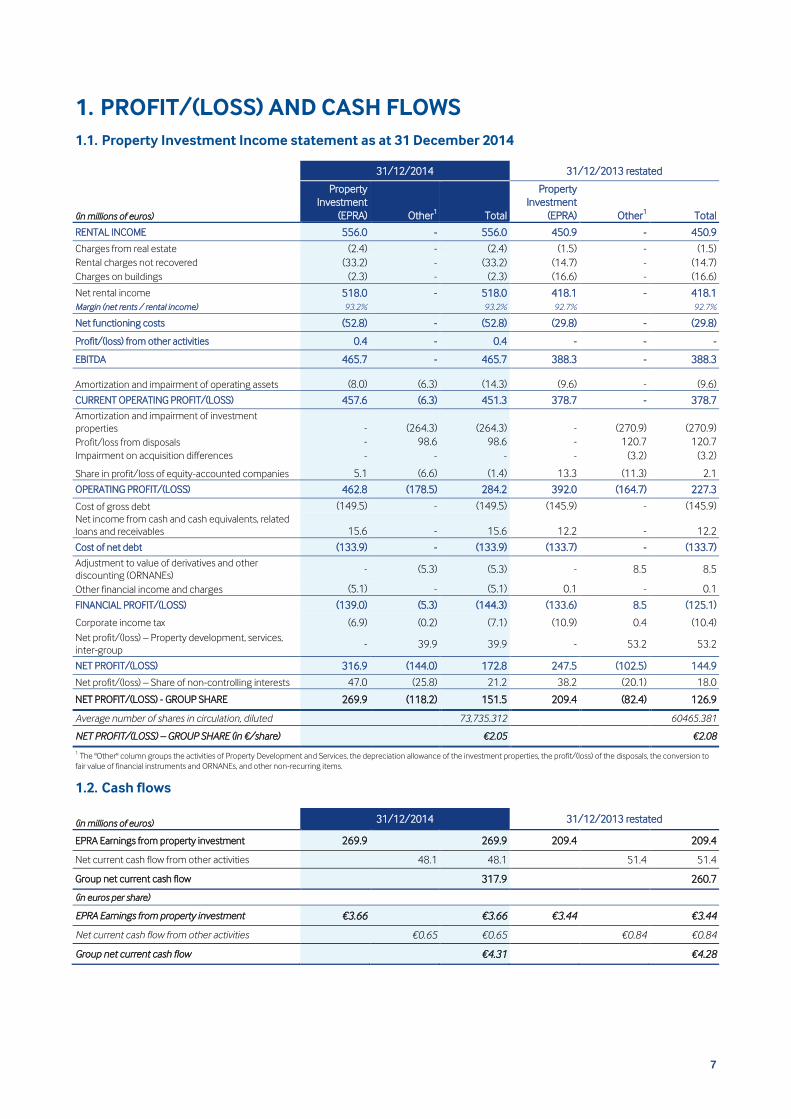
1. PROFIT/(LOSS) AND CASH FLOWS
1.1. Property Investment Income statement as at 31 December 2014
31/12/2014 31/12/2013 restated
(in millions of euros)
Property
Investment
(EPRA) Other1 Total
Property
Investment
(EPRA) Other1 Total
RENTAL INCOME 556.0 - 556.0 450.9 - 450.9
Charges from real estate (2.4) - (2.4) (1.5) - (1.5)
Rental charges not recovered (33.2) - (33.2) (14.7) - (14.7)
Charges on buildings (2.3) - (2.3) (16.6) - (16.6)
Corporate income tax (6.9) (0.2) (7.1) (10.9) 0.4 (10.4)
Net profit/(loss) – Property development, services,
inter-group - 39.9 39.9 - 53.2 53.2
NET PROFIT/(LOSS) 316.9 (144.0) 172.8 247.5 (102.5) 144.9
Net profit/(loss) – Share of non-controlling interests 47.0 (25.8) 21.2 38.2 (20.1) 18.0
NET PROFIT/(LOSS) - GROUP SHARE 269.9 (118.2) 151.5 209.4 (82.4) 126.9
Average number of shares in circulation, diluted 73,735.312 60465.381
NET PROFIT/(LOSS) – GROUP SHARE (in €/share) €2.05 €2.08
1 The "Other" column groups the activities of Property Development and Services, the depreciation allowance of the investment properties, the profit/(loss) of the disposals, the conversion to
fair value of financial instruments and ORNANEs, and other non-recurring items.
1.2. Cash flows
(in millions of euros) 31/12/2014 31/12/2013 restated
EPRA Earnings from property investment 269.9 269.9 209.4 209.4
Net current cash flow from other activities 48.1 48.1 51.4 51.4
Group net current cash flow 317.9 260.7
(in euros per share)
EPRA Earnings from property investment €3.66 €3.66 €3.44 €3.44
Net current cash flow from other activities €0.65 €0.65 €0.84 €0.84
Group net current cash flow €4.31 €4.28
8
2. ACTIVITY AND PROFIT/(LOSS)
2.1. Highlights
Rental business
The financial year 2014 was marked by the near total leasing of EQHO tower space. In fact, in addition to the leasing in June 2014 of over 40,000
m² with the KPMG company, in the second half of 2014, Icade announced the signing of two leases covering over 16,000 m² with exclusive
tenants. The balance, which represents less than 19,000 m², is the subject of advanced negotiations.
In 2014, Icade also initiated renewals of 73,200 m², securing €14 million in rent over a fixed period of around five years.
Asset rotation
Investments made in 2014 amounted to €720 million, broken down as €250 million in development, €429 million in acquisitions (mainly in the
healthcare portfolio) and the balance of €42 million on maintenance work on the portfolio.
The financial year 2014 was marked by the delivery of office buildings of close to 28,000 m². This was the case with the "Sisley" building in Saint-
Denis (19,500 m², leased to the Siemens company) and the "Brahms" building on the parc de Colombes (8,600 m², leased to Alcatel). The
"Millénaire 3" building located in Paris 19 and pre-rented to the Ministry of Justice will be delivered in the first half of 2015.
In extending the disposals occurring during the year 2013, the year 2014 was characterised by the continued active optimisation of the portfolio
of activities of Icade and the increased focusing of its assets on commercial property.
The total sales conducted over the year represent €481 million with an emphasis on:
♦ the total withdrawal from the German portfolio which represents €159 million over the year;
♦ completed sales of nearly €154 million for the non-strategic assets portfolio (block sales of residential units, the "Mr Bricolage"
portfiolio, jointly-owned office space);
♦ disposals of mature assets for €117 million.
Concerning the commercial property development business, on behalf of the Ministry of the Interior, the agency France Domaine exercised the
purchase option that it held at the end of the lease in the planned project signed in the first half-year with Icade for the "Le Garance" building in
Paris 20 on 31 December 2014.
Financing strategy
Accelerated asset optimization has been continued in 2014, through the renegotiation of a significant share of bank debt (€875 million), the
issuing of a new bond in particularly favourable conditions (€500 million for 7 years), the strengthening of unused lines of credit, for a higher
amount (€1,260 million) and accompanied by improved financial conditions, and lastly by the 3rd quarter launch of a commercial paper program
(graded A2 by Standard & Poor's).
The goal of lowering the cost of debt by 40 to 60 basis points in 2014 was surpassed with an average rate of establishment at 3.07% versus 3.83%
as at 31 December 2013.
Portfolio
On a like-for-like basis, the value of all the entire portfolio is slightly down (-0.3%) with respect to 2013. Compared with 30 June 2014, this change
is, in contrast, positive by 0.6%, particularly considering a compression of rates noted in Paris and in the first rim suburbs.
Continuing the trend observed in the first half-year, the value of Parcs des Portes Nord de Paris improved by 7.8% over the past year, which
validates the development strategy of this area.
The value of EQHO has again appreciated in the second half-year with a positive change of 4.2%, i.e., annual growth of +5.5% compared with 31
December 2013, because of signings occurring during the year.
Post-closing events
None.
2.2. Outlook
In 2015 and 2016, Icade should see an increase in its EPRA Earnings from property investment, through the marketing of EQHO and the delivery
of secured projects (le Monet in Saint-Denis in 2015 and the head office of Veolia in Aubervilliers in 2016).
2015 EPRA Earnings from property investment, and therefore the 2015 dividend, should be up slightly compared to 2014:
♦ thanks to increased marketing efforts across the whole portfolio in order to raise the financial occupancy rate above 90%;
♦ thanks to control over operational costs, particularly under the effect of cost synergies as a result of the merger with Silic;
♦ in spite of the likely acquisition of “Millénaire 3” by the French Government;
♦ maintenance of LTV at around 40% and the continued reduction of the average cost of debt through greater financial disintermediation.
2015 Group net current cash flow will change related to the performance of the property development activity.
9
2.3. Property Investment Division
2.3.1. Portfolio presentation
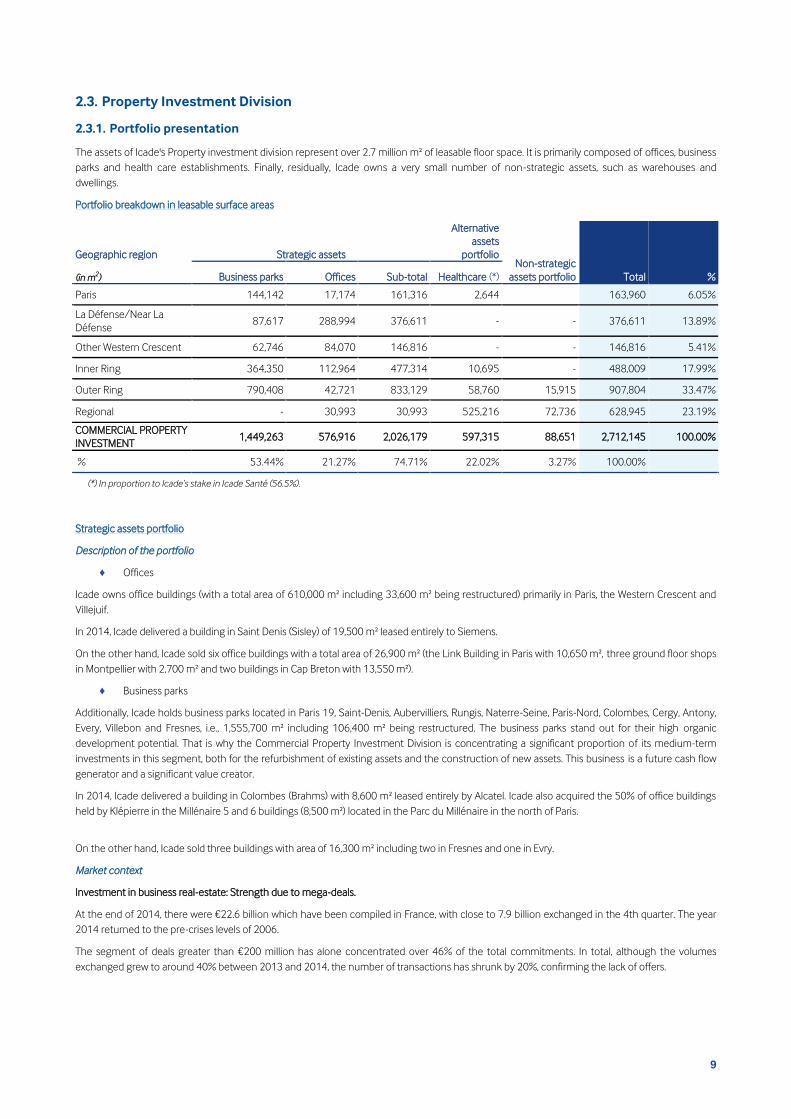
The assets of Icade's Property investment division represent over 2.7 million m² of leasable floor space. It is primarily composed of offices, business
parks and health care establishments. Finally, residually, Icade owns a very small number of non-strategic assets, such as warehouses and
dwellings.
Portfolio breakdown in leasable surface areas
Geographic region Strategic assets
Alternative
assets
portfolio Non-strategic
assets portfolio Total % (in m2) Business parks Offices Sub-total Healthcare (*)
Paris 144,142 17,174 161,316 2,644 163,960 6.05%
La Défense/Near La
Défense 87,617 288,994 376,611 - - 376,611 13.89%
Other Western Crescent 62,746 84,070 146,816 - - 146,816 5.41%
Inner Ring 364,350 112,964 477,314 10,695 - 488,009 17.99%
Outer Ring 790,408 42,721 833,129 58,760 15,915 907,804 33.47%
(*) In proportion to Icade’s stake in Icade Santé (56.5%).
Strategic assets portfolio
Description of the portfolio
♦ Offices
Icade owns office buildings (with a total area of 610,000 m² including 33,600 m² being restructured) primarily in Paris, the Western Crescent and
Villejuif.
In 2014, Icade delivered a building in Saint Denis (Sisley) of 19,500 m² leased entirely to Siemens.
On the other hand, Icade sold six office buildings with a total area of 26,900 m² (the Link Building in Paris with 10,650 m², three ground floor shops
in Montpellier with 2,700 m² and two buildings in Cap Breton with 13,550 m²).
♦ Business parks
Additionally, Icade holds business parks located in Paris 19, Saint-Denis, Aubervilliers, Rungis, Naterre-Seine, Paris-Nord, Colombes, Cergy, Antony,
Every, Villebon and Fresnes, i.e., 1,555,700 m² including 106,400 m² being restructured. The business parks stand out for their high organic
development potential. That is why the Commercial Property Investment Division is concentrating a significant proportion of its medium-term
investments in this segment, both for the refurbishment of existing assets and the construction of new assets. This business is a future cash flow
generator and a significant value creator.
In 2014, Icade delivered a building in Colombes (Brahms) with 8,600 m² leased entirely by Alcatel. Icade also acquired the 50% of office buildings
held by Klépierre in the Millénaire 5 and 6 buildings (8,500 m²) located in the Parc du Millénaire in the north of Paris.
On the other hand, Icade sold three buildings with area of 16,300 m² including two in Fresnes and one in Evry.
Market context
Investment in business real-estate: Strength due to mega-deals.
At the end of 2014, there were €22.6 billion which have been compiled in France, with close to 7.9 billion exchanged in the 4th quarter. The year
2014 returned to the pre-crises levels of 2006.
The segment of deals greater than €200 million has alone concentrated over 46% of the total commitments. In total, although the volumes
exchanged grew to around 40% between 2013 and 2014, the number of transactions has shrunk by 20%, confirming the lack of offers.
10
In 2014, France had the best performance among the large mature European markets. Paris inner city remains a strong place for secured real-
estate investment with €6.5 billion commitments in offices (44% of the total). The focus on secured buildings remains tight. In fact, the "core"
assets attracted 65% of the office commitments in 2014, versus 58% in 2013.
On the other hand, the off-plan sales market, after a subdued new-year start, has picked up over the last months in very targeted locations in the
Paris market. (Source: CB Richard Ellis).
Like the offices which concentrated 65% of the volumes exchanged with €14.6 billion, the retail property segment has done very well with
performance surpassing 27% of the total, representing €6.1 billion in commitments. Finally, the investment in industrial and logistics with €1.8
billion, is slightly down over one year (8%). (Source: CB Richard Ellis).
The offices: A market in full recovery over the entire year
The year 2014 was characterised by the compression of "prime" returns, a result of the traditional weakness of the cost of money. The Parisian
"prime" rate of return now totals 3.75% for the offices. This rate crash spread to the best locations of the Western Crescent, to the North and South
rings and the outer ring, but a hierarchical organization remains.
The "prime" rental rate of return henceforth ranges from 3.75% to 5.00%. The offices of the Parisian CBD are now positioned on the same level as
London. The appeal of real-estate is much stronger than the OAT returns which passed under the 1% bar at the start of December 2014,
The rates for La Défense are between 5.25% and 6.50%, for the Western Crescent between 4.65% and 8.75%, for the inner ring, between 5.25%
and 8.75% and elsewhere in France between 5.40% and 8.00%.
Demand placed above 13% compared to 2013
The volume of demand placed on offices in IDF (Ile de France) totalled 2.1 million m² over the entire year 2014 ; the office market in this area
posted an increase of 13% compared to 2013 but volumes remain 8% below their 10-year average.
The niche for hypermarkets greater than 5,000 m² jumped 26% in 2014 with 62 transactions for 826,800 m² (versus 53 transactions in 2013
totalling 655,500 m²). The small and medium segment (less than 1,000 m²) also performed well (+8%), while the intermediate market between
1,000 m² and 5,000 m² posted a limited annual increase of +1%.
Across the market as a whole, 40% of surface areas leased in 2014 were new or restructured offices (stable compared to 2013: 41%). Among all of
the geographic sectors of Ile-de-France, La Défense showed the strongest dynamism in 2014 with 234,800 m² placed, the highest since 2008.
(Source: CB Richard Ellis).
Immediate supply increased by 2.5% over one year, to 4 million m² as at 1 January 2015. The vacancy rate in the Greater Paris area remained
stable, on average at 7.2% for Ile-de-France (5.1% in Paris, around 12% in La Défense and in the Western Crescent). The share of new or
restructured area in immediate inventory represents 20%, a relative stable proportion for several years.
The geographic and structural disparities remain significant. Out of all the sectors, it is the peripheral locations and especially those in the West (La
Défense and the Western Crescent) which concentrate 54% of the new and restructured supply in the region and 48% of the inventory > 5,000
m².
The face values for leases in Ile-de-France have stabilised but vary from one sector to another.
In Paris, the stable level of available inventory keeps rental values stable even though the peripheral markets push the face values and especially
economics lower. The average weighted face rent in Ile-de-France for new, restructured or refurbished space totalled €297/m²/year excluding
taxes and charges at year-end, stable compared to 2013 (€294/m²/year before taxes and charges at the end of 2013).
The incentives remain elevated in all sectors, on the order of 20% for transactions > 1,000 m².
The average "prime" rent in Paris Centre West totalled €687/m²/year excluding taxes and charges, versus €707/m²/year excluding taxes and
charges in 2013. In La Défense, progressive leasing of new and restructured assets delivered during the last 18 months has increased the "prime"
rent to €498/m²/year excluding taxes and charges, versus €442/m²/year excluding taxes and charges in 2013. In the Western Crescent,
significant transactions have led to an increase, €459/m²/year excluding taxes and charges, versus €438/m²/year excluding taxes and charges in
2013. (Source: CB Richard Ellis).
Alternative assets portfolio (Icade Santé)
Description of the portfolio
The leader in its market, Icade has become a major player in healthcare since 2007 by building up a property portfolio of 71 establishments,
featuring:
♦ assets that are instant cash flow generators;
♦ initial fixed lease terms of 12 years and a residual term of 8.8 years as at 31 December 2014;
♦ high rental margin rates (net/gross rent).
For the development and management of Icade Santé, Icade benefits from a team and expertise recognised on the market.
In 2014, Icade acquired 12 healthcare establishments for a total of €390.5 million.
11
In order to support its growth and maintain the Group’s key balance sheet ratios, Icade Santé successfully opened €250 million of its capital,
during the 1st half of 2012 to three institutional investors (Crédit Agricole Assurance, BNP Paribas Cardif and CNP Assurances). At end-2012, a
second capital increase of €155 million was carried out, to support investments in the 2nd half of the year (including €45 million provided by
Icade). In July 2014, a new capital increase was carried out for a total of €190 million with OPCI Messidor, C-Santé, Holdipierre, MF Santé and
SOGECAPIMMO and Icade (€107 million).
As at 31 December 2014, Icade’s stake in Icade Santé stood at 56.5%.
Market context
A market of monovalent assets with a long term investment horizon.
Two types of assets are usually distinguished on the healthcare real estate market:
♦ the health establishments that are short-stay in medical, surgery and obstetrics (MCO) or medium-stay which are for psychiatric or after
care and re-habilitation (SSR);
♦ the medical-social establishments, namely elderly care homes (Housing Establishments of Dependent Elderly Persons or EHPAD),
retirement homes (Housing Establishments for Elderly Persons or EHPA) and residence services.
These monovalent assets are of various property natures, sometimes with large areas of medical and technical capacities and sometimes mainly
housing structures.
The leases signed on these assets are predominantly for a duration of 12 years fixed and all the charges are recoverable by the tenants (including
major works falling under Art. 606 of the French Civil Code). However, since the publication of the French Law 2014-626 dated 18 June 2014 on
commercial leases (the Pinel law) and the entry into force of the decree specifying the law in matters of division of the charges, major works falling
under Article 606 of the French Civil Code are now the responsibility of the lessor in new leases signed on or after 5 November 2014, In the scope
of externalisations, undertaking of works and guarantees are then taken or contributed by the sellers
A class of assets created the growing interest of numerous investors
Healthcare property has long been a niche gathering few investors or narrowly tied to the operators of establishments. Yet, with the research of
diversification towards property assets procuring stable long-term rents, attractive returns and low risk of vacancy, the interest and the number of
players has greatly increased in healthcare property.
Icade Santé, the market leader specialising in healthcare assets (MCO, SSR and psychiatric facilities), Gecimed (a subsidiary of Gecina), Foncière des
Murs and Cofinimmo (a Belgian REIT) are the primary investors in France.
In the last few years, several asset managers have also greatly contributed to the increased market activity in 2014: BNP PARIBAS (Health Property
Fund 1), PRIMONIAL (Primovie), Swiss Life REIM and also La Française.
Last, international property investment companies - notably North American - specialised in the healthcare sector have also made investments in
Europe and are interested in France.
Rare products that lead to rate compression
The healthcare real-estate market is now characterised by increased demand on the part of investors. The supply of quality assets is limited and
even primarily related to the externalisations of the operators who participate in the concentration of the sector or through sales of premises and
business assets carried out by the doctors (primary market).
After a year 2013 in retreat in terms of investment volume (around €450 million compared to €650 million in 2011 and 2012), the year 2014
posted an investment volume of over €620 million,
This rise is not only the reflection of large operator externalisation transactions (Capio, Médipôle Partenaires) which have continued, but also of a
record number of transactions on the secondary market which represent close to 40% of total volume. This increase in transactions between
investors is the reflection of a growing maturity of the market.
The current "prime" rate of return (new or excellent condition for establishments nicely positioned in dynamic pools, excluding Paris) is about
6.40% to 6.60% for medical, surgery, obstetrician clinics and 5.50% for Housing Establishments of Dependent Elderly Persons (EHPAD). (Source:
JLL).
Non-strategic assets portfolio
In 2014, Icade continued its policy of refocusing its activities around strategic assets proceeding with the sale of all of its assets located in Germany
and its "Mr Bricolage" retail business. It also sold a warehouse in Besançon (73,660 m²) and 122 dwellings.
Thus, Icade still residually holds warehouses and dwellings.
12
2.3.2. Key figures as at 31 December 2014
Key figures for Property Investment
31/12/2014
31/12/2013
restated Change (in millions of euros)
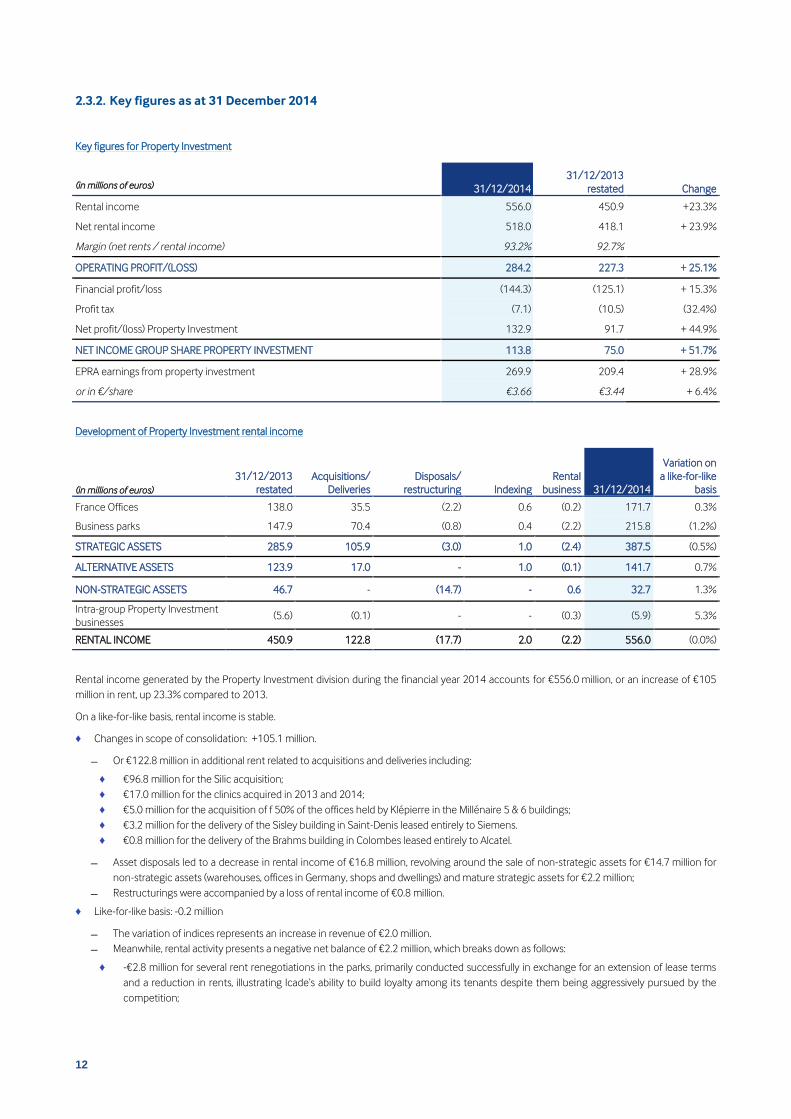
Rental income 556.0 450.9 +23.3%
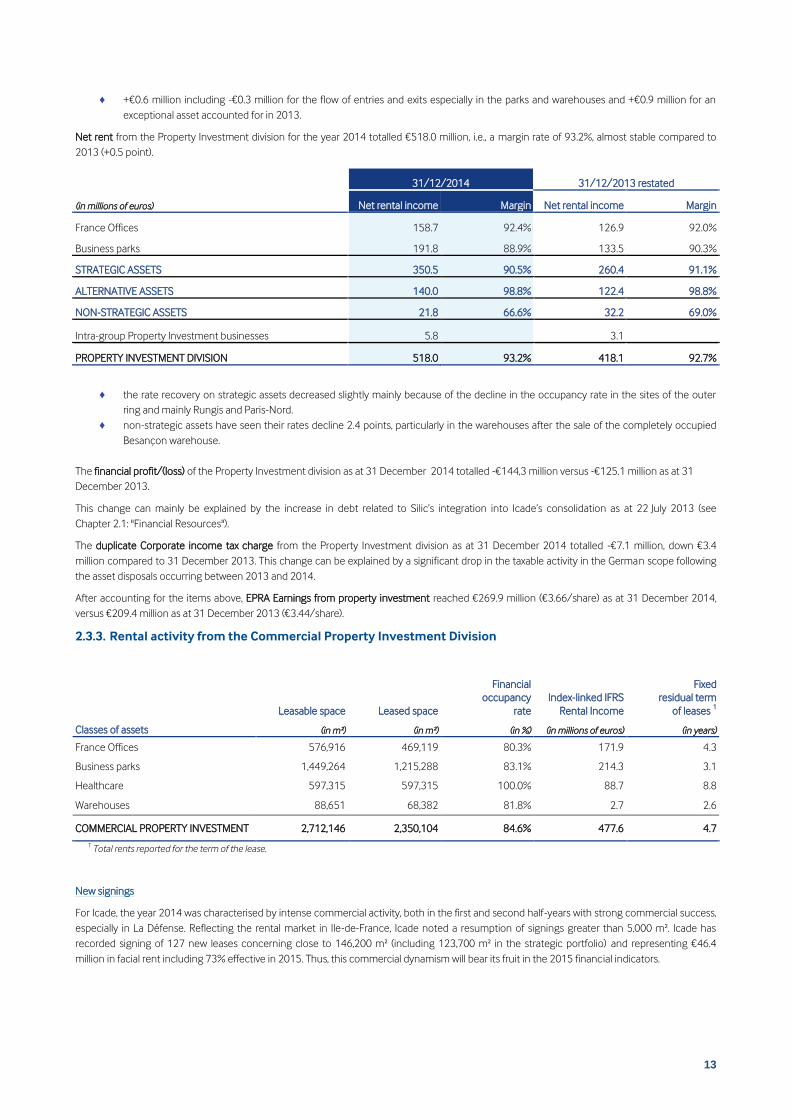
Net rental income 518.0 418.1 + 23.9%
Margin (net rents / rental income) 93.2% 92.7%
OPERATING PROFIT/(LOSS) 284.2 227.3 + 25.1%
Financial profit/loss (144.3) (125.1) + 15.3%
Profit tax (7.1) (10.5) (32.4%)
Net profit/(loss) Property Investment 132.9 91.7 + 44.9%
NET INCOME GROUP SHARE PROPERTY INVESTMENT 113.8 75.0 + 51.7%
EPRA earnings from property investment 269.9 209.4 + 28.9%
or in €/share €3.66 €3.44 + 6.4%
Development of Property Investment rental income
31/12/2013
restated
Acquisitions/
Deliveries
Disposals/
restructuring Indexing
Rental
business 31/12/2014
Variation on
a like-for-like
basis (in millions of euros)
France Offices 138.0 35.5 (2.2) 0.6 (0.2) 171.7 0.3%
Business parks 147.9 70.4 (0.8) 0.4 (2.2) 215.8 (1.2%)
For Icade, the year 2014 was characterised by intense commercial activity, both in the first and second half-years with strong commercial success,
especially in La Défense. Reflecting the rental market in Ile-de-France, Icade noted a resumption of signings greater than 5,000 m². Icade has
recorded signing of 127 new leases concerning close to 146,200 m² (including 123,700 m² in the strategic portfolio) and representing €46.4
million in facial rent including 73% effective in 2015. Thus, this commercial dynamism will bear its fruit in the 2015 financial indicators.
14
The main signings revolved on the leasing of:
♦ 76% of the space in the EQHO tower concluded with the signing of three leases: 40,468 m² leased to KPMG in April 2015 for a fixed term of
12.5 years, 9,555 m² leased to Air Liquide in August 2015 for a term of nine years and 5,616 m² leased to La Banque de France in September
2015 for a term of nine years;
♦ 5,616 m² leased to Tarkett including 1,872 m² in Icade's share in Tour Intiale building in La Défense (effective date 1 March 2105);
♦ 5,018 m² leased to QVC in the Gardinoux building in the Portes de Paris (effective date 1 January 2015);
♦ 2,817 m² leased to Xerox in the Exelmans building in the Paris Nord (effective date 1 March 2015);
♦ 2,740 m² leased to the Ministry of Justice in the Millénaire 2 building (effective date 1 April 2015);
♦ 2,539 m² in the European building in Evry leased to the La Direccte company (effective date 1 September 2014);
♦ 2,524 m² of the Millénaire 2 building leased to the Regional Health Agency ("Agence Régionale de Santé") (effective date 25 March 2014)'
♦ In the non-strategic portfolio, three leases were signed for a total area of 22,500 m².
Tenant departures
Departures corresponded to 152,900 m² and represented €28.4 million in lost rent. 40,100 m² of this space was not re-leased because a
restructuring or construction project is planned.
In the scope of the offices, the tenant departures concerned 18,030 m².
♦ 2,604 m² in the space of the Défense1 building to be restructured in view of housing the Campus La Défense project. Most of these tenants
were transferred in the Axe Seine transaction;
♦ 4,816 m² (in proportion to holding) in the Tour Initiale in La Défense (Nexity tenant);
♦ 3,236 m² in the Défense2 building including 1,980 m² related to the Socomie employees who were transferred to Millénaire 1.
For business parks, the number of tenant departures during the financial year stood at a significant 126,300 m². The Rungis and Paris Nord sites
had a significant but anticipated tenant turnover. The year 2014 was marked by the exit of 16 leases whose areas exceeded 2,000 m², i.e., a total of
69,400 m² including two leases with an area over 12,000 m².
♦ Mondelez in the "Saarinen" building in Rungis for an area of 12,773 m²;
♦ Alcatel in the "Bourgognes" building in Colombes for an area of 17,924 m², Alcatel having leased 8,614 m² in the "Brahms" building in
Colombes delivered in the 3rd
quarter 2014.
Finally, thanks to the efficiency of the asset management teams, numerous surface areas vacated in 2014 have been or are about to be re-leased.
The property investment teams' activity also led to the renewal of 73,200 m² of surface areas, under less favourable rental conditions (-16%),
although securing €14.4 million over a fixed period of approximately five years.
The vacant space as at 31 December 2014 stood at 362,000 m² and €90.1 million in potential rent. 71,600 m² of this space has been pre-leased
effective in 2015.
♦ the EQHO tower alone represents €35.6 million, or close to 40% of the total potential rent and in area of 79,000 m², 56,000 m² of which is pre-
leased;
♦ the business parks represent €45.8 million, including €13.9 million in the area of Rungis (including €3.3 million in the Saarinen building
following the departure of the Mondelez tenant in the 4th quarter 2014) and 7.7 million in Nanterre Seine (including €4.4 million in the Axe
Seine building).
The average fixed term of the leases is 4.7 years and slightly less in the offices because of the maturity in 2015 of four leases of the AXA tenant for
a total area of 75,400 m².
As at 31 December 2014, the 10 largest tenants accounted for total annual rents of €138.6 million (35.6% of annual rents from assets excluding
Healthcare).
The financial occupancy rate at 84.6% as at 31 December 2014 is down 3.2 points in comparison to 31 December 2013 (87.8%).
This change is related to a combination of several factors:
♦ offices: the drop in the occupancy rate of 3.4 points is related to the impact of the restructuring start-up and non-leasing of space in
December 2014 in the PB5 building in La Défense.
♦ business parks: the drop in occupation has penalised the financial occupancy rate by 3.9 points, notably in the Rungis parks (-9.5 points) and
Paris Nord (-8.5 points). The exit of Mondelez in Rungis has negatively impacted the Rungis rate by -5 points.
The leasing of 56,040 m² of the EQHO tower whose effect in 2015 will bring the financial occupancy rate to 88.9%, i.e., a rise of 4.3 points and 11.4
points in the occupancy rate of the offices.
15
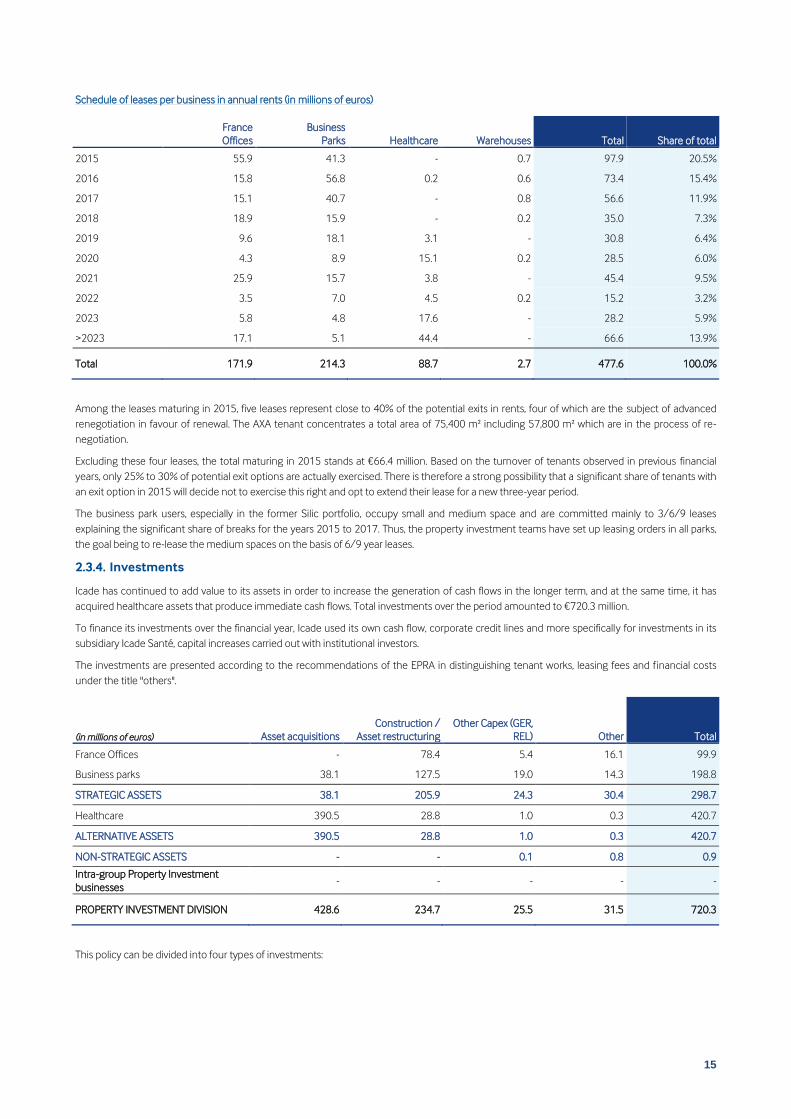
Schedule of leases per business in annual rents (in millions of euros)
France
Offices
Business
Parks Healthcare Warehouses Total Share of total
2015 55.9 41.3 - 0.7 97.9 20.5%
2016 15.8 56.8 0.2 0.6 73.4 15.4%
2017 15.1 40.7 - 0.8 56.6 11.9%
2018 18.9 15.9 - 0.2 35.0 7.3%
2019 9.6 18.1 3.1 - 30.8 6.4%
2020 4.3 8.9 15.1 0.2 28.5 6.0%
2021 25.9 15.7 3.8 - 45.4 9.5%
2022 3.5 7.0 4.5 0.2 15.2 3.2%
2023 5.8 4.8 17.6 - 28.2 5.9%
>2023 17.1 5.1 44.4 - 66.6 13.9%
Total 171.9 214.3 88.7 2.7 477.6 100.0%
Among the leases maturing in 2015, five leases represent close to 40% of the potential exits in rents, four of which are the subject of advanced
renegotiation in favour of renewal. The AXA tenant concentrates a total area of 75,400 m² including 57,800 m² which are in the process of re-
negotiation.
Excluding these four leases, the total maturing in 2015 stands at €66.4 million. Based on the turnover of tenants observed in previous financial
years, only 25% to 30% of potential exit options are actually exercised. There is therefore a strong possibility that a significant share of tenants with
an exit option in 2015 will decide not to exercise this right and opt to extend their lease for a new three-year period.
The business park users, especially in the former Silic portfolio, occupy small and medium space and are committed mainly to 3/6/9 leases
explaining the significant share of breaks for the years 2015 to 2017. Thus, the property investment teams have set up leasing orders in all parks,
the goal being to re-lease the medium spaces on the basis of 6/9 year leases.
2.3.4. Investments
Icade has continued to add value to its assets in order to increase the generation of cash flows in the longer term, and at the same time, it has
acquired healthcare assets that produce immediate cash flows. Total investments over the period amounted to €720.3 million.
To finance its investments over the financial year, Icade used its own cash flow, corporate credit lines and more specifically for investments in its
subsidiary Icade Santé, capital increases carried out with institutional investors.
The investments are presented according to the recommendations of the EPRA in distinguishing tenant works, leasing fees and financial costs
Campus La Défense (Nanterre) 0% 79,200 29.1 454.0 346.3
Vauban (Rungis) 0% 20,400 5.8 89.6 71.3
Vancouver (Rungis) 0% 13 600 3.9 51.5 45.6
PROJECTS CONTROLLED 0% 155,100 51.6 753.1 608.2
TOTAL 287,400 98.1 1,373.7 875.0 161.1 97.0 8.7
1 Cost of the project as approved by the authority of Icade's governance. This price includes the book value of the property investment, works budget, the cost of
financial porterage and the possible support measures.
17
2.3.5. Arbitration
Icade is carrying out an active trade-off policy on its assets, based on three main principles:
♦ optimisation, rotation :sale of mature assets, for which most of the asset management work has been done and where there is a probability of
significant capital gain on the sales;
♦ portfolio streamlining: sale of assets of modest size or held under joint ownership;
♦ commercial property focus, disposal of non-strategic assets: sale of assets not belonging to the core business of the Commercial Property
Investment division.
The value of sales made during 2014 was €480.0 million.
EPRA EARNINGS FROM PROPERTY INVESTMENT 269.9 269.9 209.4 209.4
NET CURRENT CASH FLOW FROM OTHER ACTIVITIES 48.1 48.1 51.3 51.3
GROUP NET CURRENT CASH FLOW 317.9 260.7 21.9%
Data in euros per share €3.66 €0.65 €4.31 €3.44 €0.84 €4.28 0.7%
23
The Group net current cash-flow is comprised of the following two items:
♦ EPRA Earnings from property investment. Introduced in the 2013 accounts, it measures the cash flow from the property investment
business pursuant to the EPRA recommendations; and
♦ the "Net current cash flow from other activities" which measures the cash flow from property development activities and services.
As a reminder, since 30 June 2014, Group net current cash flow excludes the change in fair value of derivatives and ORNANEs.
2.6. Obligation of the SIIC regime and distribution
The ratio of activities not eligible for the SIIC regime in the parent company’s balance sheet totalled 8.81% as at 31 December 2014.
Icade’s 2014 net book profit was €95.1 million, corresponding to a fiscal profit of €170.2 million.
This tax base breaks down over the various sectors as follows:
♦ €92.4 million in exempt current income from SIIC activities, subject to a 95% distribution obligation;
♦ €47.7 million in exempt current income from SIIC activities, subject to a 60% distribution obligation;
♦ €14.6 million in tax-exempt dividends from SIIC subsidiaries, subject to a 100% distribution obligation;
♦ taxable profit, which stands at €15.5 million before allocation of previous deficits.
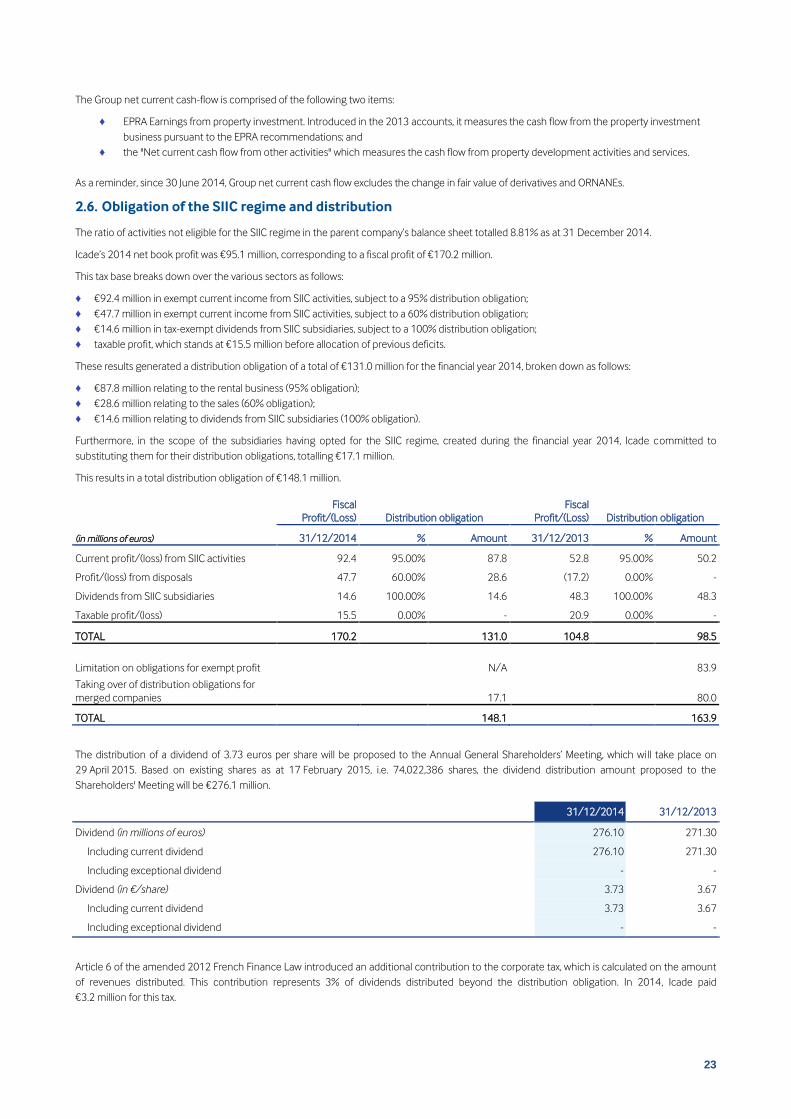
These results generated a distribution obligation of a total of €131.0 million for the financial year 2014, broken down as follows:
♦ €87.8 million relating to the rental business (95% obligation);
♦ €28.6 million relating to the sales (60% obligation);
♦ €14.6 million relating to dividends from SIIC subsidiaries (100% obligation).
Furthermore, in the scope of the subsidiaries having opted for the SIIC regime, created during the financial year 2014, Icade committed to
substituting them for their distribution obligations, totalling €17.1 million.
This results in a total distribution obligation of €148.1 million.
(in millions of euros)
Fiscal
Profit/(Loss) Distribution obligation
Fiscal
Profit/(Loss) Distribution obligation
31/12/2014 % Amount 31/12/2013 % Amount
Current profit/(loss) from SIIC activities 92.4 95.00% 87.8 52.8 95.00% 50.2
Profit/(loss) from disposals 47.7 60.00% 28.6 (17.2) 0.00% -
Dividends from SIIC subsidiaries 14.6 100.00% 14.6 48.3 100.00% 48.3
Taxable profit/(loss) 15.5 0.00% - 20.9 0.00% -
TOTAL 170.2 131.0 104.8 98.5
Limitation on obligations for exempt profit N/A 83.9
Taking over of distribution obligations for
merged companies 17.1 80.0
TOTAL 148.1 163.9
The distribution of a dividend of 3.73 euros per share will be proposed to the Annual General Shareholders’ Meeting, which wi ll take place on
29 April 2015. Based on existing shares as at 17 February 2015, i.e. 74,022,386 shares, the dividend distribution amount proposed to the
Shareholders' Meeting will be €276.1 million.
31/12/2014 31/12/2013
Dividend (in millions of euros) 276.10 271.30
Including current dividend 276.10 271.30
Including exceptional dividend - -
Dividend (in €/share) 3.73 3.67
Including current dividend 3.73 3.67
Including exceptional dividend - -
Article 6 of the amended 2012 French Finance Law introduced an additional contribution to the corporate tax, which is calculated on the amount
of revenues distributed. This contribution represents 3% of dividends distributed beyond the distribution obligation. In 2014, Icade paid
€3.2 million for this tax.
24
2.7. Non tax deductible charges
The financial year’s charges do not include expenditure, which is non-deductible by the tax authorities, as defined by the provisions of Article 39-4
and 223 quarter of France’s General Tax Code.
2.8. Contracts
2.8.1. Major contracts
Icade and its subsidiaries did not conclude any significant contracts, outside the normal course of business, for the unit consisting of Icade and its
subsidiaries during the two years preceding the date of this report.
2.8.2. Related-party transactions
The most significant contracts concluded between Icade and/or certain of its subsidiaries include: contracts for service provisions, a brand license
as well as financing contracts.
Moreover, the report produced by Icade's statutory auditors on the agreements and regulated commitments referred to in Article L.225-38 of the
French Commercial Code which were authorised or which continued during the year ended 31 December 2014 is reproduced in Chapter 7 of this
annual report.
The group consolidated some support functions within Icade. Thus, in 2008, Icade concluded service-provision and brand licensing contracts with
its subsidiaries effective 1st January 2008, which were continued to 30 June 2014.
Moreover, brand licensing contracts have been concluded starting 1 January 2008 and have been continued throughout the financial year 2014.
2.8.2.1. Service-provision contracts
Icade undertook to ensure a group of services for the benefit of its subsidiaries. These contracts were continued until 30 June 2014.
On 1 July 2014, the administrative management and property management activities coming from Icade and the former Sillic, until then exercised
respectively by Icade and by the SAS Socomie, were grouped within the GIE Icade Management.
This legal structure, coming out of the transformation of the SAS Socomie, received by way of a contribution, the set of material and human
means constituting the activity of assistance and services in matters of support functions and in real-estate matters, for the exclusive benefit of the
companies of the Icade group.
The relations between the GIE Icade Management and its members, exclusive beneficiaries of its services, are governed by internal regulations and
service provision contracts.
2.8.2.2. Brand licensing contracts
Icade grants to the subsidiaries concerned the non-exclusive right to use the name "Icade" and the "Icade" trademarks and stylised "I", the dot of
which shows the Caisse des Dépôts badge, in their company name, and/or their sign within the scope of their business activities as well as the
right to use the logo owned by Icade.
The brand licenses were concluded for an initial period of one year, renewable by tacit agreement for a further three years. The brand license
contracts can be terminated annually by either party by giving at least three months' notice before the end of the current year.
2.8.2.3. Specific clauses relating to activities
None.
25
3. NET ASSET VALUE AS AT 31 DECEMBER 2014
3.1. Valuation of property assets
3.1.1. Surveyors’ mission and methodology
3.1.1.1. Valuation mission
Icade’s property assets are valued by independent property surveyors twice a year for the publication of the half-yearly and annual financial
statements, according to arrangements compliant with the SIIC code of ethics published in July 2008 by the Fédération des sociétés immobilières
et foncières [Federation of property and real-estate companies].
The property valuations were performed by Jones Lang LaSalle Expertises, DTZ Eurexi, CBRE Valuation, Catella Valuation FCC and BNP Paribas Real
Estate.
At the beginning of 2014, Icade launched a consultation with the principal real estate experts in the scope of renewing valuation missions of its
office and business parks portfolio. The experts were retained according to the criteria of independence, qualification, reputation, skill in real estate
appraisal, ability in matters of organization and resourcefulness and proposed price level but also with the desire to rotate experts by portfolio.
The property valuation fees are billed to Icade based on a flat remuneration, taking into account the specifics of the buildings (number of units,
number of square meters, number of current leases, etc.) and independent of the value of the assets.
The surveyors’ assignments, for which the main methods of valuation and the conclusions are presented hereafter, are performed according to
the standards of the profession, in particular:
♦ the Property Valuation Charter, fourth edition, published in October 2012;
♦ the Barthès de Ruyter report from the COB (AMF) dated 3 February 2000 on the valuation of the property assets of companies making public
offerings for investment;
♦ at the international level, the TEGoVA (The European Group of Valuers’ Association) European valuation standards published in April 2009 in
the Blue Book and the standards of the Red Book from the Royal Institution of Chartered Surveyors (RICS).
These various texts specify the qualification of the surveyors, the rules for good conduct and ethics and the basic definitions (values, surface areas,
rates and the main valuation methods).
On each valuation assignment and during the presentation of values, Icade ensures the consistency of the methods used for valuation of its assets
within the panel of surveyors.
The values are established on the basis of “duties included” and “duties excluded”, the “duties excluded” values being determ ined after deduction
of fees and legal expenses calculated on an outright basis by the surveyors.
The Crystal Park office building and the EQHO and PB5 towers are appraised twice ; the valuation retained corresponds to the average of the two
appraised values.
The sites are systematically visited by the surveyors for all new assets coming into the portfolio. New site visits are then organised according to a
long-term schedule or each time that a specific event in the life of the building requires it (occurrence of significant modifications in its structure
or environment).
Following the procedures currently in practice within the Group, including land reserves and projects under development, all Icade’s assets were
valued at 31 December 2014, with the exception of:
♦ properties currently in a disposal process, including those covered by a promise of sale at the time the accounts were closed and which are
valued on the basis of the contract selling price; as at 31 December 2014, the jointly owned lots in the Arago Tower and the Rueil extension.
The Strasbourg warehouse was appraised as at 31 December 2014 but has been valued at the offer accepted at the end of 2014;
♦ the buildings underlying a financial operation (i.e. capital leasing or rent with the option to buy where Icade acts exceptionally as the leaser),
which are maintained at the total financial debt entered in the accounts, or as in this case, the purchase option cited in the contract: the
Levallois-Perret office block leased to the Ministry of the Interior for a 20-year duration with a purchase option (LDA) is the only building which
figures in that category on 31 December 2014;
♦ public buildings and works held via a PPP (public-private partnership) which are not valued, as the ownership ultimately returns to the State at
the end of partnership contracts. These assets are therefore held at the net book value and listed without modification in the property assets
currently published by Icade;
♦ buildings acquired less than three months before the semi-annual or annual closing date, which are valued at their net book value. As at 31
December 2014, one clinic in Caen falls into that category.
3.1.1.2. Methodology used by the surveyors
The methodologies used by the surveyors were identical to those used in the previous fiscal year.
26
The investment properties are valued by the appraisers by crossing two methods: the revenue method (the surveyor using the net rent
capitalisation or discounted cash flow method, whichever is the most appropriate) cross-checked using the method of direct comparison with the
prices of transactions recorded on the market on equivalent assets in terms of nature and location (unit, block or building price).
The net revenue capitalisation method consists of applying a rate of return to revenue, whether that revenue is established, existing, theoretical or
potential (market rental value). This approach may be carried out in different ways according to the revenue basis considered (actual rent, market
rent and net revenue) to which different rates of return correspond.
The discounted cash flow method assumes that the value of the assets is equal to the discounted sum of the financial flows expected by the
investor, including resale at the end of the holding period. In addition to the resale value obtained by applying a theoretical rate of return on the
rents for the last year, which differs depending on the sites, the financial flows integrate the rents, the different charges not recovered by the
owner and the heavy maintenance and repair work. The discount rate is calculated based either on a risk-free rate plus a risk premium (linked both
to the property market and the building in question, based on its qualities in terms of location, construction and security of revenues) or on the
weighted average cost of capital.
Irrespective of the method used, the valuation calculations are carried out on a lease by lease basis, except for particular cases and exceptions.
Land reserves and buildings under development are also valued at their fair value. They are therefore subject to a valuation taken into account in
calculating the NAV. The main methods used by the surveyors are the developer balance sheet and/or discounted cash flows, combined in some
cases with the comparison method (see above for details of the last two methods).
The developer balance sheet method involves producing the financial balance sheet for the project according to the approach of a property
developer to whom the land has been offered. From the selling price of the building on delivery, the surveyor deducts all the costs to be incurred,
building costs, fees and margin, financial expenses as well as the amount that could be assigned to the land cost.
For buildings under development, all outstanding costs linked to the completion of the project, along with the carrying charge until delivery, must
be deducted from the buildings’ provisional sale price.
Projects under development are valued on the basis of a clearly identified and documented project, as soon as planning permission can be
examined and implemented.
Whichever method is selected, it is ultimately up to the property surveyors to set a value and discount rate in line with the risks inherent in each
project and, in particular, the state of progress of the various authorisation and building phases (demolition permit, building permit, objections,
progress of work, any pre-marketing or rental guarantee). From the exit value, the surveyors must explain which procedure they followed in
estimating the degree of risk and revaluation attaching to the building in the light of the circumstances under which they work and the
information made available to them.
The buildings of clinics or healthcare establishments are valued by surveyors taking the average value obtained using the rent capitalisation (or
rental value) method or the discounted future cash flow method.
The market value of a hospital is essentially dependent on operation and its ability to generate sufficient revenues to ensure a normal return on
the property investment. These buildings fall under the category of single-use buildings and the value given by the surveyor nevertheless is totally
related to its operation and consequently the value of the business. Being unsuitable for use as another business without substantial conversion
works, these premises are not subject to renewal rent capping or review, or the traditional rules for determining the rental value because the
configuration and specialisation of the building imposes objective physical limits on the operator (number of beds or rooms, etc.) regardless of its
qualities.
The market rental value used by the property surveyors is therefore based on taking into account a quota share of the average revenue or EBITDA
that the establishment made over the last few years of operation, with or without adjustment, in the light of its category, contents, its
administrative environment, the quality of its operating structure (price positioning, subsidies, operating accounts, etc.) and any competition. The
establishment’s premises could otherwise be valued by capitalisation of the rental income advised by Icade.
27
3.1.2. Summary of surveyor valuations of Icade’s assets
The classification of assets is presented in the following way:
♦ strategic assets comprise offices in France (including public buildings and works held via public-private partnerships) and business parks
(including the Le Millénaire shopping centre);
♦ alternative assets include only the Healthcare portfolio;
♦ non-strategic assets comprise the assets located in Germany, warehouses, shops and housing.
Furthermore, assets in the Healthcare portfolio are valued in proportion to Icade’s stake in Icade Santé (56.5%). If these assets were included at
100% of their value, Icade’s portfolio would total €10,151.4 million excluding duties instead of €9,901.1 million at the end of 2013 and
€10,682.2 million including duties instead of €10,376.2 million at the end of 2013.
(value of the portfolio excluding
duties in millions of euros Group
share)
31/12/2014
31/12/2013
restated Change Change
Change on
a like-for-
like basis (2)
Change on
a like-for-
like basis (2)
Total areas Price (3)
Net rate of
return, excl.
duties (4)
Reversion
potential (5)
Overall
market
rental value
EPRA
vacancy
rate (6)
(1)%
(in millions
of euros) (as a %)
(in millions
of euros) (as a %) (in m²) (in €/m²) (as a %) (as a %)
GENERAL TOTAL 9,129.1 9,080.4 +48.6 +0.5% (26.7) (0.3%) 2,749,705 2,931 7.4% 15.5%
Including consolidated assets by the
equity 184.2 251.6 (67.3) (26.8%) (69.4) (27.6%)
(1) Restated for a change in adjustment method related to the consistency of appraisal value/consolidated financial statements
(2) Net change in dispositions for the period and investments
(3) Established according to the appraisal value excluding duties.
(4) Net annualised rents for rented floor areas added to potential net rents of vacant floor areas at the market rental value related to the surveyed value excluding duties of the rentable floor areas.
(5) Difference ascertained between the market rental value of the rented floor areas and the annual rent net of unrecoverable charges for the same space (expressed as a percentage of net rent). The
reversion potential as calculated above is established without taking into consideration the schedule of repayments of the leases and is not subject to discounting.
(6) Calculated based on the estimated rental value of vacant premises divided by the overall rental value.
(7) The indicators (Total area, Price in €/m2, EPRA net rate of return excluding duties and vacancy rates) are presented excluding the Residential Property Investment Division and excluding PPPs.
28
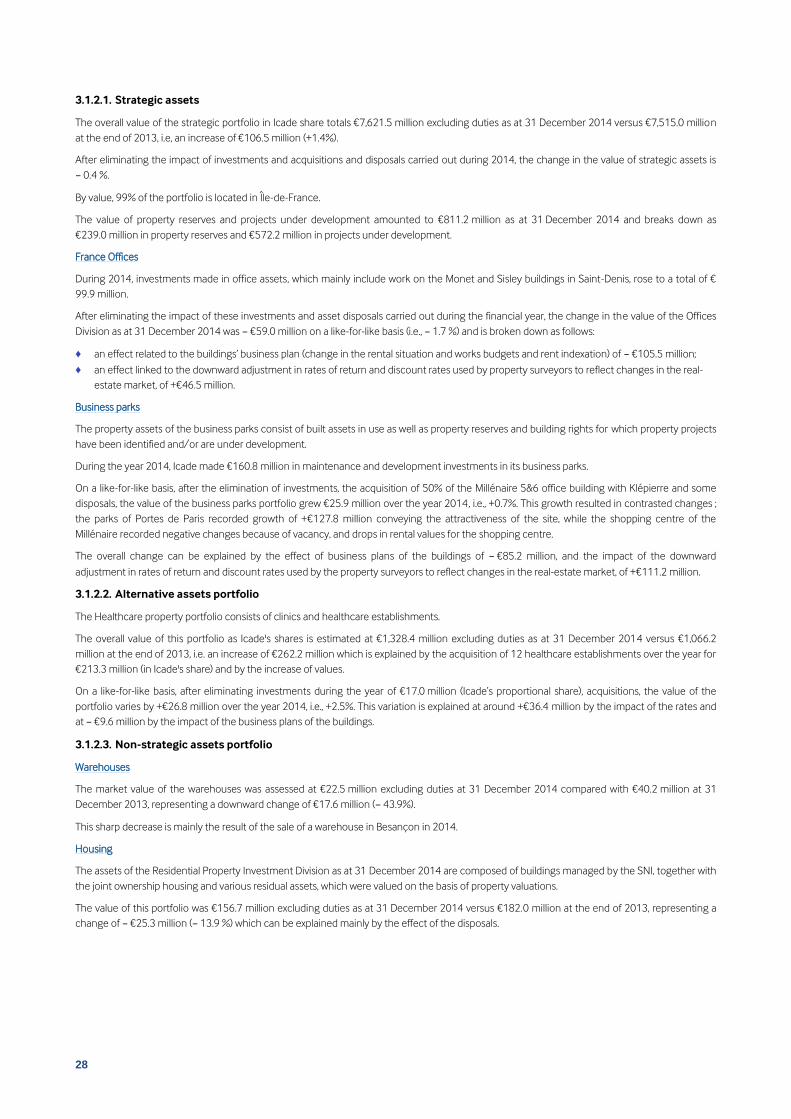
3.1.2.1. Strategic assets
The overall value of the strategic portfolio in Icade share totals €7,621.5 million excluding duties as at 31 December 2014 versus €7,515.0 million
at the end of 2013, i.e, an increase of €106.5 million (+1.4%).
After eliminating the impact of investments and acquisitions and disposals carried out during 2014, the change in the value of strategic assets is
− 0.4 %.
By value, 99% of the portfolio is located in Île-de-France.
The value of property reserves and projects under development amounted to €811.2 million as at 31 December 2014 and breaks down as
€239.0 million in property reserves and €572.2 million in projects under development.
France Offices
During 2014, investments made in office assets, which mainly include work on the Monet and Sisley buildings in Saint-Denis, rose to a total of €
99.9 million.
After eliminating the impact of these investments and asset disposals carried out during the financial year, the change in the value of the Offices
Division as at 31 December 2014 was − €59.0 million on a like-for-like basis (i.e., − 1.7 %) and is broken down as follows:
♦ an effect related to the buildings’ business plan (change in the rental situation and works budgets and rent indexation) of − €105.5 million;
♦ an effect linked to the downward adjustment in rates of return and discount rates used by property surveyors to reflect changes in the real-
estate market, of +€46.5 million.
Business parks
The property assets of the business parks consist of built assets in use as well as property reserves and building rights for which property projects
have been identified and/or are under development.
During the year 2014, Icade made €160.8 million in maintenance and development investments in its business parks.
On a like-for-like basis, after the elimination of investments, the acquisition of 50% of the Millénaire 5&6 office building with Klépierre and some
disposals, the value of the business parks portfolio grew €25.9 million over the year 2014 , i.e., +0.7%. This growth resulted in contrasted changes ;
the parks of Portes de Paris recorded growth of +€127.8 million conveying the attractiveness of the site, while the shopping centre of the
Millénaire recorded negative changes because of vacancy, and drops in rental values for the shopping centre.
The overall change can be explained by the effect of business plans of the buildings of − €85.2 million, and the impact of the downward
adjustment in rates of return and discount rates used by the property surveyors to reflect changes in the real-estate market, of +€111.2 million.
3.1.2.2. Alternative assets portfolio
The Healthcare property portfolio consists of clinics and healthcare establishments.
The overall value of this portfolio as Icade's shares is estimated at €1,328.4 million excluding duties as at 31 December 2014 versus €1,066.2
million at the end of 2013, i.e. an increase of €262.2 million which is explained by the acquisition of 12 healthcare establishments over the year for
€213.3 million (in Icade's share) and by the increase of values.
On a like-for-like basis, after eliminating investments during the year of €17.0 million (Icade’s proportional share), acquisitions, the value of the
portfolio varies by +€26.8 million over the year 2014, i.e., +2.5%. This variation is explained at around +€36.4 million by the impact of the rates and
at − €9.6 million by the impact of the business plans of the buildings.
3.1.2.3. Non-strategic assets portfolio
Warehouses
The market value of the warehouses was assessed at €22.5 million excluding duties at 31 December 2014 compared with €40.2 million at 31
December 2013, representing a downward change of €17.6 million (− 43.9%).
This sharp decrease is mainly the result of the sale of a warehouse in Besançon in 2014.
Housing
The assets of the Residential Property Investment Division as at 31 December 2014 are composed of buildings managed by the SNI, together with
the joint ownership housing and various residual assets, which were valued on the basis of property valuations.
The value of this portfolio was €156.7 million excluding duties as at 31 December 2014 versus €182.0 million at the end of 2013, representing a
change of − €25.3 million (− 13.9 %) which can be explained mainly by the effect of the disposals.
29
3.2. Valuation of property development and services businesses
Icade’s development and service companies have been valued by an independent firm for the purposes of calculating the NAV (net asset value).
The method used by the appraiser, which remains identical to that used for the previous year, is essentially based on a discounted cash flow (DCF)
over the period of each company's business plan, extended over a 10 year horizon, together with a terminal value based on a normative cash flow
increasing to infinity.
In the first half of 2014, Icade launched a consultation with six valuation experts from companies in the scope of renewing its valuation mission of
its development and services companies. The experts were retained according to the criteria of independence, qualification, reputation, skill in real
estate appraisal, ability in matters of organisation and resourcefulness and proposed price level.
The valuation mission was awarded to the office of Détroyat Associates.
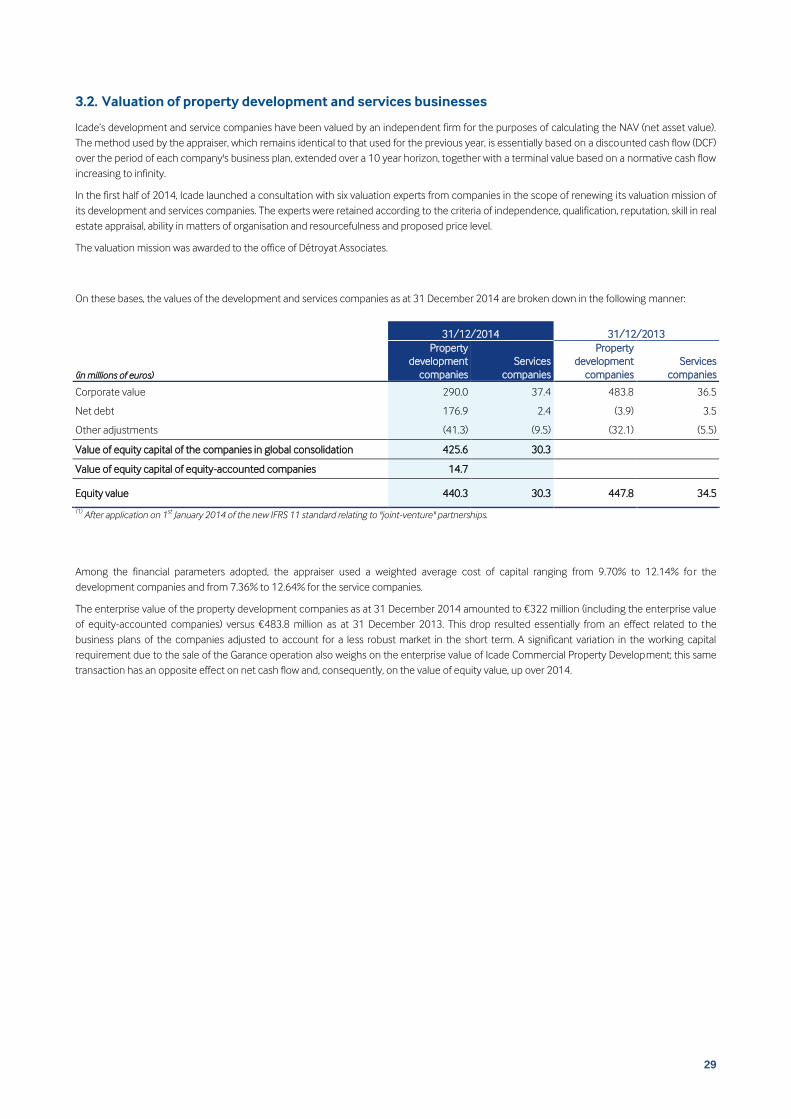
On these bases, the values of the development and services companies as at 31 December 2014 are broken down in the following manner:
31/12/2014 31/12/2013
(in millions of euros)
Property
development
companies
Services
companies
Property
development
companies
Services
companies
Corporate value 290.0 37.4 483.8 36.5
Net debt 176.9 2.4 (3.9) 3.5
Other adjustments (41.3) (9.5) (32.1) (5.5)
Value of equity capital of the companies in global consolidation 425.6 30.3
Value of equity capital of equity-accounted companies 14.7
Equity value 440.3 30.3 447.8 34.5
(1) After application on 1
st January 2014 of the new IFRS 11 standard relating to "joint-venture" partnerships.
Among the financial parameters adopted, the appraiser used a weighted average cost of capital ranging from 9.70% to 12.14% for the
development companies and from 7.36% to 12.64% for the service companies.
The enterprise value of the property development companies as at 31 December 2014 amounted to €322 million (including the enterprise value
of equity-accounted companies) versus €483.8 million as at 31 December 2013. This drop resulted essentially from an effect related to the
business plans of the companies adjusted to account for a less robust market in the short term. A significant variation in the working capital
requirement due to the sale of the Garance operation also weighs on the enterprise value of Icade Commercial Property Development; this same
transaction has an opposite effect on net cash flow and, consequently, on the value of equity value, up over 2014.
30
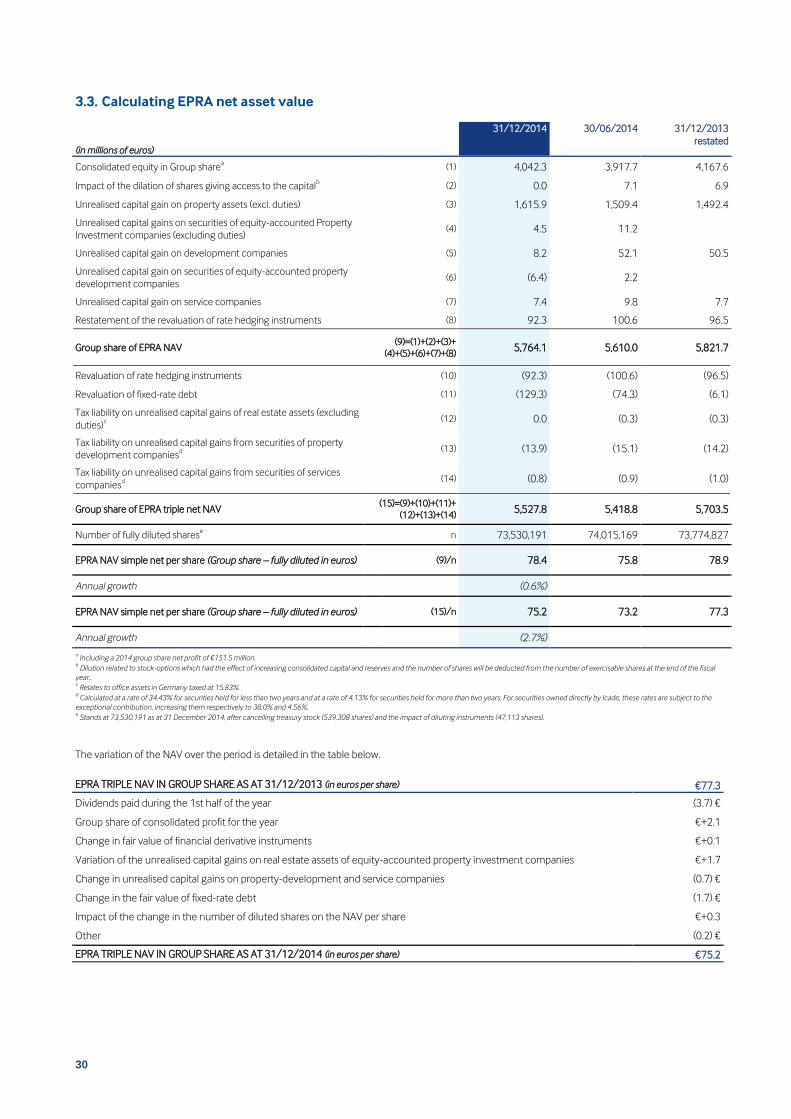
3.3. Calculating EPRA net asset value
31/12/2014 30/06/2014 31/12/2013
restated (in millions of euros)
Consolidated equity in Group sharea (1) 4,042.3 3,917.7 4,167.6
Impact of the dilation of shares giving access to the capitalb (2) 0.0 7.1 6.9
Unrealised capital gain on property assets (excl. duties) (3) 1,615.9 1,509.4 1,492.4
Unrealised capital gains on securities of equity-accounted Property
Unrealised capital gain on development companies (5) 8.2 52.1 50.5
Unrealised capital gain on securities of equity-accounted property
development companies (6) (6.4) 2.2
Unrealised capital gain on service companies (7) 7.4 9.8 7.7
Restatement of the revaluation of rate hedging instruments (8) 92.3 100.6 96.5
Group share of EPRA NAV (9)=(1)+(2)+(3)+
(4)+(5)+(6)+(7)+(8) 5,764.1 5,610.0 5,821.7
Revaluation of rate hedging instruments (10) (92.3) (100.6) (96.5)
Revaluation of fixed-rate debt (11) (129.3) (74.3) (6.1)
Tax liability on unrealised capital gains of real estate assets (excluding
duties)c
(12) 0.0 (0.3) (0.3)
Tax liability on unrealised capital gains from securities of property
development companiesd
(13) (13.9) (15.1) (14.2)
Tax liability on unrealised capital gains from securities of services
companiesd
(14) (0.8) (0.9) (1.0)
Group share of EPRA triple net NAV (15)=(9)+(10)+(11)+
(12)+(13)+(14) 5,527.8 5,418.8 5,703.5
Number of fully diluted sharese n 73,530,191 74,015,169 73,774,827
EPRA NAV simple net per share (Group share – fully diluted in euros) (9)/n 78.4 75.8 78.9
Annual growth (0.6%)
EPRA NAV simple net per share (Group share – fully diluted in euros) (15)/n 75.2 73.2 77.3
Annual growth (2.7%)
a Including a 2014 group share net profit of €151.5 million.
b Dilution related to stock-options which had the effect of increasing consolidated capital and reserves and the number of shares will be deducted from the number of exercisable shares at the end of the fiscal
year.. c Relates to office assets in Germany taxed at 15.83%.
d Calculated at a rate of 34.43% for securities held for less than two years and at a rate of 4.13% for securities held for more than two years. For securities owned directly by Icade, these rates are subject to the
exceptional contribution, increasing them respectively to 38.0% and 4.56%. e Stands at 73,530,191 as at 31 December 2014, after cancelling treasury stock (539,308 shares) and the impact of diluting instruments (47,113 shares).
The variation of the NAV over the period is detailed in the table below.
EPRA TRIPLE NAV IN GROUP SHARE AS AT 31/12/2013 (in euros per share) €77.3
Dividends paid during the 1st half of the year (3.7) €
Group share of consolidated profit for the year €+2.1
Change in fair value of financial derivative instruments €+0.1
Variation of the unrealised capital gains on real estate assets of equity-accounted property investment companies €+1.7
Change in unrealised capital gains on property-development and service companies (0.7) €
Change in the fair value of fixed-rate debt (1.7) €
Impact of the change in the number of diluted shares on the NAV per share €+0.3
Other (0.2) €
EPRA TRIPLE NAV IN GROUP SHARE AS AT 31/12/2014 (in euros per share) €75.2
31
The change in unrealised capital gains of real estate assets and from property development and services companies results in changes in values
explained above (in 0 et 0). The changes most marked concern the real estate assets situated in dynamic locations or in recovery (immediate inner
ring north, La Défense), which have recorded movement of significant value having increased the unrealised capital gains.
Conversely, the constant decline in the interest rate, all throughout the year, has aggravated the difference of fair value of the fixed rate debt,
whose outstanding debt grew in 2014, notably by the issuing of a €500 million bond in April.
The fair value of rate derivatives has appreciated, which is explained by the passing of time and the maturity of derivative products historically
contracted at elevated rates.
4. EPRA REPORTING AS AT 31 DECEMBER 2014
Below, Icade presents all the European Public Real Estate Association (EPRA) performance indicators drawn up in accordance with its
recommendations.
4.1. EPRA net asset value (simple net and triple net)
The calculation of the EPRA NAV is detailed in part 3.3. above.
31/12/2014 30/06/2014 31/12/2013
restated
Change
2013/2014 Change
(in millions of euros) (as a %)
Group share of EPRA NAV 5,764.1 5,610.0 5,821.7 (57.6) (1.0)%
EPRA NAV simple net, Group share, per share (in €) 78.4 75.8 78.9 (0.5) (0.6)%
Group share of EPRA triple net NAV 5,527.8 5,418.8 5,703.5 (175.7) (3.1)%
EPRA NAV triple net, Group share, per share (in €) 75.2 73.2 77.3 (2.1) (2.7)%
4.2. EPRA Earnings from property investment
EPRA Earnings from property investment measures the operational performance of recurring operating activities for the Property Investment
Division.
EPRA Earnings from property investment
(in millions of euros)
31/12/2014 31/12/2013
restated
Change
2013/2014
Net profit/(loss 172.8 145.0 19.2%
Net profit/(loss) – Other activities(1)
(39.9) (53.2)
(a) Net profit/(loss) - Property Investment 132.9 91.7 44.9%
(i) Change in value of investment properties and depreciation allowance (270.6) (269.6)
(ii) Profit/(loss) from disposal of assets 98.6 120.7
(iii) Profit/(loss) from disposal of shops - (0.1)
(iv) Tax on profits from disposals and impairments (0.2) 0.4
(v) Negative acquisition difference/depreciation of goodwill - (3.2)
(vi) Change in fair value of financial instruments (5.3) 8.4
(vii) Acquisition cost for shares - -
(viii) Deferred tax related to EPRA adjustments - -
(ix) Adjustments for equity-accounted companies (6.6) (12.5)
(x) Minority interests (Icade Santé) 47.0 38.1
(b) Total Restatements (136.9) (117.8) -16.2%
(a-b) EPRA EARNINGS FROM PROPERTY INVESTMENT 269.9 209.4 28.9%
Average number of diluted shares in circulation used in the calculation 73,735,312 60,865,381
EPRA EARNINGS FROM PROPERTY INVESTMENT in €/share €3.66 €3.44 6.4%
(1) Other activities corresponding to property development, services and inter-group.
EPRA Earnings from property investment represents €3.66 per share as at 31 December 2014 versus €3.44 per share as at 31 December 2013.
32
4.3. EPRA rate of return
The table below presents the switch from the Icade net rate of return as described elsewhere and the rates of return defined by EPRA. The
calculation is carried out after restatement of Icade Santé’s minority interests.
31/12/2014 31/12/2013
ICADE NET RETURN(1)
7.4% 7.4%
Effect of estimated duties and fees (0.4)% (0.3)%
Restatement for potential rents from vacant premises (0.8)% (1.0)%
EPRA TOPPED-UP NET INITIAL RETURN(2)
6.1% 6.0%
Integration of rental holidays (0.6)% (0.3)%
EPRA NET INITIAL RETURN(3)
5.5% 5.8%
(1) Net annualised rents for rented floor areas added to potential net rents of vacant floor areas at the market rental value, excluding special rent arrangements, related
to the surveyed value excl. duties of assets in operation. (2)
Annualised rents net of leased surface areas, excluding special rent arrangements, related to the surveyed value including duties of assets in operation. (3
Annualised rents net of leased surface areas, excluding special rent arrangements, related to the surveyed value including duties of assets in operation.
4.4. EPRA vacancy rate
The EPRA vacancy rate is defined as the ratio between the market rent for vacant surface areas and the market rent of the total surface area.
Assets under development are not included in calculation of this ratio.
Below are detailed figures concerning the vacancy rate, in accordance with the definition recommended by EPRA, for the Commercial Property
Investment portfolio after restatement of Icade Santé’s minority interests.
31/12/2014
31/12/2013
Strategic assets 18.3% 13.8%
Alternative assets (healthcare) 0.0% 0.0%
Non-strategic assets portfolio 19.6% 5.6%
TOTAL COMMERCIAL PROPERTY INVESTMENT 15.5% 11.7%
The negative change of the EPRA vacancy rate between 2013 and 2014 is primarily explained by the increase in financial vacancy between 2013
and 2014.
The leases signed in 2014 for the EQHO tower, which represent 71% of the floor space of the asset (56,000 m² - excluding IRE share), have not
been integrated in the calculation of the EPRA vacancy rate because the effective dates of the leases entered into are expected in 2015.
Reprocessing these leases, the EPRA vacancy rates on the strategic scope fall to 12.8%.
The segment of non-strategic commercial property assets has experienced a significant increase of its EPRA vacancy rate between 2013 and
2014 because of the asset disposals taking place during the year. In fact, the assets disposed (Germany, warehouse) have experienced quite low
vacancy.
33
4.5. EPRA cost ratio (Property Investment)
The data below present the detail of the cost ratio, in accordance with the definition recommended by EPRA, for the Commercial Property
Investment portfolio after restatement of Icade Santé’s minority interests.
31/12/2014
31/12/2013
restated
Includes: (i) Structural expenses and other overheads (82.5) (67.1)
(ii) Rental charges net of re-invoicing (29.3) (24.7)
(iii) Management fees net of actual/estimated margins 0.0
(iv) Other re-invoicing covering overheads 33.6 38.9
(v) Share of overheads and expenses of equity-accounted companies (3.1) (4.9)
(vi) Share of overheads and charges allocated to non-controlling interests 4.5 3.7
Excludes: (vii) Depreciation of investment properties - -
(viii) Land leasing costs (2.4) (1.5)
(ix) Other property charges incorporated into rental revenues (0.1) 0.0
After allocation of the intra-group refinancing, nearly 99% of the Group’s debt relates to the Property Investment Division and 1% relates to the
Property Development Division. The share assigned to the Services business line is insignificant. These proportions convey a slight decrease of
indebtedness of the Property Development division compared to 2013.
5.2.4. Average cost of debt
The average cost of financing in 2014 was 1.97% before hedging and 3.07% after hedging, compared with 1.71% and 3.83% respectively in 2013.
The average cost of financing decreased sharply between 2013 and 2014, through the full year effect of hedging restructuring carried out during
the second half of 2013, and proactive management of financing - renegotiations made in the 1st half of 2014 and new issues of debt (bonds and
commercial paper).
5.2.5. Interest rate risk
The monitoring and management of financial risks are centralised within the Financing and Cash Management Division.
This department reports on a monthly basis to Icade’s risk, rates, treasury and finance committee on all matters related to finance, cash-
management, interest-rate risk management and liquidity management.
Changes in financial markets can entail a variation in interest rates, which may be reflected in an increase in the cost of refinancing. To finance its
investments, Icade also uses floating-rate debt, which is then hedged, thus conserving its ability to prepay loans without penalties. This debt
represents, before hedging, nearly 50.4 % of its total debt as at 31 December 2014 (excluding debts associated with equity interests and bank
overdrafts).
In 2014, Icade continued its prudent debt management policy by maintaining limited exposure to interest-rate risks by setting up appropriate
hedging contracts (plain vanilla swaps and caps). Rate floor contracts on a Euribor 3 month at 0% have been subscribed for a nominal €300 million
during the 2nd half of the year, to cover an economic risk of a drop in the reference index of some of our financing contracts below a minimum
threshold.
BREAKDOWN OF DEBT BY TYPE OF RATE
(EXCLUDING REPURCHASED DEBT IN INVESTMENTS AND
BANK OVERDRAFTS)
(31 December 2014)
OUTSTANDING HEDGING POSITIONS
(31 December 2014, in millions of euros)
The majority of the debt (92.1%) is protected against a rise in interest rates (fixed rate debt or variable rate debt hedged). The outstanding notional
debt from hedges is summarised in the graph above.
The average term of variable debt was 2.9 years and of associated hedges was also 2.9 years, providing adequate hedging.
Finally, Icade favours classifying its hedging instruments as “cash flow hedges” according to the IFRS standards, which requires that the variations
in the fair value of these instruments be posted as capital and reserves (for the effective portion) rather than as profit/loss.
Considering the year’s profile, and the change in interest rates, the change in fair value of hedging instruments has had a positive impact on the
capital and reserves of €1 million.
5.3. Financial rating
Icade has been rated by rating agency Standard & Poor’s since September 2013.
Following changes to its rating criteria, in May 2014 Standard & Poor’s confirmed Icade’s long-term rating as “BBB+” with a stable outlook, as well
as its short term rating as A2.
5.4. Financial structure
5.4.1. Financial structure ratios
5.4.1.1. LTV (loan-to-value)
The ratio of LTV (net financial debt divided by the value of assets excluding duties increased by the value of the property development and
services companies) comes out to 36.9% as at 31 December 2014 (compared with 37.5% as at 31 December 2013).
This ratio remains well below the ceiling levels to be met under the financial covenants stipulated in the banking documents (50% and 52% in the
majority of cases where this ratio is mentioned as a covenant). These covenants do not include the values of property development and services
companies in the calculation of the ratio, positioning it at 38.2% (compared with 39.1% as at 31 December 2013).
If the value of the portfolio used for its calculation was assessed including duties and if the fair value of interest rate derivatives was not included in
net debt, the adjusted LTV ratio would be 34.3 % at 31 December 2014.
5.4.1.2. ICR (interest coverage ratio)
The Interest Coverage ratio (ICR) (corrected for depreciation) was 4.74x in financial year 2014. This ratio increased in comparison with previous
years (4.02x in 2013), considering the Silic inclusion in the consolidation scope, the disposals carried out during the year and the improved cost of
net debt. Compared with EBITDA, this ratio works out as 3.99x.
31/12/2014 31/12/2013
restated
2
Ratio of net financial debt/revalued portfolio (LTV)(1)
36.9% 37.5%
Interest Coverage ratio (ICR) 4.74x 4.02x
(1) Integrates the value in the balance sheet of property development and services companies as well as the financial receivables of public-private partnerships.
(2) The values at 31/12/2013 have been restated with respect to those published to account for the IFRS 11 standard.
38
5.4.2. Table of covenants
Nature of the limit Direction Threshold 31/12/2014
LTV(1)
Maximum 45%, 50% or 52% 38.2%
ICR Minimum 2.00x 4.74x
Control of the Caisse des Dépôts (CDC)(2)
Minimum 34%, 50% or 51% 52.0%
Value of the Property Investment portfolio(3)
Minimum 3, 4, 5 or 7 billion euros €10.1 billion
Debt ratio of property development subsidiaries/Consolidated gross debt Maximum 20% 0.9%
Surety on assets Maximum 20% of the property
investment portfolio 10.7%
(4)
(1) Around 83% of the debt relating to an LTV covenant has a limit of 52%, 15% of the debt has a limit of 50%, while the remaining 2% has a limit of 45%.
)2) Around 96% of the debt relating to the covenant for the CDC change of control clause has a limit of 34%, with a limit of 50-51% for the remaining 4%.
(3) Around 19% of the debt relating to the value of Investment property assets covenant has a limit of €3 billion, 3% of the debt has a limit of €4 billion, 16% of the debt has a limit
of €5 billion, with a limit of €7 billion on the remaining 62%. (4)
Maximum calculation with regard to the loan clauses.
The covenants were observed as at 31 December 2014.
6. PRO FORMA 2013
The financial statements as at 31 December 2013 have been restated in order to reflect the new consolidation methods from the IFRS 10 and 11
standards. These restatements have no effect on the net profit/(loss) - Group share. The amounts restated were accounted for in the "shares in
companies accounted for by the equity method" on the balance sheet and in the share in the profit/loss of equity-accounted companies in the
income statement. The latter aggregate is included in the operating profit/(loss), same as the share of profit/loss of companies historically
consolidated by the equity method of accounting, in the past positioned below the financial profit/(loss).
Net profit/(loss): Share of non-controlling interests 18.0 - 18.0 38.1 (20.1)
NET PROFIT/(LOSS) – GROUP SHARE 126.9 - 126.9 209.4 (82.4)
1The "Other" column groups the activities of Property Development and Services, the depreciation allowance of the investment properties, the profit/(loss) of the disposals, the conversion to
fair value of financial instruments and ORNANEs, and other non-recurring items
39
6.2. Key figures for Property Investment division
31/12/2013
published Restatements
31/12/2013
restated (in millions of euros)
Revenue – Property Investment 476.4 (12.6) 463.7
EBITDA 404.1 (15.8) 388.3
Margin (EBITDA/Revenues) 84.8% 83.7%
OPERATING PROFIT/(LOSS) 226.5 0.8 227.3
Financial profit/loss (124.4) (0.8) (125.2)
Profit tax (10.4) - (10.4)
Net profit/(loss) - Property Investment 91.7 - 91.7
NET INCOME GROUP SHARE PROPERTY INVESTMENT 75.0 - 75.0