64
ICAP Quarterly Master Slide Set April-June 2008
| Date post: | 29-Dec-2015 |
| Category: |
Documents |
| Upload: | annis-sutton |
| View: | 214 times |
| Download: | 0 times |

ICAP Quarterly Master Slide SetApril-June 2008
Site Census
• What: Ongoing, real-time inventory of all planned, current, and closed ICAP sites. Supported activities, funding source(s) and their targets are also captured
• Purpose: To have one up to date master list of sites, activities, funding sources, and targets that all ICAP staff can refer to for planning and evaluation

Number of ICAP-supported sites by activity, June 2008 (n=619)
Nu
mb
er
of s
ites

Number of ICAP-supported sites by country, June 2008 (n=619)
Nu
mb
er
of s
ites
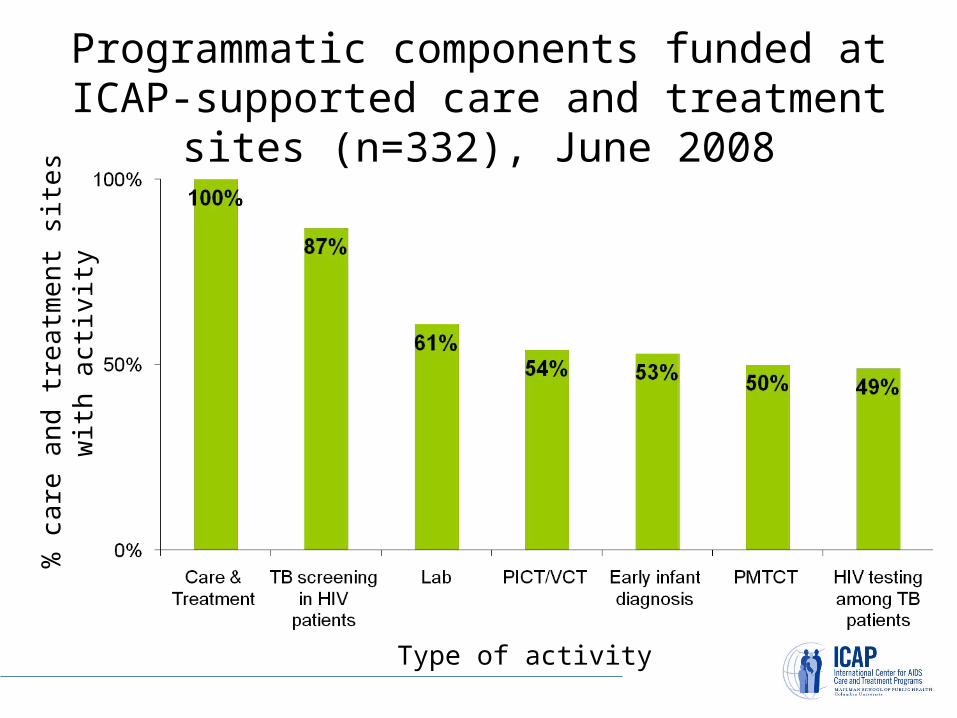
Programmatic components funded at ICAP-supported care and treatment sites (n=332),
June 2008
% c
are
and
trea
tme
nt s
ites
with
act
ivity
Type of activity

Program and Facility Characteristics Tracking System (PFaCTS)
• What: Collects program and facility information on ICAP-supported care and treatment programs semi-annually
• Purpose: To describe the scope, diversity, and comprehensiveness of ICAP-supported care and treatment programs, and evaluate multi-level factors that influence program performance and patient-level outcomes

25%
72%
69%
28%7%
0%
50%
100%
Urban RuralPrimary Secondary Tertiary
Location and type of ICAP-supported HIV care and treatment sites (n=296)
n=166 n=130
% s
ites
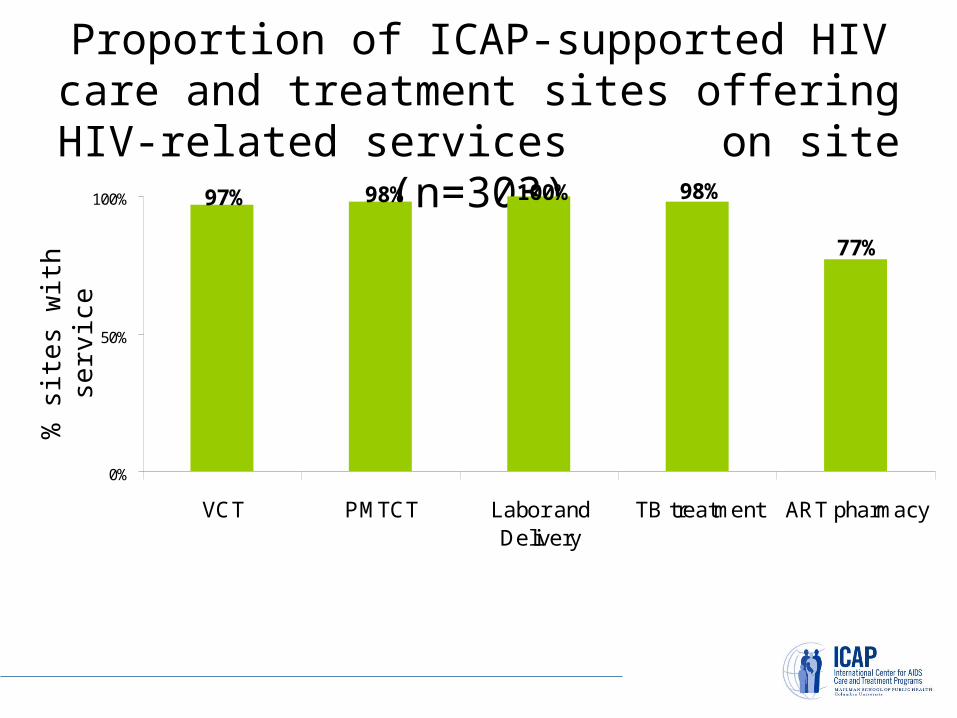
Proportion of ICAP-supported HIV care and treatment sites offering HIV-related services
on site (n=303)97% 98% 100% 98%
77%
0%
50%
100%
VCT PMTCT Labor andDelivery
TB treatment ART pharmacy
% s
ites
with
se
rvic
e
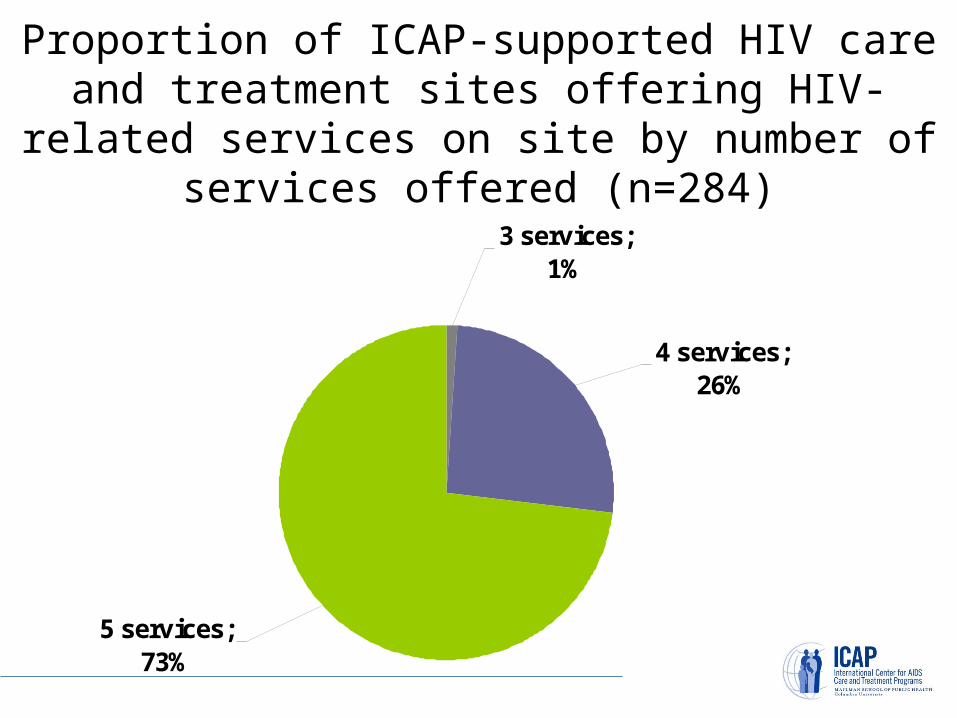
3 services; 1%
4 services; 26%
5 services; 73%
Proportion of ICAP-supported HIV care and treatment sites offering HIV-related services on site
by number of services offered (n=284)
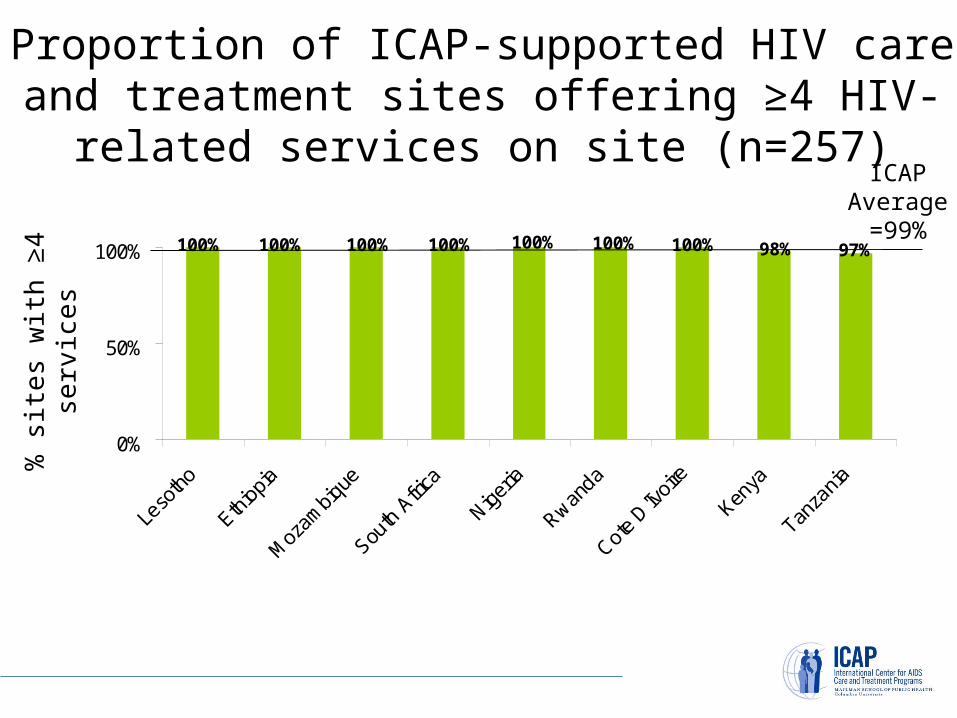
Proportion of ICAP-supported HIV care and treatment sites offering ≥4 HIV-related services on
site (n=257)
100% 100% 100% 100% 100% 100% 100% 98% 97%
0%
50%
100%
Leso
tho
Ethio
pia
Moz
ambiq
ue
South
Afri
ca
Niger
ia
Rwanda
Cote
D'Ivoir
e
Kenya
Tanza
nia
ICAP Average
=99%
% s
ites
with
≥4
serv
ice
s

Proportion of ICAP-supported HIV care and treatment sites offering on-site patient support
services by type of service offered (n=303)
87%
55%
40% 39%24%
0%
50%
100%
ARTadherence
support
Outreach Peereducatorprogram
Foodsupport for
children andinfants
Foodsupport for
adults
% s
ites
with
se
rvic
e
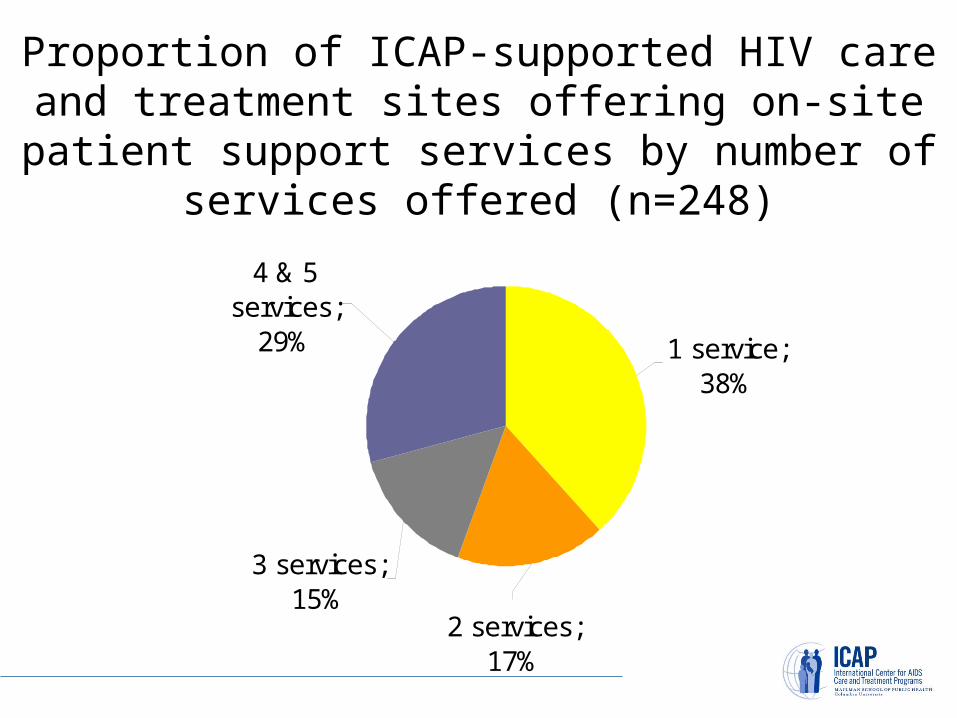
1 service; 38%
2 services; 17%
3 services; 15%
4 & 5 services;
29%
Proportion of ICAP-supported HIV care and treatment sites offering on-site patient support services by number of services offered (n=248)

0%0%0%
78%
69%
32%24%
13%0% 0%
0%
50%
100%
South
Afri
ca
Rwanda
Moz
ambiq
ue
Kenya
Niger
ia
Swazila
nd
Leso
tho
Tanza
nia
Ethio
pia
Cote D
'Ivoir
e
Proportion of ICAP-supported HIV care and treatment sites with ≥4 on-site patient support
services (n=248)
ICAP Average
=29%
% o
f site
s w
ith ≥
4 s
ervi
ces
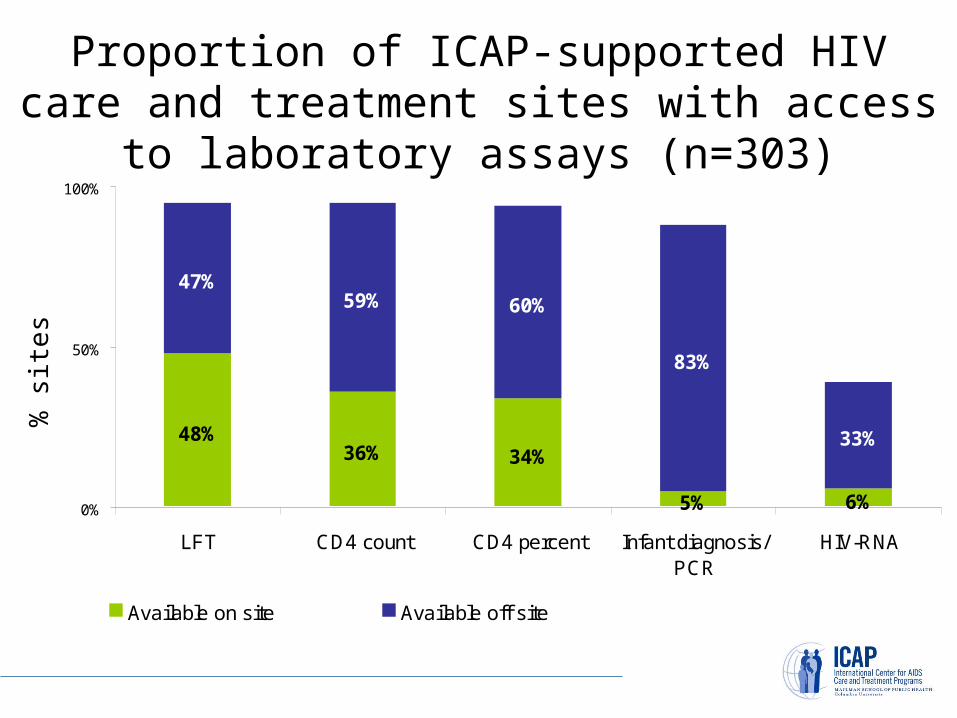
Proportion of ICAP-supported HIV care and treatment sites with access to laboratory assays
(n=303)
48%36% 34%
5% 6%
47%59% 60%
83%
33%
0%
50%
100%
LFT CD4 count CD4 percent Infant diagnosis/PCR
HIV-RNA
Available on site Available off site
% s
ites
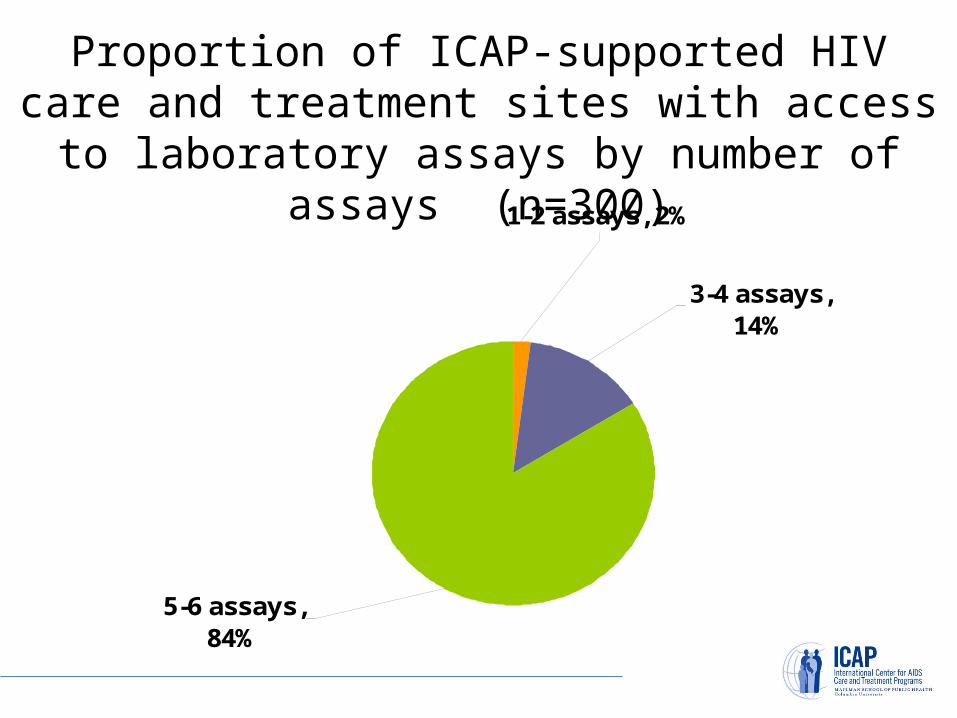
3-4 assays, 14%
1-2 assays, 2%
5-6 assays, 84%
Proportion of ICAP-supported HIV care and treatment sites with access to laboratory assays
by number of assays (n=300)

86%100% 100% 100% 100% 95% 89% 89% 88% 87%
0%
50%
100%
Swazila
nd
South
Afri
ca
Leso
tho
Rwanda
Ethiop
ia
Moza
mbiq
ue
Cote D
'Ivoir
e
Nigeria
Kenya
Tanzan
ia
Proportion of ICAP-supported HIV care and treatment sites with access to key HIV-related
laboratory assays (n=277)ICAP
Average=92%
% s
ites

100% 100% 100% 100% 100% 93% 91% 90%76%
0%
50%
100%
South
Afri
ca
Swazila
nd
Leso
tho
Rwanda
Nigeria
Moza
mbiq
ue
Kenya
Ethiop
ia
Tanzan
ia
Proportion of ICAP-supported HIV care and treatment sites with access to PCR laboratory
assays (n=283)ICAP
Average=90%
% s
ites

0
30
60
90
120
150
Overa
ll
Kenya
Tanza
nia
Rwanda
Niger
ia
Leso
tho
South
Afri
ca
Moz
ambiq
ue
Ethiop
ia
Physicians Health Officers/Medical Assistants Nurses
Mean number of health care providers per 1000 patients on ART at ICAP-supported HIV care and
treatment sites (n=303)
Num
ber
of p
rovi
ders
per
/100
0 pa
tient
s on
AR
T

0
10
20
South
Afri
ca
Cote
D'Voi
re
Rwanda
Leso
tho
Tanza
nia
Moz
ambiq
ue
Niger
ia
Ethiop
ia
Kenya
Mean number of outreach workers per 1000 patients on ART at ICAP-supported HIV care and
treatment sites (n=163)
ICAP Average
=6.9
Num
ber
of o
utre
ach
wor
kers
pe
r/10
00 p
atie
nts
on A
RT

0%
50%
100%
Food supportfor adults
Food supportfor adults or
infants
Outreach Adherencesupport
Peereducators
Jan 07 July 07 Jan 08
Trend in proportion of ICAP-supported HIV care and treatment sites offering on-site patient support services
(n=170)

0%
50%
100%
150%
July 07 Jan 08
Trend in proportion of ICAP-supported HIV care and treatment sites offering prevention services (n=224)
Counseling regarding disclosure
Education on behavior and safe sex
Provision of condoms
Referral for on-site screening for STIs
Education on high-risk substance use
Screening for drug and alcohol abuse

HIV care and treatment services

14%
48%40% 39%
32%
6%1%
12%
23%
9%
28%
4%
0%
50%
100%
Proportion of ART patients in sub-Saharan Africa that initiated ART at an ICAP-supported site,
December 2007
% o
f all
pa
tient
s o
n A
RT
Sub-S
ahar
an co
untri
es
where
ICAP w
orks
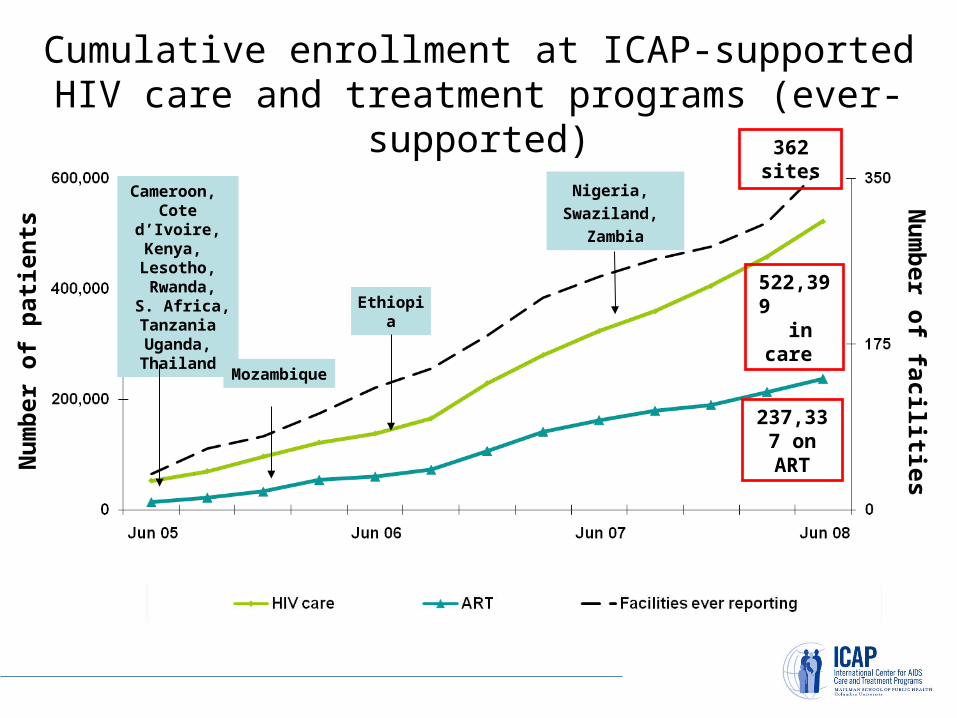
Cameroon, Cote d’Ivoire,
Kenya, Lesotho, Rwanda, S. Africa, TanzaniaUganda,Thailand
Mozambique
Ethiopia
Cumulative enrollment at ICAP-supported HIV care and treatment programs (ever-supported)
522,399 in care
237,337 on ARTN
um
ber
of
pat
ien
ts Nu
mb
er of facilities
Nigeria,
Swaziland,
Zambia
362 sites
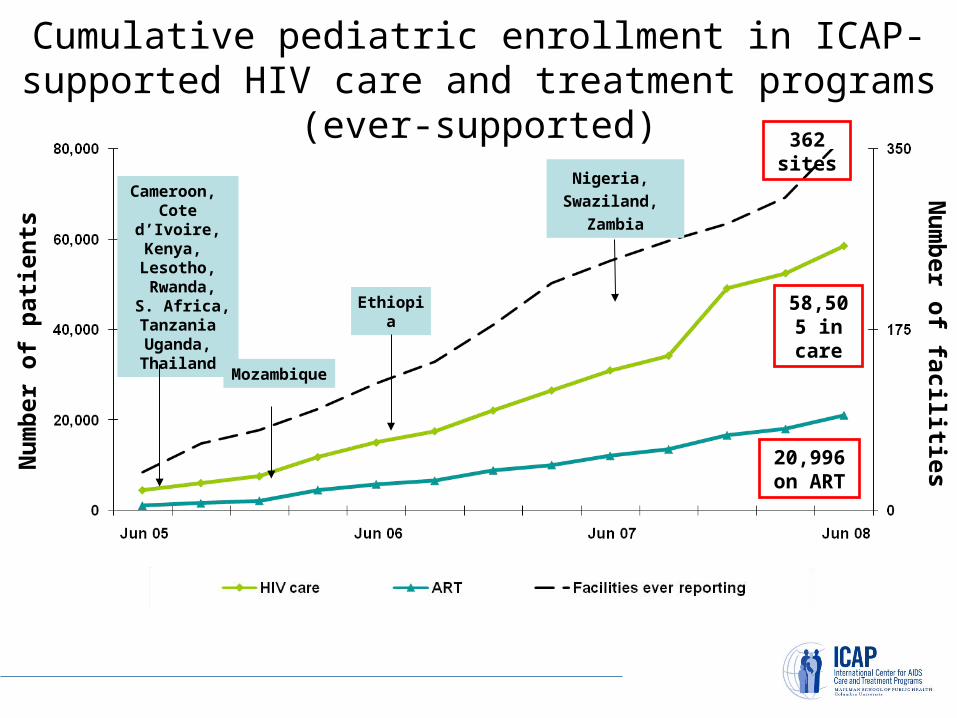
Cumulative pediatric enrollment in ICAP-supported HIV care and treatment programs (ever-supported)
58,505 in care
20,996 on ART
Nu
mb
er o
f p
atie
nts
Nu
mb
er of facilities
Cameroon, Cote d’Ivoire,
Kenya, Lesotho, Rwanda, S. Africa, TanzaniaUganda,Thailand
Mozambique
Ethiopia
Nigeria,
Swaziland,
Zambia
362 sites

Cumulative enrollment in ICAP-supported HIV care and treatment programs (currently supported)
442,668 in care
202,303 on ART
Nu
mb
er o
f p
atie
nts
Nu
mb
er of facilities
Cameroon, Cote d’Ivoire,
Kenya, Lesotho, Rwanda, S. Africa, TanzaniaUganda,Thailand
Mozambique
Ethiopia
Nigeria,
Swaziland,
Zambia
320 sites
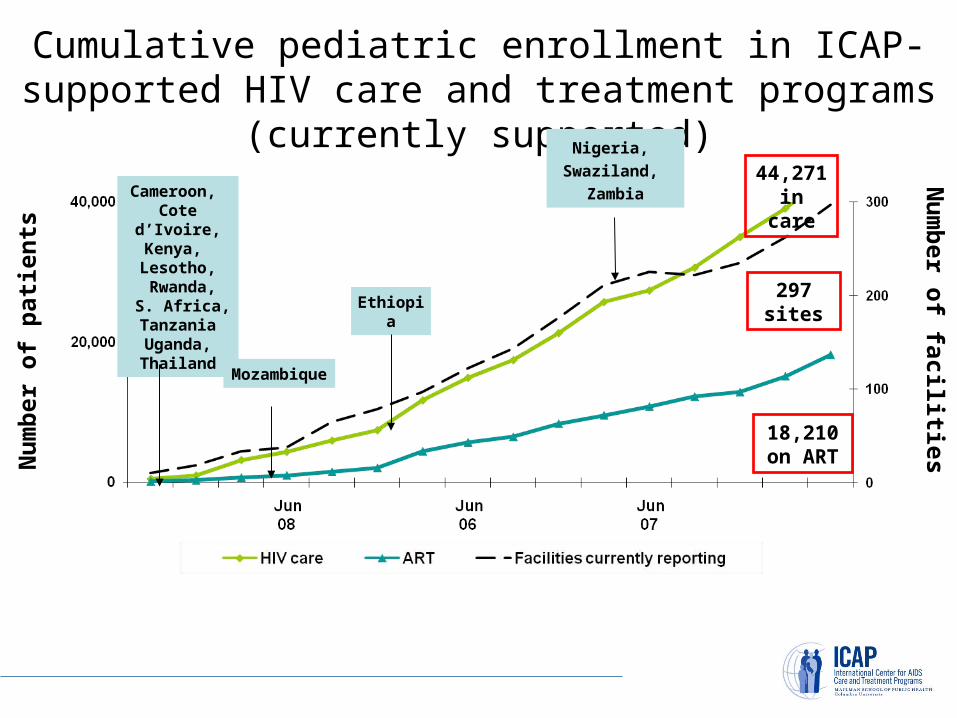
Cumulative pediatric enrollment in ICAP-supported HIV care and treatment programs (currently supported)
297 sites
18,210 on ART
Nu
mb
er o
f p
atie
nts
Nu
mb
er of facilities
Cameroon, Cote d’Ivoire,
Kenya, Lesotho, Rwanda, S. Africa, TanzaniaUganda,Thailand
Mozambique
Ethiopia
Nigeria,
Swaziland,
Zambia44,271 in care

Current and target cumulative enrollment in ICAP-supported care and treatment programs
174,819
418,969
200,785
393,781
0
225,000
450,000
HIV care ART
Current enrollment, June 08
COP 08 enrollment target
94% of target
87% of target
Nu
mb
er o
f p
atie
nts

Current and target cumulative HIV care enrollment in ICAP-supported care and treatment
programs by country
0
50000
100000
150000
Cote
d'Ivo
ire
Ethiop
ia
Kenya
Moz
ambi
que
Nigeria
Rwanda
South
Afri
ca
Tanza
nia
Current enrollment, June 08
COP 08 enrollment target
Nu
mb
er o
f p
atie
nts
3% of target
99% of target
66% of target
108% of target76% of target
108% of target
87% of target
107% of target

Current and target cumulative ART enrollment in ICAP-supported care and treatment programs
by country
Nu
mb
er o
f p
atie
nts
0
25,000
50,000
Cote
d'Ivo
ire
Ethiop
ia
Kenya
Moz
ambiq
ue
Nigeria
Rwanda
South
Afri
ca
Tanz
ania
Current enrollment, June 08
COP 08 enrollment target
7% of target
98% of target
116% of target
48% of target
96% of target
101% of target
83% of target
89% of target
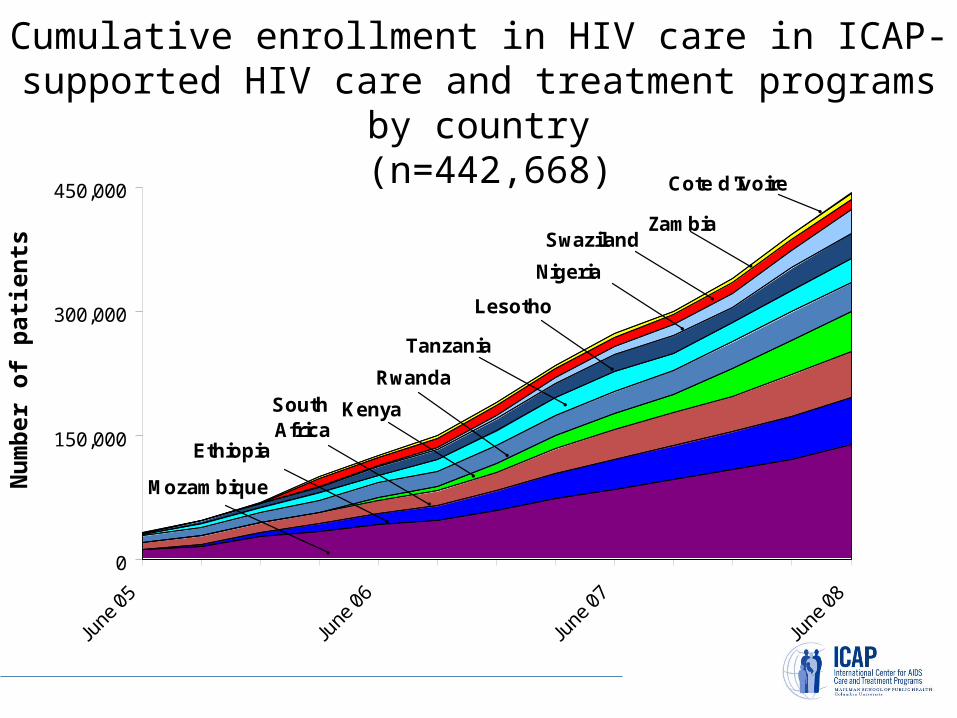
Mozambique
Ethiopia
South Africa
Kenya
Rwanda
Tanzania
Lesotho
Nigeria
SwazilandZambia
Cote d'Ivoire
0
150,000
300,000
450,000
June
05
June
06
June
07
June
08
Cumulative enrollment in HIV care in ICAP-supported HIV care and treatment programs by country
(n=442,668)
Nu
mb
er o
f p
atie
nts

Cumulative enrollment on ART at ICAP-supported HIV care and treatment programs by country
(n=202,303)
Mozambique
Ethiopia
South Africa
Rwanda
KenyaTanzania
Swaziland
Lesotho
NigeriaZambia
Cote d'Ivoire
0
105,000
210,000
Jun
e 05
Jun
e 06
Jun
e 07
Jun
e 08
Nu
mb
er o
f p
atie
nts

Cumulative and current enrollment in ART care at ICAP-supported HIV care and treatment programs
(n= 190,378*)
Nu
mb
er
of p
atie
nts
ART patients retained in care
Cumulative initiating ART
Lost to follow up
Reported dead
ART patients retained in care
* Excludes Zambia and Swaziland as no follow up data were reported for ART patients

Cumulative enrollment in ICAP-supported HIV care and treatment programs by ART status, age, and sex
Total care enrollment (n=442,668) Total ART enrollment (n=202,303)
Women 15+
Men 15+
Children <15
0
150,000
300,000
450,000
Women 15+
Men 15+
Children < 15
0
105,000
210,000

Proportion of patients ever enrolled in HIV care who initiated ART in ICAP-supported care and treatment
programs* as of June 2008
46%
69% 59%55% 53%
47%44% 43% 43%
40%
32%
0%
30%
60%
Ove
rall
Cote d
'Ivoire
South A
frica
Ethio
pia
Rwan
da
Tanzania
Nigeria
Kenya
Lesoth
o
Zambia
Moza
mbiq
ue
n=528
n=35,
158
n=57,
559
n=3
0,47
6
n=
139,
056
n=46,
562
n=4
42,6
88
n=55,
528
% p
atie
nts
initi
atin
g A
RT
n=2
8,91
4
n=6
,959
n=3
0,00
3
* Excludes Swaziland as no HIV care data were reported
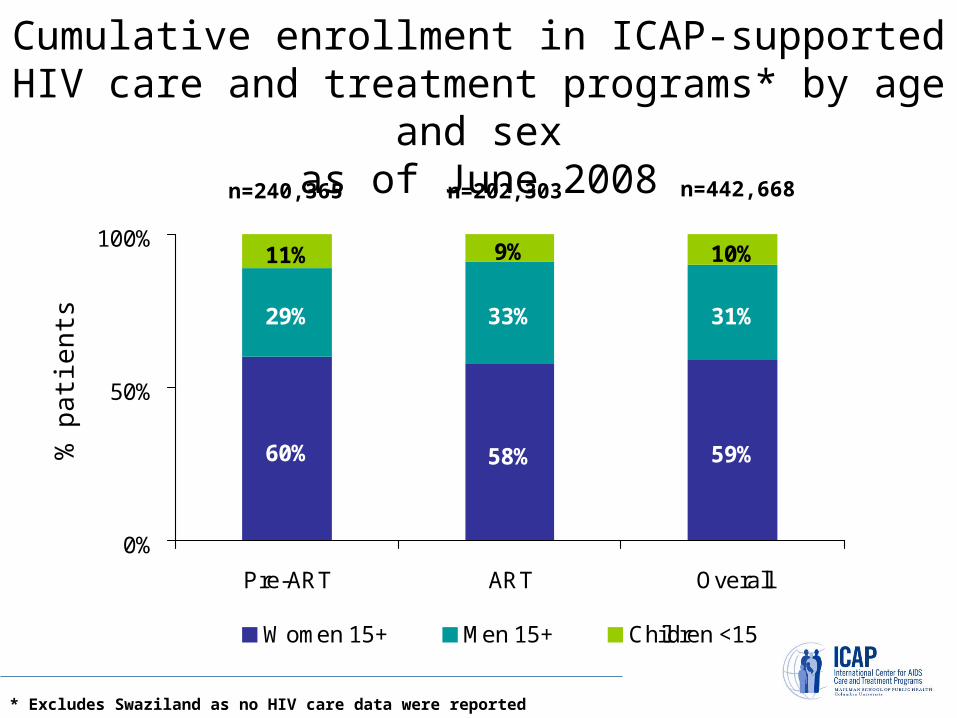
60% 58% 59%
29% 33% 31%
11% 9% 10%
0%
50%
100%
Pre-ART ART Overall
Women 15+ Men 15+ Children <15
Cumulative enrollment in ICAP-supported HIV care and treatment programs* by age and sex
as of June 2008 n=240,365 n=202,303 n=442,668
% p
atie
nts
* Excludes Swaziland as no HIV care data were reported

59%
69% 68% 66%61% 62% 62%
59%
1%
9%
99%
55%59%
58%
9%7%11%11%
7%10%8%
3%3%
10%
0%
50%
100%
Overa
ll
Cote
d'Ivoire
Lesot
ho
South
Afri
ca
Niger
ia
Tanza
nia
Kenya
Rwanda
Swazila
nd
Moza
mbiq
ue
Ethio
pia
Zambia
Women 15+ Children <15
Cumulative HIV care enrollment of women and children in ICAP-supported HIV care and treatment
programs as of June 2008
n=57,
559
n=46,
562
n=55,
528
n=5
28
n=28,
914
n=1
39,0
56
n=30,
003
n=30,
476
n=35,
158
n=442
,668
n=6,9
59
% p
atie
nts
in H
IV c
are
n=11,
925
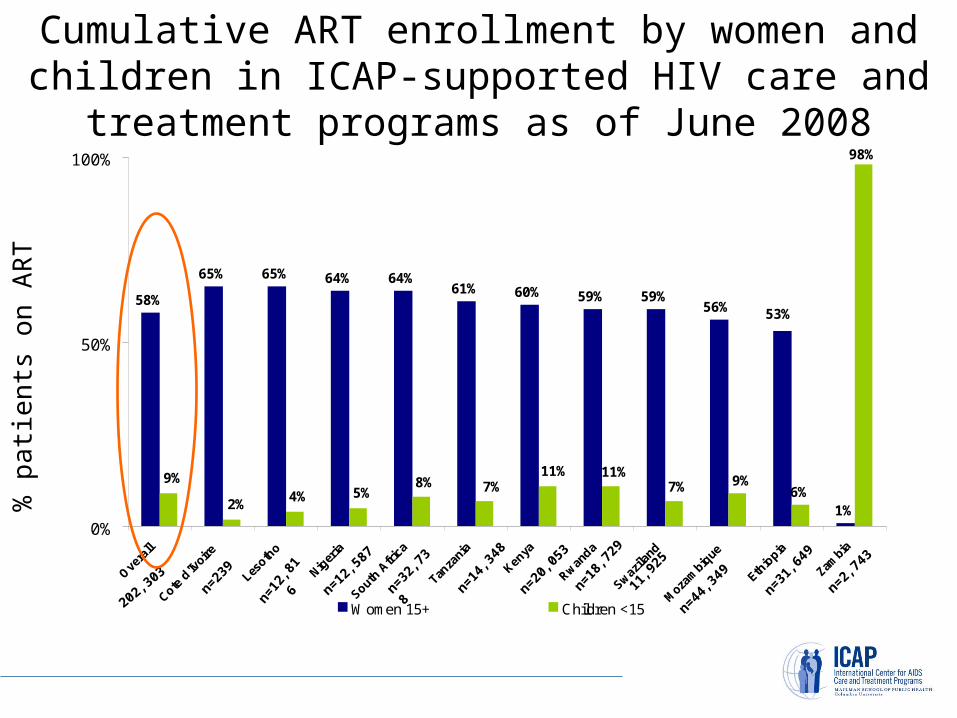
58%
65% 65% 64% 64%61% 60% 59% 59%
1%6%
98%
56% 53%
9%
2%4% 5%
8% 7%11% 11%
7% 9%
0%
50%
100%
Overa
ll
Cote d
'Ivoi
re
Lesoth
o
Niger
ia
South A
frica
Tanza
nia
Kenya
Rwanda
Swazila
nd
Moz
ambi
que
Ethio
pia
Zambi
a
Women 15+ Children <15
Cumulative ART enrollment by women and children in ICAP-supported HIV care and treatment programs as
of June 2008
n=18,
729
n=20,
053
n=12,5
87
n=2
39
n=32,
738
n=3
1,64
9
n=12
,816
n=14,
348
11,9
25
202,303
n=2
,743
% p
atie
nts
on A
RT
n=44,
349

67%
55%
46%
23%19%
15% 15%
6%
14%
20%
24%
31%
20%
29%
19%
25%
46%
65%
3%0% 0% 5%
0% 0% 0% 0%
19%
0%
17%
37%36%
28%
23% 23%
23%
29%
50%56%
36% 41%
24%
53% 56%
0%
50%
100%
Overall Zambia Nigeria Moz SouthAfrica
Lesotho Ethiopia Tanzania Kenya Rwanda Coted'Ivoire
0-1 year 2-4 years 5-14 years Unknown
Cumulative pediatric HIV care enrollment in ICAP-supported HIV care and treatment programs*
as of June 2008 n=2,280 n=947n=12,196 n=3,753 n=4,909n=4,250n=3,095 n=5,386 n=17n=43,431*
% p
edi
atr
ic p
atie
nts
in H
IV c
are
n=6,898
* Excludes Swaziland as no pediatric breakdown were reported
45%41%
31%
18%12%
7% 7%0%
21%33%
29%
30%
20%
57%
35%
34%
50%
43%
4% 2% 7%0% 0% 0% 0% 0%
23%
0%
21%22%
8%
26%
29%23%26%
24%
67%
53%
24%
56%48%67%58%
0%
50%
100%
Overall Zambia Nigeria Moz Lesotho SouthAfrica
Ethiopia Tanzania Kenya Rwanda Coted'Ivoire
0-1 year 2-4 years 5-14 years Unknown
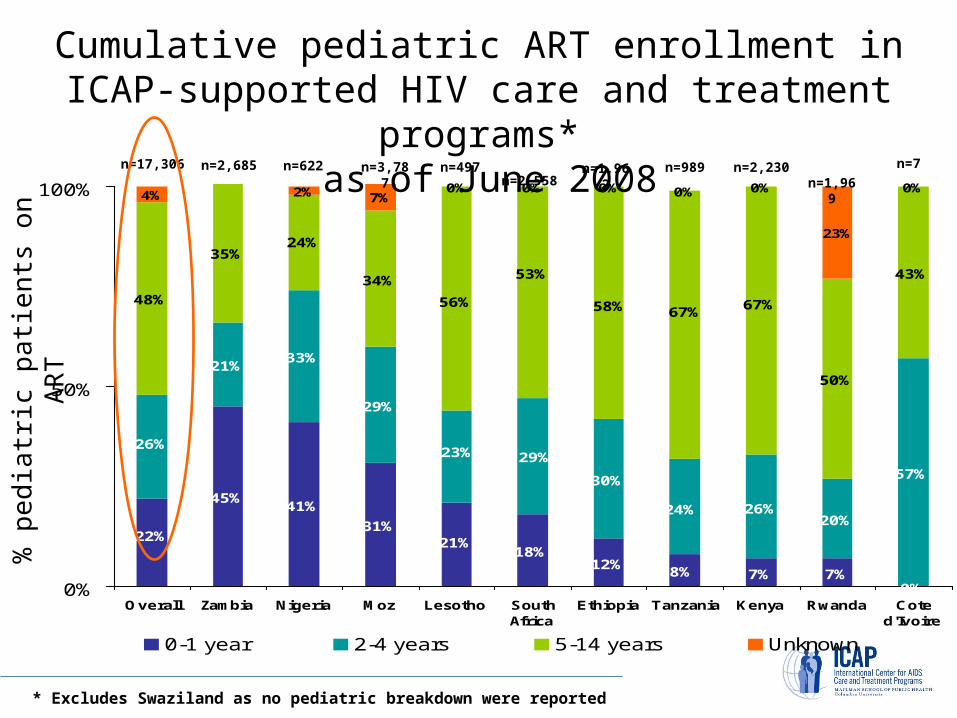
Cumulative pediatric ART enrollment in ICAP-supported HIV care and treatment programs*
as of June 2008n=2,230 n=1,969n=622 n=1,962 n=989n=497n=2,685 n=2,558 n=7n=17,306
% p
edi
atr
ic p
atie
nts
on
AR
T
n=3,787
* Excludes Swaziland as no pediatric breakdown were reported

22%37% 37%
29%20% 17%
9% 8% 7%
78%63%
71%80% 83%
91% 92% 93% 97%
3%
63%
0%
50%
100%
Ove
rall
South
Afri
ca
Tanza
nia
Kenya
Moz
ambiq
ue
Rwanda
Niger
ia
Ethio
pia
Cote d
'Ivoi
re
Leso
tho
% Eligible, but not started % Eligible, started
ART initiation among patients eligible for ART in ICAP-supported HIV care and treatment programs,
April-June 2008 (n=25,485)
% p
atie
nts
elig
ible
for
AR
T
n=263 n=1,683n=5,046 n=1,547 n=3,273n=2,305 n=2,808n=25,485 n=5,576 n=2,984
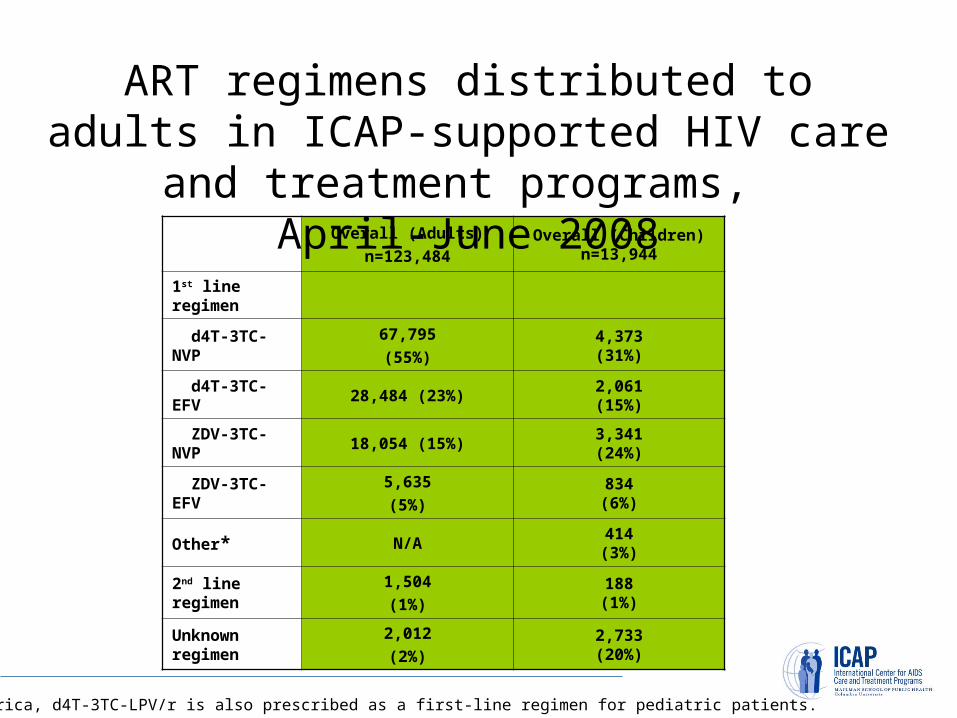
Overall (Adults)
n=123,484Overall (Children)
n=13,944
1st line regimen
d4T-3TC-NVP67,795
(55%)4,373(31%)
d4T-3TC-EFV 28,484 (23%)2,061(15%)
ZDV-3TC-NVP 18,054 (15%)3,341(24%)
ZDV-3TC-EFV5,635
(5%)834(6%)
Other* N/A414(3%)
2nd line regimen1,504
(1%)188(1%)
Unknown regimen
2,012
(2%)2,733(20%)
ART regimens distributed to adults in ICAP-supported HIV care and treatment programs,
April-June 2008
* In South Africa, d4T-3TC-LPV/r is also prescribed as a first-line regimen for pediatric patients.

ART regimens distributed to adults in ICAP-supported HIV care and treatment programs,
April-June 2008Cote
d’Ivoire
n=355
Eth
n=19,480
Kenya
n=11,006
Lesotho
n=7,000
Moz
n=31,183
Nigeria
n=10,773
Rwanda
n=11,571
South Africa
n=22,014
TZ
n=10,046
Zambia
n=54
1st line regimen
d4T-3TC-NVP
259
(73%)
10,212
(52%)
8,992
(82%)3,556(51%)
25,731
(83%)
4,042
(38%)
4,637
(40%)
2,812
(13%)
7,521
(75%)
33
(61%)
d4T-3TC-EFV
62
(17%)
4,147
(21%)
1,139
(10%)
1,173
(17%)
2,201
(7%)
207
(2%)
788
(7%)
17,788
(81%)
979
(10%)
0
(0%)
ZDV-3TC-NVP
18
(5%)3,319 (17%)
515
(5%)
1,208
(17%)
1,723
(6%)
5,553
(52%)4,560 (39%)
250
(1%)
908
(9%)
0
(0%)
ZDV-3TC-EFV
2(1%)
1,697
(9%)
140
(1%)
706
(10%)
91
(0%)
287
(3%)
1,176
(10%)
906
(4%)
630
(6%)
0
(0%)
2nd line regimen
7(2%)
60
(0%)
194
(2%)
357
(5%)
287
(1%)
0
(0%)
410
4%
179
(1%)
10
(0%)
0
(0%)
Unknown regimen
7
(2%)
45
(0%)
26
(0%)
0
(0%)
1,150
(4%)
684
(6%)
0
(0%)
79
(0%)
0
(0%)
21
(39%)

Cote d’Ivoire
n=7
Ethiopian=1,549
Kenyan=1,589
Lesothon=295
Moz n=2,962
Nigerian=527
Rwandan= 1,504
South Africa*n=2,289
Tanzanian=774
Zambian=2,448
1st line regimen
d4T-3TC-NVP
5(71%)
374(24%)
5790(36%)
139(47%)
1,252 (42%)
26(5%)
593 (39%)
35(2%)
381(49%)
989(40%)
d4T-3TC-EFV
0122(8%)
98(6%)
56(19%)
97(3%)
33 (6%)
118 (8%)
1,520(66%)
16(2%)
1(0%)
ZDV-3TC-NVP
2(29%)
891 (58%)
745(47%)
27 (9%)
345 (12%)
395 (75%)
589 (39%)
24(1%)
323(42%)
0(0%)
ZDV-3TC-EFV
2(50%)
156 (10%)
131(8%)
7 (2%)
7(0%)
72 (14%)
185(12%)
222(10%)
54(7%)
0(0%)
Other*0
(0%)0
(0%)0
(0%)0
(0%)0
(0%)0
(0%)0
(0%)414
(18%)0
(0%)0
(0%)
2nd line regimen
0 (0%)
1(0%)
20(1%)
0(0%)
90(3%)
0 (0%)
16(1%)
61(3%)
0(0%)
0(0%)
Unknown regimen
0(0%)
5(0%)
16(1%)
66(22%)
1,171(40%)
1(0%)
3(0%)
13(1%)
0(0%)
1,458(60%)
ART regimens distributed to children in ICAP-supported HIV care and treatment programs,
April-June 2008
* In South Africa, d4T-3TC-LPV/r is also prescribed as a first-line regimen for pediatric patients.

Proportion of patients with CD4 count at baseline, 6, and 12 months after ART initiation,
as of June 2008
% p
atie
nts
wit
h C
D4
cou
nt

Average median CD4 count at baseline and 6 and 12 months after ART initiation, as of June 2008

Change in Median CD4 count (cells/µL) at 6 and12 months of ART, as of June 2008
Ch
ang
e in
med
ian
CD
4 co
un
t

Status of ART patients at ICAP-supported HIV care and treatment programs as of June 2008
(n=190,378*)
Continued ART 155,616
82%Discontinued
34,76218%
Lost to follow-up
62%
Reported dead 34%
Stopped ART 4%8.4 per 1,000 person-years
72.5 per 1,000 person-years
142.1 per 1,000 person-years
* Excludes Swaziland as no follow up data were reported for ART patients

62%85% 76%
64% 56% 55% 52% 47%28%
0%
34%
14% 24%29% 43% 38% 43% 53%
64%100% 93%
4% 1% 0% 8% 1% 7% 5% 0%9%
0% 7%
0%0%
50%
100%
Overa
ll
Kenya
Leso
tho
Moz
ambiq
ue
Ethiop
ia
South
Afric
a
Tanza
nia
Nigeria
Rwanda
Cote d
'Ivoir
e
Zambia
Lost to follow-up Reported dead Stopped ART
Reasons for ART discontinuation in ICAP-supported HIV care and treatment programs as of
June 2008
% p
atie
nts
n=34
,762
n=4,
838
n=6,
285
n=8,
508
n=1,
446
n=6,
299
n=3,
564
n=1,132
n=1,
446
n=3
n=18
2

Person-years on ART and discontinuation rates at ICAP-supported care and treatment programs
Cum
ulat
ive
pers
on-y
ears
on
AR
T Cum
ulative events per 1,000 person-years
PMTCT services
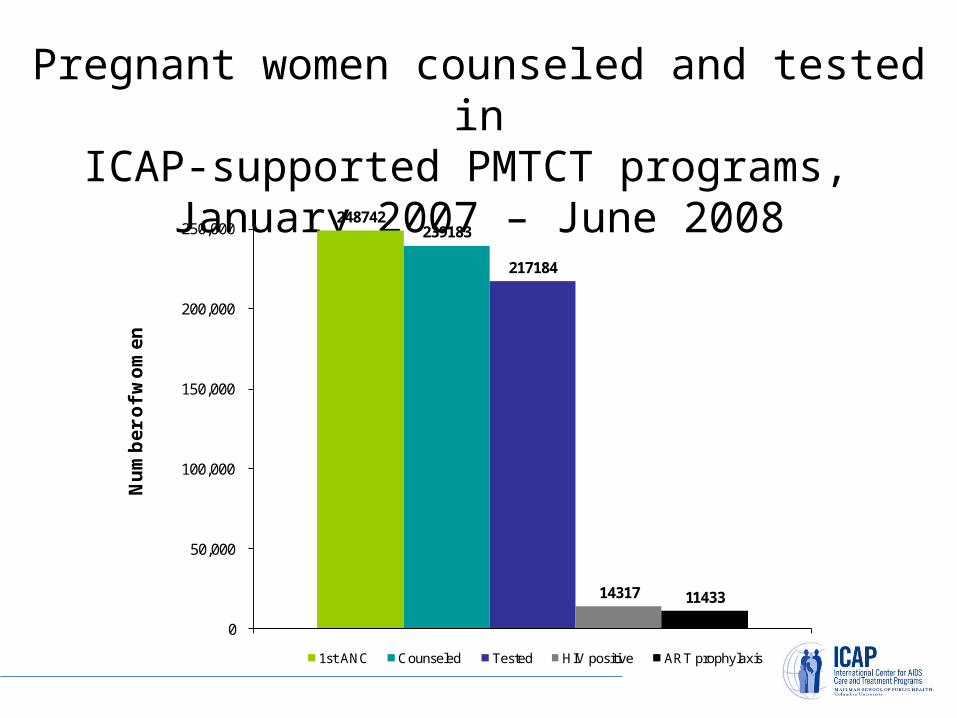
Pregnant women counseled and tested inICAP-supported PMTCT programs,
January 2007 – June 2008248742
217184
14317 11433
239183
0
50,000
100,000
150,000
200,000
250,000
Nu
mb
er
of
wo
me
n
1st ANC Counseled Tested HIV positive ART prophylaxis
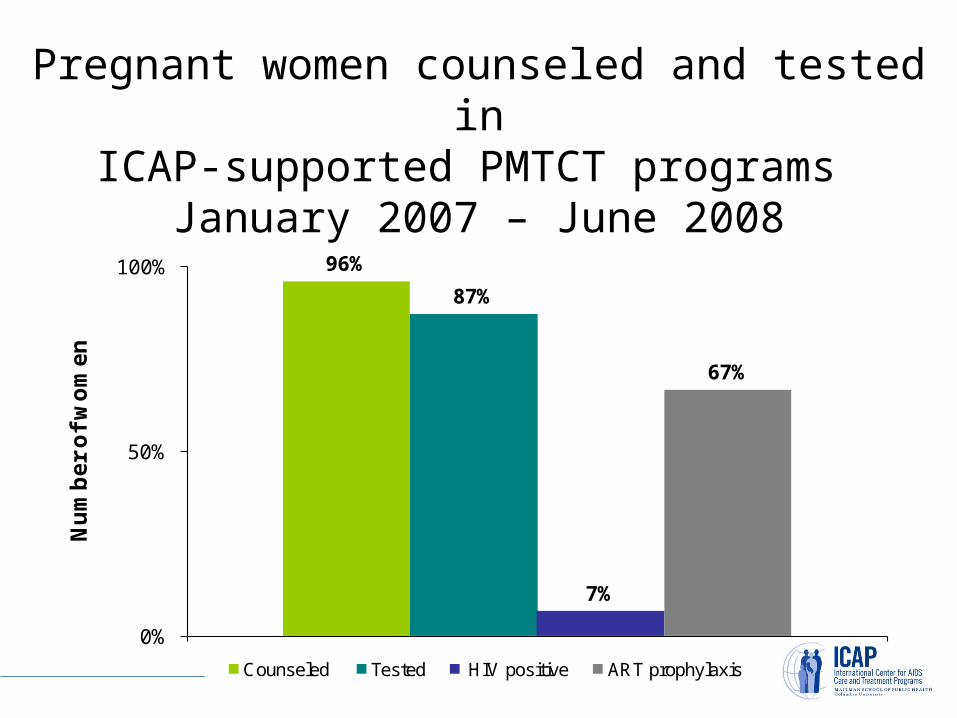
Pregnant women counseled and tested inICAP-supported PMTCT programs
January 2007 – June 2008
96%
87%
7%
67%
0%
50%
100%
Nu
mb
er
of
wo
me
n
Counseled Tested HIV positive ART prophylaxis

Pregnant women counseled and tested inICAP-supported PMTCT programs over time
34101
38997
50834
59854
60056
31838
38470
48045
57563
58459
27097
33413
44310
52302
55329
2111
2247
3135
3368
3105
1086
1817
2265
2373
2985
0
20,000
40,000
60,000
Jun 07 Sep 07 Dec 07 Mar 08 Jun 08
Nu
mb
er o
f wo
me
n
1st ANC Counseled Tested HIV positive ART prophylaxis

Pregnant women counseled and tested inICAP-supported PMTCT programs over time
93%98%
95% 96% 97%
79%85% 87% 87%
92%
8% 7% 7% 6% 6%
56%
81%
72% 71%
90%
0%
50%
100%
Jun 07n=34,101
Sep 07n = 38,977
Dec 07n = 50,834
Mar 08n = 59,854
Jun 08n = 60,0056
Nu
mb
er o
f wo
me
n
Counseled Tested HIV positive ART prophylaxis

Pregnant women counseled and tested inICAP-supported PMTCT programs
by country, January 2007 - June 2008
0%
50%
100%
Nigeria Mozambique Ethiopia Rwanda Lesotho Cote d'Ivoire
% w
om
en
Counseled Tested HIV positive ART prophylaxis
n=105,680
n=62,402 n=25,052
n=2,100n=44,774
n=2,570

Type of ART prophylaxis at ICAP-supported PMTCT programs, January 2007 - April 2008
n=921 n=5657 n=3405 n=993 n=412n=11433 n=45

TB/HIV services

Proportion of HIV patients screened, screened positive and initiated TB treatment in ICAP-supported care and
treatment programs as of June 2008
% p
atie
nts
n=119,030 n=1,097 n=15,522 n=13,450 n=24,427 n=18,926 n=34,495New HIV patients n=60
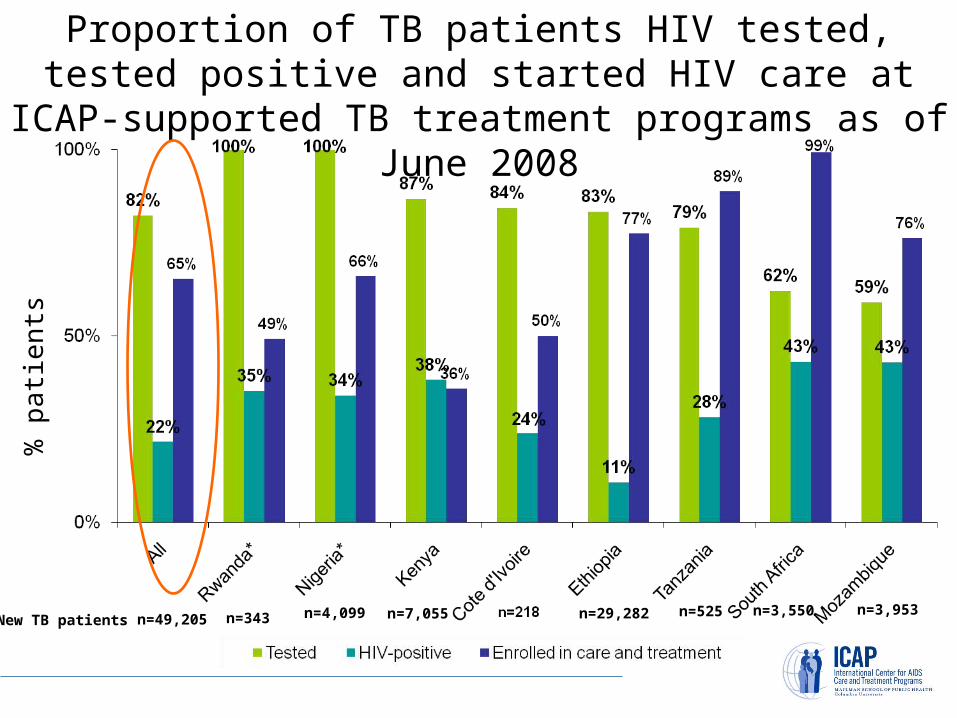
Proportion of TB patients HIV tested, tested positive and started HIV care at ICAP-supported TB treatment
programs as of June 2008
% p
atie
nts
New TB patients n=49,205 n=343 n=4,099 n=7,055 n=525n=29,282 n=3,550 n=3,953
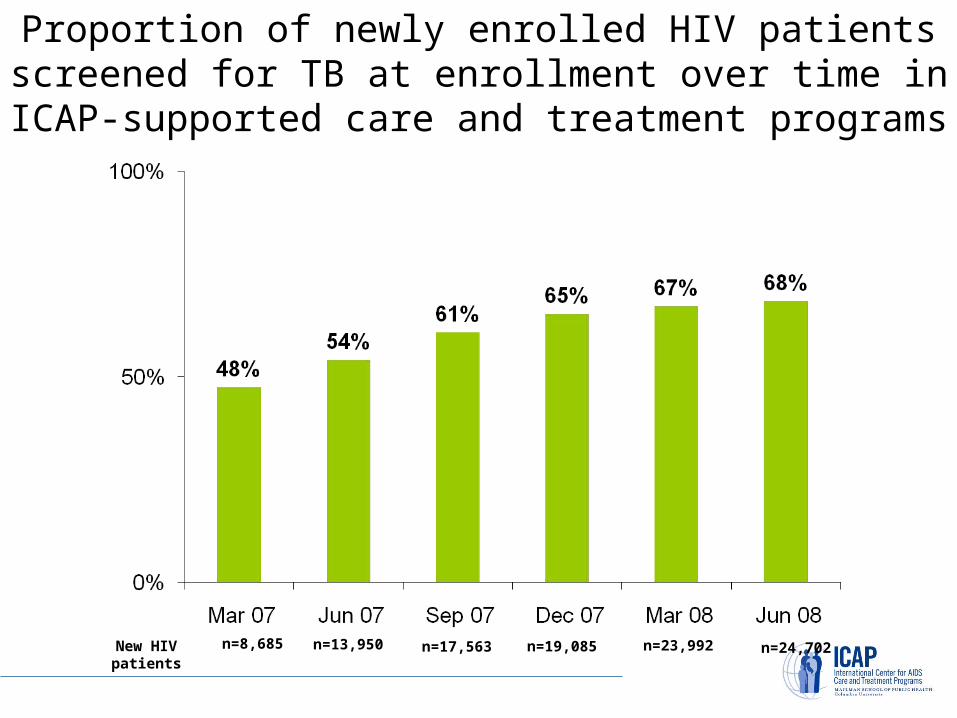
Proportion of newly enrolled HIV patients screened for TB at enrollment over time in ICAP-supported care and
treatment programs
n=8,685 n=13,950 n=17,563 n=19,085New HIV patients n=23,992 n=24,702

Proportion of new TB patients tested for HIV over time in ICAP-supported TB treatment programs
n=7,444 n=6,921 n=7,512 n=7,326New TB patients

Counseling and Testing services

Cumulative number of individuals who received counseling and testing for HIV at ICAP-supported
HIV care and treatment programs, as of June 2008


