20
April 2004
April 2004

2
ICARTT Surface Networks Locations and Measurements
The surface networks available for ICARTT will consist of permanent research and operational networks and temporary research networks that will be installed for the 2004 summer intensive. The combined measurements from these networks will provide an unprecedented characterization of key physical processes in the atmosphere over land and ocean and along the underlying surface. The networks will consist of in situ and remote sensors for measuring air chemistry and meteorology. The ICARTT Surface Networks Working Group is putting together a web site that will allow scientists to view the locations of available surface networks. We need your help by providing us with information about your surface network (please send information to [email protected]). A template is enclosed along with examples from some of the research groups that will operate surface networks during the summer intensive. While individual web sites are listed here for access to information about surface networks and/or real-time data, we plan to have links to all of these sites from a single web site hosted by NOAA’s Aeronomy Laboratory.

3
Template
Surface Network Name
Project name and link if available:
Network map and/or table with instrumented site locations here
Research areas:
Deployment period: (i.e., permanent or deployment period)
Measurements table with information about instruments, sampling, and PI’s
Additional information and/or real-time data link if available

4
Surface Network:
Operated by the University of New Hampshire (R. Talbot, PI).
Web Link: http://www.airmap.unh.edu/
Real-Time Data Link: http://www.airmap.unh.edu/data/data.html?site=AIRMAPTF
Deployment period: Since spring 2001 and ongoing.

5
Measurements at the AIRMAP sites.
6
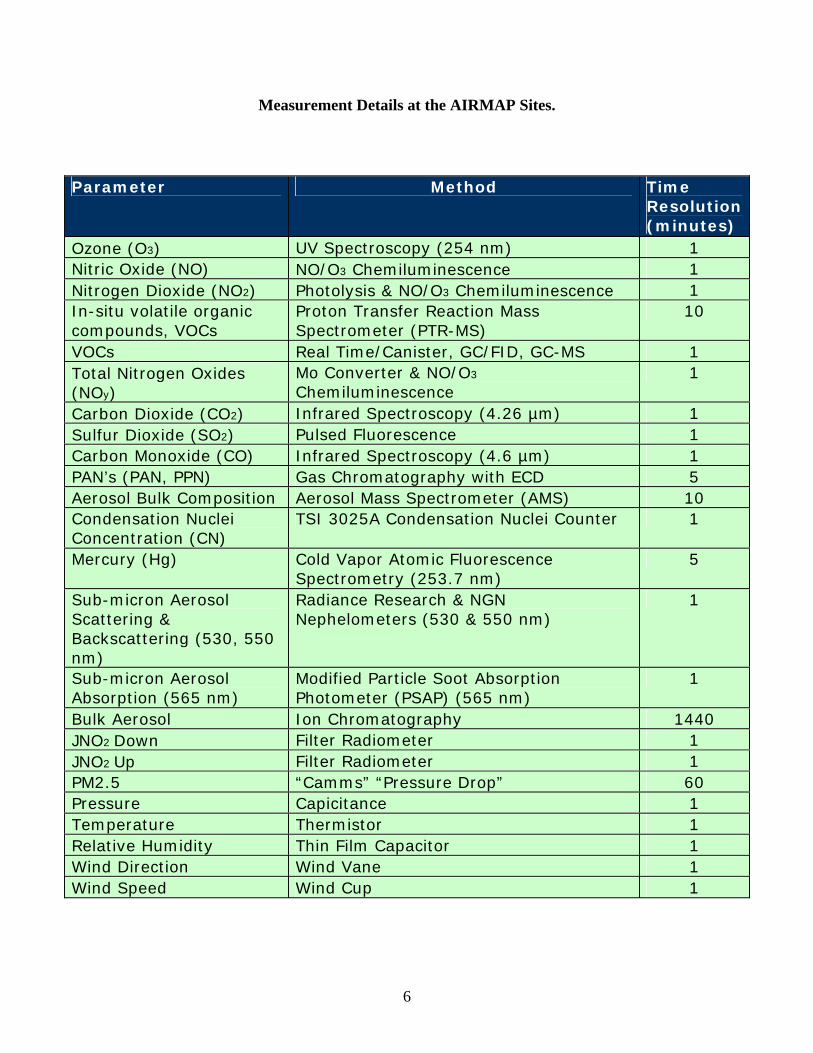
Measurement Details at the AIRMAP Sites.
Parameter Method Time
Resolution (minutes)
Ozone (O3) UV Spectroscopy (254 nm) 1 Nitric Oxide (NO) NO/O3 Chemiluminescence 1 Nitrogen Dioxide (NO2) Photolysis & NO/O3 Chemiluminescence 1 In-situ volatile organic compounds, VOCs
Proton Transfer Reaction Mass Spectrometer (PTR-MS)
10
VOCs Real Time/Canister, GC/FID, GC-MS 1 Total Nitrogen Oxides (NOy)
Mo Converter & NO/O3
Chemiluminescence 1
Carbon Dioxide (CO2) Infrared Spectroscopy (4.26 µm) 1 Sulfur Dioxide (SO2) Pulsed Fluorescence 1 Carbon Monoxide (CO) Infrared Spectroscopy (4.6 µm) 1 PAN’s (PAN, PPN) Gas Chromatography with ECD 5 Aerosol Bulk Composition Aerosol Mass Spectrometer (AMS) 10 Condensation Nuclei Concentration (CN)
TSI 3025A Condensation Nuclei Counter 1
Mercury (Hg) Cold Vapor Atomic Fluorescence Spectrometry (253.7 nm)
5
Sub-micron Aerosol Scattering & Backscattering (530, 550 nm)
Radiance Research & NGN Nephelometers (530 & 550 nm)
1
Sub-micron Aerosol Absorption (565 nm)
Modified Particle Soot Absorption Photometer (PSAP) (565 nm)
1
Bulk Aerosol Ion Chromatography 1440 JNO2 Down Filter Radiometer 1 JNO2 Up Filter Radiometer 1 PM2.5 “Camms” “Pressure Drop” 60 Pressure Capicitance 1 Temperature Thermistor 1 Relative Humidity Thin Film Capacitor 1 Wind Direction Wind Vane 1 Wind Speed Wind Cup 1

7
Portland
Schenectady
Plymouth
Appledore Is.Pease
Bar Harbor
Concord
Stow
New Brunswick
Ft. Meade
Pittsburgh
Richmond
Lunenburg Bay
R/V Brown
NOAA/DOE profilersOther agency profilers
NEAQS/ITCT - 2004
State College
Chebogue
Regional Air QualityIntercontinental TransportAerosol Direct and Indirect Effects
Montreal
Egbert
Indiana
Storrs
Integrated Boundary-layer Wind Profiler Observing Network
Project: NEAQS-ITCT 2004 (http://www.al.noaa.gov/2004/)
Research areas:
• Transport and mixing o What are the main transport corridors that bring transported air pollution into
the Northeastern U.S.? o How are the continental and marine boundary layers linked and how does this
coupling affect the vertical distribution of pollution transported over the ocean? o Where and when is the sea-breeze/land-breeze circulation important?
• Forecast models o How well do operational and research models used for weather and air quality
prediction reproduce the observed meteorology (diagnostic and operational evaluation)?
o What improvements in model design and/or operation are needed to significantly improve forecast skill?
Deployment period: July 1 – September 30, 2004

8
Measurements:
Parameter Method Sampling Resolution (space and time)
PIs
Wind profile 915-MHz Doppler wind profiler
60 or 100 m vertical resolution, hourly
NOAA (ETL, AL, FSL), DOE, Cooperative Agencies
Temperature profile
Radio Acoustic Sounding System (RASS)
100 m, hourly ETL, AL, FSL, DOE Cooperative Agencies
Surface wind RM Young wind monitor
@10 m, 2 min. ETL
Pressure Vaisala analog pressure probe
@1 m, 2 min. ETL
Temp., r.h. Vaisala HMP45C @2 m, 2 min. ETL Solar radiation Kipp & Zonen
pyranometer @2 m, 2 min. ETL
Net radiation REBS net radiometer @2 m, 2 min. ETL Rainfall Texas Electronics
tipping bucket @1 m, 2 min. ETL
Real-time data link: http://www.etl.noaa.gov/et7/data/

9
Monitors Operated by the University of New Hampshire
Note: The monitor shown for Lebanon is proposed to be moved from the curr ent Haverhill
location in 2004. The VOC's shown for Portsmouth are currently measured in Kittery, ME.
10
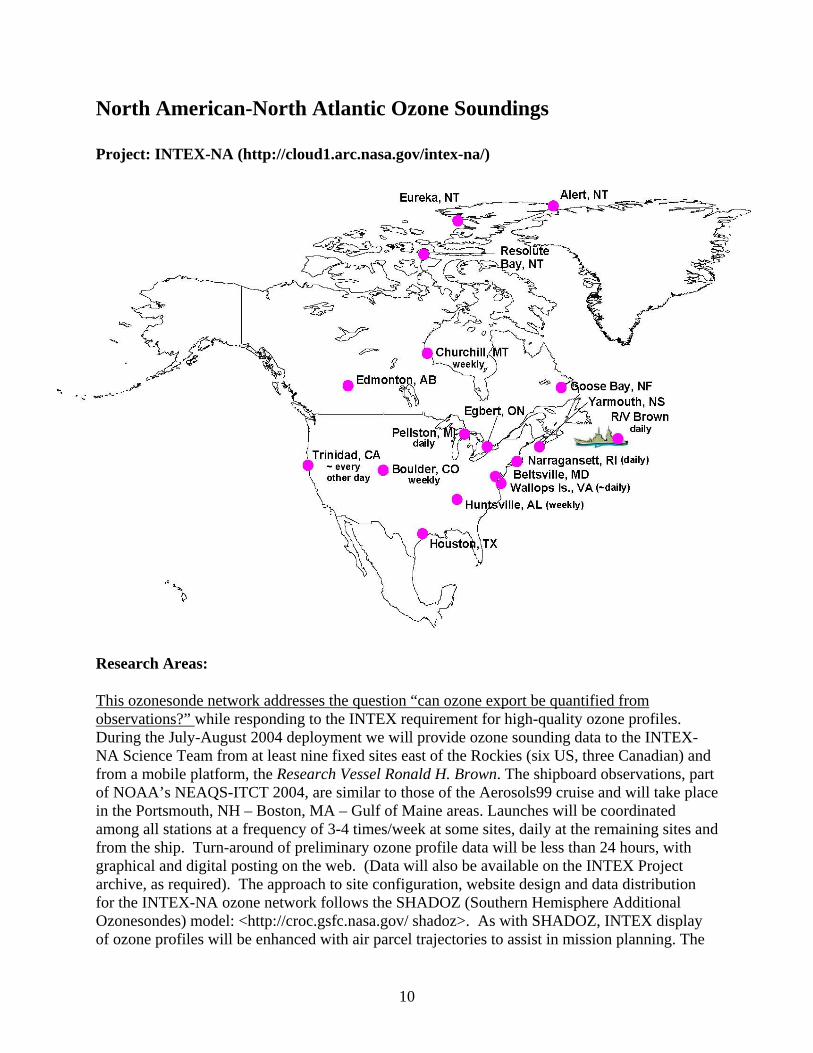
North American-North Atlantic Ozone Soundings Project: INTEX-NA (http://cloud1.arc.nasa.gov/intex-na/)
Research Areas:
This ozonesonde network addresses the question “can ozone export be quantified from observations?” while responding to the INTEX requirement for high-quality ozone profiles. During the July-August 2004 deployment we will provide ozone sounding data to the INTEX-NA Science Team from at least nine fixed sites east of the Rockies (six US, three Canadian) and from a mobile platform, the Research Vessel Ronald H. Brown. The shipboard observations, part of NOAA’s NEAQS-ITCT 2004, are similar to those of the Aerosols99 cruise and will take place in the Portsmouth, NH – Boston, MA – Gulf of Maine areas. Launches will be coordinated among all stations at a frequency of 3-4 times/week at some sites, daily at the remaining sites and from the ship. Turn-around of preliminary ozone profile data will be less than 24 hours, with graphical and digital posting on the web. (Data will also be available on the INTEX Project archive, as required). The approach to site configuration, website design and data distribution for the INTEX-NA ozone network follows the SHADOZ (Southern Hemisphere Additional Ozonesondes) model: <http://croc.gsfc.nasa.gov/ shadoz>. As with SHADOZ, INTEX display of ozone profiles will be enhanced with air parcel trajectories to assist in mission planning. The
11
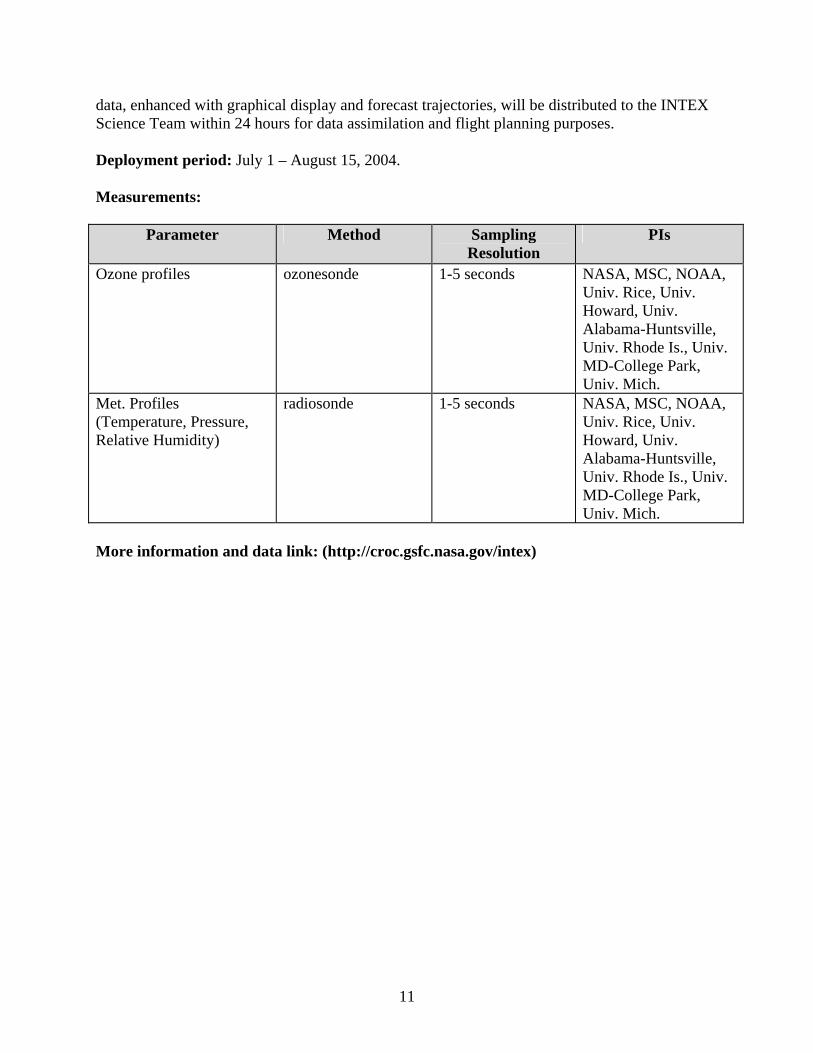
data, enhanced with graphical display and forecast trajectories, will be distributed to the INTEX Science Team within 24 hours for data assimilation and flight planning purposes. Deployment period: July 1 – August 15, 2004. Measurements:
Parameter Method Sampling Resolution
PIs
Ozone profiles ozonesonde 1-5 seconds NASA, MSC, NOAA, Univ. Rice, Univ. Howard, Univ. Alabama-Huntsville, Univ. Rhode Is., Univ. MD-College Park, Univ. Mich.
Met. Profiles (Temperature, Pressure, Relative Humidity)
radiosonde 1-5 seconds NASA, MSC, NOAA, Univ. Rice, Univ. Howard, Univ. Alabama-Huntsville, Univ. Rhode Is., Univ. MD-College Park, Univ. Mich.
More information and data link: (http://croc.gsfc.nasa.gov/intex)
12
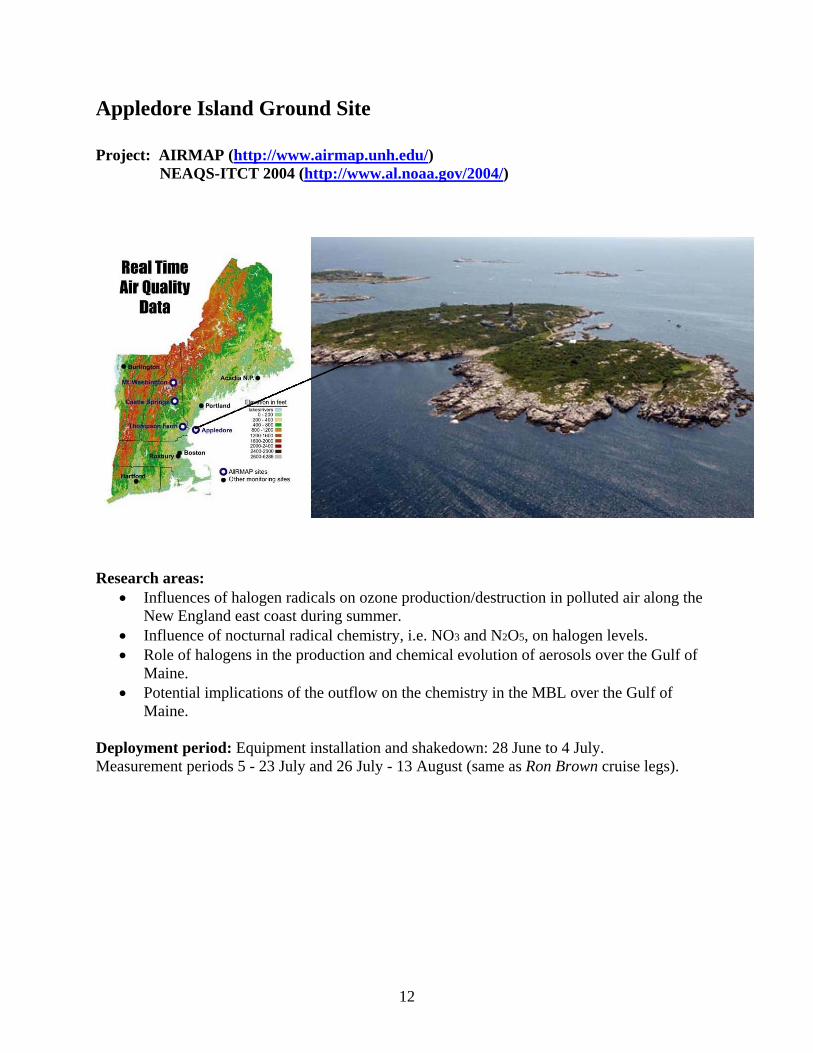
Appledore Island Ground Site
Project: AIRMAP (http://www.airmap.unh.edu/) NEAQS-ITCT 2004 (http://www.al.noaa.gov/2004/)
Research areas: • Influences of halogen radicals on ozone production/destruction in polluted air along the
New England east coast during summer. • Influence of nocturnal radical chemistry, i.e. NO3 and N2O5, on halogen levels. • Role of halogens in the production and chemical evolution of aerosols over the Gulf of
Maine. • Potential implications of the outflow on the chemistry in the MBL over the Gulf of
Maine. Deployment period: Equipment installation and shakedown: 28 June to 4 July. Measurement periods 5 - 23 July and 26 July - 13 August (same as Ron Brown cruise legs).

13
Measurements:
Parameter Method Sampling Resolution
PIs
NO2, HCHO, O3, HONO, NO3, ClO, BrO, OIO, IO
MAX-DOAS UCLA
HCl, reactive inorganic Cl gases (Cl2, HOCl etc.), SO2, HNO3, NH3, HCOOH, CH3COOH
Mist chambers UVA, UNH
Total gaseous inorganic Br and I Filter packs UVA, UNH C2-C7 hydrocarbons, halomethanes (CH3X, CH2X2, CHX3 (X = Cl, Br, I), CH2ClI, CH2BrI, CH2ClBr, CHCl2Br, CHClBr2)
GC-FID/MS UNH
Aerosol NO3 –, SO4 =, MSA–, Cl– , Br–, HCOO–, CH3COO–, C2O4 = , Na+, K+, Mg2+, Ca2+, NH4 +, total Na, Cl, Br, I
Cascade impactors and bulk filters
UNH, UVA
Particle number size distributions: ~30 nm to ~800 nm, ~0.5 µm to ~20 µm, ultrafine (>3 nm)
DMA APS CN
UCSD-SIO
O3, CO Modified TECO UNH NO B. Ridley, NCAR UNH Photolysis frequencies spectroradiometer UCLA Wind profile 915-MHz Doppler
wind profiler 60 or 100 m vertical resolution, hourly
NOAA ETL
Temperature profile Radio Acoustic Sounding System
100 m, hourly ETL
Surface wind RM Young wind monitor
@10 m, 2 min. ETL
Pressure Vaisala analog pressure probe
@1 m, 2 min. ETL
Temp., r.h. Vaisala HMP45C @2 m, 2 min. ETL Solar radiation Kipp & Zonen
pyranometer @2 m, 2 min. ETL
Net radiation REBS net radiometer
@2 m, 2 min. ETL
Rainfall Texas Electronics tipping bucket
@1 m, 2 min. ETL

14
46
45
44
43
42
41
40-74 -72 -70 -68 -66
Acadia NP
Chebogue Pt.
Chebogue Point Ground Site 2004
Project: NEAQS-ITCT 2004 (http://www.al.noaa.gov/2004/)
Research areas:
• Characterization of composition of aerosols and gas-phase species transported across the Gulf of Maine
o How do aerosols, oxidants and their precursors evolve during transport from the emission sources on the eastern coast of the U.S.?
o What are the heterogeneous and homogeneous mechanisms responsible for this evolution?
o Is there evidence for a significant role played by fog in aerosol and /or gas-phase species processing?
o What can we say regarding the sources of these species (anthropogenic vs. biogenic, tests on emission inventories, etc.)?
• Transport and mixing o Characterization of transport above the marine boundary layer. How prevalent
are elevated layers of transported emissions? o How well do models capture these transport layers?
Deployment period: July 1 – August 15
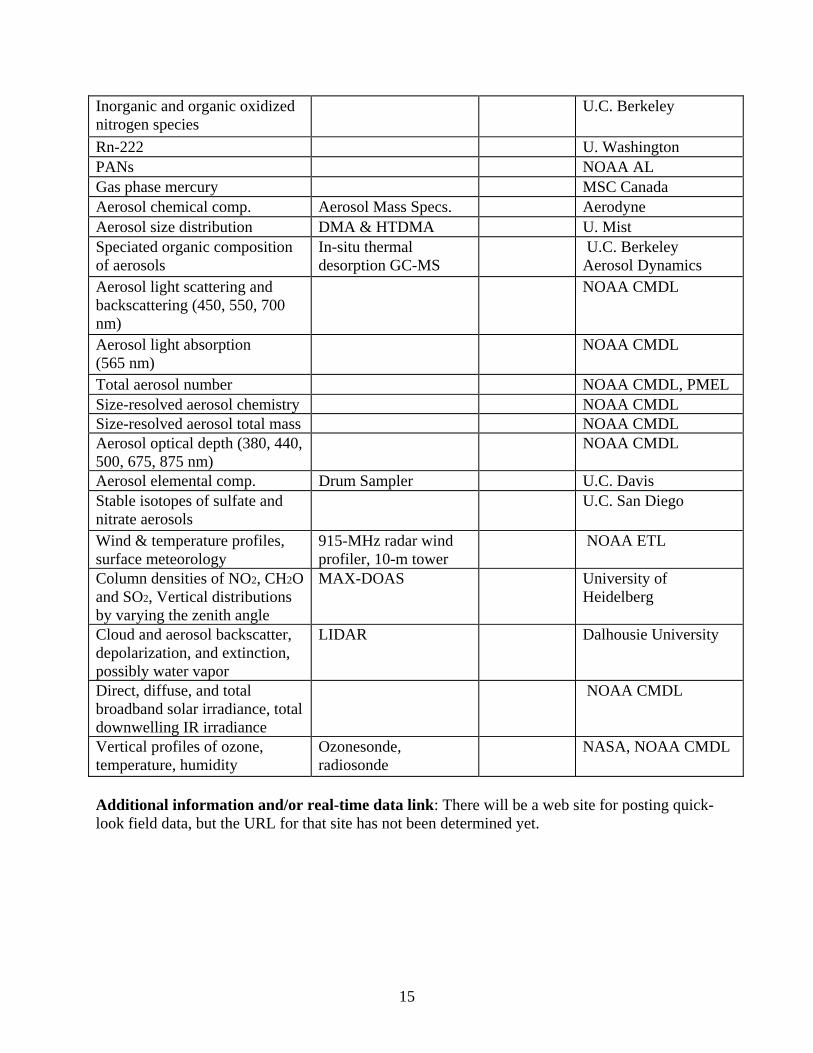
Measurements:
Parameter Method Sampling Resolution
PIs
VOCs GC/FID/MS U.C. Berkeley OVOCs PTR/MS U.C. Berkeley CO, CO2, H2O, O3, met. U.C. Berkeley
15
Inorganic and organic oxidized nitrogen species
U.C. Berkeley
Rn-222 U. Washington PANs NOAA AL Gas phase mercury MSC Canada Aerosol chemical comp. Aerosol Mass Specs. Aerodyne Aerosol size distribution DMA & HTDMA U. Mist Speciated organic composition of aerosols
In-situ thermal desorption GC-MS
U.C. Berkeley Aerosol Dynamics
Aerosol light scattering and backscattering (450, 550, 700 nm)
NOAA CMDL
Aerosol light absorption (565 nm)
NOAA CMDL
Total aerosol number NOAA CMDL, PMEL Size-resolved aerosol chemistry NOAA CMDL Size-resolved aerosol total mass NOAA CMDL Aerosol optical depth (380, 440, 500, 675, 875 nm)
NOAA CMDL
Aerosol elemental comp. Drum Sampler U.C. Davis Stable isotopes of sulfate and nitrate aerosols
U.C. San Diego
Wind & temperature profiles, surface meteorology
915-MHz radar wind profiler, 10-m tower
NOAA ETL
Column densities of NO2, CH2O and SO2, Vertical distributions by varying the zenith angle
MAX-DOAS University of Heidelberg
Cloud and aerosol backscatter, depolarization, and extinction, possibly water vapor
LIDAR Dalhousie University
Direct, diffuse, and total broadband solar irradiance, total downwelling IR irradiance
NOAA CMDL
Vertical profiles of ozone, temperature, humidity
Ozonesonde, radiosonde
NASA, NOAA CMDL
Additional information and/or real-time data link: There will be a web site for posting quick-look field data, but the URL for that site has not been determined yet.

16
Harvard Forest Flux Tower Site
Project: Harvard Forest Environmental Measurements Site (http://www-as.harvard.edu/chemistry/hf/index.html)
Site location: The 30-m tower is located at 42.537755 N latitude, 72.171478 W, longitude and 340m (ASL) elevation; the walkup platform is ~130m away (42.536875 N, 72.172602 W).
Research areas: At Harvard Forest, we conduct long-term eddy-covariance measurements of atmosphere-biosphere exchange. Our system of continuous monitoring provides quantitative information, defining the sources and sinks for important atmospheric gases. By constructing long, continuous time series we can understand sources of variance and determine the factors that regulate concentrations and deposition fluxes of greenhouse gases and pollutants. At the site, measurements of Net Ecosystem Exchange (NEE) for carbon, ozone, NOy, H2O, and energy have been made continuously since 1990, along with comprehensive climatic, environmental, chemical, and ecological observations. Some specific research areas include:
• Carbon exchange • Forest management and CO2 • Nitrogen deposition • Urban pollution
Deployment: Permanent, installed 1990
Measurements:
Sensor Inlet/ instrument altitudes
Determined quantity (data rate)
ATI Sonic Anemometer 30m Three-dimensional wind velocity, temperature, momentum & heat fluxes (30 min avg)
NOy (catalyst-->NO) 30m NOy concentration and fluxes, 30-minute averages
high-speed CO2-H2O IR-Absorbance
30m CO2 and H2O) concentration and fluxes (30-min avg)
high-speed O3 C2H4 -chemiluminescence
30m Ozone flux (30-min avg)
slow CO2 IR absorbance 30,24,18,12,6, 3,1,0.05m
CO2 concentration along a vertical profile (8 levels @ 2/hr)
slow O3 UV absorbance 30,24,18,12,6, 3,1,0.05 m
O3 concentration along a vertical profile (8 levels @ 2/hr)
slow NOx (Photolysis, O3-chemiluminescence)
30,24,18,12,6, 3,1,0.05m
NO, NO2 concentration along a vertical profile (8 levels @ 2/hr)

17
Thermistor, thin-film capacitor
Temperature and relative humidity profile (5,60-min avg)
Thermistors surface (6 reps), 20cm, 50cm
soil temperatures (5,60-min avg)
PAR sensors 30,12m photosynthetically active radiation (5,60-min avg)
Net radiometer 30m net radiative heat flux (5,60-min avg) CO Gas-filter correlation IR absorbance
30m CO concentrations (4,60-min avg)
PAN GC-ECD 30m Hourly averages from 100min samples 4-Channel GC-ECD2 29m Halocarbons, N2O, CO, CH4, SF6
2Lead investigator for the 4-Channel GC is Jim Elkins, NOAA-CMDL
Data archive: http://www-as.harvard.edu/data/nigec-data.html

18
ASRC Field Station at Pinnacle State Park Project name: Atmospheric Science Research Center, Albany, NY (http://www.asrc.cestm.albany.edu)
Research areas:
• Studies of oxidant and PM formation and impact. • Site is also used for testing and evaluation of instrumentation.
Deployment: Possible deployment of “research” instrumentation at PSP for the 2004 Summer Intensive will be discussed by Ken Demerjian if he is at the planning meeting.
Measurements:
Parameter Method Sampling Resolution PIs Ozone UV Absorption 1 min DL average State University of
New York at Albany (SUNYA)-ASRC
NO, NO2, NOy Chemiluminescence 1 min DL average SUNYA-ASRC HNO3 Denuder Diff/Chemi 1 min DL average SUNYA-ASRC SO2 Pulsed Fluorescence 1 min DL average SUNYA-ASRC CO NDIR 1 min DL average SUNYA-ASRC PM2.5 TEOM 10 min running average SUNYA-ASRC PM2.5 FDMS-TEMO 12 min switched SUNYA-ASRC C1-C8+HC’s AutoGC 1 hour SUNYA-ASRC PM2.5 Filter – FRM 24 hour SUNYA-ASRC PM2.5-species Filter – STN 24 hour – every 3rd day SUNYA-ASRC PM2.5-species Filter – IMPROVE 24 hour – every 3rd day SUNYA-ASRC PM2.5-species Filter – ACCU 24 hour – daily SUNYA-ASRC Wind speed, wind direction
Cup anemometer 1 min DL average SUNYA-ASRC
Temperature, RH Thermistor/Humicap 1 min DL average SUNYA-ASRC BP Capacitance Man 1 min DL average SUNYA-ASRC Rainfall Tipping bucket 1 min DL average SUNYA-ASRC

19
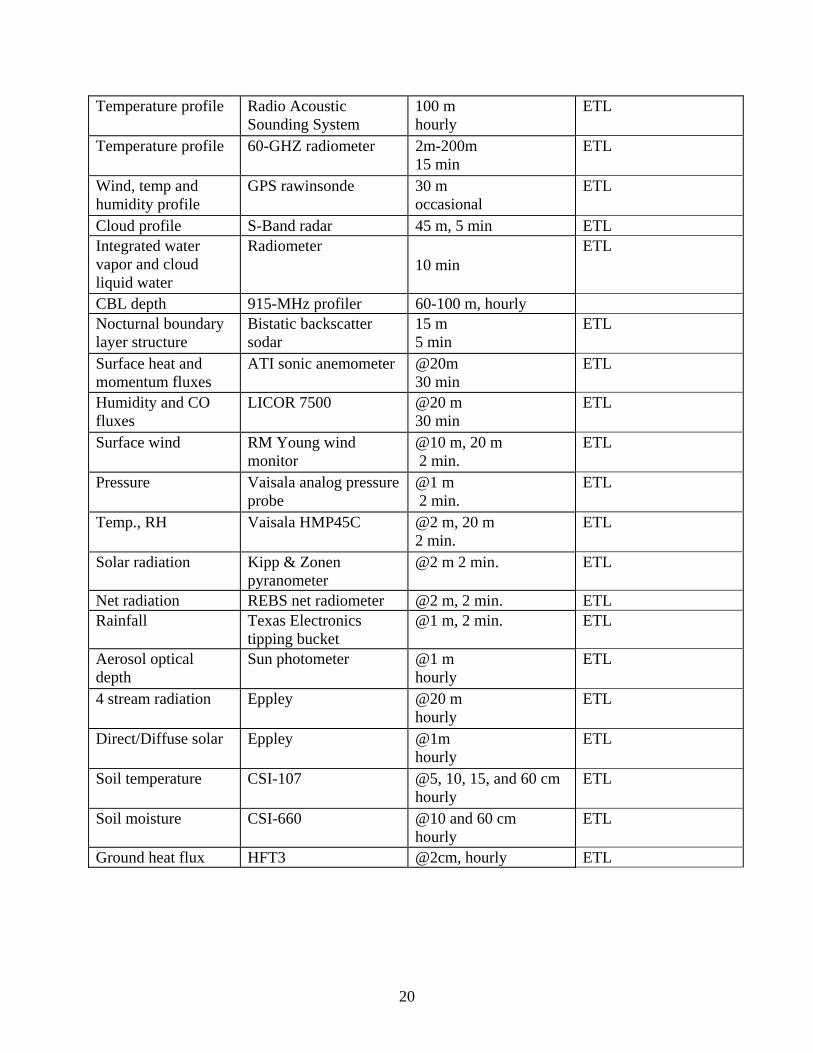
Boundary-layer and Surface Energy Site at Plymouth, MA
Project: New England High Resolution Temperature Program (http://www.etl.noaa.gov/programs/2003/nehrtp/)
Site will be located at the northern edge of a uniform forested region south of the Plymouth Regional Airport in Plymouth, MA (41.91 N, 70.73 W, 46 m elev.). Research areas:
• Boundary Layer Processes o What are the important meteorological factors that influence transport and
mixing in the coastal zone? o How large are the feedbacks of aerosols on radiation and boundary layer
structure? • Forecast Model Assessment
o How well do operational and research models used for weather and air quality prediction reproduce the observed boundary layer structure, clouds fields, and radiation?
o What improvements in model physics are needed to significantly improve model forecast skill of meteorological parameters that are crucial for air quality prediction?
Deployment period: July 1 – September 30, 2004 (some instrumentation will remain after the 2004 Summer Intensive). Measurements:
Parameter Method Sampling Resolution (space and time)
PIs
Wind profile 915-MHz Doppler wind profiler
60-100 m hourly
NOAA ETL
20
Temperature profile Radio Acoustic Sounding System
100 m hourly
ETL
Temperature profile 60-GHZ radiometer 2m-200m 15 min
ETL
Wind, temp and humidity profile
GPS rawinsonde 30 m occasional
ETL
Cloud profile S-Band radar 45 m, 5 min ETL Integrated water vapor and cloud liquid water
Radiometer 10 min
ETL
CBL depth 915-MHz profiler 60-100 m, hourly Nocturnal boundary layer structure
Bistatic backscatter sodar
15 m 5 min
ETL
Surface heat and momentum fluxes
ATI sonic anemometer @20m 30 min
ETL
Humidity and CO fluxes
LICOR 7500 @20 m 30 min
ETL
Surface wind RM Young wind monitor
@10 m, 20 m 2 min.
ETL
Pressure Vaisala analog pressure probe
@1 m 2 min.
ETL
Temp., RH Vaisala HMP45C @2 m, 20 m 2 min.
ETL
Solar radiation Kipp & Zonen pyranometer
@2 m 2 min. ETL
Net radiation REBS net radiometer @2 m, 2 min. ETL Rainfall Texas Electronics
tipping bucket @1 m, 2 min. ETL
Aerosol optical depth
Sun photometer @1 m hourly
ETL
4 stream radiation Eppley @20 m hourly
ETL
Direct/Diffuse solar Eppley @1m hourly
ETL
Soil temperature CSI-107 @5, 10, 15, and 60 cm hourly
ETL
Soil moisture CSI-660 @10 and 60 cm hourly
ETL
Ground heat flux HFT3 @2cm, hourly ETL


