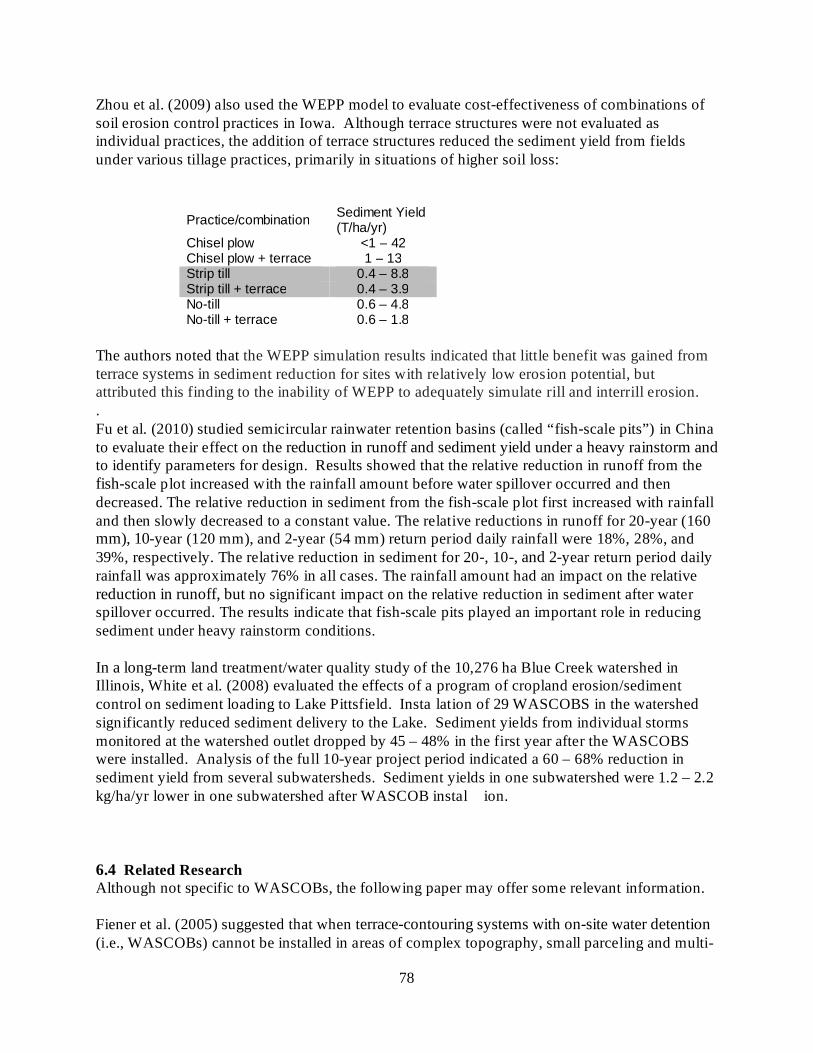
1 For Vermont State Office USDA -NRCS Prepared by June 29 , 2011 CONTENTS : 1.0 Introduction………………………………………….…..2 2.0 Soil Aeration for Manure Incorporation…………………3 3.0 Cover Cropping ………………………………………..10 4.0 Reduced Tillage and Manure Incorporation……………23 5.0 Grassed Waterways…………………………………….35 6.0 Water and Sediment Control Basins………………...…75 7.0 Tile Drainage……………………………………….…..81 8.0 Nutrient Management…………………………………..91 9.0 Conclusions……………………………………………109 Literature Review of Selected Agricultural BMPs Don Meals 84 Caroline St. Burlington, VT 05401 Ice.N ine Environmental Consulting
Transcript
1
For
Vermont State OfficeUSDA-NRCS
Prepared by
June 29, 2011
CONTENTS:
1.0 Introduction………………………………………….…..22.0 Soil Aeration for Manure Incorporation…………………33.0 Cover Cropping ………………………………………..104.0 Reduced Tillage and Manure Incorporation……………235.0 Grassed Waterways…………………………………….356.0 Water and Sediment Control Basins………………...…757.0 Tile Drainage……………………………………….…..818.0 Nutrient Management…………………………………..919.0 Conclusions……………………………………………109
Literature Review of Selected Agricultural BMPs
Don Meals
84 Caroline St. Burlington, VT 05401Ice.N ine Environmental Consulting
2
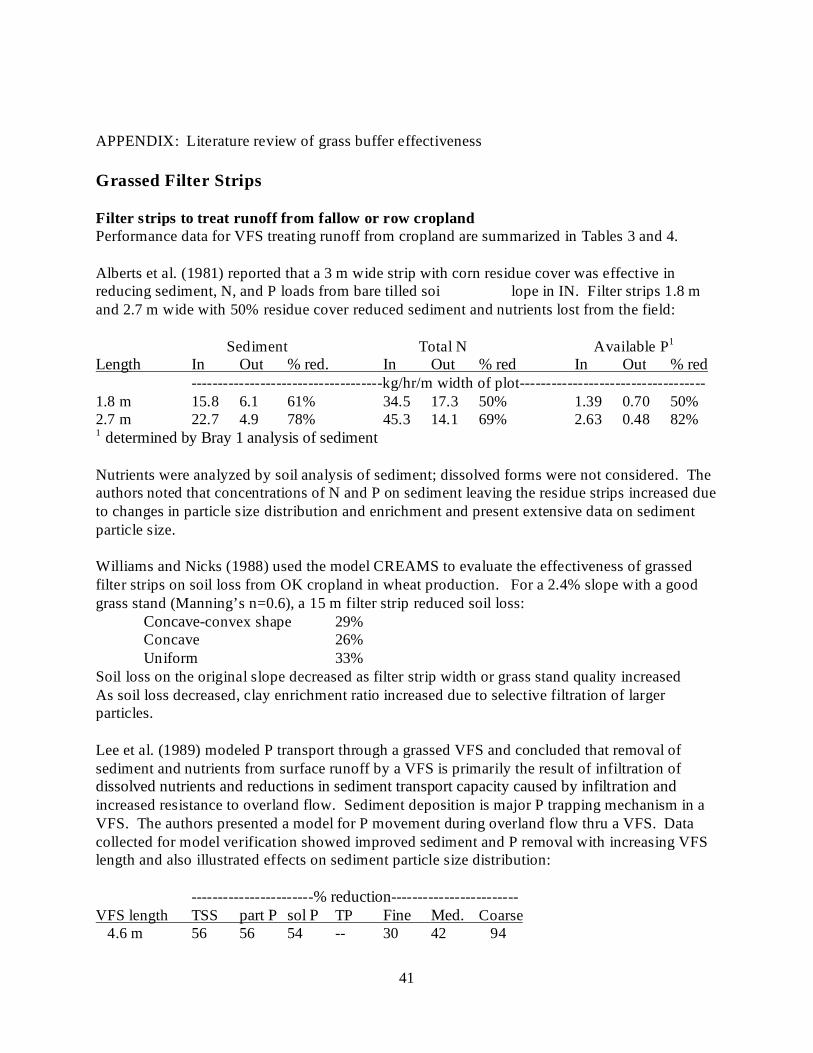
The purpose of this review is to briefly summarize the published scientific literature concerning the effectiveness of selected management practices on reducing phosphorus (P) and sediment losses from agricultural land. The focus is on agricultural land in the Lake Champlain Basin (LCB); consequently results of research conducted in very different climates or agricultural settings have generally been excluded. Most work dealing exclusively with poultry litter or grain crops, for example, is not included. However, because few reports exist on some topics, some data have been included that may be only indirectly applicable to the LCB, e.g., on swine waste or corn-soybean rotations. It is important to note that much of the work reported –especially for reduced tillage and manure incorporation – has been done in plot studies with simulated rainfall. Results from this scale may not always translate directly to the field or watershed scale.
Furthermore, in some cases, a broad view was taken and data included on aspects of some practices not defined in the original scope. Nutrient management, for example, was reviewed not only for its effect on soil test P but also for its ef iveness on P loss in runoff; broad aspects of nutrient management – including soil and manure treatment and fertilizer form – were also considered. For grassed waterways, considerable literature on vegetated filter strip performance has been included because it touches on processes related to the functions of grassed waterways.
Finally, note that, where possible, the original publications cited iew have been assembled and provided as a supplement to this narrative. In some cases, however, publications were found only as abstracts or were published in journals not readily available in electronic form. Such publications are not included in full.
1.0 Introduction
3
Mechanical aeration partially disturbs the soil surface of grassland without impairing forage productivity. Several types of aeration implements have been used to disturb or puncture the soil surface in grasslands. Types of aeration created by these implements may include slit aeration by tines, disk aeration using no-till drills, or core aeration by cylindrical cores. When aeration is done prior to liquid manure application, all of these methods accomplish some level of manure incorporation by promoting infiltration or storage in micro-depressions. Previously, mechanical soil aeration in grassland has been used primarily to relieve surface compaction, to improve forage stand health, and to allow some level of manure incorporation, reducing odors and ammonia volatilization. Recently, aeration of grassland has been encouraged as a water quality measure, to allow for more P adsorption to soil, increase infiltration by breaking the soil surface, and slow runoff flow by increasing the roughness of the landscape.
Most of the research on the water quality effects of soil aeration has been conducted on poultry litter and in the southeastern U.S. and in western Canada. There is little published research that is directly applicable to dairy farming and hayland in the LCB.
In a literature review, Maguire and McGrath (2009) concluded that manure injection holds promise as a technology that can help improve manure management for improved water quality, but noted that injection systems that placed all of the manure below the soil surface performed better than surface application of manure, aerators and tillage with respect to reducing nutrients lost in runoff.
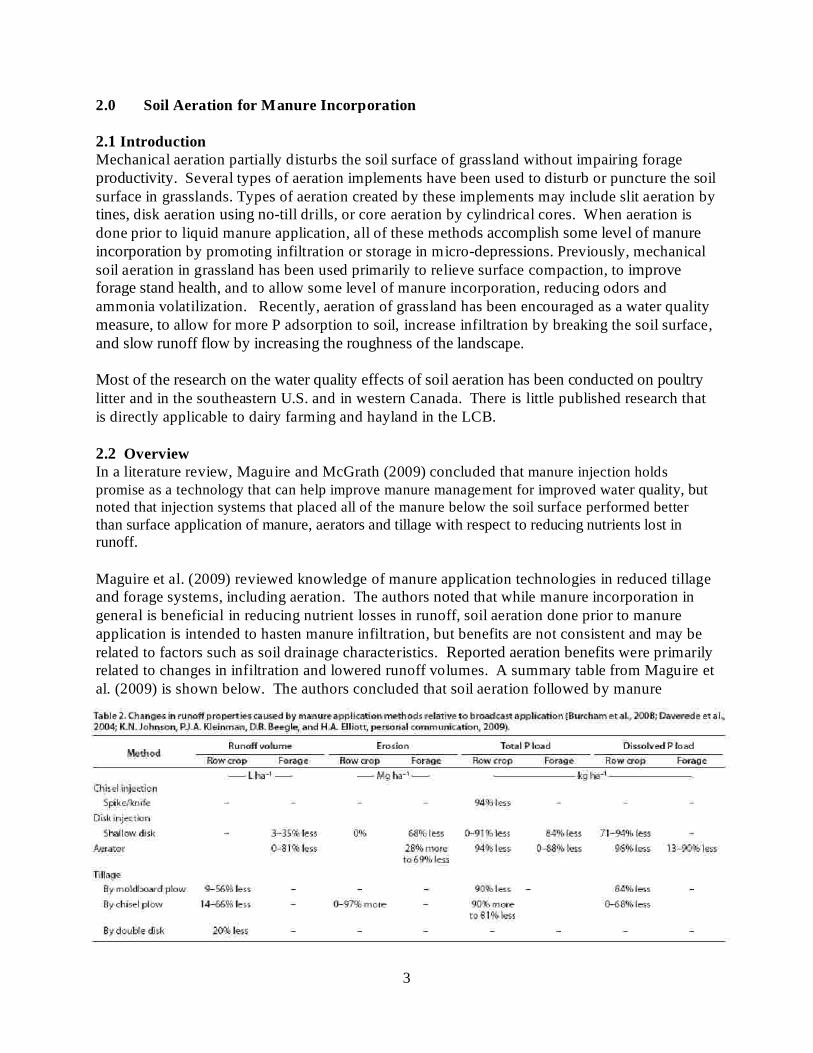
Maguire et al. (2009) reviewed knowledge of manure application technologies in reduced tillage and forage systems, including aeration. The authors noted that while manure incorporation in general is beneficial in reducing nutrient losses in runoff, soil aeration done prior to manure application is intended to hasten manure infiltration, but benefits are not consistent and may be related to factors such as soil drainage characteristics. Reported aeration benefits were primarily related to changes in infiltration and lowered runoff volumes. A summary table from Maguire et al. (2009) is shown below. The authors concluded that soil aeration followed by manure
2.0 Soil Aeration for Manure Incorporation
2.1 Introduction
2.2 Overview
4
application does not consistently decrease ammonia volatilization or nutrient losses in runoff. Though a range of aeration equipment is available, there are too few studies to identify when aeration may work and when there will be no benefit.
In North Carolina, Shah et al. (2004) evaluated the runoff and agronomic impacts of mechanical aeration and liquid dairy manure application to grassland (orchard grass with 10% to 20% alfalfa) in plot studies with simulated and natural rainfall. The four treatments applied to the plots were control (CTL, no aeration and no manure), aeration (AER), manure application but no aeration (MAN), and aeration plus manure application (AER+MAN). The plots were harvested three times, and crop yields and crop nutrient (N-P-K) contents were determined. Aeration impact on soil impedance was evaluated with a penetrometer. In one simulated event, AER+MAN significantly reduced runoff, while the other treatments were comparable. Nutrient concentrations in simulated runoff increased with manure application but were unaffected by aeration alone. Aeration reduced nutrient loadings of three or more species (not TKN) from manured plots in two of six simulated runoff events but not from non-manured plots. Aeration of manured plots was more effective in reducing DRP losses than other nutrient species. Mean total loadings of all nutrient species in simulated runoff were reduced >26% by AER+MAN vs. MAN. While aeration significantly increased TSS concentrations in simulated runoff, manureapplication did not. In one of six simulated events, AER had the highest TSS loadings, while AER+MAN had the lowest, with the two other treatments in between. No treatment effects were observed with natural runoff for any constituent. The MAN treatment significantly increased forage yield in two harvests vs. CTL and AER and in one harvest vs. AER+MAN. Compared with MAN, total forage yields with CTL, AER, and AER+MAN were 78%, 7%, and 81%, respectively. Aeration reduced soil impedance and could improve root penetration in compacted soils.
Harrigan et al. (2006) evaluated a low-disturbance, rolling-tine aerator coupled with a dribble-bar manure slurry distribution system for effects on crop residue cover, manure surface exposure, post-application manure nutrient uniformity, and concentration of total suspended solids in runoff from wheat stubble on a sandy loam soil in Michigan. The aeration process decreased soil bulk density and increased the initial water infiltrat ith little loss of crop residue cover. Aeration tillage increased surface roughness and created depressions at regular intervals in the tine path that accumulated manure slurry and reduced overland flow. The greatest soil phosphorus concentration was in the surface to 7.6-cm soil layer at the point of tillage tine entry, and little of the manure slurry moved below that depth within 48 h of application. The concentration of total suspended solids in the runoff increased as tillage intensity increased.
Butler et al. (2008) examined mechanical aeration of grasslands for reducing P transport by increasing infiltration of rainfall and binding of P with soil minerals in Georgia. The effects of three aeration treatments and a control (aeration with cores, continuous-furrow "no-till" disk aeration perpendicular to the slope, slit aeration with tines, and no aeration treatment) on the export of total suspended solids, total Kjeldahl P (TKP), total dissolved P (TDP), dissolved reactive P (DRP), and bioavailable P (BAP) in runoff from grasslands with three manure treatments (broiler litter, dairy slurry and no manure) were examined before and after simulated
2.3 Dairy manure
5
compaction by cattle. Plots (0.75 x 2 in) were established with mixed tall fescue-bermudagrass vegetation on 8 to 12% slopes. Manures were applied at a target rate of 30 kg P/ha, and simulated rainfall was applied at a rate of 85 mm/h. Although the impact of aeration type on P export varied before and after simulated compaction, overall results indicated that core aeration has the greatest potential for reducing P losses. Export of TKP was reduced by 55%, TDP by 62%, DRP by 61 %, total BAP by 54%, and dissolved BAP by 57% on core-aerated plots with applied broiler litter as compared with the control (P < 0.05). Core and no-till disk aeration also showed potential for reducing P export from applied dairy slurry (p < 0. 10).
In British Columbia, Canada, van Vliet et al. (2006) evaluated the effect of mechanically aerating grassland before liquid manure application in the fall on surface runoff and transport of nutrients and solids was studied in a high rainfall area The two treatments were control and aeration, the latter receiving one pass with an aerator perpendicular to the slope before fall application of liquid manure (dairy in Years 1-3 and swine in Year 4). Treatments were randomly assigned on 3 to 5% sloping land with a silt l. Runoff from natural rainfall events was sampled for nutrient and solids analysis. Aeration significantly reduced runoff and loads of suspended solids, total Kjeldahl N (TKN), and dissolved reactive P in all years. Annual runoff amounts were reduced by 47 to 81%, suspended and volatile solid loads by 48 to 69% and 42 to 83%, respectively, TKN loads by 56 to 81%, and total P (TP) loads by 25 to 75%. Loads of the soluble nutrient NH4-N, dissolved reactive P, and K were reduced by 41 to 83%. The first three runoff events after manure application accounted for approximately one-third of the annual total runoff and solid and nutrient loads when averaged across treatments, with loads of TKN, K, and NH4-N totaling 4.4, 3.3, and 1.9 kg/ha, respectively. Aeration slightly increased downward movement of NO3-N, but not other nutrients in the soil. The authors concluded that mechanical aeration can be an effective tool for reducing runoff and loads of solids and nutrients after surface application of liquid manure on sloping grassland.
Curran Cournane et al. (2011) hypothesized that soil aeration would significantly decrease the volume of surface runoff and consequent losses of P and SS compared with non-aerated soil (control) in cattle-grazed pasture on a poorly structured silt-loam soil in New Zealand. Hydrologically isolated plots were installed in aerated and control plots to collect surface runoff following irrigation or rainfall and analysed for P and SS losses for 1 year. Soil physicalproperties [% macroporosity, bulk density, saturated hydraulic conductivity (Ksat) and unsaturated hydraulic conductivity (Kunsat at )1kPa)] were measured in the aerated and control treatments and taken before each irrigation event (n = 12). Six months after mechanical aeration was employed, but before cattle grazing commenced, no significant differences in soil physical quality were found between aerated and control treatments, with the exception of a minor increase in Kunsat for the control plots. This lack of treatment difference continued after grazing and was largely attributed to the re-settling of the poorly structured and dispersive soil. Flow-weighted mean concentrations and annual loads of dissolved reactive P (DRP) on the mechanically aerated soil (2.24 kg DRP/ ha) were approximately double those from the control treatment (1.20 kg DRP/ ha). However, no significant differences were observed between treatments for surface runoff volumes and losses of total P and total SS, which may reflect the similar soil physical conditions exhibited between treatments throughout most of the trial. Asobserved elsewhere, time (days) since grazing or ferti izer application was found to influence P and / or SS losses. We conclude that aeration did not decrease P and SS losses. Any changes in
6
soil physical properties such as macroporosity were short-lived and therefore unlikely to influence surface runoff and subsequent P and SS losses for this soil type.
Franklin et al. (2011) synthesized varied results of studies of the impact of soil aeration on runoff P losses from grassland at plot to field-scales in Georgia to evaluate which soil and environmental conditions most influence the success of mechanical aeration of grasslands. All studies were performed to determine the impact of aeration on runoff volume and P losses in runoff from tall fescue–bermudagrass grasslands fertilized with P. Small-scale rainfall simulations were conducted on two soil taxa using three types of aeration implements: spikes, disks, and cores. The field scale study was conducted on four soil taxa with slit and knife aeration. Small plot studies showed that core aeration reduced loads of total P and dissolved reactive P (DRP) in runoff from plots fertilized with broiler litter and that aeration was effective in reducing P export when it increased soil P in the upper 5 cm. Core aeration reduced TP (46%) and DRP ( 62%) from plots fertilized with broiler litter. Core aeration lost significantly less dissolved P fractions (TDP and DRP) than no aeration, slit or no-till aeration.
In field-scale studies, the effect of aeration on runoff volume varied depending on soil drainage class. On a field with predominantly well-drained soils, aeration significantly reduced runoff losses and DRP losses by 35%. However, on a field with predominantly somewhat poorly drained soils, soil aeration significantly increased runoff volume and P losses. In plot-scale studies, total P and DRP export responded differently to aeration implements depending on manure type and compaction. When dairy slurry was applied before soil was compacted, aeration did not have any effect on DRP and total P loads. However, after compaction, both core aeration and disk aeration reduced P export by 52 to 58% compared with no aeration.
These studies show that the overall effectiveness of mechanical soil aeration on runoff volume and P losses is controlled by the interaction of soil characteristics such as internal drainage and compaction, soil P, type of surface applied manure, and type of aeration implement. Overall results indicate that aeration of compacted grasslands receiving liquid manure can be expected to reduce loads of P in surface runoff. Soil characteristics such as internal drainage, depth and position of the BC horizon, and compaction are likely to interact with aeration implement and type of manure applied on the grassland surface to determine the overall effectiveness of aeration on runoff volume and P losses.
Franklin et al. (2006) evaluated the effects of fertilizer source and soil aeration on the volume and quality of runoff from grassed plots in Georgia. Two fertilizer sources (inorganic fertilizer [IF] and broiler litter [BL]) and two aeration treatments (aerated and nonaerated) were factorially combined to generate four experimental treatments. Broiler litter was applied at 1765 kg dry matter/ha and IF was applied to match nutrient rates applied with BL (36 kg available N/ha, 39 kg P/ha, 60 kg K/ha). Simulated rainfall was applied immediately after fertilizer application and 1 mo later. Runoff samples were analyzed for dissolved reactive phosphorus (DRP), total Kjeldahl phosphorus (TKP), and ammonium (NH4-N). In the first runoff event, plots fertilized with IF lost more TKP than plots fertilized with BL (3.4 vs. 1.1 kg P/ha). In contrast, plots fertilized with BL lost more NH4-N than plots fertilized with IF (1.4 vs. 0.6 kg N/ha). These
2.4 Other manure/fertilizer
7
results support the use of different weighting factors for BL and IF when assessing their potential for contaminating surface runoff. Aeration numerically reduced runoff volume by 27%, though not significantly, in the first runoff event ( = 0.16), but did not affect runoff volume 1 monthlater. Aeration did not affect the mass losses of DRP, TKN, and NH4-N. These results indicate that aeration on these soils would not he expected to significantly affect the volume and quality of surface runoff.
Franklin et al. (2007) conducted a study to determine the impact of slit aeration on runoff volume and P losses in runoff from fescue/bermudagrass hay fields fertilized with broiler litter. at the field scale, using a paired watershed approach. Three pairs of 0.8-ha fields, each with similar soils were fertilized with broiler litter and monitored under similar management from 1995 through 1998, then one field in each pair received aeration treatment from 2001 through 2003. In the field with mostly well-drained soils, grassland aeration reduced surface runoff volume and mass losses of dissolved reactive P (DRP) in runoff by approximately 35%. In contrast, when poorly drained soils dominated, grassland aeration increased runoff volume (4.8 mm/runoff event) and mass losses of DRP and total P (0.25 kg TP/ha per runoff event). This implies that aeration of well-drained soils in the top poultry-producing counties of Georgia (0.2 million ha) could decrease dissolved phosphorus losses by more than 500 Mg P each year. This is not the case if soils are poorly drained.
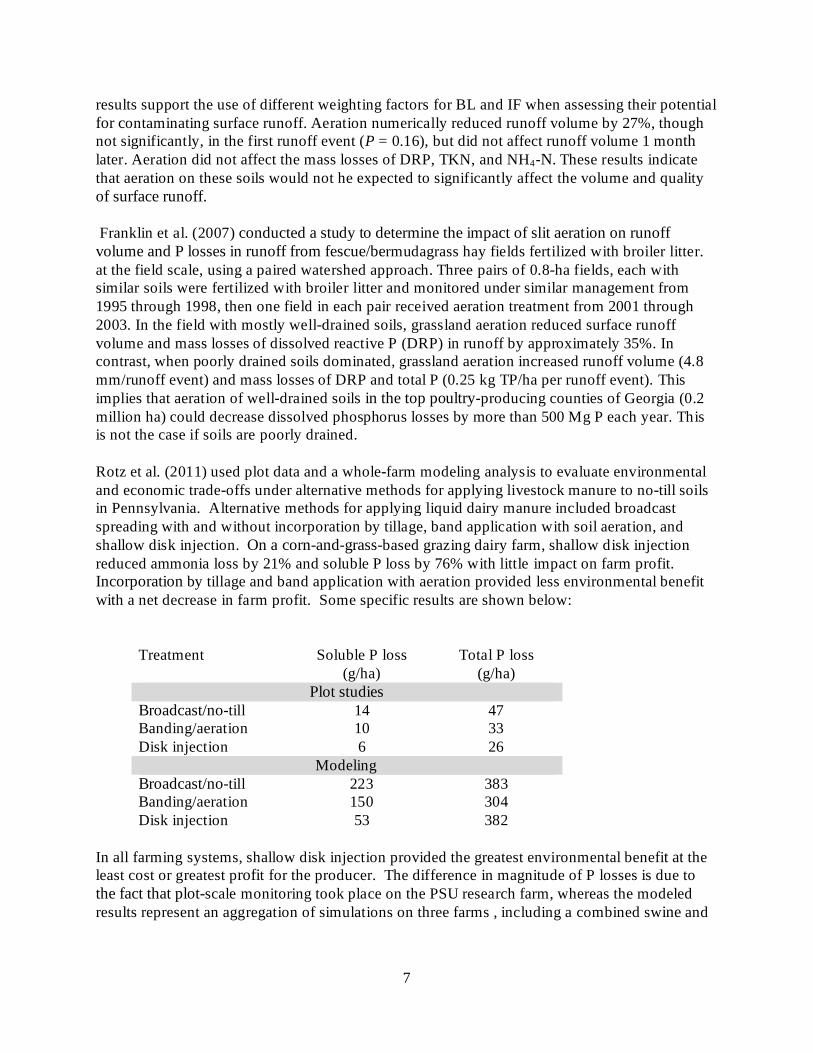
Rotz et al. (2011) used plot data and a whole-farm modeling analysis to evaluate environmental and economic trade-offs under alternative methods for applying livestock manure to no-till soils in Pennsylvania. Alternative methods for applying liquid dairy manure included broadcast spreading with and without incorporation by tillage, band application with soil aeration, and shallow disk injection. On a corn-and-grass-based grazing dairy farm, shallow disk injection reduced ammonia loss by 21% and soluble P loss by 76% with little impact on farm profit. Incorporation by tillage and band application with aeration provided less environmental benefit with a net decrease in farm profit. Some specific results are shown below:
In all farming systems, shallow disk injection provided the greatest environmental benefit at the least cost or greatest profit for the producer. The difference in magnitude of P losses is due to the fact that plot-scale monitoring took place on the PSU research farm, whereas the modeled results represent an aggregation of simulations on three farms , including a combined swine and
P
8
cow–calf beef operation, a mixed confinement and grazing dairy operation, and a large full-confinement dairy.
Gordon et al. (2000) conducted experiments in Nova Scotia, Canada to evaluate the effects of performing soil aeration either before or after spreading liquid manure in forage production systems and found that soil aeration was not beneficial as an NH3 conservation practice when compared with a conventional manure-spreading system. The experiments included eight trials performed in 1996 using a non-interfering diffusion method to determine ammonia (NH3) flux emissions from both aerated and control plots. For all eight trials, the manure application rate was 75,355 L/ha. The average NH3 loss for the aerated treatment was 67.3 kg/ha while the loss for the control plots was 63.0 kg/ha. Although differences in the NH3 loss between treatments were low, substantial variations were observed between individual trials depending on the prevailing meteorological conditions. In a complementary experiment, on-farm results suggested that in the first forage cut after manure spreading, no improvement in yield was achieved with soil aeration. In fact, yields were reduced on average by 9%.
Bittman et al. (2005) compared the (subsurface deposition slurry applicator) that bands manure over aeration-type slots to surface banding and conventional broadcasting as methods to maximize crop response and minimize losses of nutrients to the environment in British Columbia, Canada. The comparison was based on immediate and residual crop responses to single and multiple applications of dairy slurry by tall fescue and orchardgrass and on ammonia emissions. The aeration slots without manure generally did not have a significant effect on yield or N uptake. Averaged over all harvests, surface banding increased yield and N uptake over broadcasting by 6.9 and 6.8%, respectively. The SSD increased yield and N uptake over surface banding by 4.4 and 7.5%, respectively. The rel ve effectiveness of the techniques on yield varied among experiments. In the ammonia volatilization trials, one method showed thatloss of applied total ammoniacal N in the 2 wk after application ranged from 36 to 61% for broadcast manure compared with 17 to 32% for SSD- applied manure. By other methods, ammonia emissions from applied manure were shown to be 46 to 48% lower with the SSD than with broadcasting. Emissions from surface-banded manure (chamber method) averaged 33% greater with surface banding than with the SSD. The results indicate that the SSD manure applicator reduced ammonia loss and increased yield and N uptake relative to broadcasting and surface-banding techniques.
In contrast, Mahli et al. (2000) reported no effects of soil aeration using the aerator on forage yields from five sites in Saskatchewan, Canada.
Bittman, S., L.J.P. van Vliet, C.G. Kowalenko, S. McGinn, D.E. Hunt, and F. Bounaix. 2005. Surface-banding liquid manure over aeration slots: A new low-disturbance method for reducing ammonia emissions and improving yield of perennial grasses. 97:1304–1313.
2.5 Other Pollutants
REFERENCES
Aerway SSD
Aer-Way
Agron. J.
9
Butler, D.M., D.H. Franklin, M.L Cabrera, A.S. Tasistro, K. Xia, and L.T. West. 2008. Evaluating aeration techniques for decreasing phosphorus export from grasslands receiving manure. 37:1279-1287.
Curran Cournane, F., R.W. McDowell, R.P. Littlejohn, D.J. Houlbrooke and L.M. Condron. 2011. Is mechanical soil aeration a strategy to alleviate soil compaction and decrease phosphorus and suspended sediment losses from irrigated and rain-fed cattle-grazed pastures?
Published on-line May 2011, doi: 10.1111/j.1475-2743.2011.00345.x. http://onlinelibrary.wiley.com/doi/10.1111/j.1475-2743.2011.00345.x/full
Franklin, D.H., M.L. Cabrera, and V.H. Calvert. 2006. Fertilizer source and soil aeration effects on runoff volume and quality. 70:84-89.
Franklin, D.H., M.L. Cabrera, V.H. Calvert and J.A. Rema. 2007. Aerating grasslands: Effects on runoff and phosphorus losses from applied broiler litter. . 36:208-215.
Franklin, D.H., D.M. Butler, M.L. Cabrera, V.H. Calvert, L.T. West, and J.A. Rema. 2011. Influence of Aeration Implements, Phosphorus Fertilizers, and Soil Taxa on Phosphorus Losses from Grasslands. 40:312-319.
Gordon, R., G. Patterson, T. Harz, V. Rodd, and J. MacLeod. 2000. Soil aeration for dairy manure spreading on forage:Effects on ammonia volatilisation and yield. 80: 319-326.
Harrigan, T.M., B.B. Bailey, W.J. Northcott, A.N. Kravchenko, and C.A.M. Laboski. 2006. Field performance of a low-disturbance, rolling-tine, dribble-bar manure applicator. . 22:33–38.
Maguire, R. and J. McGrath. 2009a. Manure management in No-Till and Pasture Systems. USDA-CSREES Mid-Atlantic Water Program, http://www.mawaterquality.org/publications/documents/ManureInjectioninNo-TillSystem.pdf
Maguire, R.O., P.J.A. Kleinman, C.J. Dell, D.B. Beegle Brandt, J.M. McGrath, and Q.M. Ketterings. 2009. Manure application technology in reduced tillage and forage systems: A review. 40:292-301.
Malhi, S. S., K. Heier, K. Nielsen, W. E. Davies, and K. S. Gill. 2000. Efficacy of pasture rejuvenation through mechanical aeration or N fertilization. . 80: 813–815.
Shah, S.B., J.L. Miller, and T.J. Basden. 2004. Mechanical aeration and liquid dairy manure application impacts on grassland runoff water quality and yield.
van Vliet, L.J.P., Bittman, S., Derksen, G., Kowalenko, C.G., 2006. Aerating grassland before manure application reduces runoff nutrient loads in a high rainfall environment.
. 35:903-911.
J. Environ. Qual.
Soil Use and Manage.
Soil Sci. Soc. Am. J.
J.Environ. Qual
J. Environ. Qual.
Can. J. Soil Sci.
Appl. Eng. Agric
J. Environ. Qual.
Can. J. Plant Sci
J. Environ. Qual
Trans. ASABE. 47(3):777-788.
10
Cover crops (also called catch crops, companion crops, or relay crops) are grasses, legumes and forbs used for seasonal cover and other conservation purposes after or during a primary crop. In general, a cover crop is planted in the fall after harvest, although in some cases the cover crop can be interseeded with the main crop. The cover crop remains on the field through the winter to protect the soil from erosion and soil/nutrient loss and is harvested or plowed under in the spring prior to planting. In reduced tillage situations, the primary crop may be planted through the cover crop in the spring. As described in NRCS Conservation Practice Standard code 340, cover crops may be used on any land where vegetative cover is needed for natural resource protection or improvement.
From a water quality perspective, cover crops are generally believed to be beneficial where they are used to:
Reduce erosion from wind and water which can carry nutrients and sediments to surface watersCapture and recycle or redistribute nutrients in the soil profile to reduce nutrient availability to be transported from agricultural lands through runoff or leachingPromote biological nitrogen (N) fixation through use of leguminous cover crops to reduce the need for addition of nitrogen fertilizer to subsequent cropsImprove soil quality through organic matter addition, reduction of soil compaction, and the action of deep roots, thereby improving infiltration and reducing the rate and volume of runoff from agricultural lands
Other agronomic benefits of cover crops include enhancement of short-term soil N fertility, weed suppression, and enhancement of biological control agents such as predatory insects (Sarrantonioand Gallandt 2003).
In a review of cover crop impacts on soil and water quality, Dabney et al. (2001) listed some general advantages and disadvantages of using cover crops:
3.0 Cover Cropping
3.1 Introduction
ü
ü
ü
ü
11
Most research into the effectiveness of cover crops for water quality has focused on N (either for capture of excess N after main crop harvest or for increasing N inputs through legume fixation) and has been conducted in the Midwest or Mid-Atlantic regions. The literature reviewed below focuses on reduction of P and sediment through the use of cover crops and favors work done in regions relevant to the Lake Champlain Basin, although some research from other regions is included. The review is organized into four categories of cover crop effects:
Sediment and P losses in runoffCrop nutrient use efficiencySoil qualityPhytoremediation/soil P fixing
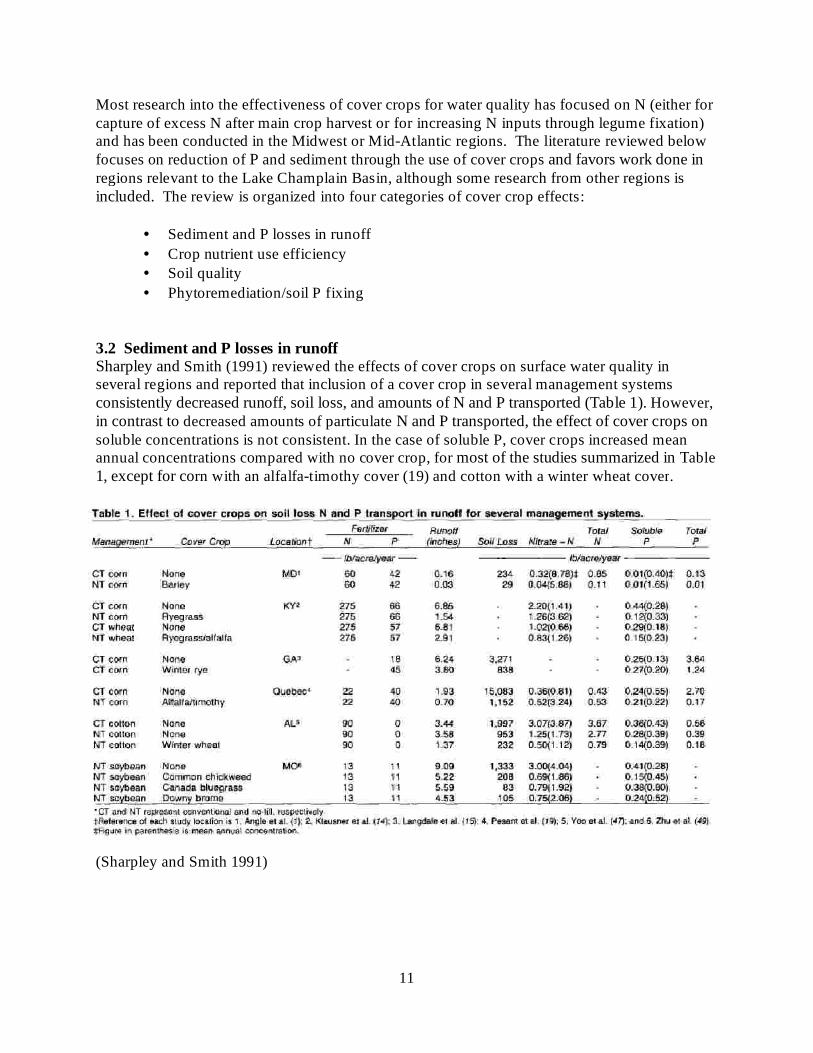
Sharpley and Smith (1991) reviewed the effects of cover crops on surface water quality in several regions and reported that inclusion of a cover crop in several management systems consistently decreased runoff, soil loss, and amounts of N and P transported (Table 1). However, in contrast to decreased amounts of particulate N and P transported, the effect of cover crops on soluble concentrations is not consistent. In the case of soluble P, cover crops increased mean annual concentrations compared with no cover crop, for most of the studies summarized in Table 1, except for corn with an alfalfa-timothy cover (19) and cotton with a winter wheat cover.
(Sharpley and Smith 1991)
••••
3.2 Sediment and P losses in runoff
12
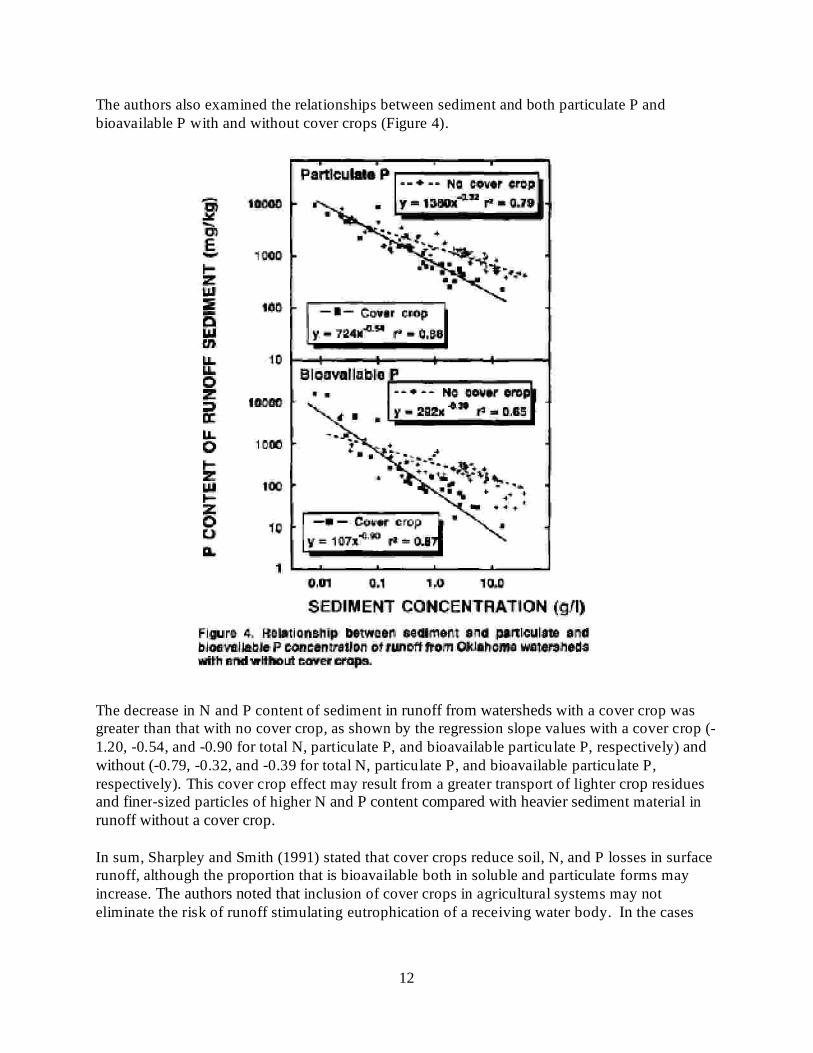
The authors also examined the relationships between sediment and both particulate P and bioavailable P with and without cover crops (Figure 4).
The decrease in N and P content of sediment in runoff from watersheds with a cover crop was greater than that with no cover crop, as shown by the regression slope values with a cover crop (-1.20, -0.54, and -0.90 for total N, particulate P, and bioavailable particulate P, respectively) and without (-0.79, -0.32, and -0.39 for total N, particulate P, and bioavailable particulate P, respectively). This cover crop effect may result from a greater transport of lighter crop residuesand finer-sized particles of higher N and P content compared with heavier sediment material in runoff without a cover crop.
In sum, Sharpley and Smith (1991) stated that cover crops reduce soil, N, and P losses in surface runoff, although the proportion that is bioavailable both in soluble and particulate forms may increase. The authors noted that inclusion of cover crops in agricultural systems may not eliminate the risk of runoff stimulating eutrophication of a receiving water body. In the cases
13
they reviewed, soluble P and total P concentrations of runoff from cover cropped fields were consistently above the critical value associated with accelerated eutrophication of a water body.
In plot studies in Sweden, Ulen (1997) reported that winter cover crops did not reduce the erosion-associated losses of particle-bound phosphorus. The concentrations of PO4-P were significantly higher in surface water from plots with a catch crop or weed biomass than from bare soils; the author proposed that vegetation damaged by frost or dryness is a source of PO4-P in runoff. Because the actual P loss was small, the author concluded that soil can be covered with plant material during winter without any risk of unacceptably high PO4-P losses.
In another review, Hartwig and Ammon (2002) reported that the primary benefit of cover crops is reduction of water runoff and soil erosion. Conservation tillage practices combined with cover crops can significantly reduce runoff and soil erosion losses. The authors cite earlier studies thatreported that when corn was planted into a birdsfoot trefoil or crownvetch living mulch on a 14% slope, water runoff, soil loss, and pesticide loss were reduced from 95 to > 99% compared with conventional till corn. The soil loss from corn planted into birdsfoot trefoil and crownvetch was insignificant. Hartwig and Ammon (2002) also cite older work showing that with the continuous presence of cover crops, surface water runoff is greatly reduced, and the loss of nutrients and pesticides by this route are almost totally eliminated.
Kleinman et al. (2005) studied a simultaneous corn and cover crop system developed by USDA-NRCS for dairy farms in the northeastern United States, where short growing seasons limit fall seeding of cover crops. The simultaneous corn and cover crop system uses post-emergence imidazolinone herbicides to allow for simultaneous seeding of cover crops with silage corn. Trials were established at two locations in the Cannonsville Reser watershed, New York (just to the southwest of the Lake Champlain Basin) to assess the effects of this cover cropping system on water quality. Rain simulations were conducted to evaluate the initial 30 minutes of runoff from small plots before and after surface application of dairy manure. Corn yields from plots interseeded with red clover compared most favorably with the conventionally cropped controls, with no significant differences in yields noted between the two treatments at either location. Prior to dairy manure application, losses of P in runoff were primarily a function of erosion. Because all cover crops increased ground cover (up to 81% greater than the control), total P loads in runoff were significantly lower from cover cropped plots (averaging 10 mg perplot) than from conventionally cropped controls (averaging 39 mg per plot). At the same time, suspended solids loads averaged 25.3 g from the control plots and 5.9 g from the cover crop plots.
Despite concern that release of soluble P from the cover crops could enrich dissolved reactive Pin runoff, dissolved reactive P losses from the simultaneous corn and cover crop system weregenerally not different from conventionally-cropped silage corn losses. Application of manureobscured cover crop/conventional silage corn treatment differences with regard to P runoff, withdissolved reactive P becoming the dominant form of P in runoff due to contributions of readilysoluble P in manure. Because runoff P losses were already high from unmanured conventionalsilage corn plots, application of manure did not significantly increase P losses from some of theconventional silage corn treatments. Results highlight the agronomic and water quality benefits
14
of the simultaneous corn and cover crop system, particularly when implemented with red clover
(Kleinman et al. 2005)
Kleinman et al. (2005) concluded that agronomically, the simultaneous corn andcover crop system produced corn silage yields that were comparable to those obtainedunder conventional management when red clover, and, to a lesser extent, perennial rye
.
15
grass were interseeded with corn. This study documented the potential water quality benefits of the simultaneous corn and cover crop system, even in the fall immediately after corn harvest when traditional, relay-cropped cover crops would not yet be established. Prior to manure application, cover crops functioned to decrease surface runoff and soil erosion. At that time, differences in runoff and erosion resulted in lower total P losses from cover cropped soils than from conventionally cropped soils. Although greater concentrations of erodedsediments were associated with lower dissolved reactive P concentrations in runoff, and some studies had found cover crop vegetation to contribute to dissolved P in runoff, no significant influence of cover crops on runoff dissolved reactive P losses was detected prior to manure application. Broadcasting manure to conventional and cover crop treatments resulted in largeincreases in runoff dissolved reactive P losses, which, for the cover crops, corresponded with large increases in total P losses. Application of manure had less of an effect on total P losses from the conventional silage corn treatment, as losses were already great prior to manure application due to high rates of erosion. Because manure application rate was positively related to runoff P losses, results support the widely-held conclusion that managing manure application rate is important to controlling losses of P in runoff. In as much as the simultaneous corn and cover crop system provides an opportunity to establish leguminous cover crops (especially redclover, which performed the most favorably in terms of combined agronomic and waterquality benefits), it is possible that this system could reduce the agronomic recommendationfor manure N over time, justifying lower manure application rates than for conventional silage corn or non-leguminous cover crops. Thus, the simultaneous corn and cover crop system, combined with prudent manure management, shows great potential in limiting non-point source P pollution from corn silage fields in the northeastern United States.
Sarrantonio and Gallandt (2003) reported that cover crops contribute both directly and indirectly to reducing soil erosion rates. The presence of additional crop residue, whether dead or alive, serves to decrease raindrop impact and soil detachment, to physically stabilize topsoil with roots, and to create a tortuous path for surface water, slowing its momentum and ability to carry soil. The authors cited a 1999 survey of vegetable growers using cover crops in western New Yorkreporting that the most often cited reason for using cover crops was for erosion control. According to the revised Universal Soil Loss Equation (RUSLE) used to predict rates of erosion, soil residue cover of as little as 10% can reduce erosion rates by about 30%; at 50% soil residue cover soil erosion reduction can be greater than 80%
In British Columbia, Canada, van Vliet et al (2002) compared different fall manure application strategies on runoff and contaminant transport from silage corn land. The treatments were: (i) a control, which did not receive manure in the fall; (ii) manure broadcast in the fall on corn stubble; and (iii) manure broadcast in the fall on corn stubble with an established relay (cover) crop. Runoff, solids, and nutrients loads from natural precipitation were measured on replicated experimental plots from 1996 to 1998. Fall-applied manure on 3–5% sloping silage cornland without a relay crop resulted in a high risk to surface water quality, due to high suspended solid loads of between 7 and 14 Mg/ha/yr and high nutrient transport with mean annual total Kjeldahl N (TKN) P, and K loads of 98, 21, and 63 kg/ha, respectively. Compared with no relay crop, intercropping silage corn with a relay crop of Italian ryegrass reduced the mean annual runoff and suspended solid load by 53 and74%, respectively, T load by 56%, P load by 42%, K load by 31%, and Cu load by 57%. Even though total nutrient loads were lower with the relay crop
16
treatment, all fall manure treatments including the re rop resulted in nutrient loads above guidelines for the first three runoff events immediately following application.
(van Vliet et al 2002)
The authors concluded that the common practice of fall-applying manure on sloping silage cornland without a relay crop is not a sustainable practice due to high solids and nutrient losses from the soil landscape with potential impacts on surface water quality. Silage corn intercropped with a relay crop of Italian ryegrass was effective in bringing these losses to within sustainable levels by reducing the mean annual runoff and suspended solids load by 53 and 74%, respectively, TKN load by 56%, P load by 42%, K load by 31%, and Cu load by 57%. Cover cropping was recommended as a best management practice for silage corn grown on sloping land in the Lower Fraser Valley.
In current research on companion crops (winter rye, Italian ryegrass, and red clover) in silage corn in Wisconsin, Jokela (2011) reports that with fal iry manure application, all cover crop types substantially increased the time required to generate runoff under simulated rainfall. All three cover crops also reduced runoff volume, sediment load, and total P load. Presence of winter rye decreased runoff, sediment, and P by 90% compared to no companion crop. Red clover was least effective, reducing runoff and sediment and P loads by 43 – 58%. Thesereductions were associated with increased ground cover, especially with rye, suggesting that companion crop vegetation provided protection from raindrop impact and erosion. But improved soil structure may also play a role because the rye and ryegrass treatments had significantly more large water-stable macroaggregates than the no-companion control. However, shifting from a fall to a spring manure application increased time to runoff from the no-companion control and tended to decrease time to runoff from companion crop treatments. In addition to delaying runoff from the no-companion control, a shift to spring manure decreased runoff quantity by 53% and sediment load by 70%, perhaps due to a mulching effect of the recently applied manure. However, P runoff concentration from the no companion control was twice as high from spring
17
manure (data not shown), resulting in no change in total P loads. By contrast, a shift to spring manure increased runoff quantities from rye and loads of total P and sediment from rye and ryegrass without affecting red clover. Overall, the presence or absence of companion crops had little or no effect on runoff amounts, total P loads, and sediment loads following a spring manure application. Jokela (2011) suggested that under spring manure application, the recency of manure application was more important than the presence of companion crops. The freshly applied manure appeared to override the presence of companion crops in determining runoff characteristics from cropland.
Cover crops may indirectly reduce nutrient losses from cropland by increasing the efficiency of nutrient use by the main crop, thereby reducing the quantity of nutrients available to be lost or by reducing the need for nutrient additions.
Li et al. (1990) reported that cover crop residues (e.g., alfalfa, peas, wheat) applied to northern Idaho soils have the ability to enhance P availability (measured as NaOAc extractable P) in addition to providing a usable N source.
In Pennsylvania, Kabir and Koide (2002) investigated the effects of autumn sowing of cover crops (oats, rye and a combination of oats and rye) on soil aggregate stability, mycorrhizal colonization, phosphorus uptake and yield of sweet corn planted the following summer. When compared to fallow, oats was as effective as rye in increasing mycorrhizal colonization of sweet corn, density of mycorrhizal hyphae, and soil aggregate stability. An oats cover crop may thus be a viable alternative to rye as herbicide is not required to kill an oat cover crop that dies out in winter. The combination of cover crops (rye and oats), however, was significantly better than single species of cover crops in terms of sweet corn mycorrhizal colonization, P uptake and yield of sweet corn.
In a Kansas study, Cavigelli and Thien (2003) reported that incorporating green manure crops into soil may increase P bioavailability for succeeding crops. They conducted a greenhouse study to evaluate the effects of green manures on biomass and P utilization of a succeeding grain sorghum crop. Four perennial forages and four winter annual cover crops were grown, in pots, killed, and incorporated into the soil before planting sorghum in the same pots. Sorghum P uptake was positively correlated with perennial forage P uptake. Among winter cover crops, sorghum P uptake following white lupine was lower than in P all other treatments, including the control (no previous cover crop), even though lupine biomass, N content, and P uptake were two to three times greater than those of the other winter cover crops. Phosphorus uptake differed slightly among the other three winter cover crops but sorghum P uptake was not correlated to winter cover crop P uptake. Thus, among winter cover crops, plant type rather than P uptake seemed to influence the subsequent sorghum crop’s P uptake. However, sorghum biomass following the three winter cover crops other than lupine was greater than sorghum biomass in the control treatment, indicating that there was a beneficial cover crop rotation effect among these three winter cover crops.
3.3 Crop Nutrient Use Efficiency
18
Singer et al. (2008) reported that coupling winter small grain cover crops (CC) with liquid manure injection in Iowa may increase manure nutrient capture. The study quantified manure injection effects using target swine manure N rates of 112, 224, and 336 kg N/ha on CC plant density, fall and spring shoot biomass, N, P, and K uptake and subsequent corn yield. A winter rye–oat CC was established before fall manure injection. Manure injection lowered mean CC plant density 25% because of CC mortality in the injection zone. Fall CC dry matter (DM) was 26% lower in the manure treatments than the no manure CC control, although no difference was detected for N (9.4 kg/ha) or P (1.4 kg/ha) uptake. No difference was detected for spring DM between CC no manure and manure treatments. Shoot DM, N, P, and K uptake increased 29, 41, 31, and 25% from the CC manure 112 to CC manure 224 with no increase above CC manure 224. Cover crop N uptake was higher in CC manure vs. no manure (60.1 vs. 35.6 kg/ha). Cover crop P and K uptake were also higher in CC manure vs. no manure (9.2 vs. 6.6 kg P/ha and 41.3 vs. 30.0 kg K/ha). Corn grain yield was unaffected by CC and responded positively to manure application (11,022 with manure vs. 9,845 kg/ha without manure). Coupling manure injection and cover crops can increase nutrient capture without lowering corn yield.
Long-term use of cover crops is widely reported to improve soil quality and therefore may indirectly reduce P and sediment losses by reducing surface runoff and promoting infiltration.
Dabney et al. (2001) reviewed the literature about the impacts of cover crops in cropping systems that affect soil and water quality. While actively growing, cover crops increase solar energy harvest and carbon flux into the soil, providing food for soil macro and microrganisms, while simultaneously increasing evapotranspiration from the soil. Biomass produced by cover crops transpire more water than bare or weedy soils, allowing more rainfall to infiltrate into the soil, and decreasing runoff and potential erosion.
Cover crops increase soil quality by improving biological, chemical and physical properties including: organic carbon content, cation exchange capacity, aggregate stability, and water infiltrability. In addition, cover crops protect aggregates from the impacts of rain drops, reducing soil detachment and aggregate breakdown. The authors point out that cover crops are best adapted to warm areas with abundant precipitation because water use by cover crops can adversely impact yields of subsequent dryland crops in semiarid areas. Similarly, cooler soil temperatures under cover crop residues can retard early growth of subsequent crops grown near the cold end of their range of adaptation.
Sarrantonio and Gallandt (2003) reported other research showing that increased soil organic matter and enhanced microbial activity associated with cover crops may, over time, increase soil aggregation and water infiltration rates, allowing water to move into, rather than across the soil.The authors concluded that inclusion of cover crops in a cropping system may provide multiple benefits toward improving overall soil quality – increased OM, aggregate stability, hydraulic conductivity,
In Illinois, Villamil et al. (2006) reported that, compared with winter fallow, crop sequences that included winter cover crops provided substantial benef productivity. Specifically, the
3.4 Soil Quality
19
use of the corn-rye/soybean-vetch or corn-rye/ soybean-vetch and rye increased soil OM down to 30 cm. All cover crop sequences improved aggregate stability with increases of 9, 13, and 17% for corn-rye/soybean-rye; corn-rye/soybean-vetch; corn-rye/soybean-vetch and rye, respectively. Winter cover crop sequences reduced bulk density of the soil surface and increased total and storage porosity along with plant available water. While the corn-rye/soybean-vetch sequence was the most effective in reducing soil NO3–N, the corn-rye/soybean-rye sequence was the most effective in fixing soil P.
In a Wisconsin study, Jokela et al. (2009) investigated whether using cover/companion crops and/or applying low-solids liquid dairy manure could improve physical, chemical, and biological soil properties and overall soil quality. Corn was grown for 4 years on a Bertrand silt loam in rotation with a living mulch of kura clover or June-interseeded red clover, and continuously with June-interseeded Italian ryegrass, September-seeded winter rye, or no cover crop. Extractable P and K, pH, soil organic matter (SOM), active C, water-stable aggregates, bulk density, penetrometer resistance, and microbial biomass/diversity were measured, and the Soil Management Assessment Framework (SMAF) soil quality index (SQI) was determined. Cover/ companion crop treatments generally had more large macroaggregates, greater aggregate mean-weight diameter, and larger quantities of total microbial biomass and most lipid/microbial groups than no-cover treatments. Manure and starter fertilizer additions resulted in significant cover/companion crop treatment effects on extractable P and K. Liquid dairy manure alone did not improve any soil quality indicators. Although soil quality benefits of cover crops and manure are typically attributed to additions of organic C, the authors found no significant treatment effects on SOM content. However, the active, or labile, C fraction, was significantly increased by cover crops and showed good relationships with aggregate stability and microbial biomass. Overall, use of cover/companion crops appears beneficial for corn silage systems, but it may take more than 4 yr for some soil quality indicators to fully respond.
Cover crops have been reported to be useful in removing or fixing P in soils with excessive P levels. It should be emphasized that actual removal of P by this means would require harvest of the cover crop vegetation, an activity that may not be practical in the Lake Champlain Basin.
Read et al. (2009) conducted a field study in Mississippi to determine the potential of ‘Coastal’bermudagrass overseeded with annual ryegrass and harvested for hay to reduce the level of Mehlich-3 extractable P (M3-P) that had accumulated in a Savannah soil due to a 30-year history of broiler litter application to bermudagrass, as well as antecedent litter rates of 0, 4.48, 8.96, 17.9, and 35.8 Mg/ha in 1999–2001. Following the cessation of litter, the plots were overseeded in fall 2001–2003 and fertilized in summer with 268 kg N/ha as NH4NO3. Applying 8.96 Mg/halitter significantly elevated M3-P in surface soil (0–15 cm depth) from about 183 to 263 mg/kg. Annual dry matter (DM) yield and P uptake generally increased as litter rate increased up to 17.9 Mg ha-1. Analysis of M3-P at four sampling dates from October 2002 to April 2004 found no significant effect of forage system or its interaction with litter rate, and levels in both systemsdecreased by about 25, 27, 22, 26, and 29% at the five litter rates, respectively. Ryegrass–bermudagrass significantly increased DM yield and P uptake, but did not translate to reductions in M3-P, as compared to bermudagrass winter fallow. With no further litter additions and five
3.5 Phytoremediation/soil P fixing
20
harvests per year, both forage systems removed about 49 kg/ha P with a DM yield of 15 Mg/haand reduced M3-P by about 26 mg/kg annually. Bermudagrass performance is important in the remediation of high soil P. When a P-consistent rate of 4.48 Mg/ha litter was used, the combined harvests of ryegrass and bermudagrass removed 55 kg/ha P and reduced M3-P levels by 13%annually (or about 30 mg/kg soil).
In a greenhouse study, Sharma and Sahi (2005) determined the phytoremediation potential ofGulf and Marshall ryegrass under varying conditions of soil P concentration, pH, and temperature. Both genotypes demonstrated P accumulations of 1% shoot dry weight depending on soil P concentrations (0-10 g of P/kg of soil), with higher shoot P in Gulf than Marshall ryegrass. An increase in plant biomass was proportional to the increasing concentrations of P up to a level of 10 g of P/kg of soil. The effect of soil pH on plant uptake of P was noticeable with a significant rise in shoot P in acidic soil (pH 5.6) as compared to soil with pH 7.8. Significant differences were observed in the biomass productivity and shoot P accumulation at varying temperatures in both grass types. The patterns of acid phosphomonoesterase and phytase activities in plant roots were interesting, activities being 2-fold higher in alkaline soil than acidic soil in both genotypes. The effect of P supply on the enzyme activity was also distinct, as plants growing in a high P concentration showed higher activity (nearly 30%) than those growing under P deficiency conditions (with no addition of P). These results indicate that Gulf and Marshall ryegrass can accumulate high P under optimal conditions and thus reduce soil P concentrations in successive cropping.
In Illinois, Villamil et al. (2006) found significantly lower soil P concentrations in cover crop sequences than in a corn-soybean-fallow sequence. The lower P levels with cover crop sequences were attributed to immobilization of P in the cover crop biomass.
Cavigelli, M.A. and S.J. Thien. 2003. Phosphorus Bioavailability following Incorporation of Green Manure Crops. 67:1186–1194.
Dabney, S.M., J.A. Delgado, and D.W. Reeves. 2001. Using winter cover crops to improve soil and water quality. 32(7&8), 1221–1250
Hartwig, N.L. and H.U. Ammon. 2002. Cover Crops and Living Mulches. 50(6): 688-699.
Jokela, W.E., J.H. Gragger, D.L. Karlen, T.C. Balser, and D.E. Palmqist. 2009. Cover crop and liquid manure effects on soil quality indicators in a corn silage system. 101:727–737.
Jokela, W.E. 2011. Personal communication; data from publication currently in review. Research Soil Scientist, USDA-Agricultural Research Service, Marshfield, WI.
REFERENCES
Soil Sci. Soc. Am. J.
Commun. Soil Sci. Plant Anal.
Weed Science
Agron. J.
21
Kabir Z and R. T. Koide. 2002. Effect of autumn and winter mycorrhizal cover crops on soil properties, nutrient uptake and yield of sweet corn in Pennsylvania, USA. 238: 205–215.
Klausner, S. D., P. J. Zwerman, and D. F. Ellis. 1974. Surface runoff losses of soluble nitrogen and phosphorus under two systems of soil management. 3:42-46.
Kleinman, P.J.A., P. Salon, A.N. Sharpley and L.S. Saporito. 2005. Effect of cover crops established at time of corn planting on phosphorus runoff from soils before and after dairy manure application. 60(6):311-322.
Langdale,G. W., R. A. Leonard, and A. W.Thomas. 1985. Conservation practice effects on phosphorus losses from southern Piedmont watersheds. 40:157-160.
Li, G. C., R. L. Mahler, and D. O. Everson. 1990. Effects of plant residues and environmental factors on phosphorus availability in soils. 21: 5:471-491.
Pesant, A. R., J. L. Dionne, and J. Genest. 1987. Soil and nutrient losses in surface runoff from conventional and no-till corn systems. 672335-843.
Read, J. J., K.R. Sistani, J.L. Oldham, and G.E. Brink. 2009. Double-cropping annual ryegrass and bermudagrass to reduce phosphorus levels in soil with history of poultry litter application
84:93-104.
Sarrantonio, M. and E. Gallandt. 2003. The Role of Cover Crops in North American Cropping Systems, 8, (1/2):53-74.
Sharma, N. C. and S. V. Sahi (2005). "Characterization of phosphate accumulation in Lolium multiflorum for remediation of phosphorus-enriched soils." 39(14): 5475-5480.
Sharpley, A.N., and S.J. Smith. 1991. Effects of cover crops on surface water quality. p. 41–49. In W.L. Hargrove (ed.) Cover crops for clean water. Soil and Water Conserv. Soc., Ankeny, IA.
Singer, J. W., C. A. Cambardella, and T.B. Moorman. 2008. Enhancing Nutrient Cycling by Coupling Cover Crops with Manure Injection. 100(6): 1735-1739.
Ulen, B. 1997. Nutrient losses by surface run-off from soils with winter cover crops and spring-ploughed soils in the south of Sweden. 44:165-177.
van Vliet, L. J. P., B. J. Zebarth, and G. Derksen. 2002. Effect of fall-applied manure practices on runoff, sediment, and nutrient surface transport from silage corn in south coastal British Columbia." 82(4): 445-456.
Villamil, M.B., G.A. Bollero, R.G. Darmody, F.W. Simmons, and D.G. Bullock. 2006.
Plant and Soil
J. Environ. Qual.
J. Soil Water Cons.
J. Soil and Water Cons.
Communications in Soil Science and Plant Analysis
Can. J. Soil Sci.
Nutr. Cycl. Agroecosyst.
J. Crop Prod.
Environ. Sci. & Technol.
Agron. J.
Soil & Tillage Res.
Can. J. Soil Sci.
22
No-Till Corn/Soybean Systems Including Winter Cover Crops: Effects on Soil Properties70:1936–1944.
Yoo, K. H., J.T.Touchton,andR. H. Walker. 1988. Runoff,sedimen tand nutrient losses from various tillage systems of cotton. . 12:13-24.
Zhu, J. C., C. J. Gantzer, S. H. Anderson, E.E. Alberts, and P.R. Beuselinck. 1989. Runoff, soil, and dissolved nutrient losses from no-till soybean with winter cover crops. 53:1210-1214.
Soil Sci. Soc. Am. J.
Soil Tillage Res
Soil Sci. Soc Am. J.
23
Research has widely shown that soil erosion potential may increase substantially as a result of conventional tillage and that reduced or conservation tillage can effectively reduce soil erosion, but may increase P loss, especially of soluble P (Romkens et al. 1973, Gaynor and Findlay 1995). Managing manure application in reduced tillage systems is a water quality concern because surface application of manure without tillage can lead to significant runoff losses of P, especially of dissolved forms, whereas incorporation of the manure by tillage tends to increase particulate P and soil loss, contrary to the intention of reduced tillage. Eghball and Gilley (1999) reported that concentrations of dissolved and bioavailable P in runoff were greater from plots on which manure was applied and not disked. However, total and particulate P concentrations of runoff were greater on sites where manure was incorporated.
A largely hypothetical combination of reduced tillage with manure incorporation would represent, therefore, a compromise between best management practices for soil erosion control and practices for manure management. Manure should be incorporated into the soil for odor control, increased availability of nutrients and control of potential manure runoff. However, soil and crop residue disturbance should be minimized for soil erosion control.
Unfortunately, there has been essentially no research published on this specifi concept. There is ample research on the effects of manure application without incorporation to different tillage systems. There are also studies of the influence of manure incorporation into different tillage practices, where the incorporation essentially negates the value of no-till. It should be noted that nearly all reported work has been done in plot studies, frequently using simulated rainfall, making transfer of the conclusions to field scale chal ing. Finally, because of the scarcity of highly relevant literature, studies that used swine manure have been included as potentially relevant to the LCB. A few studies using poultry litter or P fertilizer have also been included at the end of the review.
Incorporation of manure (and other nutrient amendments) clearly has some benefits for water quality. For example, Daverde et al. (2004) reported on the effects of soil test level, source, and application method of P amendments on P in runoff following soybeans in an Illinois plot study.The treatments consisted of two rates of swine liquid manure surface-applied and injected, 54 kg P/ha triple superphosphate (TSP) surface- applied and incorporated, and a control with and without chisel-plowing. Rainfall simulations were conducted one month (1MO) and six months(6MO) after P amendment application for 2 yr. Soil injection of swine manure compared with surface application resulted in runoff P concentration decreases of 93, 82, and 94%, and P load decreases of 99, 94, and 99% for dissolved reactive phosphorus (DRP), total phosphorus (TP), and algal-available phosphorus (AAP), respectively. Incorporation of TSP also reduced P concentration in runoff significantly. Runoff P concentration and load from incorporated amendments did not differ from the control. Factors most strongly related to P in runoff from the incorporated treatments included Bray P1 soil extraction value for DRP concentration, and Bray P1 and sediment content in runoff for AAP and TP concentration and load. Injecting manure and chisel-plowing inorganic fertilizer reduced runoff P losses, decreased runoff volumes, and
4.0 Reduced Tillage and Manure Incorporation
4.1 Introduction
4.2 Manure Incorporation
24
increased the time to runoff, thus minimizing the potential risk of surface water contamination. After incorporating the P amendments, controlling erosion is the main target to minimize TPlosses from agricultural soils.
Little et al. (2005) conducted a 3-yr plot study was to evaluate sediment and nutrient losses with different tillage methods (moldboard plow, heavy-duty cultivator, double disk, and no-incorporation) for incorporation of beef cattle manure in a silage barley cropping system in Alberta, Canada. Runoff depths, sediment losses, and surface and subsurface nutrient transfers were determined from manured and unmanured field plots under simulated rainfall. Sediment losses among tillage treatments (137.4–203.6 kg/ha) were not significantly different due to compensating differences in runoff depths. Mass losses of total phosphorus (TP) and total nitrogen (TN) in surface runoff were greatest from the no-incorporation (NI) treatments, with reductions in TP loads of 14% for double disk (DD), 43% for cultivator (CU), and 79% for moldboard plow (MP) treatments. Total N load reductions in 2002 were 26% for DD, 70% for CU, and 95% for MP treatments compared to the NI treatments. Nutrient losses following incorporation of manure with the DD or CU methods were not significantly different from the NI treatments. Manure treatments generally had lower runoff depths and sediment losses, and higher phosphorus and nitrogen losses than the control treatments. Subsurface concentrations of NH4–N, NO3–N, and TN were greatest from the MP treatments, whereas subsurface phosphorus concentrations were not affected by tillage method. Ti lage with a cultivator or double disk minimized combined surface and subsurface nutrient losses immediately after annual manure applications.
In Virginia, Mishra et al. (2006) conducted a field-scale plot study, to evaluate the transport of nutrients in runoff from manure and fertilizer applied at P-based agronomic rates to cropland planted to corn. Although the study focused mainly on comparing runoff losses of N and P from different nutrient sources (i.e., poultry litter, dairy manure, inorganic fertilizer), some data on P loads from plots receiving surface applied vs. incorporated dairy manure were reported:
Although no statistical analysis was reported for these data, it appears that somewhat lower TSS loads were observed in pots receiving surface manure application compared to manure incorporation. However, soluble P losses appeared to be higher from surface manure application than from incorporated manure.
In a literature review, the MPCA (2008) reported that all of the reviewed studies found that, compared to tilled plots that did not receive manure, the incorporation of manure into soil can significantly reduce runoff volume and soil loss and does not increase runoff phosphorus levels on an annual basis. It was clearly demonstrated that it is necessary to incorporate manure to prevent the direct surface runoff of solids and phosphorus. However, plots that incorporate manure through tillage have higher soil loss than untilled control plots. Therefore, it is importantto perform incorporation in such a manner as to maintain surface residue through such minimum tillage methods as knifing or injection.
Surface applied Incorporated No manureTSS 132-254 (kg/ha) 248-397 (kg/ha) 214-244 (kg/ha)TP 274-313 246-497 161-258Soluble P 32-113 26-56 22-26
25
Allen and Mallarino (2008) assessed total runoff P (TPR), bioavailable P (BAP), and dissolved reactive P (DRP) concentrations and loads in surface runoff after liquid swine manure application with or without incorporation into soil and different timing of rainfall on two Iowa fields under simulated rainfall. Four replicated manure P treatments were applied to two Iowa soils testing low in P managed with corn–soybean rotations. Total P applied each time was 0 to 80 kg P/ha at one site and 0 to 108 kg P/ha at the other. Simulated rainfall was applied within 24 h of P application or after 10 to 16 d and 5 to 6 mo. Nonincorporated manure P increased DRP, BAP, and TPR concentrations and loads linearly or exponentially for 24-h and 10- to 16-d runoff events. On average for the 24-h events, DRP, BAP, and TPR concentrations were 5.4, 4.7, and 2.2 times higher, respectively, for nonincorporated manure than for incorporated manure; P loads were 3.8, 7.7, and 3.6 times higher; and DRP and BAP concentrations were 54% of TPR for nonincorporated manure and 22 to 25% for incorporated manure. A 10- to 16-d rainfall delay resulted in DRP, BAP, and TPR concentrations that were 3.1, 2.7, and 1.1 times lower, respectively, than for 24-h events across all nonincorporated P rates, sites, and years, whereas runoff P loads were 3.8, 3.6, and 1.6 times lower, respectively. A 5- to 6-mo simulated rainfall delay reduced runoff P to levels similar to control plots. Incorporating swine manure when the probability of immediate rainfall is high reduces the risk of P loss in surface runoff ; however, this benefit sharply decreases with time.
Mueller et al. (1984) used simulated rainfall to compare total P (TP), algal-available P (AAP), and dissolved molybdate-reactive P (DMRP) losses from the conventional, chisel, and no-till systems for corn both with and without surface-applied manure prior to tillage in Wisconsin. Concentrations and losses of TP and AAP among unmanured tillage treatments were similar to trends observed for sediment concentrations and losses. In 1978, the chisel and notill systems were ineffective in reducing TP and AAP losses relative to the conventional system. In contrast in 1979, lower TP and AAP losses occurred from unmanured chisel and no-till sites relative tounmanured conventional sites. In both years of the experiment, surface spread manure increased DMRP concentrations where the manure was not completely incorporated by tillage. In contrast, little difference was observed in DMRP concentrations among unmanured treatments. Manure also increased AAP concentrations for no-till but had only a slight effect and no effect for the chisel and conventional systems, respectively. AAP concentrations from manured sites followed the order no-till > conventional = chisel. Differences in runoff volumes among treatments influenced P losses. Runoff losses were relatively high for no-till, particularly after planting, and losses of DMRP and AAP were very high where manure was surface applied. Often, runoff was reduced for the chisel system relative to other tillage systems, and consequently these reductions increased the effectiveness of this system in reducing P losses. For manured sites, TP losses were significantly lower from chisel tillage (10 g/m2) than either no-till (98 g/m2) or conventional tillage (158 g/m2). AAP losses were also significantly lower from manured chisel sites (7 g/m2) than from conventional sites (29 g/m2) which were in turn lower than from notill sites (98 g/m2).
Gupta et al. (1997) investigated the effects of tillage practices on the saturated hydraulic conductivity, and quantity and quality of surface runoff water resulting from the application of the liquid swine manure to bare soil plots in Ontario, Canada. As part of the study, infiltration experiments were conducted on silt-loam soil with no-tillage (NT) and disk tillage (DT)
4.3 Tillage and Manure Applied Without Incorporation
26
practices. Following tillage, liquid swine manure was applied on test plots, and the rainfall was applied by the portable rainfall simulator. The infiltration data was analyzed for the saturated hydraulic conductivity (K8) and runoff volume determinations. The surface runoff water was analyzed for total N, total P, ammonia, and nitrate concentration determinations. The study indicated that the tillage had significant effects on KS and quantity and quality of runoff water. The KS values of the NT plots were found to vary from 0.693 to 1.734 mm/mm, with a mean of1.494 mm/mm, while they varied from 1.056 to 2.543 mm/mm, with a mean of 2231 mm/mm in the DT plots. The total N, total P, ammonium nitrogen and nitrate nitrogen concentrations werelower in runoff generated from DT plots, compared to that from the NT plots. The chemical concentration levels were significantly different in runoff waters collected one-day after manure application than in those collected 40-days after the manure application. The authors suggested that the DT practice must be preferred over the NT practice if liquid swine manure is used as the fertilizer. [Reviewers’ note: Because these experiments were done on bare soil without crop residue and because the manure was applied after the D treatment was applied, the results apply primarily to the influence of soil surface condition on runoff quantity and quality.]
Zhao et al. (2001) quantified the effects of tillage (moldboard plowing [MP], ridge tillage [RT]) and nutrient source (manure and commercial fertilizer [urea and triple superphosphate]) on sediment, NH4–N, NO3–N, total P, particulate P, and soluble P losses in surface runoff andsubsurface tile drainage from clay loam soil plots in Minnesota. Treatment effects were evaluated using simulated rainfall immediately after corn planting, the most vulnerable period for soil erosion and water quality degradation. Sediment, total P, soluble P, and NH4–N losses mainly occurred in surface runoff. The NO3–N losses primarily occurred in subsurface tile drainage. In combined (surface and subsurface) flow, the MP treatment resulted in nearly two times greater sediment loss than RT ( < 0.01). Ridge tillage with urea lost at least 11 times more NH4–N than any other treatment ( < 0.01). Ridge tillage with manure also had the most total and soluble P losses of all treatments ( < 0.01). If all water quality parameters were equally important, then moldboard plow with manure would result in least water quality degradation of the combined flow followed by moldboard plow with urea or ridge tillage with urea (equivalent losses) and ridge tillage with manure. Tillage systems that do not incorporate surface residue and amendments appear to be more vulnerable to soluble nutrient losses mainly in surface runoff but also in subsurface drainage (due to macropore flow). Tillage systems that thoroughly mix residue and amendments in surface soil appear to be more prone to sediment and sediment-associated nutrient (particulate P) losses via surface runoff.
In Wisconsin, Grande et al. (2005) examined the effects of residue level and manure application timing on phosphorus (P) losses in runoff from no-till corn. Treatments included conventional corn grain (G) and silage (SL; 10- to 15-cm cutting height) and nonconventional, high-cut (60–65 cm) silage (SH) subjected to manure application regimes: no manure (N) or surface application in fall (F) or spring (S). Simulated rainfall (76 mm/h; 1 h) was applied in spring and fall for two years (2002–2003), runoff from 2.0- _ 1.5-m plots was collected, and subsamples were analyzed for dissolved reactive phosphorus (DRP), total P (TP), and P mass distribution in four particle size classes. Total P and DRP loads were inversely related to percent residue cover, but both TP and DRP concentrations were unaffected by residue level. Manure application increased DRP concentrations in spring runoff by two to five times but did not significantly affect DRP loads, because higher concentrations were offset by lower runoff volumes. Spring
P P
P
27
manure application reduced TP loads in spring runoff by 77 to 90% compared with plots receiving no manure, with the extent of reductions being greatest at the lower residue levels (<24%). The TP concentration in sediments increased as particle size decreased. Manure application increased the TP concentration of the 0- to 2- m fraction by 79 to 125%, but elevated the 2- to 10- and 10- to 50- m fractions to a lesser extent. Recent manure additions were most influential in enriching transported sediments with P. By itself, higher residue cover achieved by high-cutting silage was often insufficient to lower P losses; however, the combination of manure application and higher residue levels significantly reduced P losses from corn fields harvested for silage.
Nicolaisen et al. (2007) measured the effects of crop residue on nutrient concentrations in runoff from areas in Nebraska where beef cattle or swine manure were recently applied but not incorporated. On small plots, existing residue materials were removed, and corn, soybean, or winter wheat residue was added at rates of 2, 4, or 8 Mg/ha. Manure was then applied at rates required to meet estimated annual N requirements for corn. Control plots with manure but no residue, and plots with no residue and no manure were also established. Three 30 min simulated rainfall events, separated by 24 h intervals, were conducted at an intensity of approximately 70 mm/h. Dissolved P (DP), total P (TP), NO3- N, NH4- N, total N, runoff, and soil loss were measured for each rainfall event. When beef cattle or swine manure was applied to plots containing residue materials, nutrient concentrations in runoff were not affected by the amount of crop residue on the soil surface. Concentrations of DP and NO3- N in runoff from the plots with beef cattle manure were significantly greater on the plots with residue than on the no-residue treatments. No significant differences in runoff nutrient concentrations were found between the residue and no-residue treatments with swine manure. Concentrations of DP and TP were significantly less on the no-residue/no-manure treatment than on the plots with beef cattle or swine manure.
In Brazil, Ceretta et al. (2010) evaluated the importance of surface runoff in transferring N, P and K under a no tillage system for successive applications of pig slurry. Pig slurry rates of 0, 20, 40 and 80m3/hawere applied, scattered on the surface, before the sowing of each species in a cultivation sequence. Successive applications of pig slurry decreased surface runoff. In relative terms, the K losses were higher than N and P. As regards total nutrients applied through pig slurry, losses through surface runoff were of 2.74, 1.61 and 1.37% of mineral N; 6.29, 5.01 and 3.51% of available P and 17.16, 9.01 and 11.14% of available K, for the three rates of applied pig slurry, respectively. Repeated applications of pig slurry on a no tillage managed soil caused losses of N, P and K from the soil through surface runoff, in the sequence: K>P>N. The losses of N and K are positively related to the volume of surface runoff, whereas the losses of P are positively related to the quantities of P added through pig slurry.
Gilley et al. (2010) reported on a Nebraska study that compared runoff water quality effects resulting from the application of cattle manure derived from corn and distillers grain diets,examined the effects of till and no till conditions on runoff nutrient transport, and compared the water quality impacts of 1 , 2 , and 4 year P-based manure application rates. Simulated rainfall events were applied to 0.75 m wide × 2 m long plots soon after manure application. The runoff load of total P was significantly greater from the no till plots than on the till plots; particulate P
µ µ
-- - -
-
28
and dissolved P loads were also higher from no-till plots, but the differences were not statistically significant. Soil loss did not differ s gnificantly between the tilled and untilled plots.
Ulen et al. (2010) published a review of Scandinavian research on soil tillage methods to control P loss. In Scandinavia high losses of soil and particulate-bound phosphorus (PP) have been shown to occur from tine-cultivated and moldboard-plowed soils in clay soil areas, especially in relatively warm, wet winters. The omission in the autumn of primary tillage (not plowing) and the maintenance of a continuous crop cover are generally used to control soil erosion. In Norway, plowing and shallow cultivation of sloping fields in spring instead of plowing in autumn have been shown to reduce particle transport by up to 89% on highly erodible soils. Particle erosion from clay soils can be reduced by 79% by direct drilling in spring compared with autumn plowing. Field experiments in Scandinavia with plowless tillage of clay loams and clay soils compared to conventional autumn plowing usually show reductions in total P losses of 10–80% by both surface and subsurface runoff (lateral movements to drains). However, the effects of not plowing during the autumn on losses of dissolved reactive P (DRP) are frequently negative, since the DRP losses without plowing compared to conventional plowing have increased up to fourfold in field experiments. In addition, a comprehensive Norwegian field experiment at a site with high erosion risk has shown that the proportion of DRP compared to total P was twice as high in runoff water after direct drilling compared to plowing. Therefore, erosion control measures should be further evaluated for fields with an erosion risk since reduction in PP losses may be low and DRP losses still high.
In Pennsylvania, Verbree et al. (2010) compared runoff from well-drained and somewhat poorly drained soils under corn production that had been in no-till for more than 10 yr. On field plots, dairy manure was broadcast into a fall planted cover crop before no-till corn planting orincorporated by chisel/disk tillage in the absence of a cover crop. Rainfall simulations (60 mm h- 1) were performed after planting, mid-season, and post-harvest. On both soils, no-till yielded significantly less sediment than did chisel/disking. Relative effects of tillage on runoff and P loss differed with soil. On the well-drained soil, runoff depths from no-till were much lower than with chisel/disking, producing significantly lower total P loads (22–50% less). On the somewhat poorly drained soil, there was little to no reduction in runoff depth with no-till, and total P loads were significantly greater than with chisel/disking (40–47% greater). Particulate P losses outweighed dissolved P losses as the major concern on the well-drained soil, whereas dissolved P from surface applied manure was more important on the somewhat poorly drained soil. This study confirms the benefit of no-till to erosion and total P runoff control on well-drained soils but highlights trade-off s in no-till management on somewhat poorly drained soils where the absence of manure incorporation can exacerbate total P losses. The authors pointed out the need to promote methods that inject manure into no-till soils, particularly those with poor drainage. There is increasing recognition that manure injection can help to minimize dissolved P losses in
Dissolved P (kg/ha)
Particulate P(kg/ha)
Total P(kg/ha)
Soil loss(Mg/ha)
Tilled 0.22 0.11 0.28No-till 0.46 0.19 0.24
*total P loads significantly different
0.34*0.64*
29
surface runoff , but care must be taken to ensure that injection techniques do not exacerbate other loss pathways.
In Minnesota, Ginting et al. (1998) evaluated the effects of one-time application of 164 kg P/ha from solid beef manure on soil P dynamics, P uptake by corn grain, and P losses as total P (TP), particulate P (PP), and dissolved molybdate reactive P (DMRP) in both snowmelt and rainfall runoff under ridge tillage (RT) and moldboard plow (MP) systems. Soil P was consistently higher in the manure than no manure treated plots (17.9 vs. 12.3 mg/kg in 1993 and 23.7 vs. 13.8 mg/kg in 1994). P uptake was greater from the manure than no manure treated plots (24.5 vs. 19.8 kg/ha and 23.5 vs. 18.8 kg/ha). Annual PP and TP losses were either similar or lower from manure than no manure treated plots. Particulate P losses by rainfall runoff were lower from the RT vs.MP systems (0.25 vs. 1.95 kg/ha in 1993 and 0.06 vs. 0.65 kg/ha and 1994). The loadings of dissolved reactive phosphorus from ridge till systems were higher for those plots that received manure than for the plots that did not receive manure. This was due to the accumulation of phosphorus near the soil surface for manured ridge-tilled plots. DMRP losses in snowmelt, were higher from the RT than MP system (0.11 vs. 0.01 kg/ha and 0.14 vs. 0.03 kg/ha) in snowmelt runoff as well. Overall, the authors concluded that the RT system is an environmentally better system than the MP system due to its substantial reduction in annual PP and TP losses.
Bundy et al. (2001) reported on field experiments with treatments including differing soil test P levels, tillage and manure application combinations, and dairy manure and biosolids application histories to assess these management practice effects on P losses corn plots in Wisconsin. Runoff from simulated rainfall was collected from 0.83-m2 areas for 1 h after rainfall initiation and analyzed for dissolved reactive P (DRP), bioavailable P, total P (TP), and sediment. In no-till corn, both DRP concentration and load increased as Bray-1 soil test (STP) increased from 8 to 62 mg/kg. A 5-yr history of manure or biosolids application greatly increased STP and DRP concentrations in runoff. The 5-yr manure treatment had higher DRP concentration but lower DRP load than the 5-yr biosolids treatment, probably due to residue accumulation and lower runoff in the manure treatment. Studies of tillage and manure application effects on P losses showed that tillage to incorporate manure systems generally lowered runoff DRP concentration but increased TP concentration and loads due to increased sediment loss. Management practices have a major influence on P losses in runoff in corn production systems that may overshadow the effects of STP alone.
Shelton (2004a, b, and c) conducted a series of studies using liquid swine waste applied to various crops in Nebraska to: 1) determine the influence that commercially available soil-engaging components used to simultaneously apply and incorporate manure have on the reduction of crop residue cover; and 2) determine and evaluate some of the factors that may influence the amount of residue cover reduction that occurs with these components. Seven different configurations of manure injectors/applicators were operated in residue from irrigated and non-irrigated corn, soybeans and oats in the fall and/or spring of three different crop years.Averaged across crop, year and season, residue cover reduction was significantly less for coulter-type applicators than for disk-type applicators (P<0.001), disk-type applicators reduced residue cover significantly less than chisel and sweep injectors (P<0.001), and chisel and sweep injectors
4.4 Manure Incorporated into Different Tillage Systems
30
reduced residue cover similar to a tandem disk (P=0.398). Spacing between injector/applicator units, applicator profile width at the soil surface, and field speed all had a significant influence on the amount of residue cover reduction and soil disturbance that occurred. Residue cover was reduced by an average of 82% when sweep points were used on a manure injector, compared with a 71% reduction when chisel points were used, a highly significant difference. Ranges of values to estimate the percentage of the initial amount of corn (non-fragile) residue cover that will remain following the use of manure application/ incorporation components are: chisel and sweep injectors, 30 to 65%; disk-type applicators, 40 to 65%; and coulter-type applicators, 80 to 95%. Similarly, for soybean or oat (fragile) residue, estimates of the initial residue cover remaining are: chisel and sweep injectors, 5 to 15%; disk-type applicators, 15 to 40%; and coulter-type applicators, 65 to 80%. The author concluded that certain configurations of manure application/incorporation equipment may leave adequate residue cover for acceptable soil erosion control, particularly in non-fragile residue. However, the equipment must be selected, adjusted and operated with the dual objectives of residue and manure management, rather than used simply as a means of manure disposal.
Kleinman et al (2009) evaluated losses of P in sub-surface and surface flow as a function of dairy manure application to no-till soils in north-central Pennsylvania. Monitoring of a perennial spring over 36 months revealed that dissolved reactive P (DRP) concentrations increased 3- to 28-fold above background levels whenever manure was broadcast to nearby field soils. A study conducted with 30-cm deep intact soil cores indicated that incorporation of manure by tillage lowered P loss in leachate relative to broadcast application, presumably due to the destruction of preferential flow pathways. More P was leached from a sandy loam than a clay loam soil,although differences between soils were not as great as differences between application methods. In contrast, rainfall simulations on 2-m2 field runoff plots showed that total P (TP) losses in surface runoff differed significantly by soil but not by application method. Forms of P in surface runoff did change with application method, with DRP accounting for 87 and 24% of TP from broadcast and tilled treatments, respectively. Although environmentally significantconcentrations of TP were observed in leachate samples after manure application (>0.12 mg/L), losses of TP in leachate from manured columns over 7 weeks (0.22–0.38 kg P/ha) were considerably lower than losses in surface runoff from manured plots subjected to a single simulated rainfall event (0.31–2.07 kg TP/ha). The most acute risk of manure P loss by leaching and surface runoff was immediately after manure was applied, consistent with the concept of rapid incidental transfer that has been established with surface runoff. Even so, when normalizedby the different depths of precipitation applied to the lysimeters and runoff plots, the first leaching event after manure application resulted in an average TP loss of 0.07 kg/ha/cm rainfall, compared with 0.17 kg/ha/cm rainfall in surface runoff. Application of manure to no-till soils clearly increased P losses in leachate and surface runoff relative to losses before manure was applied, regardless of application method and soil properties Tilling soils that were broadcast with manure significantly lowered P losses in leachate relative to broadcasting manure, supporting the hypothesis that tillage destroys macropores that serve as the dominant pathway for subsurface P transport. However, tillage did not significantly lower the loss of TP in surface runoff, as tillage increased sediment-bound P loss in surface runoff relative to broadcasting, shifting the mechanism of P loss from rapid incidental transfer of soluble P in manure to
31
erosion. Results confirm the near-term benefits of incorporating manure by tillage to protect groundwater quality, but suggest that for surface water quality, avoiding soils prone to runoff is more important.
The studies reported in this section are not entirely levant to the LCB – for example the application of liquid fertilizer or poultry litter rather than dairy manure. However, the results obtained may be at least partially applicable to local issues of tillage and manure application to cropland.
Kimmell et al. (2000) conducted a study to determine the influence of tillage and P placement on P losses in runoff water from a somewhat poorly drained soil in Kansas in a grain sorghum-soybean rotation. Chisel-disk-field cultivate (ChT), ridge-till (RT), and no-till (NT) in combination with 0 kg P/ha or 24 kg P/ha broadcast or knifed (applied prior to planting grain sorghum) were studied. [Reviewer’s note: the P source was liquid fertilizer, not manure; however some conclusions may be relevant.] Runoff volume and losses of sediment and P were summed over the growing season. Significant interactions between tillage and P placement for soluble P losses were found. For example, soluble P loss in 1999 for NT-broadcast in grain sorghum was 358 g/ha; significantly greater than 31 g/ha for NT-knife 23 g/ha for NT-check. Similar results were found for RT but no such differences were found for ChT. Bioavailable P losses were generally highest with broadcast P placement and for NT and RT. Total P losses were significantly higher at 959 g/ha with broadcast P on grain sorghum in 1998, compared with 521 g/ha for the check and 659 g/ha for the knifed P applications. Total P losses in 1999 for soybeans were only 18 g/ha for NT, which was significantly lower than 75 g/ha for ChT and 66 g/ha for RT. The results indicate that broadcast P applications on RT and NT will increase P losses, but the influence of tillage was not consistent.
In North Carolina, Tarkalson and Mikkelsen (2004) measured P losses in runoff from a bare Piedmont soil receiving broiler litter or inorganic P fertilizer either incorporated or surface-applied at varying P application rates (inorganic P, 0–110 kg P/ha; broiler litter, 0–82 kg P/ha). Rainfall simulation was applied at a rate of 76 mm/h. Runoff samples were collected at 5-min intervals for 30 min and analyzed for reactive P (RP), algal-available P (AAP), and total P (TP). Incorporation of both P sources resulted in P losses not significantly different than the unfertilized control at all application rates. Incorporation of broiler litter decreased flow-weighted concentration of RP in runoff by 97% and mass loss of TP in runoff by 88% compared with surface application. Surface application of broiler litter resulted in runoff containing between 2.3 and 21.8 mg RP/L for application rates of 8 to 82 kg P/ha, respectively. Mass loss of TP in runoff from surface-applied broiler litter ranged from 1.3 to 8.5 kg P/ha over the same application rates. Flow-weighted concentrations of RP and mass losses of TP in runoff were not related to application rate when inorganic P fertilizer was applied to the soil surface.
In Georgia, Franklin et al. (2007) quantified and compared N and P losses from plots planted in cotton managed under conventional (CT) or strip-till (ST) systems. At the beginning of the experiment, only N starter fertilizer was applied; all plots had received poultry litter the previous
4.5 Other Studies
32
fall. Results showed that the effect of tillage on nutrient losses in runoff had contrasting results depending on nutrient fraction. Strip tillage treatments lost significantly more dissolved nutrientswhile CT treatments lost significantly more total N and P. Overall, however, ST treatments retained more N and P. In fact, total P losses were more than nine times greater in the CT treatments (493.0 TKP g/ha) than DRP losses in the ST treatments (53.3 PO4–P gP/ha). This indicates that ST systems may be losing more soluble fractions than CT systems butonly a fraction of the total N and P being lost to the environment through overland flow is from CT systems.
Kaiser et al. (2009) assessed P loss immediately after poultry manure application to soybean residue with and without tillage at eight Iowa fields. Poultry litter was applied at intended rates of 0, 84, or 168 kg total N/ha (total P was 0, 21–63, 50–123 kg P/ha, respectively) with three replications. Simulated rainfall was applied to 3-m2 sections of larger field plots with 2 to 7% slope, usually within 2 d of application, to collect runoff during 30 min. Runoff was analyzed for concentrations of sediment, dissolved reactive P (DRPC), bioavailable P (BAPC), and total P (TPRC). Non-incorporated manure consistently increased ( = 0.10) concentrations of all runoff P fractions in five sites, but there were increasing trends at all sites, and on average manure increased DRPC, BAPC, and TPRC 32, 23, and 12 times, respectively, over the control. Tillage to incorporate manure reduced DRPC, BAPC, and TPRC by 88, 89, and 77% on average, respectively, although in non-manured plots tillage seldom affected DRPC or BAPC and oftenincreased TPRC. Tillage increased sediment concentration in runoff but not enough to offset the benefits of manure P incorporation. Runoff P loads generally followed trends of runoff P concentrations but were more variable, and significant treatment effects were less frequent. Overall, incorporation of manure by tillage was very effective at reducing P loss during runoff events shortly after poultry manure application under the conditions of this study.
Allen B.L. and A.P. Mallarino. 2008. Effect of Liquid Swine Manure Rate, Incorporation, and Timing of Rainfall on Phosphorus Loss with Surface Runoff. 37:125–137.
Bundy, L.G., T.W. Andraski, and J.M. Powell. 2001. Management practice effects on phosphorus losses in runoff in corn production systems. . 30:1822–1828.
Ceretta, C.A., E.Girotto, C.R. Lourenzi, G.Trentin, R. C.B.Vieira, and G. Brunetto. 2010.Nutrient transfer by runoff under no tillage in a soil treated with successive applications of pig slurry. 139:689–699.
Daverede, I. C., A.N. Kravchenko, R.G. Hoeft, E.D. Nafziger, D. G. Bullock, J.J. Warren, and L.C. Gonzini. 2004. Phosphorus runoff from incorporated and surface-applied liquid swine manure and phosphorus fertilizer . 33:1535–1544.
P
J. Environ. Qual.
J. Environ. Qual
Agric. Ecosys. Environ.
J. Environ. Qual
REFERENCES
33
Franklin, D., C. Truman, T. Potter, D. Bosch, T. Strickland, and C. Bednarz. 2007. Nitrogen and phosphorus runoff losses from variable and constant intensity rainfall simulations on loamy sand under conventional and strip tllage systems. 36:846–854.
Gaynor, J.D., and W.I. Findlay. 1995. Soil and phosphorus loss from. conservation and conventional tillage in corn production. 24:734–741.
Gilley, J.E., L.M. Durso, R.A. Eigenberg, D.B. Marx, and B.L. Woodbury. 2010. Nutrient transport in runoff as affected by diet, tillage, and manure application rate. 53:1895-1902.
Ginting, D., J.F. Moncrief, S.C. Gupta, and S.D. Evans. 1998. Interaction between manure and tillage system on phosphorus uptake and runoff losses. 27:1403-1410.
Grande, J.D., K. G. Karthikeyan, P.S. Miller, and J.M. Powell. 2005. Corn residue level and manure application timing effects on phosphorus losses in runoff. . 34:1620–1631.
Gupta, R. K., R.P. Rudra, W.T Dickinson, and G.J. Wall. 1997. Surface water quality impacts of tillage practices under liquid swine manure application. 33(3):681-687.
Kaiser D.E, A.P. Mallarino, M.U. Haq, and B.L. Allen. 2009. Runoff phosphorus loss immediately after poultry manure application as influenced by the application rate and tillage.
. 38:299–308.
Kimmell, R.J., G.M. Pierzynski, K.A. Janssen, and P.L. Barnes. 2001. Effects of tillage andphosphorus placement on phosphorus runoff losses in a grain sorghum–soybean rotation.
30:1324–1330.
Kleinman, P.J.A., A.N. Sharpley, L.S. Saporito, A.R. Buda, and R,B. Bryant. 2009.Application of manure to no-till soils: phosphorus losses by sub-surface and surface pathways.
84:215–227.
Little, J.L., D. R. Bennett, and J.J. Miller. 2005. Nutrient and sediment losses under simulated rainfall following manure incorporation by different methods. 34:1883–1895.
Minnesota Pollution Control Agency (MPCA). 2008. Runoff reductions with incorporated manure - A Literature Review. MPCA Feedlot Program. St. Paul, MN.
Mishra, A., B.L. Benham, and S. Mostaghimi. 2006. Sediment and nutrient losses from field-scale cropland plots treated with animal manure and inorganic fertilizer.
. 175: 61–76
Mueller, D. H., R.C. Wendt, and T.C. Daniel. 1984. Phosphorus losses as affected by tillage and manure application. 48:901-905.
J. Environ. Qual.
J. Environ. Qual.
Trans. ASABE
J. Environ. Qual.
J. Environ. Qual
J. Am. Water Resour. Assoc.
J. Environ. Qual
J. Environ. Qual.
Nutr. Cycl. Agroecosyst.
J. Environ. Qual.
Water, Air, and Soil Poll
Soil Sci. Soc. Am. J.
34
Nicolaisen, J.E., J.E. Gilley, B. Eghball, and D.B. Marx. 2007. Crop residue effects on runoff nutrient concentrations following manure application. 50(3):939 944.
Romkens, M.J., D.W. Nelson, and J.V. Mannering. 1973. Nitrogen and phosphorus composition of surface runoff as affected by tillage method. . 2:292–295.
Shelton, D.P. 2004a. Crop residue cover and manure incorporation, Part I: Reduction ofcover. Nebraska Swine Report 2004, University of Nebraska, Lincoln, pp. 50-53.
Shelton, D.P. 2004b. Crop residue cover and manure incorporation, Part II: Factors influencing cover reduction.
Shelton, D.P. 2004c. Crop residue cover and manure incorporation, Part II: Reduction ofcover. Nebraska Swine Report 2004, University of Nebraska, Lincoln, pp. 53-57.
Tarkalson, D.D. and R.L. Mikkelsen. 2004. Runoff phosphorus losses as related to phosphorus source, application method, and application rate on a Piedmont soil. 33:1424–1430.
Ulen, B., H. Aronsson, M. Mechmann, T. Krogstad, L. Oygarden, and M. Stenberg. 2010. Soil tillage methods to control phosphorus loss andpotential side-effects: a Scandinavian review. Soil Use and Management. 26:94–107.
Verbree, D.A., S.W. Duiker, and P.J.A. Kleinman. 2010. Runoff losses of sediment and phosphorus from no-till and cultivated soils receiving dairy manure. . 39:1762–1770.
Zhao, S.L., S.C. Gupta, D.R. Huggins, and J.F. Moncrief. 2001. Tillage and nutrient source effects on surface and subsurface water quality at corn planting. 30:998–1008.
Trans. ASABE
J. Environ. Qual
J. Environ. Qual.
J. Environ. Qual
J. Environ. Qual.
-
Appl. Eng. in Agric. Vol. 20(5):613-621.
35
A grassed waterways (GWW) is defined as a broad shallow channel established with suitable vegetation to carry channelized surface runoff from agricultural land at a non-erosive velocity to a stable outlet, thereby preventing gullying along a natural drainage way. Secondary functions include reducing runoff volume and velocity and retaining sediment and other pollutants from adjacent fields. GWWs have traditionally been applied primarily for their drainage and erosion-prevention functions, rather than for water quality purposes. However, GWWs often have significant water quality benefits. Because of their potential for high sediment trapping efficiency, for example, frequent mowing of GWWs is often recommended to reduce hydraulic roughness because otherwise the high sediment-trapping efficiency may damage the vegetation or even lead to ephemeral gullying.
There has not been a great deal of research on the individual effectiveness of GWWs in reducing P and sediment losses from agricultural land. In fact, most of the directly relevant results have been reported from a single long-term study site in Germany. Most other reported work has focused on the combined effectiveness of a suite of conservation practices that includes GWW, making it impossible to separate the performance of a single practice. However, to the extent that GWWs can be considered to be similar to longitudinal vegetated filter strips, some of the more extensive literature on VFS performance may be co vant. While that entire body of literature is not reviewed in detail here, some performance principles are worthy of consideration.
Fiener and Auerswald (2003a, 2003b, 2006a, 2006b, and 2009) conducted a long-term study of GWWs in southern Germany. The terrain and climate of the study area was generally comparable to that of the LCB, however the crops were considerably different, including wheat, potatoes, and corn.
The objectives of the first reported study (Fiener and Auerswald 2003a) were to measure the effectiveness of a GWW when field erosion was well-controlled and to analyze the underlying mechanisms of GWW performance. The study was conducted using a paired-watershed design and included evaluation of GWW maintenance issues. Runoff was reduced by 90% by a wide (10-25m), flat-bottomed GWW and by 10% in a narrow (1 m) V-shaped drainageway. The different styles of GWWs reduced sediment delivery by 97% and 77%, respectively. Particle sizes >50 m were settled due to gravity in both GWWs; smaller particles were primarily settled due to infiltration, which was higher in more effective runoff reduction. Sediment removal was driven almost entirely by these processes; the effect of “sieving” by standing vegetation was negligible. Due to intensive erosion control on the contributing fields, it was possible to neglect vegetation maintenance within the GWW without adverse effects by excessive sedimentation with the drainageway. The authors concluded that GWWs have a high potential for reducing runoff volume and velocity, sediments, and agrichemicals coming from agricultural watersheds.
5.0 Grassed Waterways
5.1 Introduction
5.2 Grassed Waterway Performance
µ
36
In another study from the same sites, Fiener and Auerswald (2003b) evaluated a GWW on a 14 ha field, half of it seeded and the remainder left for natural succession over an 8-year period. During the experiment, the GWW reduced runoff and sediment delivery from the field by 39% and 82%, respectively. Annual runoff was reduced in 6 of 7 years observed. The runoff reduction was due to three actions: higher infiltration rate in the GWW than in the field, highersurface storage capacity compared to the field without the GWW, and reduction of runoff velocity, allowing more time for infiltration. Sediment delivery was significantly reduced in all study years, primarily due to by infiltration-induced sedimentation and sediment settling due to a reduced transport capacity and a prolonged runoff travel time. In addition to these effects, the GWW improved biodiversity on the research farm and acted as a refuge for beneficial organisms. Soil mineral N content decreased by 84% after the installation of the GWW, indicating that although infiltration into the GWW was rapid, the risk of groundwater contamination from leached nitrate was diminished.
Again using the same site, Fiener and Auerswald (2006a) evaluated the seasonal variation in runoff reduction and sediment trapping in a GWW. Runoff and sediment delivery were measured between 1994 and 2001 in two paired subwatersheds, both optimized to reducerunoff and erosion by an intensive soil conservation system within the fields. In one of the subwatersheds included a 290 m long, 37 m wide. During the observation period, the GWWreduced runoff and sediment delivery by 87% and 93%, respectively. Seventy percent of total outflow and 68% of total sediment output occurred between February and April, mainly controlled by watershed hydrology. Seasonal changes in GWW properties, namely soil water content and hydraulic roughness, had a minor effect, most notably in May and June, when available field capacity averaged 59% while inflow was dominated by single heavy rain events (15% of total inflow). In general, the results indicate the high potential of GWWs for reducing runoff and sediment delivery, especially if combined with an intensive soil and water conservation system in the draining fields. For conservation planning, the least effectiveness at the end of winter should be taken into account.
Noting that the effects of GWW in large watersheds was essentially unknown, Fiener and Auerswald (2006b) analyzed the effects of GWW on large (>1000 ha) watersheds using a CN modeling approach in a region of Germany dominated by wheat-barley-sugar beet-corn production. Two summers, one prior to and one after small grain harvest, and one winter condition and recurrence times of 2, 10, 20 and 50 yr were taken into account. Land use was assumed to be either dominated by arable land (80%) or varying between sub-watershedswith arable land contributing only 45% on average. Under predominantly arable land use2.3% of the total land was found suitable to be converted to GWWs, while for a diversifiedland use only 0.8% of the total land called for a GWW. For all conditions the efficacy ofGWWs to reduce runoff volume and peak discharge decreased only slightly with increasingwatershed size. Under arable land use and summer conditions-runoff volume was reducedby about 30% and peak discharge by about 40% with somewhat higher values for more frequentstorms and lower values for rare storms. The efficacy was considerably lower underwinter conditions and for a diversified land use where only a small proportion of GWWs wasassumed. Runoff reduction was affected more and may drop below 5% under unfavorableconditions (low GWW percentage, winter, large events) while still a reduction in peak dischargeof at least 15% was observed even under most of the unfavorable conditions despite
37
a loss of land of only 0.8%. GWWs hence contribute considerably to flood control even inwatersheds larger than 1000 ha and especially when summer floods are the main problem.
In general, the authors concluded that the efficacy of GWWs is low where land use and storm size produce high amounts of inflow into the GWWs. This is especially critical in winter because then hydraulic roughness of the grass cover will drop due to a reduced flexural rigidity under these conditions. Nevertheless, even in case of a failure of vegetation, GWWs will increase runoff travel time by preventing gully erosion which causes a concentration of runoff and an increase in runoff velocity. The efficacy in runoff reduction is also low, where the whole area produces only very little runoff like in forested watersheds because then runoff only occurs for storms, which also produce runoff on the GWW itself. The highest efficacy, however, can be expected in watersheds of small-patterned arable land use typical for many European landscapes
Finally, Fiener and Auerswald (2009) investigated the performance of GWW on dissolved reactive P (DRP) in the same region of Germany. The effect on DRP was tested in a landscape-scale study where DRP concentrations and loads in surface runoff were measured in two watersheds in which GWWs were newly installed and increased in effectiveness over time. Both watersheds were compared with paired watersheds without GWW installation; all watersheds were continuously monitored over 5 yr (1993–1997). Data showed only a small differencein DRP concentrations between throughfall under growing crops and grass and in runoff from bare or straw covered soil surfaces. Thus, the introduction of a relatively small grassed area had little effect on the DRP concentration in surface runoff from the total watershed. This finding was supported by the watershed data, where watersheds with and without GWW showed similar DRP concentrations. No change in DRP concentrations occurred over the 5-yr period.
The results suggested that hydrodynamically rough GWWs, which provide dense vegetationcover throughout the year but cover only a small area along the path of concentrated flow, exert only a small influence on the DRP concentration at the outflow. Therefore, GWWs will reduce DRP loads only in proportion to their reduction in total surface runoff.
Mishra et al. (2006) investigated the effects of slope and vegetative cover on outflow, sediment concentration, and deep percolation in channels covered with Bermuda grass in a hydraulic tilting flume in India. In bare soil conditions, the mean sediment concentration in the outflowincreased by 5 times at 5% slope compared to 1% bed slope. Introduction of vegetative covers reduced the sediment concentration and increased the water infiltration considerably compared to the control. The study indicated that 25% vegetative cover may be acceptable for 1.0% land slope and at higher slopes higher percentages of vegetative cover may be recommended. When the interaction between the slope and vegetative cover was taken into account it was preferred to go to 25% vegetative cover at the beginning and allow the vegetation to develop to 100% cover in due course.
Chow et al. (1999) studied the effects of a combined contour planting, diversion terraces and GWWs on potato fields in New Brunswick, Canada. Runoff from the basin with up-and-down slope cultivation when planted to potatoes was 24 – 35% of accumulated rainfall, whereas,
5.3 Combined Practice Performance
38
runoff was only 2 - 7% of rainfall from the terraced basin, where potatoes were planted at a minimum grade along the contour. Soil loss from the up-and-down slope cultivation of potatoes was 15 - 25 t/ha; with terraces, grassed waterway, and contour planting of potatoes, annual soil loss was reduced to 0.2 – 1.7 t/ha. The measured soil losses during the study period were well within the tolerance limit, the objective of treatment. Average soil loss over 3 years from up-and-down slope cultivation of potatoes was approximately 20 times greater than that from the basin with diversion terraces and grassed waterway. It is, of course, impossible to separate out the individual effect of the GWW in this experiment.
Noting that GWW are generally ineffective on dissolved pollutants, Shipitalo et al. (2010)routed runoff from one tilled (0.67 ha) and one no-till watershed (0.79 ha) planted to corn into parallel, 30-m-long grassed waterways. Two 46-cm diam. filter socks filled with composted bark and wood chips were placed 7.5 m apart in the upper half of one waterway and in the lower half of the other waterway to determine if they decreased concentrations of sediment and dissolved chemicals. The filter socks had no significant effect on sediment concentrations for runoff from the no-till watershed, but contributed to an additional 49% reduction in average sediment concentration compared with unamended waterways used with the tilled watershed. The filter socks significantly increased the concentrations of Cl, NO3–N, PO4–P, SO4, Ca, K, Na, and Mg in runoff from at least one watershed, probably due to soluble forms of these ions in the compost. The estimated additional amounts of these ions contributed by the socks each year ranged from 0.04 to 1.2 kg, thus were likely to be inconsequential. The filter socks contributed to a significant additional reduction in dissolved glyphosate (5%) and alachlor (18%) concentrations for the tilled watersheds, but this was insufficient to reduce alachlor concentrations to acceptable levels.
In a modeling study, Bracmort et al. (2006) tried to determine the long-term water quality impact of structural BMPs of structural BMPs – grassed waterways, grade stabilization structures,field borders, and parallel terraces – in the Black Creek Watershed on sediment and P loads using the SWAT model. The BMPs were represented by modifying SWAT parameters to reflect the impact the practice has on the processes simulated within SWAT, both when practices are fully functional and as their condition deteriorates. The assumed function of GWW to reduce water flow and channel erosion in the channel network was simulated in SWAT by increasing channel cover, reducing channel erodibility, and increasing channel roughness. Based on simulations in two subwatersheds, BMPs in good condition reduced the average annual sediment yield by 16% to 32% and the average annual P yield by10% to 24%. BMPs in their current degraded condition reduced sediment yield by only 7% to 10% and phosphorus yield by 7% to 17%.
Zhou et al. (2009) used the Water Erosion Prediction Project (WEPP) model to evaluate the effectiveness of different BMPs on a corn-soybean rotation in Iowa. They reported that GWWs were very effective in reducing sediment yield through minimizing channel erosion and retaining sediments from upland fields, particularly where excessive erosion occurred. For example, the reduction in annual sediment yield was approximately 16 T/ha (40%) in one region, when a combination of GW and CP system were used. The BMPs were generally more effective in areas with high water erosion potential than in the flat areas. When added to chisel plow tillage, a GWW reduced estimated annual sediment yield from 3.2 to 20.3 t/ha/yr, or 22 – 63% compared to chisel plow tillage alone. When combined with strip tillage, a GWW reduced
39
estimated sediment yield by 0.1 to 2.4 t/ha/yr, or 5 – 27% compared to strip tillage alone Finally, when combined with no-till, a GWW reduced estimated sediment yield by 0.1 to 2.76 t/ha/yr, or 9 – 57% compared to no-till alone. Note that sediment yields from no-till were much lower than from strip tillage and sediment yield from strip tillage were much lower than from chisel plowing.
As noted earlier, in some senses, GWWs can be thought of as long grass buffer strips, at least under low-flow conditions. There is an enormous literature on the effectiveness of grass buffers, ranging from plot to watershed studies, under a variety of circumstances. Dorioz et al. (2006) synthesized understanding of grass buffer effects on P dynamics in the agricultural landscape and concluded that despite variable results in a diversity of landscape contexts, overall, the use of grass buffer strips appears to provide useful short-term functions in the reduction of P transport to surface waters. Long-term benefits remain questionable given the relatively short-term use of this approach in P reduction and the lack of long-term experimental results, but this current lack of data is not sufficient to deter the continued incorporation of grass buffer strips in the landscape of French agriculture. Additionally, a more comprehensive conceptual model integrating the short term functioning of grass buffer strips with seasonal cycles and the long-term consequences of cumulative storage emerged from the synthesis.
The authors report that the effectiveness of grass buffer strips in reducing the volumes of runoff water varies, according to studies, from 3% to nearly 100%, with half of the reductions fallingbetween 40 and 100%. Sediment retention ranges from 40 to 100%, with more than 50% reduction in more than 95% of the cases. The same range of variation is found for particulate-P, with the reduction rate ranging from 50 to 97%. It is never 100% effective under the conditions tested because the clays, which are often heavily loaded with phosphorus, are only weakly retained. Generally, the effectiveness of grass buffer strips with regard to particulate-P and sediments is very similar given their close functional relationship. The situation is very different for the dissolved forms of P, whose retention percentage varies from -83 to +95, with the most common values being around 20–30%. Although dissolved-P is not dominant form of P in agricultural runoff, these contrasting retention values result in large differences in the retention of total-P (between 8 and 97%). Dimensions, vegetation (roughness), and soil texture/structure are discussed as major determinants of buffer effectiveness. The authors also discuss long-term loss of buffer effectiveness due to sediment accumulation and P saturation; recall that sediment accumulation was noted as an issue in GWW by Fiener and Auerswald (e.g., 2003a).
Bracmort, K.S., M. Arabi, J.R. Frankenberger, B.A. Engel, and J.G. Arnold. 2006. Modeling long-term water quality impact of structural BMPs. 49(2):367- 374.
Chow, T. L., H. W. Rees, and J. L. Daigle. 1999. Effectiveness of terraces/grassed waterway systems for soil and water conservation: A field evaluation. 54(3):577–583.
5.4 Grass Buffer Strips
REFERENCES
Trans. ASABE
J. Soil Water Cons.
40
Dorioz, J.M., D. Wang, J. Poulenard, and D. Trevisan. 2006. The effect of grass buffer strips on phosphorus dynamics—A critical review and synthesis as a basis for application in agr lturallandscapes in France. . 117:4–21.
Fiener, P. and K. Auerswald. 2003a. Effectiveness of grassed waterways in reducing runoff and sediment delivery from agricultural watersheds. 32:927-936
Fiener, P. and K. Auerswald. 2003b. Concept and effects of a multi-purpose grassed waterway. . 19:65-72.
Fiener, P. and K. Auerswald. 2006a. Seasonal variation of grassed waterway effectiveness inreducing runoff and sediment delivery from agricultural watersheds in temperate Europe.
87:48–58.
Fiener, P. and K. Auerswald. 2006b. Influence of scale and land use pattern on the efficacy ofgrassed waterways to control runoff. 27:208–218.
Fiener, P. and K. Auerswald. 2009. Effects of hydrodynamically rough grassed waterways on dissolved reactive Phosphorus loads coming from agricultural watersheds. 38:548–559.
Mishra, P.K., J.K. Neelkanth, B. Maheswara Babu, and S.S. Kumathe. 2006. Effectiveness of Bermuda grass as vegetative cover in grassed waterway: A simulated study. 132(3): 288–292.
Shipitalo, M.J., J.V. Bonta, E.A. Dayton, and L.B. Owens. 2010. Impact of grassed waterways and compost filter socks on the quality of surface runoff from corn fields. 39:1009–1018
Zhou, X., M. Al-Kaisi, and M.J. Helmers. 2009. Cost effectiveness of conservation practices in controlling water erosion in Iowa. 106:71–78.
Agric. Ecosyst. and Environ
J. Environ. Qual.
Soil Use and Manage
Soil & Tillage Research
Ecol. Eng.
J. Environ. Qual.
J. Irr. Drain. Eng,
J. Environ. Qual.
Soil & Tillage Res.
41
APPENDIX: Literature review of grass buffer effectiveness
Performance data for VFS treating runoff from cropland are summarized in Tables 3 and 4.
Alberts et al. (1981) reported that a 3 m wide strip with corn residue cover was effective in reducing sediment, N, and P loads from bare tilled soi lope in IN. Filter strips 1.8 m and 2.7 m wide with 50% residue cover reduced sediment and nutrients lost from the field:
Sediment Total N Available P1
Length In Out % red. In Out % red In Out % red------------------------------------kg/hr/m width of plot-----------------------------------
1.8 m 15.8 6.1 61% 34.5 17.3 50% 1.39 0.70 50%2.7 m 22.7 4.9 78% 45.3 14.1 69% 2.63 0.48 82%1 determined by Bray 1 analysis of sediment
Nutrients were analyzed by soil analysis of sediment; dissolved forms were not considered. The authors noted that concentrations of N and P on sediment leaving the residue strips increased due to changes in particle size distribution and enrichment and present extensive data on sediment particle size.
Williams and Nicks (1988) used the model CREAMS to evaluate the effectiveness of grassed filter strips on soil loss from OK cropland in wheat production. For a 2.4% slope with a good grass stand (Manning’s n=0.6), a 15 m filter strip reduced soil loss:
Concave-convex shape 29%Concave 26%Uniform 33%
Soil loss on the original slope decreased as filter strip width or grass stand quality increasedAs soil loss decreased, clay enrichment ratio increased due to selective filtration of larger particles.
Lee et al. (1989) modeled P transport through a grassed VFS and concluded that removal of sediment and nutrients from surface runoff by a VFS is primarily the result of infiltration of dissolved nutrients and reductions in sediment transport capacity caused by infiltration and increased resistance to overland flow. Sediment deposition is major P trapping mechanism in a VFS. The authors presented a model for P movement during overland flow thru a VFS. Data collected for model verification showed improved sediment and P removal with increasing VFS length and also illustrated effects on sediment particle size distribution:
-----------------------% reduction------------------------VFS length TSS part P sol P TP Fine Med. Coarse 4.6 m 56 56 54 -- 30 42 94
Grassed Filter Strips
Filter strips to treat runoff from fallow or row cropland
42
9.1 m 80 79 -- 78 49 70 96
Extensive data for individual treatments from plot/simulated rain studies on in VA are presented in Dillaha et al. (1989). For all treatments, the source area consisted of an ~18 m bare soil area, fertilized and tilled before experiments.
A 4.6 m VFS reduced TSS loads by 53 - 86%, with an average reduction of 70%. A 9.1 m strip reduced TSS loads 70 – 98%, for an average 84% reduction. The authors observed that most sediment removed was deposited in first few meters of the strip. The effectiveness of the VFS decreased with time because of partial inundation by accumulating sediment.
TP followed same trend as TSS. A 4.6 m strip reduced loads by 49 - 85%, with an average reduction of 69%. A 9.1 m strip reduced TP loads 65 – 90%, for an average 82% reduction.P removal effectiveness diminished with successive runs; there was a tendency for previously trapped P to be released from vegetation and soil during later runs as soluble P. Yields of soluble P often exceeded inflows during later runs. Reductions in PO4-P ranged from –83% to +69% on the 4.6 m strip, and from –31% to +48% on the 9.1 m strip.
TN removal performance followed the same trend as TP, but removal percentages were slightly lower. A 4.6 m strip reduced TN loads an average 63%, NH4-N by 50% and NO3-N by 27%.A 9.1 m strip reduced TN loads by an average 76%, NH4-N by 72% and NO3-N by 57%. VFS were only moderately effective in removing soluble P and N; soluble P and N was sometimes higher in outflow than in inflow.
The authors noted a tendency for the steepest plots (16%) to have the lowest % reductions. A qualitative evaluation suggested that most VFS in the real world do not perform nearly as well as plots, especially in hilly areas, due to concentrated flow from natural drainageways in fields.
Magette et al. (1989) reported data from a MD runoff plot/simulated rain study of a fallow source area treated with fertilizer/manure contributing runoff to 4.6 and 9.2 m grass strips. The ratio of source area to VFS area was ~5:1 and ~2.4:1. Detailed tabular data are given on mass losses of TSS, TP, TN from plots and source areas.
TP TNAve losses from bare plots 13.7 kg/ha 16.4 kg/haAve losses from 9.2 m strip 7.7 kg/ha 9.7 kg/ha
VFS losses as % of bare plot losses (1-reduction %) based on the average of events were:TSS TN TP
9.2 m 25 65 804.6 m 48 115 94
Mass losses in runoff were:TSS TN TP
Bare 27,250 kg/ha 39.4 kg/ha 32.3 kg/ha
43
9.2 m 4,878 20.7 17.44.6 m 9,347 41.6 23.6
Cumulative mass losses (approximating long term performance) as % of bare plot losses were:TSS TN TP
9.2 m 18 52 544.6 m 34 106 73
Plots with VFS were somewhat effective in reducing surface losses of TSS and nutrients; greater reductions were achieved with greater VFS width. The authors suggested that 4.6 m may be the lower limit of VFS size for effective N removal. The authors also cautioned that plots with VFS may experience larger losses in surface runoff than comparable areas without a VFS, due to flushing of TSS accumulated in the strip from previous events.
Osborne and Kovacik (1993) presented a general discussion of a field plot study of different riparian buffers in IL; most of the work focused shallow groundwater. Limited evidence suggests that both grass and forested VFS leak P, possibly due to saturation. The authors noted that P concentrations were often higher in groundwater of a forested vegetated filter than in a grass strip, indicating that mature riparian forests may more accumulate P than grass, but also leak it through shallow groundwater at a greater rate. Higher P concentrations were reported in groundwater under grass strips during the planting season, corresponding with fertilizer application to crop fields. Higher P concentrations were observed under forested buffers during the dormant season, possibly due to leaching of P from organic matter or soil. The authors concluded that a mature riparian forest may be less ef icient P sink than grass VBS on an annual basis.
Forested VFS were observed to be more effective at N removal from shallow ground water than grassed VFS, but both grass and forested VFS were effective filters for NO3-N in shallow ground water. Denitrification was proposed as the most plausible mechanism.
The authors noted that both forested and grassed VFS require periodic maintenance to maintain sheet flow and promote infiltration. They also cautioned that a decrease in filtering efficiency of VFS should be expected in areas of tile drainage.
For surface runoff, cover type had a significant effect on VFS performance: a 20 m oat buffer strip had no effect on TP in surface runoff; surface runoff from 10 and 20 m rye grass plots were significantly lower than concentrations in oat and corn sites. An 89% reduction of [TP] in a10 m rye strip was noted: 0.25 mg/L vs. 2.25 mg/L in all corn.
Parsons et al. (1994) reported on results of NC plot studies of both grassed VFS and natural riparian filters. The study included a comparison of Piedmont (gravely fine sandy clay loam) and Coastal Plain (fine sandy loam) sites. Unfortunately, the report presents data for individual storms; overall conclusions are very difficult to summarize.
44
Runoff volumes were reduced (e.g., 50%) through grassed VFS natural grass initially present was not as effective in reducing runoff volume as was the fescue sod planted later. Riparian plots more fragile and susceptible to channelization/concentrated flow.
All filters were effective in removing sediment; for most storms, reductions were 80-90%The largest amount of sediment deposition/accumulation of sediment was observed in the upper 2 m of the strip.
Reductions in P and N loads in grassed VFS were variab grassed VFS nor riparian filters very effective in removing dissolved P. Removal of TP and TKN was generally ~50% in 4 m filters. Generally, 8 m filters more effective than 4 m, but doubling filter length did not double effectiveness
The authors commented that grass biomass harvested from a VFS accumulated a moderate amount of nutrients, but reported no hard data.
In another report of the same work, Parsons et al. (1995) reported that for storms of less than 2 inches, runoff through the 4.3 m grassed buffers was reduced by ~80% and sediment was reduced by 80% or more. More than 50% of sediment-bound nutrients were filtered in the grass buffers. For many events, little or no runoff occurred from 8.6 m buffers
For a larger storm, total runoff from 8.6 m buffer was much less than that from 4.3 m buffer; similarly lower yields of particulate P and N were observed from longer buffers. In some storms, however, the longer buffer seemed to flush soluble P and larger amounts of mineral N forms than did the short buffer.
Coyne et al. (1995 and 1998) reported that grass filte ips trapped significant proportions of sediment in runoff from KY cropland treated with 16.5 t/ha shallow-incorporated poultry manure. Both runoff and sediment concentrations were significantly reduced after passage through grassed strips of different widths:
Runoff (L) Sed (g/L)FS length in out in out4.5 3091 1057 8.28 1.72
2484 341 6.44 1.349.0 2651 576 4.33 0.67
2841 215 3.45 0.42
Sediment trapping efficiency (% of input) was 96% for the 4.5 m VFS, 98% for the 9.0 m strip.
From a primarily economic analysis based on CREAMS simulations, Epp and Hamlett (1996) reported on results of simulations on PA dairy farms with combinations of BMPs, including VFS. Use of a 15 m VFS alone resulted in:
45
Sediment loss from fields reduced 64 – 85%N loss from fields reduced 15 - 16%P loss from fields reduced 42 – 57%
Robinson et al. (1996) reported on the use of a VFS on 7% and 12% slopes treating runoff from continuously fallow area in IA, upgradient. Ratios of source:VFS area ranged from 6:1 to 1:1. All VFS encouraged infiltration; the first 3 m was observed to be the most effective in decreasing runoff volume; little change was noted beyond 9.1 m. In all storms, sediment concentration decreased in first 3 m of the VFS and little change was observed beyond 9.1 m. The first 3 m of VFS removed >70% of sediment on 7% slope and 80% on 12% slope. More than 85% of sediment removed by 9.1 m on both slopes. The authors reported no evidence of decreased VFS effectiveness with time, although the study period was only 1 year.
Three to six meter grass filters reduced total sediment by 30-60% (55-82% when one extreme storm eliminated) in a NC edge-of-field study on sandy-loam/clay-loam soil (Daniels and Gilliam 1996.) The filters reduced total silt+clay by 60-93%. The greater the distance water flowed thru filters, the greater removal of silt+clay. Grass and grass-riparian VFS that received sheet/rill flow reduced sediment and nutrients. High energy storms occurring when the watershed had little cover can overwhelm the filter.
Filters reduced TKN 35-60%; NH4-N removal varied from a net increase to 20-50% decrease. Nitrate reductions ranged from 50-90% across the filters; most reduction occurred in the first 7 m.
The authors reported that grass filters 6 m wide were as effective as grass+riparian forest filters with greater width that had a field lane between grass and riparian areas. Nutrient and sediment loads in runoff concentrated in drainageways changed very little downstream through forested riparian system. Concentrating runoff in grass drainageways then discharging it into a small channel in the upland riparian system was not effective in reducing sediment and nutrient loads because there is little to impede flow.
Barfield et al. (1998) reported on the performance of natural grass buffer strips in removing sediment and nutrients in runoff from erosion plots in a karst area of KY. VFS ranged from 4.57 to 13.72 m and were on a 9% slope; karst soils had numerous macropores and were underlain with limestone with numerous solution channels. The study focused on partitioning trapping efficiency due to infiltration vs. adsorption onto vegetation and soil surface. The authors report input and output mass of sediment and chemicals for several events and from both conventionally tilled and no-till erosion plots. Average trapping efficiencies were:
% infiltration soluble P NO3-N NH4-N Sediment4.57 m 91% 91% 95% 92% 97%9.14 m 97% 98% 98% 98% 99.9%13.72 m 94% 96% 97% 97% 99.7%
46
Trapping efficiency increased as the percentage of runoff infiltrated increased and as VFS length increased. The fraction of pollutants adsorbed increased with plot length, while the fraction infiltrated decreased because the opportunity for adsorption increases with increasing VFS length. Extrapolating the results to areas where infi ration is minimal, the authors indicated that the fraction adsorbed could range from ~0 on a short strip to near 50% on longer strips.
Mendez et al. (1999) conducted a plot study of grassed VFS at an 18% slope in VA. The ~25 m contributing area was planted in conventionally tilled corn planted up-down slope. The authors defined filter effectiveness as the mean % reduction in concentration/yield from filters compared to concentration/yield from plots without filters.
VFS tended to reduce runoff volume, although the significance of effect on runoff was masked by high variability:
VFS length mean ro vol % red median ro:precip0 0.240 -- 0.3104.3 0.144 40 0.0808.5 0.070 71 0.010
Both the 4.3 and 8.5 m VFS reduced concentrations and yields of TSS and N forms; reductions were not significantly improved in longer strips:
--------conc mg/L----- -------yield kg/ha------length mean % red. Median mean % red. Median----------------------------------------------TSS---------------------------------------0 7.89 4.04 151.4 26.34.3 m 1.34 83.0 0.52 27.4 81.9 1.38.5 m 1.01 87.3 0.20 14.8 90.2 0.1
0 5.63 4.17 88.7 25.84.3 2.94 47.8 1.90 71.3 19.6 1.98.5 3.29 41.6 1.77 46.9 47.1 3.8Sediment deposition occurred primarily within first meter of the filter strips. Both filters were effective in reducing TSS concentration and yield; no significant difference was observed between 8.5 and 4.3 m lengths and no significant trends over time were seen in sediment conc or yields. For all N forms, both filters reduced concentration and yield compared to no filter, but no significant differences were seen between the 8.5 and 4.3 filter lengths were observed. For NO3-N, median concentration and yield of leaving the 8.5 m filter was significantly less than from no filter, but no difference was observed between the 4.3 ilter and 0 filter. The authors suggested that the decrease in nitrate concentration was probably due to dilution with rainfall and that longer plots provided more opportunity for infiltration and were therefore more effective in NO3-N removal. No significant trends over time were observed for N concentration or yield from the VFS.
The authors concluded that the grassed filter strips reduced concentrations and yields of sediment and N significantly, and shorter filters are nearly as effective as longer filters in trapping most pollutants. Effectiveness did not decrease over the 18-month study period.
Uusi-Kamppa et al. (2000) published a compilation of work ian countries not previously available in English. Results of studies of both “GBZ” (grassed buffer zone) and “VBZ” (vegetated buffer zone, includes shrubs and trees) were reported:
Site Soil type width(m) TP retention (%) ReferenceA c/cl GBZ 10 38 Uusi-Kampaa et al. 1992,1996B c/cl VBZ 10 27 Uusi-Kampaa et al. 1992,1996D1 sil GBZ 5 88 Syversen 1996, 1997D2 sil GBZ 10 96 Syversen 1996, 1997E1 sil/sicl GBZ 5 66 Syversen 1994E2 sil/sicl GBZ 10 67 Syversen 1994E3 sil/sicl GBZ 5 51 Syversen 1994E4 sil/sicl GBZ 10 82 Syversen 1994F1 sil VBZ 5 75 Syversen 1994F2 sil VBZ 10 82 Syversen 1994F3 sil VBZ 5 97 Syversen 1994F4 sil VBZ 10 96 Syversen 1994G1 GBZ 8 66 (SRP) Vought et al.1991G2 GBZ 16 95 (SRP) Vought et al.1991H c GBZ 5 -36 Ulen 1988I1 ls/sl GBZ 2 65 Nielsen and Hansen 1993I2 ls/sl GBZ 6 97 Nielsen and Hansen 1993
Sources:Nielsen, P.V. and A.C.Hansen. 1993. Buffer zones and phosphorus supply to Danish surface waters. Statusreport
Hedelselskabet, Denmark.Syversen, N. 1994. Effect of vegetative buffer zones in minimizing agricultural runoff. Jordforsk Rep. 6.93.11
b aa aa a
48
. Jordforsk, Aas, Norway.Syversen, N. 1997. Buffer zones as measures for reducing surface runoff from areas with cereals. Jordforsk Rep.
30/97. Jordforsk, Aas, Norway.Ulen, B. 1988. Phosphorus erosion under ley cropping a a grass protective zone. 26:23-28.Uusi-Kampaa, J. and T. Ylaranta. 1992. Reduction of sediment, phosphorus and nitrogen transport on vegetated
buffer strips. . 1:569-575.Uusi-Kampaa, J. and T. Ylaranta. 1996. Effect of buffer strips on controlling soil erosion and nutrient losses in
southern Finland. P. 221-235 in Mulamoottil et al. (eds.) Wetlands: Environmental gradients, boundaries, and buffers. CRC, Lewis Publ., New York.
Vought, , L.B.-M., J.O. Lacoursiere, and N.J. Voelz. 1991. Streams in the agricultural landscape. 47:321-328.
Mean annual % P retention varied from 27% to 97%; one experiment showed showed a VBZ as a source of P. Increasing retention of TP with increasing buffer width were noted data from the same experimental site. Both VBZ and GBZ were documented as effective in removing P, but experiments did not show higher retention for VBZ than GBZ; no significant difference in P retention appeared to result from differences in vegetation.
The Scandinavian studies noted several points observed in U.S. studies. The authors noted that when retention was expressed as g TP/m2, retention with increasing buffer zone width, e.g., in Norway: 1.6 – 4.4 g TP/m2 in 5 m BZ vs. 0.5 – 3.5 g TP/m2 in 10 m BZ. This phenomenon is due to high deposition of sediment and particulate P in upper part of buffer. As in the U.S., retention of P was highly correlated to retention of particles; ~90% of retained P was particulate. Retention of soluble P varied from +14% to –64%, possibly due to leaching from plant material in the buffer.
The authors reported that bioavailable P from buffers was diminished less than was TP:-----------kg/ha------------SRP extractable P TP
Eghball et al. (2000) and Gilley et al. (2000) reported on a plot study of a very narrow (< 1m)switchgrass hedge on no-till/disced corn fields on a 12% slope in IA. From the descriptions in the papers, these hedges appear to act more like a cross-slope berm or terrace than a VFS; thus, the results may not be directly applicable to VFS effectiveness.
Significant differences between treatments (NH = no hedge; WH = with hedge) are shown below for concentration (mg/L); only cases where differences were significant are shown:
Sol P BAP part P TP NO3 NH4 TNNo-till Check NH 20.0 71.9 Check WH 23.8 94.0 Fert NH 1.65 3.96 73.6 Fert WH 1.19 2.42 100.3 Manure NH 3.09 4.45 6.9 10.0 2.34
For manure applied to no-till cropland, hedges reduced runoff concentrations compared to no hedge: soluble P by 47%, biologically available P by 48%, particulate P by 38%, TP by 40% and NH4-N by 60% . For manure app to disced plots, hedges reduced runoff concentrations of:soluble P by 21%, biologically available P by 29%, particulate P by 43%, TP by 38% and NH4-N by 52%
Fewer significant reductions in runoff from chemical fertilized plots
Few effects were noted on mass removal (kg/ha):DP BAP p P TP NO3 NH4 TN
Under no-till, plots with hedges had 52% less runoff, 53% less soil loss than without hedges. Under tilled conditions, plots with hedges had 22% less runoff, 57% less soil loss than without hedges. Without corn residue, plots with hedges had 41% less runoff, 63% less soil loss.Jin et al. (2002) reported on an interesting synergy between use of crop residues and VFS on the same field. Mulches washed from the field by runoff accumulated in front of the VFS, retarding runoff flow and creating a hydraulic jump upstream of the filter strip. Sediment trapping efficiency was increased by 10% to 60% compared to identical conditions without mulch.
There have been comparatively few studies of the effectiveness of VFS in removing indicator bacteria from field runoff.
Coyne et al. (1995 and 1998) reported that grass filte ips trapped significant proportions of fecal coliform in runoff from KY cropland treated with 16.5 t/ha shallow-incorporated poultry manure. Fecal coliform numbers in cropland runoff were generally reduced by ~one order of magnitude after passage through grassed strips of different widths:
50
Fecal coliform/100 ml Fecal strep./100 mlVFS length in out in out4.5 3.18x10⁶ 5.58x10⁶ 4.66x10⁶ 1.04x10⁷
1.54x10⁷ 6.74x10⁶ 5.34x10⁷ 3.71x10⁷
9.0 2.38x10⁷ 8.72x10⁶ 1.10x10⁷ 1.66x10⁷
5.72x10⁵ 8.39x10⁵ 1.44x10⁶ 3.75x10⁶
Filter strips reduced fecal coliform counts in runoff by 75-91%, but by the end of the rain, fecal coliform concentrations leaving the filter strips exceeded concentrations entering the strips – the filter strip appeared to become a reservoir for sediment-bound fecal coliform trapped from surface runoff. In explaining this observation, Coyne and Blevins (1995) suggested that bacteria attached to sediment trapped in the filter strip are subject to detachment by rainfall impact and flowing water. After breaking down of larger aggregates, bacteria appeared to be bound to small soil particles that are mobile in grass filters and of a size least likely to be trapped. On a mass basis, average fecal coliform trapping efficiency was 75% in 4.5 m filter strips and 91% in 9 m filter strips. However, fecal coliform counts in filter strip runoff were still 1000 times higher than KY water quality standards. The authors concluded that grass filter strips long enough to control sediment loss will trap most fecal coliform in surface runoff, but will not reduce bacteria contamination to meet water quality standards.
In a plot study of vegetated filter strips of varying ing runoff from poultry litter treated grassland, Srivastava et al. (1996) reported that fecal coliform counts in runoff (average 1.3 x 10⁶/100 ml) did not change appreciably with passage through filter strips up to 20 m in length.
In contrast, Lim et al. (1998) reported complete removal of fecal coliform in a 6.1 m grassed filter strip from an initial level of up to 2 x 10⁷ /100ml.
Entry et al. (2000a and 2000b) studied swine wastewater application to grassed and forested filter strips in Georgia. The pulse of applied wastewater as surface flow infiltrated in the first 15 m of all filter strips; populations of fecal coliform did not decline during surface flow regardless of vegetation type or season. Bacteria numbers declined from ~105 – 106 in the source wastewater to ~102 – 103 in the soil water. Fecal coliform numbers in soil water declined by ~1 order of magnitude every 7 days for the first 14 days, regardless of vegetative treatment or season. Bacteria numbers in soil water were positively correlated with soil moisture and negatively correlated with soil temperature; decreasing soil moisture and increasing temperatures decreased survival of fecal coliform bacteria in the soil. At 90 to 120 days after waste application, fecal coliform numbers in soil water did not differ from those in control plots where no waste was applied. The authors concluded that because filter strips, regardless of vegetation type or season, did not reduce bacteria concentrations in surface flow and higher soil moisture/lower soil temperatures correlated with higher bacterial levels in soil water and shallow groundwater, animal production operations should not ap land when surface runoff or leaching to a water course are likely to occur
51
Although not entirely relevant to current agricultural ices in Vermont, it is worth reporting a plot study of VFS treatment of runoff from winter-spread manure in MN (Thompson et al. 1975).The study was conducted on several crop/field types at 4% slope; source and buffer areas were the same cover and included grass, corn stubble, and bare tilled soil.
Average nutrient concentrations (mg/L) in surface runoff were: NH3 NO3 P TKN
The form of P was unspecified. Control received no manure.
Reductions in nutrient concentrations in winter runoff for all nutrients averaged together were:12 m 36 m
Overall ave. (2 conditions, 2 yrs) 62% 73%Grass cover, 2 yr ave 63% 72%Corn stubble, 2 yr ave 55% 68%Tilled bare soil, 2 yr ave 66% 78%
All surface conditions performed equally.
Average nutrient reductions over two years with background (control) concentrations subtracted were:Buffer length COD NH3 NO3 P TKN Ave
12 m 78% 84% 92% 68% 88% 82%36 m 96% 109% 106% 83% 93% 97%
These results should be considered atypical, as only concentration data were reported, runoff was monitored only from January through March, and no data were reported on runoff, precipitation, or snowmelt. All reported reductions could be the result of dilution alone.
52
Performance data for VFS treating runoff from grassland are summarized in Tables 5 and 6.
Bingham et al. (1980) reported on a study of VFS length and treatment of poultry litter runoff from grassland at a 6 to 8% slope in NC. The authors focused on the ratio of waste treated source area to VFS area as an index of VFS performance. The data showed that concentration reductions took place up to about a source area:buffer ratio of 1.0, after which all parameters approached background runoff concentrations. For example:
Chaubey et al. (1994) reported on a simulated rainfall plot study of VFS of various lengths in AR where swine waste was applied to a grass source area. . Runoff concentrations of all constituents were significantly affected by VFS length, although TSS and fecal coliform did not decrease significantly after 3 m. Treatment effects were attributed to filtration by grass, dilution by rainfall, and infiltration of soluble constituents. Concentrations through the VFS were:
Except for NO3-N, VFS length had a significant effect on mass transport. Mass transport of TKN, NH3-N, TP, and PO4-P decreased significantly up to a VFS length of 9 m. Mass transport of TP decreased significantly up to VFS 6 m; transport of TSS did not change after 3 m. FVS length had no effect on mass transport of fecal coliform. Mass transport of NO3 tended to increase, possibly due to soil/vegetation release:
(kg/ha source area)The authors described the relationship of mass transport and VFS length as a first-order equation and determined rate coefficients for nutrient reductions:
k (m-1)NH3-N -0.26TKN -0.13TP -0.15PO4-P -0.16TSS -0.08
Effects of VFS length varied by constituent. The VFS was effective in removing significant quantities of TKN, NH3-N, PO4-P, TP, and TSS from incoming runoff. The VFS did not significantly reduce mass of NO3-N or fecal coliform. There was no significant increase in effectiveness of the VFS beyond 3 m for TSS and beyond 9 m for NH3-N, PO4-P, and TP. The pattern of mass removal rates was:
Chaubey et al. (1995) reported on a similar simulated rainfall plot study of VFS of various lengths in AR where poultry litter applied to a grass source area. Runoff concentrations of all constituents were significantly affected by VFS length, although TSS did not decrease significantly after 3.1 m. Treatment effects were attributed to filtration by grass, dilution by rainfall, and infiltration of soluble constituents. Concentrations through the VFS were:
Except for NO3-N, VFS length had a significant effect on mass transport. Mass transport of TKN, NH3-N, and PO4-P decreased significantly up to a VFS length of 9.2 m. Mass transport of TP decreased significantly up to VFS 6.1 m, transport of TSS and COD decreased only up to 3.1 m. Mass transport of NO3 tended to increase, possibly due to soil/vegetation release:
Infiltration was the primary mechanism for mass removal of P, as 64% of P was in PO4-P form.
The authors described the relationship of mass transport and VFS length as a first-order equation and determined rate coefficients for nutrient reductions. Effects of VFS length varied by constituent. A 21.4 m VFS was 80 – 98% effective in reducing incoming mass of TKN, NH3-N, TP, and PO4-P. Effectiveness for TKN and TP removal was constant for VFS >9.2 m. Effectiveness for NH3-N and PO4-P removal increased up to VFS length of 15.2 m. The pattern of mass removal rates was:
These results are probably very optimistic as the ratio of source area to VFS was very low (1:1 to 1:7) and data were reported only for the first storm. Thus, the observed performance is probably not representative of long-term VFS behavior.
Srivastava et al. (1996) conducted a plot study of variable source length and variable VFS length to treat runoff from poultry litter treated grassland on a 3% slope in AR. Concentrations of TKN, NH3-N, NO3-N, TP, PO4-P, TOC, TSS, and fecal coliform were not significantly influenced by source area length; the concentration of pollutants entering VFS did not depend on length of source area over which runoff flowed. A similar result was reported by Edwards et al. (1997) who found that the length of the poultry litter treated source area had no effect on runoff concentrations of nutrients and sediment and suggested that a manure-treated length of <3 m issufficient for runoff to achieve equilibrium concentrations.
Concentration of all pollutants except TSS and fecal coliform were significantly affected by VFS length in an approximate first-order decline with increasing VFS length. For NO3-N, TKN, and
55
TOC, runoff concentration did not decrease significantly beyond 3 m of VFS. Fecal coliform numbers (average 1.3 x 10⁶/100 ml) did not change through the VFS.
Mass transport of NH3-N, TKN, TP, PO4-P, and TOC were significantly influenced by source area length. Runoff exiting the litter treated areas increased with length of source area.VFS length had no significant effect on mass transport of any pollutant. The authors suggested that this was due to high variability and/or to the fact that most treatment occurred early in VFS before first sampling point.
Mass removal effectiveness generally decreased with increasing source area length, i.e., with increased pollutant loading. The authors attributed this to some limiting factor within VFS, e.g., infiltration rate. An exception was PO4-P removal which did not vary with litter treatment length. Mass removal effectiveness generally increased with increasing VFS lengths for source areas of 12.2 and 18.3 m. The lack of significant VFS length effect for 6.1 m source area may be result of most mass removal occurring before first sampling point within VFS.
Source length VFS length mean mass removal NH3-N 6.1 18.3 75%
12.2 12.2 39%18.3 6.1 27%
TKN 6.1 18.3 67%12.2 12.2 44%18.3 6.1 21%
TP 6.1 18.3 66%12.2 12.2 36%18.3 6.1 26%
Although not strictly a VFS study, Liu et al. (1997) reported a study to determine P removal by overland flow of swine lagoon effluent on grass in AL. Slopes of 5% and 10% were evaluated, with swine waste introduced manually at the top of the 6.1 m slope. P concentrations in surface runoff increased with increasing P applications. For each treatment, P mass losses were greater on the 10% slope due to larger runoff volumes, but mass losses on both slopes were very small compared to total applied P. P mass reductions exceeded 99% for both slopes at all application rates: ------5% slope------ --------10% slope-----
P applied runoff P % red. Runoff P % red. 142 kg/ha 0.36 99.7% 0.64 99.5%
(% reduction relative to original waste [P] of 15.42 mg/L)
The authors indicated that soil adsorption and forage uptake play a significant role in P mass reduction.
In a study of buffers potential use on golf courses, Cole et al. (1997) conducted a plot study to assess the effects of VFS length and vegetation height on reduction of pesticide and nutrient losses from plots of 6% slope in OK. Nutrients were applied as fertilizers, not animal waste and only soluble forms were evaluated in runoff. In most cases, mowing height and soil aeration did not have a significant effect on VFS performance. Treatments containing buffers were effective in reducing NH4-N and PO4-P concentrations and mass losses, but NO3-N losses were not reduced. Differences between buffer lengths were generally not significant.
Hawkins et al. (1998) compared VFS performance on different slopes in a plot study of 6.1 m VFS on 5% and 11% slopes in AL to treat swine lagoon effluent on grass. The specific effects of slope are difficult to interpret because the 5% slope VFS received a higher waste load than did the 11% strip. Concentration reductions were:
11% slope 5% slopein out % reduction in out % reduction
The term “TS” was undefined in the paper; values seem too low to represent total solids.
Mass retention was: 11% slope 5% slope
in out % reduction in out % reductionTKN (kg/ha) 9451 637 93% 18414 7263 60%NH3-N 8741 599 93% 16894 7102 58%NO3-N 82 130 -59 139 65 54COD 19112 1495 92 40232 7574 81
57
TP 300 24 92 566 141 75TS 57 36 37 113 46 59
Although the 11% slope VFS appeared to give higher pollutant reductions, note that loading to the 5% slope strip was ~double that to the 11% strip.
The authors noted that the majority of mass removal occurred because of 85 – 100% reduction in runoff quantity. Nitrate leaching was major concern; NO3-N moved down the soil profile and increased with depth on all plots at both slopes. Final concentration after 6 months of application was >10 mg/l.
Lim et al. (1998) conducted a plot study of simulated pasture runoff in KY 12.2 m grassed source area was treated with manure representing ~4 AU/ha for 7 day grazing; manure was deposited by hand at lower edge of source area. Runoff was treated through VFS 6.1 to 18.3 min length at 3% slope. The authors fit observed data to a first-order exponential decay model and calculated rate coefficients for both concentration and mass, e.g.,:
C(x) = C0e-kx
Where C = conc, mg/LC0 = initial concK is rate coefficient for length x
The concentration of all parameters except NO3-N and NH3-N were significantly affected by VFS length. NO3-N and NH3-N concentrations began at ~background levels because the manure was fresh.
--------------------VFS length (m)---------------------0 6.1 12.2 18.3 k (/m)
The results of this study seem to contradict other stu ll TSS removal in the first ~3 m of a VFS. It may be that the TSS load entering the strip was so high that treatment took a greater distance.
Sanderson et al. (2001) tested the effectiveness of a switchgrass VFS to remove P from manured grassland in TX. Concentration of total reactive P (approximately equivalent to TP) in runoff increased with increasing amounts of waste application. A 16.4 m VFS reduced P concentration in surface runoff from 0 – 95% (mean = 47%) at a medium manure application rate (32-43 kg P/ha) and 19 –91% (mean = 76%) for high application rate (59 – 64 kg P/ha). The VFS was also effective in reducing COD. The authors noted that the manure treated source area:VFS ratio was 1:1. In practice, the manure treated area would be greater and VFS effectiveness would probably be lower.
Finally, in an extensive modeling study, Moore et al. (1983) modeled fecal coliform in runoff from OR dairy operations based on a mass-balance evaluation of factors controlling bacteria dynamics: number of animals, waste storage, bacterial die-off in storage, waste application method and rate, bacterial die-off on surface soils, precipitation, infiltration of water and bacteria, and transport in runoff. The authors then used the model to evaluate the influence of weather and management variables on FC in runoff, including the use of buffer strips. Based on model scenarios, buffer strips of unspecified width, slope, or vegetation were suggested to be effective in reducing net fecal coliform bacteria runoff quantities by 60% (from 4.26 x 10¹² /100 ml to 1.85 x 10¹²/100 ml).
A number of researchers have used plot or laboratory studies of VFS receiving simulated runoff to investigate processes and behavior of VFS.
From studies of plot fields with native grasses and natural or simulated runoff, Syversen (1995) observed that VFS removed 70% of sediment, 50% of P, and 30% of N (forms unspecified, probably TP, TN). The author stated that VFS can rece runoff from relatively large catchments without significant decrease in removal levels, especially for sediments. Syversen recommended a VFS length of 5 – 10 m, noting that a 15 m VFS did not remove significantly
VFS and simulated runoff
59
more sediment or nutrients because sedimentation is most effective in upper part of the strip. Healthy growth of vegetation is more effective than withered vegetation, but no apparent performance difference were observed between different kinds of vegetation (grass vs. trees). Contradicting other reports, Syversen claimed that dif , 14, and 28%) do not influence the level of removal.
Schmitt et al. (1999) reported on extensive plot experiments using simulated field runoff to compare the performance of VFS of different widths comprised of contour sorghum, new grass, old grass, and grass+shrubs/trees in NE. Concentrations of contaminants in outflow from plots of all vegetation and width were lower than input values. Because outflow volume also reduced, contaminant mass was reduced to a greater degree than concentration.
The authors evaluated width effects, noting that previous experiments had shown nonlinear retention of sediment in grassed filter strips where most sediment (53-86% of suspended mass) was retained in 4.6 m of the uphill edge, with much smaller additional amounts (4-17%) retained by doubling this width. Outflow volume and contaminant concenctrations were generally lower from 15 m strips than from 7.5 m strips with same vegetation; width had statistically significant effect for all contaminants except atrazine. Concentration of TSS was reduced to the greatest degree by both widths, but changed the least between the 7.5 and 15 m strips – 77% and 83% reductions, respectively. Reduction in concentration of dissolved contaminants NO2+NO3-N and TDP were lower than for TSS but changed the most from 7.5 to 15 m: 23% to 38% for NO2+NO3-N, 24% and 39% for TDP.
Because outflow volume was significantly lower from the 15 m plots (70% reduction) than from 7.5 m plots (46% reduction), masses of all contaminants reduced significantly and more so by 15 m plots:
Vegetation type had only small effects on VFS performance. Compared to contour sorghum, perennial vegetation plots had lower concentrations in outflow; sediment setting greater on grass plots than contour sorghum TSS concentration was reduced more than other contaminants – 37-70% lower than sorghum for 7.5 m plots and 64-81% lower than sorghum for 15 m plots. VFS with 2 yr old grass and 2 yr old grass + trees/shrubs behaved similarly; no significant differences for concentration or mass were observed. Little difference was noted in VFS performance between perennial vegetation types, although older grass plots tended to be more effective than newly planted plots. Planting lower half of grass buffers to young trees/shrubs had no effect on performance. Infiltration was not significantly different between any vegetation types.VFS performance depended on contaminant type. Sediment concentration and mass were reduced in outflow to the greatest degree; contaminants predominantly bound to sediment (TP,
60
BAP) were reduced to a lesser degree than TSS. The smallest reductions were observed for predominantly dissolved contaminants - NO2+NO3-N and dissolved P.
The researchers identified settling, infiltration, and dilution as the two most important processes to reduce pollutant levels through a VFS. Particulate settling removes sediment and sediment-bound contaminants from runoff flow. Infiltration carries dissolved constituents into the soil where sorption/desorption can remove/add contaminants. Dilution by rainfall reduces concentration of all contaminants. Settling processes described TSS behavior in the study. TSS concentrations were reduced 87-93% in 15 m grass plots; most (76-89%) of that reduction occurred in first 7.5 m. The concentrations of sediment-bound contaminants were reduced to a lesser degree than TSS, probably reflecting predominant assoc of contaminants with finer particles that take longer to settle.
Dilution (tracked by Br) was linear with plot length, resulting in an average 15% reduction in concentration at 7.5 m, doubling to 30% at 15 m. Dissolved contaminants would behave similarly, except for effects of sorption/desorption, which were not studied. Dilution differences between 7.5 and 15 m strips would account for all difference in TSS concentration between strip widths; this suggests that all settling occurs within 7.5 m and all sediment able to pass 7.5 m remain in suspension after 15 m.
Pearce et al. (1997) used laboratory tray experiments to investigate interactions between vegetation height and buffer length. Vegetation clipped to the soil surface was a more effective sediment filter than vegetation 10 cm high in the 12.5 cm buffer length. However, 10 cm vegetation was a better sediment filter on a 50 cm buffer length. No significant differences between vegetation heights were observed on the 25 cm buffer length. Taller vegetation was more effective in reducing sediment yield when combined with greater buffer length. The authors noted that sediment was not only filtered from runoff by vegetation but most sediment was deposited upslope from vegetated strips as a sediment wedge. The wedge developed directly upslope of the vegetated zone and depth of sediment deposition decreased as distance upslope increased. Sediment wedges progressed into vegetation with time. Once sediment laden overland flow reached the vegetation, water flow was attenuated, sediment dropped out of runoff. Thus, not only the length of the buffer but presence of dense vegetation to slow velocity contributes to VFS performance.
Groffman et al. (1991) amended grass and forested VFS with N to measure denitification rates in RI. Baseline, aerobic denitrification rates were insignificant on all sites; amending VFS with NO3-N and/or NO3-N+glucose increased denitrification rate:
The authors had expected that forest plots would have much higher denitrification rates due to higher moisture and OM; however grassed plots consistently had higher rates. The higher rates
61
on grassed plots were attributed to past inputs of N and lime that created a more favorable environment for denitrifying bacteria.
A number of researchers have addressed issues of VFS performance through literature reviews and efforts to model performance within the VFS.
Overcash et al. (1981) cited major factors in VFS effectiveness as pollutant concentration in entering runoff, dilution, and infiltration. The authors developed a mathematical model/predictive tool for design of grass buffer strips. The model suggested that a 100% reduction in concentration is reached between 0.5 and 1.0 buffer area length:source area length ratio. An infiltration/dilution model predicts similar reductions for a D factor (infiltration rate/rainfall rate) of 0.6 – 0.8. Hayes et al. (1984) developed and tested a design model to estimate effectiveness of a grassed VFS to remove sediment. The model estimates the fraction of sediment trapped and outflow concentration as a function of inflow hydraulic and sediment conditions and has the capability of recalculating particle size distribution as a function of sediment trapping. The model accounted for 94% of the inflow sediment load in tests against lab and field VFS. Edwards et al. (1996) later presented an analysis of VFS design for treatment of dissolved pollutants from manure applied to grassland assuming that only infiltration is responsible for pollutant removal. The authors used the Overcash et al. (1981) equations relating pollutant removal to ratio of infiltration to runoff and ratio of VFS length to source length. Edwards et al. applied their analysis to the design of VFS to meet requirements of a water resource for constant % reduction, reduction to a fixed concentration, and reduction to fixed mass load.
Castelle et al. (1994) reported a literature review of VFS and riparian buffer performance focusing on width requirements. They identified three principal functions of VFS and riparian buffers:
Buffer vegetation forms a physical barrier that slows surface flow rates and mechanically traps sediment. Roots maintain soil structure and physically restrain erodible soil. The authors cite Wong and McCuen (1982) who proposed that the relationship between buffer width and sediment removal is nonlinear. Disproportionately large buffer widths are required for incrementally greater sediment removal, e , increasing sediment removal on a 2% slope from 90% to 95% would increase buffer width from 30.5 to 61 m.The authors also cite Ghaffarzadeh et al. (1992) who reported that sediment removal by a grass VFS did not increase beyond a filter strip length of 9.1 m, where removal rate was 85%.
Wong, S.L. and R.H. McCuen. 1982. The design of vegetative buffer strips for runoff and sediment control. Tech. Paper, MD Coastal Zone Mgt. Program, Civil Eng. Dept., Univ. of Maryland, College Park, MD.
Ghaffarzadeh, M., C.A. Robinson, and R.M. Cruse. 1992. Vegetative filter strip effects on sediment deposition from overland flow. P. 324 in Agronomy Abstracts, ASA, Madison, WI.
General considerations
Sediment removal/erosion control
62
The authors cite a report by Madison et al. (1992) that a 4.6 m grassed VFS removed 90% of NH4-N, NO3-N, and PO4-P. A 9.1 m grassed VFS removed 96-99% of pollutants. Strips wider than 9.1 m did not result in higher trapping efficiencies
Madison, C.E., R.L. Blevins, W.W. Frye, and B.J. Barfield. 1992. Tillage and grass filter strip effects upon sediment and chemical losses. P. 331 in ASA, Madison, WI.
through wildlife corridors and ecotones
Crane et al. (1983) reported on a comprehensive literature review of bacterial pollution from agricultural sources, citing many unavailable sources. The authors summarized important mechanisms involved in reducing bacteria by filter strips
1. Reduction in runoff volume due to increased infiltration;2. Decrease in runoff velocity due to vegetative cover, with resultant increase in sedimentation of particulate bound pollutants; and3. Increased adsorption of pollutants by soil particles under influence of lower ionic concentration regime than found upgradient.
Crane et al. (1983) reported that research on effectiveness of VFS for bacteria removal are conflicting, e.g., Jenkins et al. (1978) reported a 96-98% removal of fecal coliforms from wastewater effluent in summer, reduced to 65% in winter. In contrast, Peters and Lee (1978) observed that fecal coliform increased with overland treatment of municipal wastewater in summer; maximum removal in winter was 60%. Hunt et al. (1979) reported that total coliform and fecal coliform counts were always higher in initia r applied than in overland flow treatment effluent, regardless of season
Summarizing other work, Crane et al. stated that VFS are only effective in removing bacteria from overland flow at high concentrations (>106 / 100 ml); bacteria in runoff from buffers seems to equilibrate to ~105 regardless of environmental condition.
Sources cited in Crane et al. 1983:Jenkins, T.F., C.J. Martel, D.A. Gaskin, D.J. Fisk, and M. L. McKim. 1978. Performance of overland flow land treatment in cold climates. p. 61-77 in Land treatment of wastewater, International Symp nover, NH. Peters, R.E. and C.R. Lee. 1978. Field investigation of advanced treatment of municipal wastewater. p. 45-60 in Land treatment of wastewater, International Symp., Hanover, NH. Hunt, P.G., R.E. Peters, T.C. Sturgis, and C.R. Lee. 1979. Reliability problems with indicator organisms for monitoring overland flow treated wastewater efflent. J. Environ. Qual. 8(3):301-304.
Excess nutrient and metal removal
Maintenance of habitat diversity
:
Agronomy Abstracts,
63
Dosskey (2001) reviewed the literature to clarify the current scientific foundation of the USDA and similar buffer programs designed in part for water pollution abatement and to highlight important research needs. At this time, research reports are lacking that quantify a change in pollutant amounts (concentration and/or load) in streams or lakes in response-to converting portions of cropped land to buffers. Most evidence that such a change should occur is indirect, coming from site-scale studies of individual functions of buffers that act to retain pollutants from runoff: (1) reduce surface runoff from fields, (2) filter surface runoff from fields, (3) filter groundwater runoff from fields, (4) reduce bank erosion, and (5) filter stream water. The term filter is used here to encompass the range of specific ollutant amounts in runoff flow. A consensus of experimental research on functions of buffers clearly shows that they can substantially limit sediment runoff from fields, retain sediment and sediment-bound pollutants from surface runoff, and remove nitrate N from groundwater runoff. Less certain is the magnitude of these functions compared to the cultivated crop condition that buffers would replace within the context of buffer installation programs. Other evidence suggests that buffer installation can substantially reduce bank erosion sources of sediment under certaincircumstances. Studies have yet to address the degree to which buffer installation can enhance channel processes that remove pollutants from stream flow. Mathematical models offer an alternative way to develop estimates for water quality changes in response to buffer installation. Numerous site conditions and buffer design factors have been identified that can determine the magnitude of each buffer function, Accurate models must be able to account for and integrate these functions and factors over whole watersheds. At this time, only pollutant runoff and surface filtration functions have been modeled to this extent. Capability is increasing as research data is produced, models become more comprehensive, and new techniques provide means to describe variable conditions across watersheds. A great deal of professional judgment is still required to extrapolate current knowledge of buffer functions into broadly accurate estimates of water pollution abatement in response to buffer installation on crop land. Much important research remains to be done to improve this capability. The greatest need is to produce direct quantitative evidence of this response. Such data would confirm the hypothesis and enable direct testing of watershed-scale prediction models as they become available. Further study of individual pollution control functions is also needed, particular evidence for how much they can be manipulated through buffer installation and management.
Effectiveness of filter strips may change over a period of years because key soil and vegetation conditions change after conversion of cultivated farmland to permanent vegetation (Dosskey et al. 2007). The main objectives of this study were to: 1) determine if effectiveness of a filter strip changes over years since establishment, and 2) determine change depends on vegetation type. Four vegetation treatments were replicated five times in 3 x 7.5 M (10 X 25 ft) Plots. Plots containing all-grass (New Grass) and grass with trees and shrubs (New Forest) were established in spring Of 1995 among otherwise similar plots that contained either grass since ca. 1970 (Old Grass) or were re-cultivated and re-ptanted annually with grain sorghum (Crop). Once each summer, in 1995, 1996, 1997, 2003, and 2004, identically prepared solutions containing sediment, nitrogen (N) and phosphorus (P) fertilizer, and bromide tracer were applied to the upper end of each plot during a simulated rainfall event Of 2.5 cm (1 in) in 30 minutes, and the load and concentration of runoff components were measured in outflow from the plots. Retention of solution components and reduction of their concentrations by the New Grass and New Forest
64
plots improved from effectiveness similar or less than the Crop plots to effectiveness similar to the Old Grass plots within three growing seasons. Improvement coincided with the development of denser vegetative ground cover and a slower rate of runoff flow through the plots. Change in infiltration accounted for most of the improvement in overall effectiveness. There was no evidence of divergence in the performance of New Grass and New Forest plots. We conclude that filter strip performance improves over a period of years since establishment. Most of the change occurs within three growing seasons after establishment. Infiltration characteristics account for most of that change. Grass and forest vegetation are equally effective as filter strips for at least 10 growing seasons after establishment.
Gharabaghi et al. (2006) conducted a study in southern Ontario to determine the effect of vegetation type, width of the filter strip, runoff flow rate and inflow sediment characteristics on effectiveness of the VFS in removing pollutants from runoff. The results show that sediment removal efficiency increased from 50 to 98% as the width of the filter increased from 2.5 to 20 m. In addition to the width of the filter strip, grass type and flow rate were also significant factors. This study indicates that the first five (5) metres of a filter strip are critical and effective in removal of suspended sediments. More than 95% of the aggregates larger than 40 mu m in diameter were trapped within the first five metres of the filter strip.
Lee et al. (2003) conducted a field plot study to determine the effectiveness of an established multi-species buffer in trapping sediment, nitrogen, and pho horus from cropland runoff during natural rainfall events. Triplicate plots were installed in a previously established buffer with a 4.1 by 22.1 m (14 x 73 ft.) cropland source area paired with either no buffer, a 7.1 m (23 ft) switchgrass (Panicum virgatum L. cv. Cave-n-Rock) buffer, or a 16.3 m (53.5 ft) switchgrass/woody buffer (7.1 m swithgrass/9.2 m woody) located at the lower end of each plot. The switchgrass buffer removed 95% of the sediment, 80% of the total-nitrogen (N), 62% of the nitrate-nitrogen (NO3-N), 78% of the total-phosphorus (P), and 58% of the phosphate-phosphorus (PO4-P). The switch grass/woody buffer removed 97% of the sediment, 94% of the total-N, 85% of the NO3-N, 91% of the total-P, and 80% of the PO4-P in the runoff. There was a significant negative correlation between the trapping effectiveness of the buffers and the intensity and total rainfall of individual storms. While the 7 m (23 ft) switchgrass buffer was effective in removing sediment and sediment-bound nutrients, the added width of the 16.3 m (53.5 ft) switchgrass/woody buffer increased the removal efficiency of soluble nutrients by over 20%. Similar or even greater reductions might have been found if the 16.3 m (53.5 ft) buffer had been planted completely to native warm-season grasses. In this buffer, combinations of the dense, stiff, native warm-season grass and woody vegetation improved the removal effectiveness for the nonpoint source pollutants from agricultural areas.
In Finland, Uusi-Kamppa (2006) studied the effects of 10-metre wide annually cut grass buffer zones (GBZ) and vegetated buffer zones under natural v ion (VBZ) on losses of total solids (TS), total phosphorus (TP), particle-bound P (PP), orthophosphate phosphorus PO4-P), total nitrogen (TN), nitrate nitrogen (NO3-N) and ammonium nitrogen (NH4-N) in surface run-off from experimental field plots. The results were compared with those from 70-m-long and 18-m-wide plots without a buffer (NBZ). Spring barley or oats were grown in the period 1991-2002 and there was a pasture grazed by cows 2003-2005 both on the whole field area and the buffer area of NBZ. Both GBZ and V13Z mitigated significantly the losses of TS, TP and PP from
65
surface run-off on cereal field plots. The retention of TS, TP and PP was > 50, 40 and > 45%, respectively. However, the cumulative loss of PO4-P over the I I-year experiment was the largest (2.4 kg ha(-1)) from the VBZ where the plants on the buffer zone were not harvested. Over 3 grazing years, the losses of TS, TP, PP, PO4-P, TN and NO3-N were around 700, 2.3, 0.8, 1.5, 4.2 and 0.8 kg ha(-1) from all treatments. The mean annual losses were smaller from the pasture than from the field with spring cereals. There was, however, one exception - during grazing the mean annual PO4-P loss (0.5 kg ha(-1) yr(-1)) was twice or even threefold compared to the load during spring cereal years. The buffer zones are excellent for retention of TS, TP and PP from surface run-off in annually ploughed cereal fields, whereas they are not so important for perennial grass fields.
Sotomayor-Ramirez et al. (2008) conducted an experiment to test the hypothesis that grass filter strips are effective in reducing nutrient and sediment concentrations in runoff from grazed pasture amended with dairy manure sludge in two fields of a dairy farm in Puerto Rico. Runoff generated following a precipitation event was diverted into runoff-collection devices placed at 0, 10, and 20 m within a grass filter barrier. Samples were analyzed for suspended solids (SS), total Kjeldahl nitrogen (TKN), dissolved phosphorus (DP), and total phosphorus (TP). Suspended solid concentrations in runoff entering the filter strips were minimal, which is indicative that SS losses are not numerically significant from pasture fields exhibiting high vegetative coverage. Elevated TP and TKN concentrations were observed in runoff events occurring within 10 days after manure application. This finding indicates that farmers must avoid scheduling manure applications at times when significant rains are expected, because direct runoff will result in excessive off-field nutrient losses if no filter strip is present. In both fields, DID concentrations in runoff were significantly reduced with a filter str 0 m wide, whereas TP concentrations were significantly reduced only from the field exhibit the highest concentration in runoff, i.e., Toronjo field. A 27% decrease in TKN concentration was observed in the Toronjo field as a result of the 20-m filter strip (relative to the entrance), but such reduction was nonsignificant. Although the 20-m grass filter strip was effective in reducing nutrient concentrations in runoff from manure-amended fields, the implementation of other best management practices is needed to reduce the impact of nutrient losses to levels that do not pose a threat to the integrity of the receiving waters.
Alberts, E.E., W.H. Neibling, and W.C. Moldenhauer. 1981. Transport of sediment nitrogen and phosphorus in runoff through cornstalk residue strips. 45:177-1184.
Barfield, B.J., R.L. Blevins, A.W. Fogle, C.E. Madison, S. Inamdar, D.I. Cary, and V.P. Evangelou. 1998. Water quality impacts of natural filter strips in karst areas. 41:371-381.
Bingham, S.C., P.W. Westerman, and M.R. Overcash. 1980 ffects of grass buffer zone length in reducing the pollution from land application areas. 23:330-342
Castelle, A.J., A.W. Johnson, and C. Conolly. 1994. Wetland and stream buffer size requirements – a review. 23:878-882.
References:
Soil Sci. Soc. Am. J.
Trans. ASAE
Trans. ASAE
J. Environ. Qual.
66
Chaubey, I., D.R. Edwards, T.C. Daniel, P.A. Moore, and D.J. Nichols. 1994. Effectiveness of vegetated filter strips in retaining surface-applied swine manure constituents. 37(3):845-850.
Chaubey, I., D.R. Edwards, T.C. Daniel, P.A. Moore, and D.J. Nichols. 1995. Effectiveness of vegetated filter strips in controlling losses of surface applied poultry litter constituents.
38: 1687-1692.
Cole, J.T., J.H. Baird, N.T. Basta, R.L. Huhnke, D.E. Storm, G.V. Johnson, M.E. Payton, M.D. Smolen, D.L. Martin, and J.C. Cole. 1997. Influence of buffers on pesticide and nutrient runoff from bermudagrass turf. 26:1589-1598.
Coyne, M.S. and R.L. Blevins. 1995. Fecal bacteria in surface runoff from poultry-manured fields. pp. 77-87 in K. Steele (ed.) Animal Waste and the Land-Water Interface. Lewis Publishers: New York.
Coyne, M.S., R.A. Gilfillen, R.W. Rhodes, and R.L. Blevins. 1995. Soil and fecal coliform trapping by grass filter strips during simulated rain. 50(4):405-408.
Coyne, M.S. R.A. Gilfillen, A. Villalba, Z. Zhang, R. Rhodes, L. Dunn, and R.L. Blevins.1998. Fecal bacteria trapping by grass filter strips during simulated rain . 53(2):140-145.
Crane, S.R., J.A. Moore, M.E. Grismer, and J.R. Miner. 1983. Bacterial pollution from agricultural sources: a review. 26:858-866.
Daniels, R.B. and J.W. Gilliam. 1996. Sediment and chemical load reduction by grass and riparian filters. . 60:246-251.
Dillaha, T.A., R.B. Reneau, S. Mostaghimi, and D. Lee. 1989. Vegetative filter strips for agricultural nonpoint source pollution control. 32(2):513-519.
Dosskey, M. G. 2001. Toward quantifying water pollution abatement in response to installing buffers on crop land. 28(5):577-598.
Dosskey, M. G., K. D. Hoagland, et al. 2007. Change in filter strip performance over ten years. , 62(1): 21-32.
Edwards, D.R., T.C. Daniel, and P.A Moore. 1996. Vegetative filter strip design for grassed areas treated with animal manures. 12(1): 31-38.
Edwards, D.R., T.C. Daniel, P.A Moore, and P, Srivastava. 1996. Poultry litter-treated length effects on quality of runoff from fescue plots. 39(1):105-110.
Trans. ASAE
Trans. ASAE
J. Environ. Qual.
J. Soil and Water Cons.
J. Soil Water Cons
Trans. ASAE
Soil Sci. Soc. Am. J
Trans. ASAE
Environ. Manage.
J. Soil Water Cons
Applied Engineering in Agriculture.
Trans. ASAE
67
Eghball, B., J.E. Gilley, L.A. Kramer, and T.B. Moorman. 2000. Narrow grass hedge effects on phosphorus and nitrogen in runoff following manure and fertilizer application.
. 55(2):172-176.
Entry, J.A., R.K.Hubbard, J.E. Thies, and J.J. Fuhrmann. 2000a. The influence of vegetation in riparian filterstrips on coliform bacteria: I. Movement and survival in water29:1206-1214.
Entry, J.A., R.K.Hubbard, J.E. Thies, and J.J. Fuhrman 0b. The influence of vegetation in riparian filterstrips on coliform bacteria: II. Survival in soils. 29:1206-1214.
Epp, D.J. and J.M. Hamlett. 1996. Cost-effectiveness of conservation and nutrient management practices in Pennsylvania. 51(6):486-494.
Gharabaghi, B., R. P. Rudra, et al. 2006. Effectiveness of vegetative filter strips in removal of sediments from overland flow 41(3): 275-282.
Gilley, J.E., Eghball, B., L.A. Kramer, and T.B. Moorman. 2000. Narrow grass hedge effects on runoff and soil loss. . 55(2):190-196.
Groffman, P.M., E.A. Axelrod, and J.L. Lemunyon. 1991. Denitrification in grass and forest vegetated filter strips. 20(3):671-674.
Hayes, J.C., B.J. Barfield, and R.I. Barnhisel. 1984. Performance of grass filters under laboratory and field conditions. 27:1321-1331.
Hawkins, G.L., D.T. Hill, E.W. Rochester, and C.W. Wood. 1998. Evaluation of vegetative filter strips for swine lagoon wastewater. 41(3):639-643.
Jin, C.-X., S.M. Dabney, and M.J.M. Romkens. 2002. Trapped mulch increases sediment removal by vegetative filter strips – a flume study. 45(4):9239-939.
Lee, D., T. A. Dillaha, and J.H. Sherrad. 1989. Modeling phosphorus transport in grass buffer strips. 115(2):409-425.
Lee, K. H., T. M. Isenhart, et al. 2003. Sediment and nutrient removal in an established multi-species riparian buffer . 58(1): 1-8.
Lim, T.T., D.R. Edwards, S.R. Workman, B.T. Larson, and L. Dunn. 1998. Vegetated filter strip removal of cattle manure constituents in runoff. 41:1375-1381.
Liu, F., C.C. Mitchell, D.T. Hill, J.W. Odum, and E.W. Rochester. 1997. Phosphorus recovery in surface runoff from swine lagoon effluent by overland flow. 26:995-1001.
Magette, W.L., R.B. Brinsfield, R.E. Palmer, and J.D. Wood. 1989. Nutrient and sediment removal by vegetative filter strips. 32(2):663-667.
J. Soil Water Cons
. J. Environ. Qual.
J. Environ. Qual.
J. Soil Water Cons.
. Water Qual. Res. J. Canada
J. Soil Water Cons
J. Environ. Qual.
Trans. ASAE
Trans. ASAE
Trans. ASAE
J. Environ. Eng.
. J. Soil Water Cons
Trans. ASAE
J. Environ. Qual.
Trans. ASAE
68
Mendez, A., T.A. Dillaha, and S. Mostaghimi. 1999. Sediment and Nitrogen transport in grassed filter strips. . 35(4):867-875.
Moore, J.A., M.E. Grismer, S.R. Crane, and J.R. Miner. 1983. Modeling dairy waste management systems influence on coliform concentration in runoff. 26:1194-1200.
Osborne, L.L. and D.A. Kovacik. 1993. Riparian vegetated buffer strips in water-quality restoration and stream management. 29:243-258.
Overcash, M.R., S.C. Bingham, and P.W. Westerman. 1981. Predicting runoff pollutant reduction in buffer zones adjacent to land treatment sites. 24:430-435.
Parsons, J.E., R.B. Daniels, J.W. Gilliam, and T.A. Di laha. 1994. Reduction in sediment and chemical load in agricultural field runoff by vegetati ilter strips. Report UNV-WRRI-94-286, Water Resources Research Institute of the University of North Carolina, Chapel Hill, NC.
Parsons, J.E., J.W. Gilliam, T.A. Dillaha, and R. Munoz-Carpena. 1995. Sediment and nutrient removal with vegetated and riparian buffers. Pages 155-158 in Clean Water-Clean Environment-21st Century, Vol. II: Nutrients. Conf. Proc. March 5-8, 1995, Kansas City, MO, ASAE, St.Joseph, MI.
Pearce, R.A., M.J. Trlica, W.C. Leininger, J.L. Smith, and G. W. Frasier. 1997. Efficiency of grass buffer strips and vegetation height on sediment filtration in laboratory rainfall simulations.
. 26:139-144.
Reese, L.E., R.O. Hegg, and R.E. Gantt. 1982. Runoff water quality from dairy pastures in the Piedmont region. 25(3):697-701.
Robinson, C.A., M. Ghaffarzadeh and R.M. Cruse. 1996. Vegetative filter strip effects on sediment concentrations in cropland runoff. 50(3):227-230.
Sanderson, M..A., R.M. Jones, and M.J. McFarland. 2001 ient movement and removal in a switchgrass biomass-filter strip system treated with dairy manure. 30(1):210-216.
Schmitt, T.J., M.G. Dosskey, and K.D. Hoagland. 1999. Filter strip performance and processes for different vegetation, widths, and contaminants. . 28(5):1479-1489.
Sotomayor-Ramirez, D., G. A. Martinez, et al. 2008. Effectiveness of grass filter strips for runoff nutrient and sediment reduction in dairy sludge-amended pastures. 92(1-2): 1-14.
J. American Water Resour. Assoc
Trans. ASAE
Freshwater Biol.
Trans. ASAE
J. Environ. Qual
Trans. ASAE
J. Soil and Water Cons.
J. Environ. Qual.
J. Environ. Qual
J. Agric. Univ.Puerto Rico
?
69
Srivastava, P., D.R. Edwards, T.C. Daniel, P.A. Moore, and T.A. Costello. 1996. Performance of vegetative filter strips with varying pollutant source and filter strip lengths. 39:2231-2239.
Syversen, N. 1995. Effect of vegetative filter strips on minimizing agricultural runoff in southern Norway. Pages 255-256 in The Use of Catch or Cover Crops to Reduce Leaching and Erosion, Proc. Seminar No. 245, Nordic Association of Agricultural Scientists (NJF), October 3-4, 1994, Uppsala, Sweden.
Thompson, D.B., T.L. Loudon, and J.B. Gerrish. 1975. Animal manure movement in winter runoff for different surface conditions. p. 145-157 in Loehr et al. (eds.) Best Management Practices for Agriculture and Silviculture, Ann Arbor Science, Ann Arbor, MI.
Uusi-Kamppa, J., B. Braskerud, H. Jansson, N. Syversen, and R. Uusitalo. 2000. Buffer zones and constructed wetlands as filters for agricultural phosphorus. 29:151-158.
Uusi-Kamppa, J. 2006. Vegetated buffer zones for agricultural non-point source pollution control. 38: 337-343.
Williams, R.D. and A.D. Nicks. 1988. Using CREAMS to simulate filter strip effectiveness in erosion control. . 43:108-112.
Trans. ASAE
J. Environ. Qual.
Soil Manage. for Sust.
J. Soil Water Cons
70
SourceTSS conc. (mg/L) TSS load (kg/ha)
Notes ReferenceIn Out % red In Out % red
Wheat field 29-33% 15m gfs, 2.4% slope, CREAMS Williams and Nicks 1988
?56% 4.6 m vfs
Lee et al. 198980% 9.1 m vfs
Bare soil70% 4.6 m vfs, VA
Dillaha et al. 198984% 9.1 m vfs, VA
Fallow, manure or fertilizer
27,250 9,347 66% 4.6 m plots, MDMagette et al. 1989
27,250 4,878 82% 9.2 m plots, MDCultivated 80-90% 4.2 – 8.4 m vfs, <2% slope, NC Parsons et al. 1994, 1995
Cropland8,280 1,720 79% 96% 4.5 m vfs, 9% slope, KY
Coyne et al. 1995 and 19984,330 670 85% 98% 9.0 m vfs, 9% slope, KY
Corn 64-85% 15 m grassed vfs, CREAMS Epp and Hamlett 1996
Fallow 85% 9.1 m vfs, 7 and 12% slope, IA Robinson et al. 1996
Row crop 30-60% 3-6 m grassed fs, NC Daniels and Gilliam 1996
Erosion plots96.9% 4.6 m grassed fs, 9% slope, KY
Barfield et al. 199899.9% 9.1 m grassed fs, 9% slope, KY99.7% 13.7 m grassed fs, 9% slope, KY
Corn7.89 1.34 83% 151.4 27.4 82% 4.3 m vfs, 18% slope, VA
Mendez et al. 19997.89 1.01 87% 151.4 14.8 90% 8.5 m vfs, 18% slope, VA
Table 3. TSS removal performance, VFS to treat cropland runoff
71
SourceTP conc. (mg/L) TP load (kg/ha)
Notes ReferenceIn Out % red In Out % red
?56% (particulate P) 4.6 m vfs
Lee et al. 198978% 9.1 m vfs
Bare soil69% 4.6 m vfs, VA
Dillaha et al. 198982% 9.1 m vfs, VA
Fallow, manure or fertilizer
32.3 23.6 27% 4.6 m plots, MDMagette et al. 1989
32.3 17.4 46% 9.2 m plots, MDCorn/soy 2.25 0.25 89% 10 m rye strip, IL Osborne and Kovacik 1993
Cultivated ~50% 4.2 – 8.4 m vfs, <2% slope, NC Parsons et al. 1994, 1995
Corn 42-57% 15 m grassed vfs, CREAMS Epp and Hamlett 1996
Various1.28 0.65 50% Ave of Scand. Studies, 2-10 m vfs
Uusi-Kamppa et al. 200027-97% Range of Scandinavian studies
Soluble P conc. Soluble P load? 54% 4.6 m vfs Lee et al. 1989
Bare soil
-83% -+69%
4.6 m vfs, VA
Dillaha et al. 1989-31 -+48%
9.1 m vfs, VA
Erosion plots90.6% 4.6 m grassed fs, 9% slope, KY
Barfield et al. 199898.1% 9.1 m grassed fs, 9% slope, KY96.4% 13.7 m grassed fs, 9% slope, KY
Various 66% 8 mUusi-Kamppa et al. 2000
95% 16 m
Table 4. P removal performance, VFS to treat cropland runoff
72
Source TSS conc. (mg/L) TSS Load (kg/ha)
Notes ReferenceIn Out % red In Out % red
Grassland(swine manure)
61.7 12.1 80% 19.6 6.1 69% 3 m vfs, 3% slope, AR
Chauby et al. 199461.7 11.4 82% 19.6 9.2 53% 6 m vfs, 3% slope, AR61.7 8.7 86% 19.6 6.6 66% 9 m vfs, 3% slope, AR61.7 9.5 85% 19.6 7.3 63% 15 m vfs, 3% slope, AR
Grassland(poultry litter)
61.6 22.3 64% 35.9 22.7 37% 3.1 m vfs, 3% slope, AR
Chauby et al. 199561.6 16.8 73% 35.9 23.8 34% 6.1 m vfs, 3% slope, AR61.6 19.1 69% 35.9 29.8 17% 9.2 m vfs, 3% slope, AR61.6 11.0 82% 35.9 20.2 44% 15.2 m vfs, 3% slope, AR
Grassland0.7 0.6 14% 113 46 59% 6.1 m vfs, 5% slope, AL
Hawkins et al. 19980.7 4.9 +557% 57 36 37% 6.1 m vfs, 11% slope, AL
Pasture133.7 37.5 72% 147,900 44,273 70% 6.1 m vfs, 3% slope, KY
Lim et al. 1998133.7 22.4 83% 147,900 15,074 90% 12.2 m vfs, 3% slope, KY133.7 10.8 92% 147,900 3,798 98% 18.3 m vfs, 3% slope, KY
Table 5. TSS removal performance, VFS to treat grassland runoff
73
. TP conc. (mg/L) TP load (kg/ha)
Notes ReferenceIn Out % red In Out % red
Grassland (swine manure)
11.07 2.11 81% 3.49 1.07 69% 3 m vfs, 3% slope, AR
Chauby et al. 199411.07 1.18 89% 3.49 0.97 72% 6 m vfs, 3% slope, AR11.07 0.57 95% 3.49 0.43 88% 9 m vfs, 3% slope, AR11.07 0.40 96% 3.49 0.32 91% 15 m vfs, 3% slope, AR
Grassland(poultry litter)
6.72 2.22 67% 4.0 2.3 42% 3.1 m vfs, 3% slope, AR
Chauby et al. 19956.72 1.04 85% 4.0 1.5 62% 6.1 m vfs, 3% slope, AR6.72 0.59 91% 4.0 0.9 78% 9.2 m vfs, 3% slope, AR6.72 0.29 96% 4.0 0.6 85% 15.2 m vfs, 3% slope, AR
Grassland66% 6.1 m,3% sl, source 18.3 m, AR
Srivastava et al. 199636% 12.2 m,3% sl, source 12.2 m, AR26% 18.3 m,3% sl, source 6.1 m, AR
Grassland2.7 2.1 22% 566 141 75% 6.1 m vfs, 5% slope, AL
Hawkins et al. 19982.7 3.0 +11% 300 24 92% 6.1 m vfs, 11% slope, AL
Grass 15.42 2.78 82% 142 0.36 99% 6.1 m, 5 & 10% slopes, AL Liu et al. 1997
Pasture1.42 0.32 77% 1.56 0.38 76% 6.1 m vfs, 3% slope, KY
Lim et al. 19981.42 0.15 89% 1.56 0.14 91% 12.2 m vfs, 3% slope, KY1.42 0.23 84% 1.56 0.09 94% 18.3 m vfs, 3% slope, KY
Switchgrass47% 14.6 m, 1% sl., med manure, TX
Sanderson et al. 200176% 14.6 m, 1% sl., high manure, TX
Soluble P conc. (mg/L) Soluble P load (kg/ha)
Grassland (swine manure)
9.79 2.01 80% 3.10 1.01 68% 3 m vfs, 3% slope, AR
Chauby et al. 19949.79 1.07 89% 3.10 0.86 73% 6 m vfs, 3% slope, AR9.79 0.46 95% 3.10 0.34 89% 9 m vfs, 3% slope, AR9.79 0.29 97% 3.10 0.23 93% 15 m vfs, 3% slope, AR
Grassland(poultry litter)
4.29 1.38 68% 2.5 1.5 40% 3.1 m vfs, 3% slope, AR
Chauby et al. 19954.29 0.75 82% 2.5 1.1 56% 6.1 m vfs, 3% slope, AR4.29 0.44 90% 2.5 0.7 72% 9.2 m vfs, 3% slope, AR4.29 0.20 95% 2.5 0.4 84% 15.2 m vfs, 3% slope, AR
Table 6 P removal performance, VFS to treat grassland runoff
74
Grass turf9.57 1.94 80% 911* 276* 70% 2.4 m vfs, 6% slope, OK
Cole et al. 19979.57 1.25 87% 911* 246* 73% 4.9 m vfs, 6% slope, OK
Pasture1.28 0.31 75% 1.4 0.36 74% 6.1 m vfs, 3% slope, KY
Lim et al. 19981.28 0.17 87% 1.4 0.16 88% 12.2 m vfs, 3% slope, KY1.28 0.23 82% 1.4 0.09 93% 18.3 m vfs, 3% slope, KY
mass in mg*
75
water and sediment control basin (WASCOB) is a small earthen ridge-and-channel or embankment built across (perpendicular to) a small watercourse or area of concentrated flow within a field. WASCOBs are commonly built in a parallel series with the first ridge crossing the top of the watercourse and the last ridge crossing the bottom. They are designed to trap agricultural runoff water and sediment as it flows down the watercourse; this keeps the watercourse from becoming a field gully and reduces the amount of runoff and sediment leaving the field. WASCOBs are similar to terraces in form and function, but the two practices are not interchangeable. Whereas terraces (and other contour practices, such as contour stripcropping and contour buffer strips) work best on relatively uniform slopes, WASCOBs are generally reserved for fields with irregular topography where contour practices would be difficult to implement or likely to fail. While terraces generally extend all the way to field edges, following the contour of a slope in a ribbon-like pattern, WASCOBs from a distance look more like short, straight slivers, just long enough to bridge an area of concentrated flow. WASCOBs are generally grassed. The runoff water detained in a WASCOB is released slowly, usually via infiltration or a pipe outlet and tile line.
In general, advantages of a WASCOB system include:The peak runoff flows from a watershed are buffered reducing their erosive capability downstream; Sediment settles out of the runoff water in the storage pond decreasing sediment delivery from the field;Outlet flows from the storage pond are small in comparison to a system without storage, resulting in smaller diameter, lower cost outlet pipes; and Potential plugging of the pond tile inlet system is minimized, as compared to a tile/catch basin system with no storage, because debris has time to settle out before reaching the inlet pipe.
Disadvantages of a WASCOB system include:Flooding of the land in the ponding area will occur for a period up to 24 hours after a runoff event;A higher risk is associated with this structure because of the possibility of berm washout or water overtopping the berm causing problem further down in the watershed; There is an inconvenience factor associated with farming operations around the berms; Berms (especially narrow-based) are vulnerable to rodent damage which could result in failure; and Terraces that drain via underground drain lines trap sediment so that ponding volume will be reduced over time, rendering the terraces ineffective because of overtopping. Use ofsoil erosion practices between terraces may extend the life of such terraces.
WASCOBs have been a recommended cropland erosion control practice for decades, especially in the Midwest. Most testing of the practice appears to have been done decades ago. There is surprisingly little recent published research on indiv ffectiveness on sediment and attached P.
6.0 Water and Sediment Control Basins
6.1 IntroductionA
•
•
•
•
•
•
••
•
76
Laflen et al. (1972) reported that average annual soil loss from four tile-outlet terrace systems in Iowa was less than 750 lb/ac (840 kg/ha) and <5% of so l erosion between terraces, i.e., about 95% of material eroded between terraces was deposited in pondage areas around underground outlets. Sediment concentrations averaged 800 – 3,850 mg/L. Most soil loss through the terrace systems consisted of particles and aggregates <0.016 mm.
Also in Iowa, Hanway and Laflen (1974) measured nutrient losses in runoff water from four tile-outlet terrace systems and in tile drainage from two of the systems annually over a 3-year period. The authors found that tile-outlet terraces reduced sediment-borne nutrient losses but did not reduce soluble plant nutrient losses. Total P losses in surface runoff varied from 0.44 to 1.06 kg/ha and, at any one location, were highly correlated with sediment losses. Average annual concentrations of total P in surface runoff ranged from 1.01 to 3.60 mg/L and in tile drainage from two sites were 0.028 and 0.061 mg/L. Soluble P concentrations in surface runoff were related to available P in the surface soils, and concentrations in tile drainage were related to available P in the subsoils. Annual average inorganic P concentrations in surface runoff varied from 0.013 to 0.204 mg/L and in tile drainage were 0.004 and 0.018 mg/L. Concentrations of inorganic N varied widely among locations, but were re ively constant at a location. Average annual inorganic N concentrations in surface runoff were 4 mg/L or less at three of the four sites and 11 mg/L at one site. Concentrations of inorganic N re similar and were lower in surface runoff than in tile drainage. There was no relation between the amounts of fertilizer applied and plant nutrient losses or concentrations in runoff or drainage water
[reviewer’s note: These papers were not available in digital format and could not be obtained for this review. Unfortunately, the abstracts lack detail and, for example, do not clearly indicate whether this concentration or particle characterization was before or after the terrace system or where the P concentrations and loads were measured]
Schepers et al. (1985) compared runoff collected from terrace and sediment-control basins having tile-outlet systems with runoff water quality in northeastern Nebraska. Soils in the area are very erosive when subjected to high-intensity rainfall in the spring and summer. Sediment concentrations in runoff from the terraces and sediment basins were initially high and comparable to stream concentrations until a pool of runoff water formed around the riser inlet of the tile discharge system. Formation of a pool allowed sediment to settle out away from the riser inlet, thus reducing sediment losses from the field. The authors noted that each new runoff event or increase in rainfall intensity may cause a temporary increase in sediment discharge until a new or larger pool forms around the riser. As soon as a pool of runoff water forms around the riser inlet of the tile system, velocity in the pool decreases and most larger particles and aggregates settleout. This pattern may be missed if monitoring collects composite sample representing the entire event rather than discrete samples across the hydrograph. Sediment-borne N and P accounted for 85 to 98% of total N and P losses from the land. Because tile-outlet terraces and sediment basins effectively reduced sediment and nutrient concentrations in runoff, they provedto be an effective BMP for use by producers.[reviewer’s note: This paper compared sediment and nutrient concentrations in runoff from two treatment systems – tile-outlet terraces and sediment control basins – with concentrations in
6.2 Older Research
77
streamflow. No direct measurements of removal of sediment or nutrients from field runoff were reported.]
Edwards et al. (1999) delivered simulated agricultural runoff, amended with sediment, N, and P, through an experimental sedimentation basin. A series of six sequential runoff events was run through the basin for each of two treatments. The treatments consisted of one-day and three-day detention times, created using a perforated riser outlet structure. Effluent concentrations were monitored for total suspended sediment and various forms of nitrogen and phosphorus. For all runs, an average of 94% of the sediment, 76% of the N, and 52% of the P added to the inflow were retained by the basin. The three-day treatment retained significantly more sediment than the one-day treatment (p = 0.02). The majority of the sediment, N, and P was released within the first 12 h during the three-day runs and the first 4 h during the one-day runs.
Czapar et al. (undated) reported on WEPP simulations of the effects of various erosion control practices on nutrient losses. For central Iowa climate, averaged over 10 Iowa soils and a 72.6 foot long slope of 9% and a 300 foot long slope of 5%, the authors estimated the following practice effectiveness:
6.3 Recent Work
78
Zhou et al. (2009) also used the WEPP model to evaluate cost-effectiveness of combinations of soil erosion control practices in Iowa. Although terrace structures were not evaluated as individual practices, the addition of terrace structures reduced the sediment yield from fields under various tillage practices, primarily in situations of higher soil loss:
The authors noted that the WEPP simulation results indicated that little benefit was gained from terrace systems in sediment reduction for sites with relatively low erosion potential, but attributed this finding to the inability of WEPP to adequately simulate rill and interrill erosion..Fu et al. (2010) studied semicircular rainwater retention basins (called “fish-scale pits”) in China to evaluate their effect on the reduction in runoff and sediment yield under a heavy rainstorm and to identify parameters for design. Results showed that the relative reduction in runoff from the fish-scale plot increased with the rainfall amount before water spillover occurred and then decreased. The relative reduction in sediment from the fish-scale plot first increased with rainfall and then slowly decreased to a constant value. The relative reductions in runoff for 20-year (160 mm), 10-year (120 mm), and 2-year (54 mm) return period daily rainfall were 18%, 28%, and 39%, respectively. The relative reduction in sediment for 20-, 10-, and 2-year return period daily rainfall was approximately 76% in all cases. The rainfall amount had an impact on the relative reduction in runoff, but no significant impact on the relative reduction in sediment after water spillover occurred. The results indicate that fish-scale pits played an important role in reducing sediment under heavy rainstorm conditions.
In a long-term land treatment/water quality study of the 10,276 ha Blue Creek watershed in Illinois, White et al. (2008) evaluated the effects of a program of cropland erosion/sediment control on sediment loading to Lake Pittsfield. Insta lation of 29 WASCOBS in the watershed significantly reduced sediment delivery to the Lake. Sediment yields from individual storms monitored at the watershed outlet dropped by 45 – 48% in the first year after the WASCOBS were installed. Analysis of the full 10-year project period indicated a 60 – 68% reduction in sediment yield from several subwatersheds. Sediment yields in one subwatershed were 1.2 – 2.2 kg/ha/yr lower in one subwatershed after WASCOB instal ion.
Although not specific to WASCOBs, the following paper may offer some relevant information.
Fiener et al. (2005) suggested that when terrace-contouring systems with on-site water detention (i.e., WASCOBs) cannot be installed in areas of complex topography, small parceling and multi-
blade moldboard plow use, field borders at the downslope end may be raised at the deepest part where runoff overtops to create detention ponds, which can be drained by subsurface tile outlets and act similar to terrace-contouring systems. The authors monitored four such structures over 8 years. Monitored effects included the prevention of linear erosion down slope, sediment trapping from upslope, enrichment of major nutrients in the trapped and delivered sediments, retention of some amount of runoff temporarily, runoff reduced by infiltration, decrease in peak runoff rate and decrease in peak concentrations of agrochemicals due to the mixing of different volumes of water within thedetention ponds. The detention ponds had a volume of 30–260 m3/ha and trapped 54–85% of the incoming sediment, which was insignificantly to slightly depleted (5–25%) in organic carbon, phosphorus, nitrogen and clay as compared to the eroding topsoil, while the delivered sediment was strongly enriched (+70–270%) but part of this enrichment already resulted from the enrichment of soil loss. The detention ponds temporarily stored 200–500 m3 of runoff. A failure was never experienced. Due to the siltation of the pond bottom, the short filled time (1–5 days) and the small water covered area, infiltration and evaporation reduced runoff by less than 10% for large events. Peak runoff during heavy rains was lowered by a factor of three. Peak concentrations of agrochemicals (Terbutylazin) were lowered by a factor of two. The detention ponds created by raising the downslope field borders at the pour point efficiently reduced adverse erosion effects downslope the eroding site. They are cheap and can easily be created with on-farm machinery. Their efficiency is improved where they are combined with an on-site erosion control like mulch tillage because sediment and runoff input are reduced. Ponds had to be dredged only after the first year when on-site erosion control was not fully effective.
Czapar, G.F., J.M. Laflen, G.F. McIsaac, and D.P. McKenna. Date unknown. Effects of Erosion Control Practices on Nutrient Loss. Source unknown. http://www.epa.gov.ezproxy.uvm.edu/owow_keep/msbasin/pdf/symposia_ia_session9.pdf
Edwards, C.L., R.D. Hannon, and A.R. Jarrett. 1999. Sediment basin retention efficiencies for sediment, nitrogen, and phosphorus from simulated agricultural runoff. 42:403-409.
REFERENCES
Trans. ASABE
80
Fiener, P., K. Auerswald, and S. Weigand. 2005. Managing erosion and water quality in agricultural watersheds by small detention ponds. .110:132–142.
Fu, S., B. Liu, G. Zhang, B. Lu, and Z. Ye. 2010. Fish-scale pits reduce runoff and sediment. Trans. ASABE. 53:157-162.
Hanway, J.J. and J.M. Laflen. 1974. Plant nutrient losses from tile-outlet terraces. . 3:351-356.
Laflen, J.M., H.P. Johnson, and R.C. Reeve. 1972. Soil loss from tile-outlet terraces. . 27:74-77.
Schepers, J. S., D. D. Francis, and L. N. Mielke. 1985. Water quality from erosion control structures in Nebraska. . 14:186-190.
White, W.P., J. Beardsley, D. Devotta, and S. Tomkins. 2008. Lake Pittsfield Illinois National Nonpoint Source Monitoring Program Project. NWQEP Notes, No. 129, NC State University, Raleigh, NC http://www.bae.ncsu.edu/programs/extension/wqg/issues/notes129.pdf
Zhou, X., M. Al-Kaisi, and M.J. Helmers. 2009. Cost effectiveness of conservation practices in controlling water erosion in Iowa. . 106:71–78.
Agric. Ecosyst. Environ
J. Environ. Qual
J. Soil Water Cons
J. Environ. Qual
Soil Tillage Res
81
Subsurface drainage is an essential water management practice on many agricultural fields, allowing crop production and timely equipment access in fields otherwise too wet to effectively farm. The combined effects of drawing down the water table and providing a rapid conveyance of subsurface water to an outlet often changes the hydrologic behavior of a field dramatically, reducing surface runoff by enhancing infiltration and ground water transmission. For example, a recent SWAT modeling analysis in the Missisquoi River Basin showed that the addition of tile drainage to hay fields on hydrologic soil group C and D soils reduced the surface runoff component of the water balance by 25 to >40% (Winchell 2011). Because of the potential reduction in surface runoff, subsurface drainage has been proposed as a means to reduce runoff losses of P and sediment from agricultural fields in the LCB.
However, artificial drainage can also enhance nutrient losses because the volume of water exiting the field is increased and the time during which the nutrients could be sorbed by the soil matrix is decreased. Because it encourages rapid movement of infiltrating water into the surface water network, for example, drainage has been implicated as enhancing delivery of nitrate-N and other soluble substances from agricultural fields to surface waters. Nitrate carried in drainage watercontributes to major water quality problems in the Chesapeake Bay and the Gulf of Mexico and means of reducing the nitrate loads while maintaining adequate drainage for crop production are a significant conservation priority (Frankenberger 2006). Similar concerns have rarely been expressed for P and sediment, as traditionally, it has been assumed that sediment and particulate P losses from agricultural lands occur primarily during surface runoff events and very little is lost through subsurface drainage. However, research has revealed that some subsurface drainage systems in agricultural fields can also discharge significant quantities of P under a wide range of soil characteristics and management practices (Heckrath et al. 1995, Gardner et al. 2002, Beauchemin et al. 2003). Therefore, it is important to examine published information not only on the effects of subsurface drainage on runoff losses of sediment and P but also on such losses in drainage water.
In Finland, Turtola and Paajanen (1995) determined the influence of improved subsurface drainage on soil erosion, P losses and N leaching from fields planted in grasses and small grains. A heavy clay soil with a 29 year old subdrainage system was fitted with new drains, with topsoil or wood chips used as backfill in the drain trenches. Before improved drainage, drainage water constituted only l0 - 40% of the total runoff (drainage + surface runoff) but after improved drainage the proportion of drainage water increased to 50-90%. Where topsoil was usedas backfill, the estimated soil erosion and particulate P and dissolved orthophosphate P losses from plowed soil during winter were lower after improved drainage than before (1168 vs. 1408 kg/ha, 0.58 vs. 0.69 kg/ha, 0.09 vs. 0.12 kg/ha, respectively). Where wood chips were used as backfill, soil erosion and particulate P losses were not reduced. Owing to the increased drainage discharge, nitrogen leaching during barley cultivation was much higher after improved drainage(14 vs. 7 kg/ha/yr).
7.0 Tile Drainage
7.1 Introduction
7.2 Effects on runoff, P and, sediment
82
Grazhdani et al. (1996) conducted a study of the effect of subsurface drainage on nutrient pollution of surface waters on silage corn plots in south-eastern Albania. The objectives of this study were: (a) to evaluate the effectiveness of subsurface drainage on reducing soil and nutrient erosion and surface run-off, and (b) to identify and evaluate the best water management practices to minimize off-site environmental impacts of drainage on outflow water quality. Subsurface drainage reduced soil erosion and loss of the most plant nutrients by substantial amounts on medium to heavy texture soils on slopes of < 2%. Nutrient concentrations did not appear to be significantly affected by the type of drainage system. Rather, drainage outflow volume was the most important factor affecting total nutrient transport. Subsurface drainage reduced soil and losses. Surface run-off carried an annual average of 1,752 – 2,992 kg/ha of soil from the non-drained plots, while the drained plots lost 1,340 – 2,088 kg/ha of soil, a 24 to 31% reduction due to subsurface drainage. The average annual P losses from the drained and non-drained plots were 2.5 – 3.6 kg/ha, and 3.6 – 5.6 kg/ha, respectively, demonstrating a 30 – 35% reduction due to subsurface drainage. The subsurface discharges contained 0.22 – 0.36 kg P/ha or 5 to 14% of the lost P. The authors concluded that on certain soil types, subsurface drainage may be the preferred best management practice for soil conservation and improving the quality of water leaving agricultural watersheds.
Algoazany et al. (2007) evaluated the effects of agricultural management practices on waterquality in an intensively drained IL watershed. The study objective was to assess the fate and transport of soluble P through subsurface drainage and surface runoff on sites with corn and soybeans. Subsurface drainage and surface runoff across all sites removed an average of 16.1 and 2.6% of rainfall, respectively. Annual flow-weighted soluble P concentrations fluctuated with the precipitation, while concentrations tended to increase with high precipitation coupled with high application rates. The long-term average flow-weighted soluble P concentrations in subsurface flow were 86 - 194 mg/L. In contrast, the long-term average flow-weighted soluble P concentrations in surface runoff were 253 – 572 mg/L. Statistical analysis indicated that the effects of crop, discharge, and the interactions between site and discharge and crop and discharge on soluble P concentrations in subsurface flow were significant. Soluble P mass loads in surface runoff responded to discharge more consistently than in the subsurface flow. Subsurface flow had substantially greater annual average soluble P mass loads than surface runoff due to greater flow volume.
Bilotta et al. (2008) questioned the widespread assumption that grassland suffer from minimal soil erosion and present little threat to surface water quality from sediment and sorbed contaminants. The authors reported results from observations on a field-experiment monitoring overland flow, drain flow, fluxes of suspended solids, total phosphorus (TP), and molybdate-reactive P in response to natural rainfall events on artificially drained grassland in the UK.During individual rainfall events, 1-ha grassland lysimeters yielded up to 15 kg of suspendedsolids, with concentrations in runoff waters of up to 400 mg/L. These concentrations exceedcommon water quality standards and are above levels reported to have caused chronic effects on freshwater aquatic organisms. Furthermore, TP concentrations in runoff waters from these field lysimeters exceeded 800 µg/L. These concentrations are in excess of those reported to cause eutrophication problems in rivers and lakes and contravene nutrient criteria in all of the U.S. ecoregions. The paper also examines how subsurface drainage influences the hydrology and export of sediment and nutrients from grasslands. Mass export of SS and TP was significantly
83
lower (e.g., by 3 – 59% and by 21 – 51% for SS and TP, respectively) from drained land over five or six storm events.
Eastman (2008) monitored nutrient losses from clay loam and sandy loam soils under both subsurface and naturally drained conditions in the Pike River watershed of southern Québec.Results illustrate how the presence of subsurface drainage influences P loss depending on soil texture and structure. Total P loss from the clay loam subsurface drained site was 4.0 kg/ha, 55% greater than the naturally drained clay loam site. Total phosphorus loss from the sandy loam subsurface drained site was 1.2 kg/ha, 14% less than the naturally drained sandy loam site. Total phosphorus losses from the subsurface drainage systems in the clay loam field and the sandy loam field were 2.3 and 0.4 kg/ha, respectively. Particulate phosphorus was the dominant (78%) form of phosphorus loss from the subsurface drainage system at the clay loam site. This indicates that bypass flow through the soil profile in the clay ld led to excessive total phosphorus loss.
Bhattarai et al. (2009) monitored the retention and transport of nutrients within a grassed VFS (treating feedlot runoff in IL) that had a subsurface drainage system installed at a depth of 1.2 m below the soil surface. Results showed that PO4-P, NO3-N, and TP concentrations decreased in surface flow through the VFS. Many surface outflow water samples from the VFS showedconcentration reductions of as much as 75% for PO4-P and 70% for TP. For subsurface outflow water samples through the drainage system, concentrations of PO4-P and TP decreased but NO3-N concentrations increased in comparison to concentrations in surface inflow samples. Soil samples that were collected from various depths in the VFS showed a minimal buildup of nutrients in the top soil profile but indicated a gradual buildup of nutrients at the depth of the subsurface drain. Results demonstrate that although a VFS can be very effective in reducing runoff and nutrients from surface flow, the presence of a subsurface drain underneath the VFS may not be environmentally beneficial. Such a combination may increase NO3-N transport from the VFS Although the subsurface drainage system under a VFS helps in removing a higher volume of water in a shorter period of time and prevents inundation of the vegetation, it can provide a path for NO3-N to be transported off site quickly.
Eastman et al. (2010) investigated P transport under subsurface and naturally drained agricultural fields with two common soil types (clay loam and sandy loam) in the Pike River watershed of southern Quebec. Sites A–B had subsurface drainage whereas sites C–D were naturally drained. In addition, sites A–C had clay loam soils whereas sites B–D had sandy loam soils. Analysis of data acquired over two years revealed that site A (subsurface drained, clay loam) discharged 1.8 times more water than site B (subsurface drained, sandy loam), 4 times more than site C(undrained, clay loam) and 3 times more than site D (undrained, sandy loam). The presence of subsurface drainage in sandy loam soils had a significant beneficial effect in minimizing surface runoff and total phosphorus (TP) losses from the field, but the contrary was observed in clay loam soils. This was attributed to the finding that P speciation as particulate phosphorus (PP) and dissolved phosphorus (DP) remained relatively independent of the hydrologic transport pathway, and was a strong function of soil texture. For clay loam soils, average annual TP loss at site A(subsurface drained) was 2.9 kg/ha/yr, of which 1.5 kg/ha/yr exited through the subsurface drainage system. In comparison, TP loss through surface runoff at site C (undrained) was 0.9 kg/ha/yr over the study period. Subsurface drainage in clay loam soils was an equal contributor
.
84
to phosphorus transport, along with surface runoff. For sandy loam soils, total P loss from site B (subsurface drained) due to surface runoff (0.5 kg/ha/yr) was slightly greater than TP loss insubsurface drained water (0.3 kg/ha/yr), despite much larger outflow volumes in subsurface drainage at site B. TP loss in surface runoff from the naturally drained site D was 0.6 kg/ha/yr. In general, TP losses for the sandy loam sites were lower than for the clay loam sites. While 80% of TP occurred as PP at both clay loam sites, only 20% occurred as PP at both sandy loam sites.Moreover, P transport pathways in artificially drained soils were greatly influenced by the prevailing preferential and macropore flow conditions. The authors suggested that factors such as soil micro and macropores, preferential flow and fingering facilitate higher migration of TPfrom clay loam soils than sandy loam soils. As a management practice, subsurface drainage thus appears to have a greater beneficial effect in controlling phosphorus transport in sandy loam soils than in clay loam soils. The authors concluded that the construction of subsurface drainage in sandy loam soil would greatly reduce the likelihood of surface runoff occurrence, and thus minimize the likelihood of high concentration discharges of P into surface waters.
Sims et al. (1998) reviewed research on P leaching and export in subsurface runoff and present in the Atlantic Coastal Plain of the USA (Delaware), the midwestern USA (Indiana), and eastern Canada (Quebec). Research clearly indicates that P losses in subsurface runoff can be an important component of the total P export from some agricultural watersheds and should be considered in management strategies to minimize nonpoint source pollution of surface waters. The authors noted that the most immediate concerns are with those areas where soil P concentrations are already very high (e.g., regions with intensive animal production or heavy P fertilizer use for vegetable crops), soil P sorption capacities are low (sandy soils and high organic matter soils), and subsurface transport is enhanced by artificial drainage systems (tiles and surface ditches), especially in areas with extensive preferential flow through soil cracks and macropores.
Beauchemin et al. (1998) measured the concentration and characterized the P forms in drainage waters from nine soil series widely differing in clay content from 27 sites in an intensively cropped area of the province of Quebec, Canada. Drainage waters were characterized for their total P (TP), dissolved reactive P (DRP), dissolved organic P (DOP), and total particulate P (TPP) contents. The Quebec surface water quality standard of 0.03 mg TP/L was exceeded in 14 out of 27 sites in 1994 but only in 6 out of 25 sites 995. Of the 14 sites exceeding 0.03 mg TP/L in 1994, 10 were clay soils. Under these circumstances, more than 50% of the TP was as TPP whereas DOP forms represented <30%. In 1995, TPP forms accounted for, on average, <50% of TP and DOP accounted for more than 40% of the is study suggests that flat clay soils of medium to rich P status may be particularly at risk of exceeding water quality standards in subsurface runoff. Phosphorus losses in particulate form may be important in subsurface runoff from clayey soils when weather conditions favor rapid flow through cracks or macropores.
Grant et al. (1996) reported an average annual TP loss of 0.241 kg P/ha from four artificially drained catchments in Denmark. The authors noted that drainage P losses of this order were small compared to the annual net input of P to arable land in most European countries but were
7.3 P in drainage water
85
nevertheless highly significant with regard to eutrophication of surface waters. They concluded that P loss from artificially drained loamy soils represents a major source of diffuse P loss to the Danish aquatic environment.
Laubel et al. (1999) described and quantified particulate matter (PM), particulate phosphorus (PP) and dissolved phosphorus (DP) transport to tile drains during controlled plot experiments in Denmark. The results were compared to corresponding studies of natural storm events in the tile-drained catchment as a whole. Six rain simulations (ir gation 15.3-37 mm) were carried out at two 25 m2 plots on a loamy soil. Tracer chloride concentration in the drainage water peaked within 1 h of the onset of irrigation, thus indicating rapid macropore flow to the drains. PM, PP, and DP concentrations were highest in the initial drainage flow: 63 to 334 mg PM/L, 0.177 to 0.876 mg PP/L, and 0.042 to 0.103 mg DP/L, respectively, Particulate matter and PP loss rates measured for the rapid drainage flow response were in the same range in the plot experiments as for nine precipitation events in the tile-drained catchment (13.3 ha): 171 to 630 g PM/ha/mm vs. 141 to 892 g PM/ha/mm, and 0.57 to 1.75 g PP/ha/mm vs. 0.71 to 5.92 g PP/ha/mm, respectively. Tracer analysis using 137Cs revealed that the PM in the drainage water was derived from the topsoil.
Uusitalo et al. (2001) compared the concentrations of different P forms in surface and subsurface runoff and assessed the potential algal availability of particulate phosphorus (PP) in runoff waters from two crop fields in Finland. The material consisted of 91 water-sample pairs (surface runoff vs. subsurface drainage waters) from two artificially drained clayey soils and was analyzed for total suspended solids (TSS), total P (TP), dissolved molybdate-reactive P (DRP), and anion exchange resin– extractable P (AER-P). On the basis of these determinations, we calculated the concentrations of PP, desorbable particulate P (PPi), and particulate unavailable (nondesorbable) P (PUP). Some water samples and the soils were also analyzed for 137Cs activity and particle-size distribution. The major P fraction in the waters studied was PP and, on average, only 7% of it was desorbable by AER. However, a mean of 47% of potentially bioavailable P (AER-P) consisted of PPi. The suspended soil material carried by drainflow contained as much PPi (47–79 mg/kg) as did the surface runoff sediment (45–82 mg/kg). The runoff sediments were enriched in clay-sized particles and 137Cs by a factor of about two relative to the surface soils. Results showed that desorbable PP derived from topsoil may be as important a contributor to potentially algal-available P as DRP in both surface and subsurface runoff from clayey soils.
In Pennsylvania, Kleinman et al. (2003) found no evidence of water-soluble P translocation through the soil matrix from shallow subsoil horizons and concluded that leaching of dissolved P from the soil matrix was likely not of environmental importance. However, elevated P concentrations in deeper portions of the soil profile indicated that subsurface P transport via macropores was probably occurring to tile-drain depths. The authors concluded that P transport by subsurface pathways can be an important mechanism of P transfer from land to water in heavily manured soils, especially those that are artif ially drained or have preferential flow pathways connected to stream channel discharge.
Kinley et al. (2007) characterized variability in total P (TP) and soluble reactive P (SRP) concentrations in weekly drainage samples from 39 agricultural fields planted in grass, corn, and soybeans in Nova Scotia, Canada. The study examined the relationships between in tile drainage
86
and factors such as (i) soil texture; (ii) discharge flow rate; (iii) soil test P (STP); (iv) manure type; and (v) crop cover. Mean P concentrations in drainage water were 0.23 mg/L TP and 0.08 mg/L soluble P. Mean TP concentrations exceed the USEPA TP guideline of 0.10 mg/L at 82% of the fields, and periodically concentrations more than 10 times, and occasionally more than 50 times higher than the guideline were found. Poultry and swine manure contributed to high soil test P and to constantly high TP concentrations with high proportions of SRP in drainage water. The proportion of SRP in TP had a tendency to be higher when TP levels were high in coarse textured soils.
Schilling and Helmers (2008) compared tile-drained watersheds to karst drainage basins to improve understanding of watershed-scale nutrient loses from subsurface drainage networks. The authors examined short-term variations in discharge and chemistry from a tile outlet collecting subsurface tile flow from a 963 ha agricultural watershed in Iowa. Study objectives were to apply analytical techniques from karst springs to tile discharge to evaluate water sources and estimate the loads of agricultural pollutants discharged from the tile with conduit, intermediate and diffuse flow regimes. A two-member mixing model using nitrate, chloride and specific conductance was used to distinguish rainwater versus groundwater inputs. Results indicated that groundwater comprised 75% of the discharge for a three-day storm period and rainwater was primarily concentrated during the hydrograph peak. A contrasting pattern of solute concentrations and export loads was observed in tile flow. During base flow periods, tile flowconsisted of diffuse flow from groundwater sources and contained elevated levels of nitrate, chloride and specific conductance. During storm events, suspended solids and pollutants adhered to soil surfaces (phosphorus, ammonium and organic nitrogen) were concentrated and discharged during the rapid, conduit flow portion of the hydrograph. During a three-day period, conduit flow occurred for 5.6% of the time but accounted for 16.5% of the total flow. Nitrate and chloride were delivered primarily with diffuse flow (more than 70%), whereas 80–94% of total suspended sediment, phosphorus and ammonium were exported with conduit and intermediate flow regimes. During storm events in tiled landscapes, the higher velocity of rainfall–runoff carries sediment and other particulates through surface inlets into the tile network and mobilizes any sediment that had settled at the bottom of the tile network. Suspended solids and any pollutants adhered to soil surfaces (P, TKN and NH4–N) are concentrated during peak flow and discharged during the conduit flow portion of the hydrograph. The mixing model showed that rainwater arrived quickly at the tile outlet.
Recently, water table management systems that can provide both controlled drainage (CD) and subirrigation (SI) through already existing tile drains have been promoted. Because such systems provide crops with the adequate amount of water throughout the growing season, they can increase crop yields and they can significantly reduce nitrate losses in tile drains, mainly by increasing denitrification rates in the soil profile. Relatively little work has been reported on the effects of controlled drainage or improved drainage management on P losses.
From a survey of data on controlled drainage at 14 locations in eastern North Carolina, Evans et al. (1996) concluded that:
7.4 Drainage water management
87
Controlled drainage, when managed all year, reduces total outflow by approximately 30 percent compared to uncontrolled systems, although outflows vary widely depending on soil type, rainfall, type of drainage system and management intensity. For example, control only during the growing season typically reduces outflow by less than 15%. The effect of controlled drainage on peak outflow rates varies seasonally. Drainage control reduces peak outflow rates during dry periods (summer and fall) but may increase peak outflow rates during wet periods (winter and spring), depending on the control strategy.Drainage control has little net effect on total N and P concentrations in drainage outflow. Controlled drainage may reduce nitrate-N concentrations in drainage outflow by up to 20%, but total Kjeldahl nitrogen concentrations are somewhat increased. Controlled drainage tends to decrease P concentrations on predominately surface systems but has the opposite effect on predominately subsurface systems. Seasonal variations may also occur, depending on rainfall, soil type, and the relative contribution of surface or subsurface drainage to total outflow. Controlled drainage reduces N and P transport at the field edge, primarily because of the reduction in outflow volume. In 14 field studies, drainage control reduced the annual transport of total N at the field edge by 10 kg/ha, or 45%, and total P by 0.12 kg/ha, or 35%. Again, the reductions at individual sites were influenced by rainfall, soil type, type of drainage system, and management intensity.
In Quebec, Canada, Valero et al. (2007) investigated water table management impacts on P loads in tile drainage. Increased P concentrations, consistently exceeding Quebec’s surface waterquality standard of 0.03 mg/L total P, caused increased P loads in tile drainage fromcontrolled drainage/subirrigation (CD/SI) plots compared to free drainage (FD) plots. Thishappened even though the total outflow volumes from CD/SI plots were reduced by 27%compared to FD plots. TP, TDP and DRP concentrations in drainage water from CD/SI plots were on average increased by 131%, 136% and 178%, respectively, compared to FD plots. As a consequence, overall P loads in tile drainage were increased in CD/SI plots. Of the total P concentration, around 96% was in the form of dissolved P under both treatments. The results also showed that CD/SI had no effect on the soil P concentration and P saturation. During the experiment, the SI water added about 0.84 kg P/ha, which was negligible compared to the fertilizer input on the field, but represented about 8.5 times the average total P loss from CD/SI plots. However, a laboratory soil column experiment, in which the two drainage treatments were simulated and P-free water was used for SI, also showed increased P concentrations under CD/SI. This confirmed that the increased P loads in tile drainage under CD/SI were most likely caused by an increase in P solubility due to the shallow water table inherent to the water table management system rather than by the addition of P from the SI water.
Wesstrom and Messing (2007) examined the effects of controlled drainage on N and P losses from soils in a 4-year field drainage experiment in southern Sweden. Of the three plots (0.2 ha each), one was drained by conventional subsurface drainage (CD), and two by controlled drainage (CWT1 and CWT2). The groundwater level in the CWT plots was naturally drained to at least 70 cm below the soil surface during the vegetation period between early spring and harvest but allowed to rise to 20 cm below the soil surface during the rest of the year. Controlled drainage significantly lowered N and P loads in drain outflow and altered N dynamics in soil. The relative decrease in N and P loading in drain outflow from CWT plots, compared with CD,
•
•
•
88
was of the same magnitude as the reduction in drain outflow rate (60–95%). The high-risk periods for N losses coincided with periods of high outflow rates and high mineral N content in soil, for all years and for all treatments. Positive correlations in N concentrations in drain outflow were found between drainage systems. In contrast, high risk periods of P losses from CD did not exclusively occur in months with highest outflow rates. In 3 out of 4 years, peak P loads occurred in late winter and P concentrations were positively correlated to soil temperature. In CWT, peak P loads coincided with highest outflow rates and no correlations were found between P concentrations and soil temperature. CWT plots, compared to CD, improved N efficiency for applied fertilizer due to lower N loads in drain outflow and higher N uptake by crop. The yields in CWT were 2–18% larger and the crop uptake of N increased by 3–14 kg/ha. The net changes of N (changes in mineral N content in soil, NO3-N loading in drain outflow, N fertilizer application, N uptake in crops) showed a surplus during autumn in all plots, with the highest surplus in CWT due to higher mineralization rates and lower N loads. During the winter season, a surplus in measured net changes of N was found in CD in all years. In contrast, the net changes of N in CWT showed a deficit, probably due to a lower mineralization rate and non-measured N sinks such as denitrification, immobilization and deep seepage loads.
Gentry et al. (2007) conducted a study to determine the dominant form of P in streams (dissolved or particulate) and identify the mode of transport of P from fields to streams in tile-drained agricultural watersheds in east-central Illinois. For all 16 water year-by-watershed combinations examined, annual flow-weighted mean TP concentrations exceeded 0.1 mg/L, and seven water year-by-watershed combinations exceeded 0.2 mg/L. Concentrations of DRP and particulate P (PP) increased with stream discharge; however, particulate P was the dominant form during overland runoff events, which greatly affected annual TP loads. Concentrations of DRP and PP in tiles increased with discharge, indicating tiles were a source of P to streams. Contrary to leaching patterns of nitrate or herbicides during a first flush following application, DRP continued to be present at elevated concentrations in successive tile flow events. These data suggested that there was an available pool of soil P that readily desorbed during preferential flow of solutes through the soil and into tiles. Across watersheds, the greatest DRP concentrations (as high as 1.25 mg/L) were associated with a precipitation event that followed widespread application of P fertilizer on frozen soils. Although eliminating this practice would reduce thepotential for overland runoff of P, soil erosion and tile drainage would continue to be important transport pathways of P to streams in east central Illinois.
Algoazany, A.S., P. K. Kalita, G.F. Czapar, and J.K. M l. 2007. Phosphorus transport through subsurface drainage and surface runoff from a flat watershed in East Central Illinois, USA. . 36:681–693.
Bhattarai, R., P.K. Kalita, and M.K. Patel. 2009. Nutrient transport through a Vegetative Filter Strip with subsurface drainage. 90:1868–1876.
Beauchemin, S., R.R. Simard, and D. Cluis. 1998. Forms and concentration of phosphorus in drainage water of twenty-seven tile-drained soils. 27:721-728.
REFERENCES
J. Environ. Qual
J. Environ. Manage.
J. Environ. Qual.
89
Beauchemin, S., R.R. Simard, M.A. Bolinder, M.C. Nolin, and D. Cluis. 2003. Prediction ofphosphorus concentration in tile-drainage water from the Montreal lowlands soils.
83:73–87.
Bilotta, G.S., R.E. Brazier, P.M. Haygarth, C.J.A. Mac ler, S. Granger, T. Krueger, J. Freer, and J. Quinton. 2008. Rethinking the contribution of drained and undrained grasslands to sediment-related water quality problems. 37:906–914.
Eastman, M. 2008. Field-scale nutrient transport monitoring and modeling of subsurface and naturally drained agricultural lands. M.S. Thesis, Department of Bioresource Engineering,McGill University, Montreal, Canada.
Eastman, M., A. Gollamudi, N. Stampfil, C.A. Madramootoo, and A. Sarangi. 2010. Comparative evaluation of phosphorus losses from subsurface and naturally drained agricultural fields in the Pike River watershed of Quebec, Canada. 97:596–604.
Evans, R., J. W. Gilliam, et al. 1996. "CONTROLLED DRAINAGE MANAGEMENT GUIDELINES FOR IMPROVING DRAINAGE WATER QUALITY." North Carolina Cooperative Extension Service :18.
Frankenberger, J., E. Kladivko, G. Sands, D. Jaynes, N. Fausey, M. Helmers, R. Cooke, J. Strock, K. Nelson, and L. Brown. 2006.
. Purdue Extension Knowledge to Go : 8.
Gardner, C.M.K., K.M. Cooper, and S. Hughes. 2002. Phosphorus in soil and field drainage water in the Thames catchment, UK. . 282:253–262.
Grant, R., A. Laubel, B. Kronvang, H.E. Andersen, L.M. Svendsen, and A. Fuglsang. 1996. Loss of dissolved and particulate phosphorus from arable catchments by subsurface drainage.
30(11):2633-2642.
Grazhdani, S., F. Jacquin, and S. Sulce. 1996. Effect of subsurface drainage on nutrient pollution of surface waters in south eastern Albania. . 191:15-21.
Heckrath, G., P.C. Brookes, P.R. Poulton, and K.W.T. Goulding. 1995. Phosphorus leaching from soils containing different phosphorus concentrations in the Broadbalk experiment.
. 24:904–910.
Kinley, R.D., R.J. Gordon, G.W. Stratton, G.T. Patterson, and J.Hoyle. 2007. Phosphorus losses through agricultural tile drainage in Nova Scotia, Canada. 36:469–477.
Kleinman, P.J.A., B.A. Needelman, A.N. Sharpley, and R.W. McDowell. 2003. Using soil phosphorus profile data to assess phosphorus leaching potential in manured soils.
67:215–224.
Can. J. Soil Sci.
J. Environ. Qual.
Ag. Water Manage.
Questions and Answers About Drainage Water Management for the Midwest
Sci. Total Environ
Water Res.
Sci. Total Environ
J. Environ. Qual
J. Environ. Qual.
Soil Sci. Soc. Am. J.
Publication Number: AG 443
WQ-44
90
Laubel, A., O.H. Jacobsen, B. Kronvang, R. Grant, and H.E. Andersen. 1999. Subsurface drainage loss of particles and phosphorus from field plot experiments and a tile-drained catchment. . 28: 576-584
Schilling, K.E. and M. Helmers. 2008. Tile drainage as karst: Conduit flow and diffuse flowin a tile-drained watershed. 349:291-301.
Sims, J.T., R.R. Simard, and B.C. Joern. 1998. Phosphorus loss in agricultural drainage: Historical perspective and current research. . 27:277–293.
Uusitalo, R., E. Turtola, T. Kauppila, and T. Lilja. 2001. Particulate phosphorus and sediment in surface runoff and drainflow from clayey soils. 30:589–595.
Valero, C.S., C.A. Madramootoo, and N. Stampfli. 2007. Water table management impacts on phosphorus loads in tile drainage. 89:71-80.
Wesstrom, I. and I. Messing. 2007. Effects of controlled drainage on N and P losses and Ndynamics in a loamy sand with spring crops. 87:229-240.
Winchell, M. 2011. Personal communication. Stone Environmental, Inc., Montpelier, VT.
J. Environ. Qual
J. Hydrol.
J. Environ. Qual
J. Environ. Qual.
Ag. Water Manage.
Ag. Water Manage.
91
In many agricultural areas, nutrient imports in feed and fertilizers exceed exports in crops produced; this imbalance often exists at both the individual farm and the watershed levels (Beegle, 2000). In such circumstances, nutrients may accumulate in soils from over-application of fertilizer or animal waste relative to crop need. Excessive soil nutrient levels have been linked to high P losses in runoff and leaching losses of N, especially in areas of animal-based agriculture. Nutrient management is an important tool to match nutrient inputs more closely to crop needs. The USDA-NRCS Nutrient Management practice standard (Practice Code 590) generally defines nutrient management as “Managing the amount, source, placement, form and timing of the application of nutrients and soil amendments.” The Nutrient Management practice may be applied for a number of purposes:
To budget and supply nutrients for plant production;To properly utilize manure and organic byproducts or biosolids as a plant nutrient source;To minimize agricultural non-point source pollution of surface and ground water resourcesTo protect air quality by reducing nitrogen emissions and the formation of atmospheric particulates; and To maintain or improve the physical, chemical, and biological condition of soil
This review presents references concerning several management practices to manage addition of nutrients to cropland to reduce nutrient losses:
– selection of the form of nutrients applied to cropland to reduce runoff or leaching losses;
– selection of the method and/or timing of manure or fertilizer application to cropland to support crop growth and reduce runoff or leaching losses;
– preparation and implementation of a comprehensive plan to manage nutrients from all sources to provide for crop growth while minimizing runoff and leaching losses of nutrients; and
– treatment of soils or manure to reduce the availability or mobility of nutrients.
Chien (2009) provide information on some recent developments of fertilizer production and use that improve nutrient efficiency and minimize envi The nutrients discussed are mainly N, P, and S. Improving efficiency of conventional P fertilizers includes use of (1) coated water-soluble P fertilizers, (2) urea supergranules containing P and K nutrients, and (3) fluid P fertilizers. Use of nonconventional P fert lizers includes (1) phosphate rock (PR) for direct application with a newly developed computer-based phosphate rock decision support system (PRDSS), (2) a mixture of PR and water-soluble P sources, (3) calcined nonapatite PR for direct application, and (4) nonconventional acidulated P fertilizers containing water-insoluble but citrate-soluble P compounds. The agronomic effectiveness of newly developed granular NP fertilizers containing elemental S to provide S nutrient is discussed. Two processes of producing
8.0 Nutrient Management
8.1 Introduction
Waste and fertilizer form
Application methods and timing
Nutrient management planning
Soil and manure amendment
8.2 Waste and Fertilizer Form
•
•
•
•
•
•
•
•
•
et al.
92
(1) partially acidulated P fertilizers and (2) compound fertilizers of NP and K by bulk blending are recommended for reducing Cd uptake from P fertilizers by crops. The use of these nonconventional fertilizers may result in an increased relative economic benefit with respect to the use of conventional fertilizers in terms of saving fertilizer cost, enhancing nutrient efficiency, or increasing crop yield.
Sojka, (2009) compared the efficacy of matrix based fertilizers (MBFs) formulated to reduce nitrate, ammonium, and total phosphorus (TP) leaching, ith Osmocoate® 14-14-14, a conventional commercial slow release fertilizer (SRF), and with an unamended control in greenhouse column studies (The MBF formulations covered a range of inorganic N and P in compounds that are relatively loosely bound (MBF1) to more moderately bound (MBF2) and more tightly bound compounds (MBF3) mixed with aluminum sulfate and/or iron sulfate and with high ionic exchange compounds starch, chitosan and lignin. When N and P are released, the chemicals containing these nutrients in the MBF temporarily bind N and P to an aluminum sulfate and/or iron sulfate starch- chitosan- lignin matrix. One milligram (8000 spores) of
was added to all formulations to attempt to enhance nutrient uptake. In this first series of experiments, soil columns were planted to white soft spring wheat (
L.cv. Frame). Three soils were used, a sand, a loam and a loamy sand. In several studies, SRF leachate contained higher amounts of nitrate, ammonium, and TP than leachate from all other fertilizers. Although plant biomass and yield with MBF was reduced in the first series of experiments, follow-up studies have shown that formulation adjustments allow comparable plant responses among SRF and MBFs. There were no consistent differences in the amount of nitrate, ammonium, and TP in the MBF leachates compared to the control leachate. Arbuscular mycorrhizal infection in plant roots did not consistently differ among plants growing in soil receiving SRF, MBFs and control treatments. The efficacy of MBF fertilizer strategy to reduce N and P leaching verified and with continued work to optimize formulations this technology is expected to provide a new approach for groundwater protection, especially in easily drained soils. The approach has been submitted for patenting.
Risse and Gilley (2000) assembled and summarized information quantifying the effects of manure application on runoff and soil loss resulting from natural precipitation events, and to develop regression equations relating reductions in runoff and soil loss to annual manure application rates For selected locations on which manure was added annually, runoff was reduced from 1 to 68%, and soil loss decreased from 13 to 77%. Measured runoff and soil loss values were found to be strongly influenced by manure application rates. Regression equations were developed relating reductions in runoff and soil plication rates for application rates ranging from 11 to 45 Mg/ha, and slope lengths varying from 22 to 39 m. The regression equations can be used to estimate the effects of manure application on runoff and soil loss.
Glomus intradicesTriticum
aestivum
93
Land application of liquid manure can result in nutrient enrichment of subsurface drainage effluent when conditions promote leaching or macropore flow (Geohring , 2001). Field and column studies were initiated in New York to investigate the impact of manure applications on Ptransport through the soil into subsurface drains. Fie luated tile effluent contamination from liquid manure under wet and dry antecedent soil moisture conditions (year 1) and under disk and plow tillage practices (year 2). In year 1, liquid dairy manure was broadcast on the surface and the field was then irrigated. Though the tile drains in the wet plots flowed much earlier and in greater volume than the drains in the dry plots, both wet and dry plots produced similar average peak total phosphorus (TP) concentrations. Irrigation 6 days later produced similar tile discharges, but the peak TP concentrations were about one-third of the earlier values. Cumulative TP loss was significantly higher from wet than dry plots. In year 2, manure was tilled into the soil via one-pass disking or plowing before irrigation commenced. The disking did not incorporate the manure into the soil as effectively as did plowing and exhibited one order of magnitude higher effluent TP concentrations and cumulative TP loss. The timing of P transport in tile effluent relative to the tile flow is consistent with macropore transport as the primary mechanism moving TP through the soil. Column studies utilizing packed soil and artificial macropores were used to examine further the role of macropore size on P sorption to pore walls. Dissolved P was added directly to the macropore, and the effluent from the macropore showed that soluble P may be transported through macropores 1 mm or greater with negligible P sorption to pore walls. In the absence of macropores, no measurable P was transported through the soil columns. Consequently, high P concentrations observed in the tile drain effluent soon after manure application during the field studies can be attributed to macropore transport processes. Even small continuous macropores are potential pathways. Plowing-in manure apparently disturbs these macropores and promotes matrix flow, resulting in greatly reduced P concentrations in the drainage effluent.
Whole Farm Planning was instituted and monitored over a 5-year period within the Graywood Gully sub-watershed of Conesus Lake, NY (Lewis and Makarewicz, 2009). An array Of agricultural Best Management Practices (BMPs) (strip cropping, fertilizer reduction, tiling, Manure disposal practices, etc.) were simultaneously introduced to determine the impact of a concentrated management effort on nutrient and soil loss from one water shed within the Conesus Lake catchment. During the study period, significant decreases in winter concentrations of dissolved and particulate fractions, including total phosphorus (TP), Soluble reactive phosphorus (SRP), total Kjeldahl nitrogen (TKN), and nitrate (NO3) but not total suspended solids (TSS), were observed. These decreases may or may not be attributed to cessation of manuring practices. Three years into the study, an opportunity existed to test the responsiveness of the watershed to the curtailment of a single BMP - winter manure application to fields. The authors field-tested the hypothesis that a change in winter manure applications would impact dissolved and particulate fractions in stream water draining this watershed. They found that the water quality of Graywood Gully is very responsive to winter manure application oil environmentally sensitive portions of the sub-watershed. With the short-term resumption of manure application, TP, SRP, TKN, and NO3 concentrations rose dramatically in stream water; elevated phosphorus concentrations persisted over a 5-week period. Total suspended solids, however, were not elevated after short-term manure application. Factors that affected these results were slope of the land, application of manure over snow and during a snowfall, warm air
8.3 Nutrient Application Methods and Timing
et al.
94
and soil temperatures, and possibly the drainage of snowmelt water. Managers of agricultural systems must recognize that phosphorus losses from the watershed during the nongrowing season may detrimentally affect nuisance population of algae in lakes during the summer.
Srinivasan et al. (2006) reviewed the results of scientific studies relevant to the issue of winter spreading of manure, and identify needs for additional research in this area. Collectively, these studies illustrate the complexity of N and P dynamics in response to a wide spectrum of winter conditions. They do shed some light on the potential for nutrient loss following manure application during winter with respect to cropping system effects on runoff, manure mulching effects, manure properties, and differences due to man ive to a snow pack and timing of application. However, process-level understanding of nutrient loss following manure application during winter is still lacking, and critical variables that control hydrologic and transport processes under winter conditions are not fully identified or understood. Extensive watershed-scale observations in combination with plot and field scale experiments that focus on specific processes should yield sufficient knowledge and data to develop empirical models, a useful first step in developing more detailed understanding of nutrient losses associated with manure spreading under winter conditions.
Chen and Samson (2002) conducted four field experiments over three years in four mixed farms under no-tillage and minimum tillage corn systems in southwestern Ontario, Canada. The effects of fertilizer source and manure application timing, rate, and method on soil nutrient concentrations, corn grain yields, and groundwater nitrate concentrations were investigated. Three experiments included three basic treatments of fertilizer source: inorganic (chemical) fertilizer, liquid manure, and a combination of inorganic fertilizer and liquid manure. The other experiment included five treatments: pre-plant manure with and without incorporation by an aeration implement, side-dress manure with and without incorporation by a disc implement, and side-dress inorganic fertilizer. Soil samples (0-300 or 0-600 mm depth) for analysis of soil nitrate-nitrogen (NO3-N), phosphorus (P), and potassium (K) concentrations were taken periodically each year, including soil residual NO3-N concentrations measured in the fall after harvest. Weed biomass and corn grain yields were also measured. In general, higher NO3-N concentrations were observed in those plots where nitrogen sources had been applied shortly before soil sampling. Trends of residual NO3-N concentrations varied among experiments, and results were inconclusive. Two-fold higher P concentrations were observed in the manured plots than in the inorganically fertilized plots as a result gher P2O5 inputs from swine manure. Farmers who apply liquid manure to their no-tillage cornfields should be prepared for the possibility of additional weed pressure, especially using pre-plant manure application or side-dressing manure without a starter fertilizer A 6% increased or comparative corn grain yield was achieved using liquid manure as a fertilizer source when weeds were not a problem. Considering the reduced risk of P runoff and the increased yield potential, the combined treatments, including pre-plant manure with side-dress inorganic fertilizer and starter fertilizer with side-dress manure, are recommended.
Ali et al. (2007) tested the equipment and cost for the simplified surface irrigation of dairy farm effluents (DE) and to establish best management practices to reduce risks of groundwater contamination. The project was conducted on two dairy farms in South Western of Montreal, Canada, where typical DE were applied to irrigated plots of 0.5 and 0.3 ha, respectively, and the
95
groundwater quality was compared to a control plot of the same size. Groundwater quality was monitored for nutrients (total nitrogen, total phosphorus, total potassium and pH) and bacterial counts (total coliforms, fecal coliforms, and fecal streptococci). A manure pump and conventional water irrigation pipes were satisfactory irrigating with the DE without clogging as long as the DE was collected in a tank separate from that of the solid, manure. During all applications, subsurface seepage losses occurred, but these would not be lost to the watercourse when applied in quantities respecting irrigation guidelines and on soils where the groundwater table was at or below the depth of the subsurface drains. Nevertheless, these seepage losses represented less than 1% of the total volume of DE applied, and the seepage nutrient and bacterial load was generally less than half of that of the irrigated DE. The surface irrigation system reduced the cost of land spreading DE from CAN $3.25/m3 (conventional tanker) to CAN $1.10/m3 (surface irrigation). The heavy total potassium load of the DE requires the rotation of the irrigation plot, on an annual basis.
Daverede et al. (2004) evaluated the effects of soil test P level, source, and application method of P amendments on P in runoff following soybeans in Illinois. The treatments consisted of two rates of swine liquid manure surface-applied and injected, 54 kg P/ha triple superphosphate (TSP) surface-applied and incorporated, and a control with and without chisel-plowing. Rainfall simulations were conducted one month (1MO) and six months (6MO) after P amendment application for 2 yr. Soil injection of swine manure compared with surface application resulted in runoff P concentration decreases of 93, 82, and 94%, and P load decreases of 99,94, and 99% for dissolved reactive phosphorus (DRP), total phosphorus (TP), and algal-available phosphorus (AAP), respectively. Incorporation of TSP also reduced P concentration in runoff significantly. Runoff P concentration and load from incorporated amen nts did not differ from the control. Factors most strongly related to P in runoff from the incorporated treatments included Bray PI soil extraction value for DRP concentration, and Bray-I and sediment content in runoff for AAP and TP concentration and load. Injecting manure and chisel-plowing inorganic fertilizer reduced runoff P losses, decreased runoff volumes, and increased the time to runoff, thus minimizing the potential risk of surface water contamination. After incorporating the P amendments, controlling erosion is the main target to minimize TP losses from agricultural soils.
Allen and Mallarino (2008) assessed total runoff P (TPR), bioavailable P (BAP), and dissolved reactive P (DRP) concentrations and loads in surface runoff after liquid swine manure application with or without incorporation into soil and different timing of rainfall). Four replicated manure P treatments were applied in 2002 and in 2003 to two Iowa soils testing low in P managed with corn -soybean rotations. Total P applied each time was 0 to kg P/ha at one site and 0 to 108 kg P/ha at the other. Simulated rainfall was applied within 24 h of P applications or after 10 to 16 d and 5 to 6 mo. Nonincorporated manure P increased DRP, BAP, and TPR concentrations and loads linearly or exponentially for 24-h and 10- to 16-d runoff events. On average for the 24-h events, DRP, BAP, and TPR concentrations were 5.4, 4.7, and 2.2 times higher, respectively, for nonincorporated ma n for incorporated manure; P loads were 3.8, 7.7, and 3.6 times higher; and DRP and BAP concentrations were 54% of TPR for nonincorporated manure and 22 to 25% for incorporated manure. A 10- to 16-d rainfall delay resulted in DRP, BAP, and TPR concentrations that were 3.1, 2.7, and 1.1 times lower, respectively, than for 24-h events across all nonincorporated P rates, sites, and years, whereas runoff P loads were 3.8, 3.6, and 1.6 times lower, respectively. A 5- to 6-mo simulated rainfall
96
delay reduced runoff P to levels similar to control plots. Incorporating swine manure when the probability of immediate rainfall is high reduces the risk of P loss in surface runoff; however, this benefit sharply, decreases with time.
Andraski et al (2003) reported that manure additions to cropland can reduce total P losses in runoff on well-drained soils due to increased infiltration and reduced soil erosion. Surface residue management in subsequent years may influence the long-term risk of P losses as the manure-supplied organic matter decomposes. The effects of manure history and long-term (8-yr) tillage [chisel plow (CP) and no-till (NT)] on P levels in runoff in continuous corn ( .) were investigated on well-drained silt loam soils of southern and southwestern Wisconsin. Soil P levels (0-15 cm) increased with the frequency of manure applicat ication was greater near the surface (0-5 cm) in NT than CP. In CP, soil test P level was linearly related to dissolved P (24-105 g/ha) and bioavailable P (64-272 g/ha) loads in runoff, but not total P (653-1893 g/ha). In NT, P loads were reduced by an average of 57% for dissolved P, 70% for bioavailable P, and 91% for total P compared with CP. This reduction was due to lower sediment concentrations and/or lower runoff volumes in NT. There was no relationship between soil test P levels and runoff P concentrations or loads in NT. Long-term manure P applications in excess of P removal by corn in CP systems ultimately increased the potential for greater dissolved and bioavailable P losses in runoff by increasing soil P levels. Maintaining high surface residue cover such as those found in long-term NT corn production systems can mitigate this risk in addition to reducing sediment and particulate P losses.
Kleinman et al. (2009) evaluated losses of P in sub-surface and surface flow as a function of dairy manure application to no-till soils in north-central Pennsylvania. Monitoring of a perennial spring over 36 months revealed that dissolved reactive P (DRP) concentrations increased 3- to 28-fold above background levels whenever manure was broadcast to nearby field soils. A study conducted with 30-cm deep intact soil cores indicated that incorporation of manure by tillage lowered P loss in leachate relative to broadcast application, presumably due to the destruction of preferential flow pathways. More P was leached from a sandy loam than a clay loam soil, although differences between soils were not as great as differences between application methods. In contrast, rainfall simulations on 2-m2 field runoff plots showed that total P (TP) losses in surface runoff differed significantly by soil but not by application method. Forms of P in surface runoff did change with application method, with DRP accounting for 87 and 24% of TP from broadcast and tilled treatments, respectively. Losses of TP in leachate from manured columns over 7 weeks (0.22-0.38 kg P/ha) were considerably lower than losses in surface runoff from manured plots subjected to a single simulated rainfall event (0.31-2.07 kg TP/ha). Results confirm the near-term benefits of incorporating manure by tillage to protect groundwater quality, but suggest that for surface water quality, avoiding soils prone to runoff is more important.
To address the effects of long-term agricultural P management on soil P accumulation (574,000 km2), MacDonald and Bennett (2009) calculated cropland P budgets in the Saint Lawrence River sub-basin at decadal intervals from 1901 to 2001 for the sub-basin and its tributary watersheds (Agricultural census data were used to estimate P inputs in the form of fertilizer and manure, and outputs (P removed in harvested crops). The resulting balances indicate the potential magnitude
.
Zea mays L
8.4 Nutrient Management Planning
97
of P accumulation in cropland soils. Cropland P surpluses occurred in the sub-basin in each decade of the past century, with the rate of accumulat ing after 1951 due to more widespread use of P fertilizers and manure. The largest annual P surplus occurred in 1981 (42,000 Mg/y), followed by a decline in the rate of accumulation to almost half that level by 2001 (24,850 Mg/y) as a result of improved management of agricultural P. Comparison of the cumulative P surpluses estimated for the entire 20th century with measured soil P data indicates a strong linear relationship between these watershed P budgets and the average soil P content across the sub-basin (R2 = 0.712, P < 0.0001). These results support the view that historical land management can have important ecological legacies.
In Virginia, Maguire et al (2008) investigated how changing nutrient management from an N to a P basis affected crop yields and soil properties in high P soils over a 7-yr period. Three sites were established on farmers' fields, and at each site the same six treatments were applied for 6 or 7 yr. These treatments were (i) no P; (ii) poultry litter applied on an N basis; (iii) inorganic P, equal to the P applied in treatment 2; (iv) poultry litter applied on an estimated annual crop P removal basis; (v) inorganic F, equal to the P applied in treatment iv; and (vi) poultry litter applied once every 2 or 3 yr at a 2- or 3-yr crop removal P race. All treatments received the same rate of plant-available N. Yields, P balance, soil pH, Mehlich 1 P, and water-soluble P (WSP) were monitored during the experiment. Over the course of the experiment, litter had the beneficial effect of raising soil pH relative to the inorganic treatments. After 7 yr, Mehlich 1 P and WSP were greatest in soils under the N-based treatments, smallest in the no P treatment, and intermediate in the P-based treatments. For example, at the Shenandoah site, Mehlich 1 P decreased by 35 mg/kg under the no P treatment and increased by 36 mg/kg under the inorganic N-based treatment. There were no significant differences between inorganic fertilizer and poultry litter nutrient sources. The results of this study show that soil test P can be decreased in high-P soils over a few years by changing from an N-based to a P-based nutrient management plan or stopping P applications without negatively affecting yields
Giroux and Royer (2007) measured the effect of three P fertilizer rates (0, 20, and 60 kg P2O5/ha) applied annually on yields of cash crops (corn, soybeans or wheat) and evolution of the soil test values, saturation and P solubility in two very rich soils during eight years in Quebec, Canada. Yields were not significantly affected by P fertilizer. The initial soil test P value in 1996 was 394 kg P/ha for the Du Contour loamy sand. Eight years after, it were 270, 281, and 294 kg P/ha respectively for the 0, 30, and 60 kg P2O5/ha rates. The initial soil test P value in1997 was 354 kg P/ha for the Sainte-Rosalie loam. Eight years after, it were 236, 253, and 315 kg P/ha respectively for the 0, 30, and 60 kg P2O5/ha rates. The annual P exportations during this experiment were 46 and 44 kg P2O5/ha respectively for the Du Contour and the Sainte-Rosalie soils. The phosphate reversion process is active in these soils. Even the 60 kg P2O5/ha rate, higher than P exportation, decreased Mehlich-3 P, water extractable P and P saturation in both soils The annual rates of P saturation decrease in the Du Contour soil wee 1.087, 0.8 and 0.750%/yr respectively for the 0, 30, and 60 kg P2O5/ha rates. The P saturation value of 13.1% of the Quebec regulation is achieved after 10 years for the 0 kg P2O5/ha rate, 12 years for the 30 kg P2O5/ha rate and 14 years for the 60 kg P2O5/ha rate. The annual rates of P saturation decrease in the Sainte-Rosalie soil were 1.034, 0.883, and 0.642%/yr respectively for the 0, 30, and 60 kg P2O5/ha rates. The P saturation value of 13 is achieved after 8 years for the 0 kg P2O5/ha rate, 10 years for the 30 kg P2O5/ha rate and 14 years for the 60 kg P2O5/ha rate. The
.
.
98
critical P saturation values, corresponding to 9.7 mgP/L of water extractable P, determined from P solubility curve of each soil, were 15.0% for the Du Contour loamy sand and 10.0% for the Sainte-Rosalie loam.
Also in Quebec, Zhang et al (2004) assessed changes in soil test P and soil P fractions with continuous P fertilization and soil P depletion under continuous corn (Zea mays L.) in a Ste. Rosalie clay soil (humic Gleysol; fine, mixed, frigid, Typic Humaquept) Soil samples were analyzed for Mehlich-3 P (M-3 P) and P fractions using a modified Hedley’s procedure. Soil M-3 P values remained constant in spite of crop removal l not receiving fertilizer for 10 yr. Continuous P fertilization at rates from 44 to 132 P/ha/yr increased linearly soil M-3 P, with 6.3 kg P/ha of net P addition required to increase M- 3 P by 1 mg P/kg. Residual fertilizer P in soil resulted from the continuous P addition were found predominately in labile inorganic P (LPi) (NaHCO3–Pi) and moderately labile Pi (MLPi) (NaOH-Pi). Increased P rates favored soil P transformation from LPi to MLPi, indicating enhanced s P retention. With P depletion, soil M-3 P declined in plots previously receiving 132 kg P/ha/yr, with 4.2 kg P/ha crop P removal decreasing soil M-3 P by 1 mg P/kg. Continuous crop removal of soil residual P (Res-P) resulted in decreases in soil LPi and increases in MLPi, an indication of increased retention of Res-P with time. However, moderately stable Pi (HCl-Pi) remained constant, both with continuous Paddition and P depletion. Conversion of residual ferti izer P to less available P forms in soil was a slow process and thus the fate of the Res-P should be taken into consideration when developing soil nutrient management plans.
Geleta et al. (2004) conducted a 3-year study in Maryland at three sites to examine whether reduction in P fertilization rate and/or use of a preceding rye cover crop affect the yield and quality (sugar concentration and ear weight) of sweet corn grown on soils with "excessive" plant-available P The experimental design was a split plot w lications conducted on Norfolk soils. The main plots were no cover crop and a rye cover crop. The subplots were five P fertilizer treatments ranging from 0 to 60 kg P/ha at 15 kg P increments. With or without a preceding rye cover crop or P fertilization, post-harvest soil test P (Mehlich-1) levels remained "excessive" to a depth of 40 cm. Also, yield of sweet corn was not affected by P fertilization and/or use of a preceding rye cover crop. Without cover cropping, sugar content and ear weight response to P fertilization was positive on site 2 for sugar, and on sites 2 and 3 for ear weight. Utilization of cover cropping positively influenced sweet corn sugar and ear weight sampled at early milk stage without affecting the final yield. In processing sweet ity is determined mainly by the yield of marketable ears. Therefore, the small, inconsistent increases in sugar content and ear weight in response to P fertilization, without an increase in yield is not of a major significance to the farmer. On high P soils, P fertili ion is unnecessary for the production of quality, high-yield processing corn. The use of a rye cover crop is suggested as a method of reducing the risk of P loss into the surrounding watershed.
Giasson et al (2003) assessed the cost effectiveness and the risk of P loss associated with various combinations of manure management options for a typical midsized dairy farm in New York State The farm has 587 adult dairy cows and 430 young animals (1202 animal units). Fifty-three fields (26 cornfields and 27 pastures) ranging in size from 1 to 15 ha are available to receive livestock manure. Morgan's Soil Test P values range from 1.1 to 87.3 kg/ha (mean of 20.1 kg/ha). Options included optimal allocation of manure in time and space, surface application,
.
.
99
incorporation, and manure storage facilities of three-, six-, and eight-month storage capacities. The decision process considered nutrient management costs (manure handling and fertilization) and the New York State P Site Index (P Index) as an indicator of one of the environmental impacts of manure management. Mathematical programming techniques and utility functions are used to select the best combination of manure management practices. The results show a convergence indicating that the best management decision would be to follow a manure allocation scheme optimized in time and space, to have three months of manure storage capacity, and to surface-apply manure. Compared with current practices, the recommended combination of practices results in an approximate 45% reduction in the mean area-weighted P Index (64.2 vs. 36.1) for a cost increase of less than 2% ($146 573 vs. $148 821).
Sharma and Sahi (2005) investigated the phytoremediation potential of Gulf and Marshall ryegrass grown in a Mississippi greenhouse under varying conditions of soil P concentration, pH, and temperature Both genotypes demonstrated P accumulations >1% shoot dry weight depending on soil P concentrations (0-10 g of P/kg of soil), with higher shoot P in Gulf than Marshall ryegrass. An increase in plant biomass was proportional to the increasing concentrations of P up to a level of 10 g of P/kg of soil. The effect of soil pH on plant uptake of P was noticeable with a significant rise in shoot P in acidic soil (pH 5.6) as compared to soil with pH 7.8. Significant differences were observed in the biomass productivity and shoot P accumulation at varying temperatures in both grass types. The patterns of acid phosphomonoesterase and phytase activities in plant roots were interesting, activities being 2-fold higher in alkaline soil than acidic soil in both genotypes. The effect of P supply on the enzyme activity was also distinct, as plants growing in a high P concentration showed higher activity (nearly 30%) than those growing under P deficiency conditions (with no addition of P). These results indicate that Gulf and Marshall ryegrass can accumulate high P under optimal conditions and thus reduce soil P concentrations in successive cropping.
Forage and grain-cropping systems were compared for their effectiveness at remediating P-enriched soils in Maryland (Kratochvil , 2006). At each of four locations, one of three forage systems (Forage I = cereal rye silage and corn silage annually; Forage II = alfalfa; Forage III = annual ryegrass and corn silage annually) and the grain system (corn, small grain, and soybean rotation) were maintained for 3 yr on soils with five distinct initial soil P concentrations that were established by using four annual applications (1994-1997) of five different rates (0, 100, 200, 300, and 400 kg total P/ha/y) of poultry manure, dairy manure, or commercial fertilizer. Across all manure P treatments at all locations, the forage systems had greater removal of P than the grain system. Soil P concentration changes (2001-2004) did not reflect differences in crop P removal. Few significant reductions in soil P concentration were observed for either crop system. When reductions did occur, they were for the more highly enriched soil P treatments. No significant reductions in soil P concentration have occurred for the lowest manure P treatments. Considerable variability in crop P concentrations was observed among species at locations and among years produced. However, crop P concentrations did increase uniformly as soil P concentration increased, indicating that luxury consumption of P does occur in agronomic species produced on P-enriched soils.
et al.
100
Manure when applied at nitrogen (N) agronomic rates generally increases soil P concentrations, which can increase runoff of soluble P (McFarland and Hauck, 2004). Along the North Bosque River in central Texas, dairy waste application fields are identified as the most controllable nonpoint source of soluble P in a total maximum daily To evaluate P reduction practices for fields high in soil extractable P, edge-of-field runoff was measured from paired plots of Coastal bermudagrass (Cynodon dactylon) and sorghum (Sorghum bicolor)l winter wheat (Triticum spp.). Plots (about 0.4 ha) received manure at P agronomic rates following Texas permit guidelines and commercial N during the pretreatment period. During the post-treatment period, control plots continued to receive manure at P agronomic rates and com l N. Treatment plots received only commercial N during the post-treatment period. Use of only commercial N on soils with high extractable P levels significantly decreased P loadings in edge-of-field runoff by at least 40 percent, but runoff concentrations sometimes increased. No notable changes in extractable soil P concentrations were observed after five years of monitoring due to drought conditions limiting forage uptake and removal.
Oquist et al. (2007) examined the effects of both alternative and conventional farming practices on subsurface drainage and nitrogen and phosphorus loss through subsurface drainage from glacial till soils in southwest Minnesota. Alternative farming practices included organic management practices, species biodiversity, and/or practices that include reduced inputs of synthetic fertilizer and pesticides. Conventional farming practices include corn-soybean rotations and their associated recommended fertilizer rates as well as pesticide usage. Precipitation was highly variable during the 3-yr study period including a below-average year (2003), an average year (2002), and an above-average year (2004). Results indicate that alternative farming practices reduced subsurface drainage discharge by 41% compared with conventional practices. Flow-weighted mean nitrate-nitrogen (nitrate N) concentrations during tile flow were 8.2 and 17.2 mg/L under alternative and conventional farming practices, respectively. Alternative farming practices reduced nitrate N losses by between 59 and 62% in 2002 and 2004 compared with conventional practices. Ammonium-nitrogen (ammonium N), orthophosphorus, and total phosphorus losses in subsurface drainage were very low and did not pose a substantial risk of pollution. Results suggest that alternative farming practices have the potential to reduce agricultural impacts on water quality.
An integrated economic and environmental modeling system was developed for evaluating agro-environmental policies and practices implemented on large scales (Osei , 2008). The modeling system, the Comprehensive Economic and Environmental Optimization Tool-Macro Modeling System (CEEOT-MMS), integrates the Farm-level Economic Model (FEM) and the Agricultural Policy Environmental eXtender (APEX) model, as well as national databases and clustering and aggregation algorithms. Using micro simulations of statistically derived representative farms and subsequent aggregation of farm-level results, a wide range of agricultural best management practices can be investigated within CEEOT-MMS. In the present study, CEEOT-MMS was used to evaluate the economic and water quality impacts of nitrogen (N) and phosphorus (P) based manure application rates when implemented on all animal feeding operations in the State of Texas. Results of the study indicate that edge-of-field total P losses can be reduced by about 0.8 kg/ha/year or 14% when manure applications are calibrated to supply all of the recommended crop P requirements from manure total P sources only, when compared to manure applications at the recommended crop N agronomic rate. Corresponding economic
et al.
101
impacts are projected to average a US$4,800 annual cost increase per farm. Results are also presented by ecological subregion, farm type, and farm size categories.
In a Vermont study, Meals et al. (2009) demonstrated that treating livestock manure with drinking water treatment residuals (WTRs) can reduce soluble P and decrease the risk of P losses from land-applied manure. At the same time, such beneficial use could provide the water treatment industry with an economical alternative for management of its by-products. A 10-day experiment was conducted to assess the effect of addition of 1 to 50% weight per weight alum-based WTRs on the P content of liquid dairy manure. Reductions in manure soluble P concentrations of 6 to 79% were achieved at doses ranging from 1 to 50%. Total P levels in manure were reduced by 9 to 25% at WTR doses of 10 to 50%. Most P reduction appeared to be achieved after 72 h following WTR addition. A WTR dose of 5 to 10% could potentially achieve a 20 to 30% reduction in soluble P content of liquid dairy manure; greater reductions in soluble P appear to be achievable with higher WTR doses.
Previous research has shown that soil test P levels are directly correlated to runoff P levels and that aluminum (Al) will bind P in the soil (Haustein , 2000). Both water treatment residuals (WTR) and HiClay Alumina (HCA) are readily available waste materials high in Al. Water treatment residuals and HCA are by-products of the potable water treatment and commercial alum production process, respectively. Our objective, was to determine if runoff P from fields excessively high in soil test P could he decreased by land applying these materials. Water treatment residuals and HCA were surface applied at rates of 0, 2.2, 9.0, and 18 Mg/ha to plots high in P. We used rainfall simulation to produce runoff 1 d, I mo, and 4 mo following application. The P adsorption capacity for the WTR was 20 times higher than HCA because it was predominantly; clay (95%) and contained three times as much Al. High rates of WTR increased the total recoverable Al concentrations in the soil, whereas HCA had no effect. High rates of both materials decreased Mehlich III soil test P levels due to the increased levels of soil Al. The two highest rates of WTR decreased runoff P le ls significantly below those of the control plots for all dates, whereas the two highest rates of HCA decreased P levels for only the first two dates. Relative to the control, runoff concentrations of either total or dissolved Al were not significantly increased by WTR.
A field experiment was conducted near Kurten, TX, on a Zulch fine sandy loam (thermic Udertic Paleustalfs) with Bray-1 P values exceeding 3000 mg P/kg soil (dry wt.) in the A(p) horizon to evaluate the effectiveness of soil amendments for reducing soil test P values (Brauer , 2005). Soils were amended annually from 1999 to 2001 with 1.5 and 5.0 Mg gypsum/ha, 1.4 Mg alum/ha, or 24.4 Mg/ha of waste paper product high in Al alone or in combination with 1.5 Mg gypsum/ha and/or 1.4 Mg alum/ha. These treatments supplied a maximum of 225 and 1163 kg/ha/yr of Al and Ca, respectively. Soil Bray-1 P and dissolved reactive P levels were monitored from 1999 to 2004. None of the soil amendment treatments affected Bray-1 P values. Only annual additions of 5.0 Mg gypsum/ha from 1999 to 2001 significantly reduced soil dissolved reactive P. Dissolved reactive P levels reached minimal levels after two applications of 5.0 Mg gypsum/ha but increased in 2003 and 2004. These results indicate that soil dissolved
8.5 Soil and Manure Amendment
et al.
et al.
102
reactive P levels can be reduced if sufficient amounts of gypsum were added to supply Ca in amounts similar to the soil test P values.
Alum-treated poultry litter has different chemical composition and biological properties from conventional poultry litter (Guo and Song, 2009). To develop agronomic application rates for this particular organic fertilizer to cropland, the nutrient value (nutrient plant availability) of alum-treated poultry litter needs to be determined. Typical alum-treated poultry litter was collected from a broiler farm and examined for nutrient content, nutrient release kinetics, and nutrient value by leaching the material for 190 d under simulated weathering conditions. Nutrients recovered in the leachate were characterized and treated as the potentially plant-available portion. The artificial leaching revealed that alum-treated poultry litter released 21.4 g of dissolved organic C, 13.8 g of total dissolved N, 0.6 g of total dissolved P, and 34.6 g of K per kilogram into leachate during the 190-d weathering. The predominant nutrient release occurred in the first 5 wk and fit first-order exponential rise-to-maximum models (for dissolved organic C, total dissolved P, total dissolved N, NH4-N, K+, Na+, Cl-, and SO4
2-) and logarithmic equations (for Ca2+ and Mg2+). The nutrient value of alum-treated poultry litter is estimated at N, 13.8 g/kg; P, 0.75 g/kg; K, 34.6 g/kg; and S, 24.2 g/kg. The concentration of Al in litter leachate remained below 0.2 mM and thus no Al toxicity should be concerned. Based on these results, it is recommended to apply alum-treated poultry litter at 7.3 t/ha for achieving an N supply of 100 kg/ha to common field crops while preventing excessive P runoff losses from high test P soils.
Laboratory and greenhouse studies compared the ability of water treatment residuals (WTRs) to alter P solubility and leaching in Immokalee sandy soil amended with biosolids and triple superphosphate (TSP) (Elliott , 2002). Aluminum sulfate (Al-WTR) and ferric sulfate (Fe-WTR) coagulation residuals, a lime softening residual (Ca-WTR) produced during hardness removal, and pure hematite were examined. In equilibration studies, the ability to reduce soluble P followed the order: Al-WTR > Ca-WTR approximate to Fe-WTR much greater than hematite. Differences in the P-fixing capacity of the sesquioxide-dominated materials (Al-WTR, Fe-WTR, hematite) were attributed to their varying reactive Fe- and Al-hydrous oxide contents as measured by oxalate extraction. Leachate P was monitored from greenhouse columns where bahiagrass (Paspalum notatum Flugge) was grown on Immokalee soil amended with biosolids or TSP at an equivalent rate of 224 kg P/ha and WTRs at 2.5% (56 Mg/ha). In the absence of WTRs, 21% of TSP and 11% of Largo cake biosolids total phosphorus (PT) leached over 4 mo. With co-applied WTRs, losses from TSP columns were reduced to 3.5% (Fe-WTR), 2.5% (Ca-WTR), and <1% (Al-WTR) of applied P. For the Largo biosolids treatments all WTRs retarded downward P flux such that leachate P was not statistic ly different than for control (soil only) columns. The phosphorus saturation index (PSI = [P-ox]/[Al-ox + Fe-ox], where P-ox, Al-ox, and Fe., are oxalate-extractable P, At, and Fe-ox, respectively) based on a simple oxalate extraction of the WTR and biosolids is potentially useful for determining WTR application rates for controlled reduction of P in drainage when biosolids are applied to low P-sorbing soils.
Augmenting a soil's P sorption capacity using alum-based water treatment residuals (WTRs) may be a new chemical-based method for increasing the soil's capacity to retain P (Novak and Watts, 2004). Laboratory experiments were conducted to determine if WTRs mixed into Autryville (Loamy, siliceous, subactive, thermic Arenic Paleudults) and Norfolk (Fine-loamy, kaolinitic, thermic Typic Kandiudults) soils could significantly increase their P sorption capacities. Water
et al.
103
treatment residuals were obtained on two different occasions from a North Carolina municipal surface water treatment facility. Both WTRs (G1 and G2) were composed of fine-sized river sediments that were flocculated with liquid alum [Al-2(SO4)3]. Phosphorus sorption isotherms were determined on the WTRs, the soils, and soil + WTR mixtures of 2.5, 5.0, 7.5, and 10.0% (w/w). The P sorption maximums (Pmax) were determined from the linear form of the Langmuir equation. The P-max values for G1 and G2 (175 and 85 mg P/g, respectively) were significantly higher than the P a values for the Autryville or Norfo soils (<1.0 mg P/g). Mixing WTRs into soils increased their P-max values several-fold (between 1.7 to 8.5 mg P/g) relative to soils with no WTR addition. This experiment demonstrates the feasibility of using alum-based WTRs to increase a sandy soil's ability to sorb more P. Our results suggest that WTR incorporation into sandy soils has the potential to be a new chemical-based best management practice (BMP) for reducing off-site P transport.
Reductions in water dissolved P concentrations through very strong P sorption reactions may be obtainable after land application of alum-based drinking water treatment residuals (WTRs) (Novak and Watts, 2005). Our objectives were to (i) evaluate the ability of an alum-based WTR to reduce Mehlich-3 P (M3P) and water-soluble phosphorus (WSP) concentrations in three P-enriched Coastal Plain soils, (ii) estimate WTR application rates necessary to lower soil M3P levels to a target 150 mg/kg soil M3P concentration threshold level, and (iii) determine the effects on soil pH and electrical conductivity (EC). Three soils containing elevated M3P (145-371 mg/kg) and WSP (12.323.5 mg/kg) concentrations were laboratory incubated with between 0 and 6% WTR (w/w) for 84 d. Incorporation of WTR into the three soils caused a near linear and significant reduction in soil M3P and WSP concentrations. In two soils, 6% WTR application caused a soil M3P concentration decrease to below the soil P threshold level. An additional incubation on the third soil using higher WTR to soil treatments (10-15%) was required to reduce the mean soil M3P concentration to 178 mg/kg. After incubation, most treatments had less than a half pH unit decline and a slight increase in soil EC v lues suggesting a minimal impact on soil quality properties. The results showed that WTR incorporation into soils with high P concentrations caused larger relative reductions in extractable WSP than M3P concentrations. The larger relative reductions in the extractable WSP fraction suggest that WTR can be more effective at reducing potential runoff P losses than usage as an amendment to lower M3P concentrations.
Drinking water treatment residuals can be beneficially used to reduce P in runoff water from manured agricultural land (Dayton , 2003). The objective of this study was to determine treatment residual components responsible for P sorption and reduction of P in runoff water. Using 21 aluminum- (Al-) based treatment residuals from Oklahoma utilities, chemical components related to P sorption (amorphous Al [Al-ox, 1.33-48.7 g/kg], iron [Fe] [Fe-ox, 0.23-7.44 g/kg] oxides), clay (0-100%), and water-soluble calcium (0.05-0.74 g/kg) were measured.Linearized Langmuir P sorption maxima (P-max) ranged from 0.30 to 5.14 g/kg, and nonlinear Freundlich P distribution coefficient (K-p) ranged from 17.5 to 1,085 L/kg. Addition of water treatment residuals (50 Mg/ha) to box plots treated with poultry litter (16.7 Mg/ha) reduced runoff P by from 14.0 to 84.9%. Reductions in runoff P were strongly correlated (p < 0.05) with P-max and Al-ox. Performance of treatment residuals as a P sorbent to reduce runoff P from manured land can be estimated from their P-max or Al-ox content.
et al.
104
Hyde and Morris (2000) measured the effect of dewatered water treatment residual (WTR) on extractable P and AI in CT soils with above-optimum P concentrations. A secondary objective Has to document the variability of the metal content of WTR during 1 Sr. Two soils, a Paxton fine sandy loam (coarse-loamy, mixed, active, mesic Oxyaquic Dystrudept) and a ld silt loam (coarsesilty over sandy or sandy-skeletal, mired, active, mesic Typic Dystrudept) with above-optimum Mehlich 3 P concentrations (833 mg/kg and 630 mg /g, respectively) were amended with four dewatered WTRs. The WTRs were dewate atments: (i) WTR dewatered at 40 degreesC in a forced-air oven (DRY), (ii) WTR dewatered by freezing at -4 oC and then dried at 40 oC in a forced-air oven (FROZEN)I and (iii) WTR dewatered to 4.5% solids at 40 oC in a forced-air oven (RAW). The WTRs were added to the soils at rates of 20 or 60 g/kg and incubated far 21 d. The WTRs in the RAW treatment significantly reduced Mehlich 3 P concentrations compared with the DRY and FROZEN treatments. The RAW treatment reduced soil P concentrations an average of 64% compared with a reduction of 28% for the DRY treatment and 23% for the FROZEN treatment. The results suggest that the method used to dewater WTR will alter its ability to decrease Mehlich 3 P soil concentrations. The secondary objective involved collection of two of the WTRs every 3 wk for 1 Sr and subsequent analysis for metal concentrations. The metal concentrations changed little during the year and only Cu, due to its use as an algicide, was elevated.
Adler and Sibrell (2003) tested flocs resulting from neutralizing acid mine dra (AMD) as a possible low cost amendment to reduce the loss of soluble P from agricultural fields and animal wastewater. Flocs were prepared by neutralizing natural and synthetic solutions of AMD with limestone, lime, ammonium hydroxide, and sodium hydroxide. Phosphorus sequestration was tested in three distinct environments: water, soil, and manure storage basins. In water, flocs prepared from AMD adsorbed 10 to 20 g P/kg dry floc in equilibrium with 1 mg/L soluble P. Similar results were observed for both Fe-based and Al-based synthetic flocs. A local soil sample adsorbed about 0.1 g P/kg, about two orders of magnitude less. The AMD-derived flocs were mixed with a high-P soil at 5 to 80 g floc/kg soil, followed by water and acid (Mehlich-1) extractions. All flocs performed similarly. About 70% of the water-extractable P was sequestered by the floc when applied at a rate of 20 g floc/kg soi whereas plant-available P only decreased by about 30%. Under anaerobic conditions simulating manure storage basins, all AMD flocs reduced soluble P by greater than 95% at a rate of 0.2 g floc/g rainbow trout (Oncorhynchus mykiss) manure. These findings indicate that AMD flocs could he an effective agent for preventing soluble P losses from soil and manure to the water environment, while at the same time decreasing the costs associated with AMD treatment.
Agyin-Birikorang et al. (2007) studied the longevity of alum-based WTR (Al-WTR) effects on P solubility over time (7.5 yr) at two Michigan field sites. At both sites, amendment with Al-WTR reduced water-soluble P (WSP) concentration by > 60% as compared to the control plots, and the Al-WTR-immobilized P (WTR-P) remained stable 7.5 yr after Al-WTR application. Rainfall simulation techniques were utilized to investigate P losses in runoff and leachate from surface soils of the field sites at 7.5 yr after Al-WTR application. At both sites, amendment with Al-WTR reduced dissolved P and bioavailable P (BAP) by >50% as compared to the control plots, showing that WTR-immobilized P remained nonlabile even 7.5 yr after Al-WTR amendment. Thus, WTR-immobilized P would not be expected to dissolve into runoff and leachate to contaminate surface waters or groundwater. Even if WTR-P is lost via erosion to surface waters,
105
the bioavailability of the immobilized P should be minimal and should have negligible effects on water quality. However, if the WTR particles are destroyed by extreme conditions, P loss to water could pose a eutrophication risk.
Phosphorus-immobilizing amendments can be useful in minimizing P ching from high P soils that may he irrigated with wastewater (Zvomuya , 2006). This study tested the P-binding ability of various amendment materials in a laboratory incubation experiment and then tested the best amendment in a field setup using drainage lysimeters. The laboratory experiment involved incubating 100-g samples of soil (72 mg/kg water-extractable phosphorus, WEP) with various amendments at different rates for 63 d at field moisture capacity and 25 oC. The amendments tested were alum [Al2(SO4)3-14H2O], ferric chloride (FeCl3), calcium carbonate (CaCO3), water treatment residual (WTR), and sugarbeet lime (SBL). Ferric chloride and alum at rates of 1.5 and 3.9 g/kg, respectively, were the most effective amendments that decreased WEP to 20 mg/kg, below which leaching has previously been shown to be low. Alum (1.3 kg/m2, which is less sensitive to redox conditions, was subsequently tested under field conditions, where it reduced WEP concentration in the 0- to 0.15-m layer from 1.19 mg/kg on Day 0 to 36.1 mg/kg (85% decrease) on Day 41. Lysimeter breakthrough tests using tertiary-treated potato-processing wastewater (mean total phosphorus [TP] = 3.4 mg/L) showed that alum application reduced leachate TP and soluble reactive phosphorus (SRP) concentrations by 27 and 25%, respectively. These results indicate that alum application may be an effective strategy to immobilize P in high P coarse-textured soils. The relatively smaller decreases in TP and SRP in the leachate compared to WEP suggest some of the P may be coming from depths below 0.2 m. Thus, to achieve higher P sequestration, deeper incorporation of the alum may be necessary.
Brenan et al. (2011) conducted laboratory agitator tests to identify the most effective amendments to reduce dissolved reactive phosphorus (DRP) loss from the soil surface after land application of chemically amended dairy cattle slurry. This test involved adding slurry mixed with various to intact soil samples at approximate field capacity. In order of effectiveness, atoptimum application rates, ferric chloride (FeCl2) reduced the DRP in overlying water by 88%,aluminium chloride (AlCl2) by 87%, alum (Al2(SO4)3ÆnH2O) by 83%, lime by 81%, aluminium water treatment residuals (Al-WTR; sieved to <2 mm) by 77%, flyash by 72%, fluegas desulphurization byproduct by 72% and Al-WTR sludge by 71%. Ferric chloride (€4.82 /m3 treated slurry) was the most cost-effective chemical amendment. However, Al compounds are preferred owing to stability of Al–P compared with Fe–P bonds. Alum is less expensive than AlCl2 (€6.67 /m3), but the risk of effervescence needs further investigation at field-scale. Phosphorus sorbing materials (PSM) were not as efficient as chemicals in reducing DRP in overlying water. The amendments all reduced P loss from dairy slurry, but the feasibility of these amendments may be limited because of the cost of treatment.
Adler, P.R., Sibrell, P.L., 2003. Sequestration of phosphorus by acid mine drainage floc. 32:1122-1129.
et al.
J. Environ. Qual
REFERENCES
106
Agyin-Birikorang, S., O'Connor, G.A., Jacobs, L.W., Makris, K.C., Brinton, S.R., 2007. Long-term phosphorus immobilization by a drinking water treatment residual. 36:316-323.
Ali, I., Barrington, S., Bonnell, R., Whalen, J., Martinez, J., 2007. Surface irrigation of dairy farm effluent, Part II: System design and operation. . 96:65-77.
Allen, B.L., Mallarino, A.R., 2008. Effect of liquid swine manure rate, incorporation, and timing of rainfall on phosphorus loss with surface runoff. 37:125-137.
Andraski, T.W., Bundy, L.G., Kilian, K.C., 2003. Manure history and long-term tillage effects on soil properties and phosphorus losses in runoff. 32:1782-1789.
Brennan, R. B., O. Fenton, M. Rodgers, and M. G. Healy. 2011. Evaluation of chemical amendments to control phosphorus losses from dairy slurry. 27:238–246.
Beegle, D., 2000. Integrating phosphorus and nitrogen management at the farm level. 159-168.
Brauer, D., Aiken, G.E., Pote, D.H., Livingston, S.J., Norton, L.D., Way, T.R., Edwards, J.H., 2005. Amendment effects on soil test phosphorus. 34:1682-1686.
Chen, Y., Samson, R., 2002. Integration of liquid manure into conservation tillage corn systems. 45:629-638.
Chien, S.H., Prochnow, L.I., Cantarella, H., 2009. Recent developments of fertilizer production and use to improve nutrient efficiency and minimize environmental impacts.
, Vol 102. Elsevier Academic Press Inc, San Diego, pp. 267-322.
Daverede, I.C., Kravchenko, A.N., Hoeft, R.G., Nafzige E.D., Bullock, D.G., Warren, J.J., Gonzini, L.C., 2004. Phosphorus runoff from incorporated and surface-applied liquid swine manure and phosphorus fertilizer. 33:1535-1544.
Dayton, E.A., Basta, N.T., Jakober, C.A., Hattey, J.A. 003. Using treatment residuals to reduce phosphorus in agricultural runoff. . 95:151-158.
Elliott, H.A., O'Connor, G.A., Lu, P., Brinton, S., 2002. Influence of water treatment residuals on phosphorus solubility and leaching. 31:1362-1369.
Geleta, S.B., Brinsfield, R.B., Mulford, F.R., Womack, H.E., Briand, C.H., O'Keefe, J.A., 2004. Managing phosphorus for yield and quality of sweet corn grown on high phosphorus soils of Maryland's eastern shore. .84:713-718.
Geohring, L.D., McHugh, O.V., Walter, M.T., Steenhuis, T.S., Akhtar, M.S., Walter, M.F., 2001. Phosphorus transport into subsurface drains by macropores after manure applications: implications for best manure management practices. 166:896-910.
J. Environ. Qual
Biosyst. Eng
J. Environ. Qual
J. Environ. Qual
Soil Use Manage.
Agric. and Phos. Manage.,
J. Environ. Qual
Trans. ASAE
Advances in Agronomy
J. Environ. Qual
J. Am. Water Works Assoc
J. Environ. Qual
Can. J. Plant Sci
Soil Sci.
107
Giroux, M., Royer., R., 2007. Long term effects of phosphate applications on yields, evolution of P soil test, saturation, and solubility in two very ri 18:17-24.
Grandhi, R.R., 2001. Effect of supplemental phytase an ietary amino acid ratios in covered and hulless-barley-based diets on pig performance and excretion of phosphorus and nitrogen in manure. 81:115-124.
Guo, M., Song, W., 2009. Nutrient value of alum-treated poultry litter for land application. 88:1782-1792.
Hatten, L.F., Ingram, D.R., Pittman, S.T., 2001. Effect of phytase on production parameters and nutrient availability in broilers and laying hens: A review. 10:274-278.
Hyde, J.E., Morris, T.F., 2000. Phosphorus availability in soils amended with dewatered water treatment residual and metal concentrations with time idual. 29:1896-1904.
Kleinman, P.J.A., Sharpley, A.N., Saporito, L.S., Buda, A.R., Bryant, R.B., 2009. Application of manure to no-till soils: phosphorus losses by sub-surface and surface pathways.
84:215-227.
Kratochvil, R.J., Coale, F.J., Momen, B., Harrison, M.R., Pearce, J.T., Schlosnagle, S., 2006. Cropping systems for phytoremediation of phosphorus-enriched soils. Int. J. Phytoremed. 8:117-130.
Lewis, T.W., Makarewicz, J.C., 2009. Winter application of manure on an agricultural watershed and its impact on downstream nutrient fluxes. 35:43-49.
MacDonald, G.K., Bennett, E.M., 2009. Phosphorus Accumulation in Sa iver Watershed Soils: A Century-Long Perspective. 12:621-635.
Maguire, R.O., Mullins, G.L., Brosius, M., 2008. Evaluating long-term nitrogen- versus phosphorus-based nutrient management of poultry litter. . 37:1810-1816.
McFarland, A.M.S., Hauck, L.M., 2004. Controlling phosphorus in runoff from long term dairy waste application fields. 40:1293-1304.
Meals, D.W., J. Fay, and M. Barsotti. 2009. Effects of water treatment residual addition on phosphorus in liquid dairy manure. . 100(4):1-20.
Novak, J.M., Watts, D.W., 2004. Increasing the phosphorus sorption capacity of southeastern Coastal Plain soils using water treatment residuals. 169:206-214.
Agrosolutions
Can. J. Animal Sci.
Poult. Sci.
J. Appl. Poultry Res.
J. Environ. Qual
J. Environ. Qual.
Nutrient Cycling in Agroecosystems
J,Great Lakes Res.
Ecosystems
J. Environ. Qual
J. Am. Water Resour.Assoc
J. Am. Water Works Assoc
Soil Sci.
108
Novak, J.M., Watts, D.W., 2005. An alum-based water treatment residual can reduce extractable phosphorus concentrations in three phosphorus-enriched coastal plain soils. . 34: 1820-1827.
Oquist, K.A., Strock, J.S., Mulla, D.J., 2007. Influence of alternative and conventional farming practices on subsurface drainage and water quality . 36:1194-1204.
Osei, E., Du, B., Bekele, A., Hauck, L., Saleh, A., Tanter, A., 2008. Impacts of alternative manure application rates on texas animal feeding operations: A macro level analysis.
:562-576.
Risse, L.M., Gilley, J.E., 2000. Manure impacts on runoff and soil loss. 578-587.
Sharma, N.C., Sahi, S.V., 2005. Characterization of phosphate accumulation in Lolium multiflorum for remediation of phosphorus-enriched soils. 39, 5475-5480.
Sojka, R., 2009. Matrix-based fertilizer: A new fertilizer formulation concept to reduce nutrient leaching Proceedings of the New Zealand Lime and Ferti izer Institute Workshop .
Srinivasan, M.S., Bryant, R.B., Callahan, M.P., Weld, J.L., 2006. Manure management and nutrient loss under winter conditions: A literature re iew. . 61:200-209.
Zhang, T.Q., MacKenzie, A.F., Liang, B.C., Drury, C.F., 2004. Soil test phosphorus and phosphorus fractions with long-term phosphorus addition and depletion. 68:519-528.
Zvomuya, F., Rosen, C.J., Gupta, S.C., 2006. Phosphorus sequestration by chemical amendments to reduce leaching from wastewater applications. . 35:207-215.
J. Environ. Qual
. J. Environ. Qual
J. Am. Water Resour.Assoc. 44
Animal, Agric. and Food Proc. Wastes.
Env. Sci. & Technol.
J. Soil Water Conserv
Soil Sci. Soc. Am. J.
J.Environ. Qual
109
There is a modest amount of literature available; however, little has been published that is directly applicable to aeration on grassland in the LCB.Significant benefits have been reported for aeration with respect to reduction of runoff volume and P loss, but the results are variable, with some studies reporting little or no effect.Most of the benefits of aeration appear to derive from enhancement of infiltration and runoff reduction.Reductions in runoff by ~90% and of P export by 50 – 60% have been reported.Unlike many other BMPs, aeration prior to manure applicatio appears to have significant effects on runoff losses of dissolved P.Some increases in sediment and P losses have been reported from aggressive application of aeration equipment.Soil drainage class appears to be a significant factor, with significant reductions in runoff, TSS and TP from aeration of well-drained soils, while increases in runoff and P loss on poorly drained soils.
There is a substantial literature on the effectiveness of cover cropping; however most work has been done in the mid-Atlantic region and has been focused on N, e.g., uptake of excess N after the main crop is harvested or addition of N by legume cover crops. Little work has been reported on P.Nearly all research reports that cover cropping has significant effects on reducing soil erosion rates from cropland.In most cases, the use of cover crops has been reported to significantly reduce runoff volumes, soil loss, and loss of particulate P from cropland.However, the use of cover crops has sometimes been reported to increase concentrations of dissolved P in cropland runoff and to increase the proportion of total P export that is bioavailable.Manure application to cover cropped fields without incorporation can be problematic; spring manure application to cover cropped fields without incorporation can result in high runoff losses, especially of dissolved P.Cover crops may indirectly reduce nutrient losses from cropland by increasing the efficiency of nutrient use by the main crop, thereby reducing the quantity of nutrients available to be lost or by reducing the need for nutrient additions.Long-term use of cover crops is widely reported to improve soil quality and therefore may indirectly reduce P and sediment losses by reducing surface runoff and promoting infiltration.
The notion of manure incorporation into reduced tillage is a somewhat contradictory concept and one that has received little or no direct study.
9.0 Conclusions
9.1 Soil Aeration
9.2 Cover Cropping
9.3 Reduced tillage and manure incorporation
•
•
•
••
•
•
•
•
•
•
•
•
•
•
110
Research has widely shown that soil erosion potential may increase substantially as a result of tillage and that reduced or conservation tillage can effective educe soil erosion; however reduced tillage may increase P loss, especially of soluble P, if surface applied manure is exposed to rainfall and runoff.The incorporation of manure into soil can significantly reduce runoff volume and soil loss and control runoff P losses. However, manure incorporation through tillage can increase soil loss.Manure application to reduced tillage cropland or cropland with substantial crop residue left on the soil surface has been shown to increase P losses in runoffSpecialized equipment for manure application/incorporation into reduced tillage cropland may leave adequate residue cover for acceptable soil erosion control, particularly in non-fragile residue, the equipment must be selected, adjusted and operated with the dual objectives of residue and manure management, rather than used simply as a means of manure disposal.Application of manure to no-till soils can increase P losses in leachate due to the presence of macropores. Some research has shown that soil tillage before or after manure application can lower P leaching by destroying macropores. However, tillage can increase sediment-bound P loss in surface runoff relative to broadcasting, shifting the mechanism of P loss from rapid incidental transfer of soluble P in manure to erosion.
There has been very little research on the independent effects of grassed waterways on runoff, sediment, or P losses from cropland; GWWs are nearly always installed as part of a conservation practice system.A long-term study of GWWs in Germany documented that GWWs can significantly reduce runoff by up to 90% and sediment delivery by 77 – 97%. Removal was primarily driven by infiltration and particle settling, rather than straining particulates through standing vegetation.Direct effects of GWWs on dissolved P appear to be small, with dissolved P load reductions occurring only in proportion to flow reduction through infiltration.GWWs installed in combination with other practices or installed throughout a watershed can yield significant reductions in sediment and sediment-associated PIn some ways, GWWs can be thought of as long vegetated filter strips; data on design and performance of vegetated filter strips should be consulted when considering the potential effectiveness of GWWs.
Despite the fact that WASCOBs have been a recommended cropland erosion control practice for decades, most testing of the practice appears to have been done decades ago; there is little recent published research on individual WASCOB effectiveness on sediment and attached P.Older research indicates that WASCOBs can reduce soil loss by as much as 95%, with corresponding reduction of sediment-bound P; however, reductions of dissolved P fractions may not occur.Recent research confirms this pattern of high reductions of sediment and particulate P, but little effect on soluble P.
•
•
•
•
•
•
•
•
•
•
•
•
•
9.4 Grassed Waterways
9.5 Water and Sediment Control Basins
111
WASCOBs tend to be more effective when applied to situations with relatively high soil loss, and less effective in areas of low erosion potential.
Contrary to past assumptions, significant amounts of P can be lost from agricultural land via subsurface drainage.On some soil types, subsurface drainage can reduce annual P export from crop fields by reducing the quantity of surface runoff. Construction of subsurface drainage in sandy loam soil could greatly reduce the likelihood of surface runoff occurrence, and thus minimize the likelihood of high concentration discharges of P into surface watersAs a management practice, subsurface drainage thus appears to have a greater beneficial effect in controlling phosphorus transport in sandy loam soils than in clay loam soils.Preferential flow is more likely to facilitate higher migration of TP to the drainage tiles from clay loam soils than sandy loam soils.Tile drain discharge can, however, yield substantially greater annual average soluble P mass loads than surface runoff due to greater flow volume.P loading through subsurface drainage – even particulate P – can be significant where macropore flow allows water to bypass soil filtration.Controlled or “conservation” drainage can reduce N losses in tile outflow by promoting denitrification and may reduce both N and P loads by reducing overall drainage flow volume; however, controlled drainage appears to have little direct effect on P concentrations.
Improved crop use efficiency resulting from changes in waste and fertilizer form may yield reductions in P losses due to reductions in total amount of P applied and reductions in leaching losses.Changes in nutrient application methods and timing – e.g., manure incorporation or shallow tillage to disrupt macropores – can reduce P losses through surface runoff and leaching.Soil test P can be decreased in high-P soils over time by changing from an N-based to a P-based nutrient management plan or stopping P applications without negatively affecting yields. There may, however, be considerable lag time between implementation of nutrient management and lowered soil P levels due to gradual mining of existing soil P and slow conversion of residual fertilizer P to less available P forms in soil.Planting and harvesting certain crops can accelerate removal of excess P from soils, if the crops are harvested and removed from the field. Treating manure or soils with Al or Fe-bearing compounds like alum or water treatment residuals can reduce soluble P content of manure and effectively reduce soil P levels, thereby decreasing the risk of P losses from land receiving manure.