Single population and common natal origin for Adriatic Scomber scombrus stocks: evidence from an integrated approach Chiara Papetti 1 † , Antonio Di Franco 2,3 † , Lorenzo Zane 1 , Paolo Guidetti 2,3 , Valeria De Simone 2 , Marianna Spizzotin 1 , Barbara Zorica 4 , Vanja C ˇ ikes ˇ Kec ˇ 4 , and Carlotta Mazzoldi 1 * 1 Department of Biology, University of Padova, Via U. Bassi 58/B, 35131 Padova, Italy 2 Laboratory of Conservation and Management of Marine and Coastal Resources, DiSTeBA, University of Salento, Via Provinciale per Monteroni sn, 73100 Lecce, Italy 3 Universite´ de Nice Sophia-Antipolis, Faculte ´ des Sciences, EA 4228 ECOMERS, 06108 Nice Cedex 2, France 4 Institute of Oceanography and Fisheries, Mes ˇtovic ´a 63, 21000 Split, Croatia *Corresponding Author: tel: +39 0498276194; fax: +39 0498276199; e-mail: [email protected]Papetti, C., Di Franco, A., Zane, L., Guidetti, P., De Simone, V., Spizzotin, M., Zorica, B., C ˇ ikes ˇ Kec ˇ, V. and Mazzoldi, C. 2013. Single population and common natal origin for Adriatic Scomber scombrus stocks: evidence from an integrated approach – ICES Journal of Marine Science, 70: 387–398. Received 21 September 2012; accepted 12 December 2012; advance access publication 15 January 2013. In order to implement proper fishery management strategies aimed at avoiding stock declines, information about connectivity among stocks and populations is critically required. In this perspective, the present study investigated population structure of the Atlantic mackerel Scomber scombrus in the northern –central Adriatic Sea by integrating multiple approaches (analysis of fisheries data, popu- lation genetics, and otolith chemistry). Monthly data of fishery landings indicate a latitudinal trend along the western Adriatic coast, with Atlantic mackerel disappearing from the northern waters in winter, corresponding to the reproductive season. Population genetic analyses by genotyping of eight microsatellites clearly point to the presence of a single panmictic population in the northern – central Adriatic Sea. Otolith cores of samples from the northern – central Adriatic were chemically homogeneous, suggesting a common spawning ground. These results strongly suggest that Atlantic mackerel perform an autumn–winter migration in the northern– central Adriatic Sea, from the northern to the central sector, to reach a single spawning ground, and that a single population is present in this area. Considering that S. scombrus has shown a marked decline in the last 40 years in the Adriatic, this study highlights a potential high vulnerability to collapse by overfishing for the Atlantic mackerel stocks in this geographic area. Keywords: Adriatic Sea, Atlantic mackerel, microsatellite, otolith chemical fingerprint, population connectivity, spawning area. Introduction Failing to detect the population structure of marine species tar- geted by fishing can lead to local overfishing and severe stock decline (Ying et al., 2011). This issue has often been underesti- mated based on the untested assumption of equality between the genetic concept of population (a group of conspecific individuals interbreeding and living in the same place at the same time) and the management concept of stock (identifying a management unit, i.e. a semi-discrete group of fish, with some definable attri- butes that are of interest to fishery managers regardless of strict genetic and/or biological assumptions; Jennings et al., 2001). This has resulted in neglecting both that a stock could be replen- ished by multiple populations and that multiple stocks could belong to a single population (Hauser and Carvalho, 2008; Ying et al., 2011). Proper fish stock management thus requires knowl- edge of the stock structure (i.e. identification of the populations replenishing the stock) and its variation with respect to environ- mental and ecological conditions (Allison et al., 2009; Rose et al., 2011). In particular, a better understanding of the factors influencing connectivity among spawning groups and estimation † These authors contributed equally to this work. # 2013 International Council for the Exploration of the Sea. Published by Oxford University Press. All rights reserved. For Permissions, please email: [email protected]ICES Journal of Marine Science ICES Journal of Marine Science (2013), 70(2), 387 – 398. doi:10.1093/icesjms/fss201 Downloaded from https://academic.oup.com/icesjms/article-abstract/70/2/387/798183 by guest on 28 January 2018
Transcript
Single population and common natal origin for Adriatic Scomberscombrus stocks: evidence from an integrated approach
Chiara Papetti1†, Antonio Di Franco2,3†, Lorenzo Zane1, Paolo Guidetti2,3, Valeria De Simone2,Marianna Spizzotin1, Barbara Zorica4, Vanja Cikes Kec4, and Carlotta Mazzoldi1*1Department of Biology, University of Padova, Via U. Bassi 58/B, 35131 Padova, Italy2Laboratory of Conservation and Management of Marine and Coastal Resources, DiSTeBA, University of Salento, Via Provinciale per Monteroni sn,73100 Lecce, Italy3Universite de Nice Sophia-Antipolis, Faculte des Sciences, EA 4228 ECOMERS, 06108 Nice Cedex 2, France4Institute of Oceanography and Fisheries, Mestovica 63, 21000 Split, Croatia
Papetti, C., Di Franco, A., Zane, L., Guidetti, P., De Simone, V., Spizzotin, M., Zorica, B., Cikes Kec, V. and Mazzoldi, C. 2013. Single populationand common natal origin for Adriatic Scomber scombrus stocks: evidence from an integrated approach – ICES Journal of Marine Science, 70:387–398.
Received 21 September 2012; accepted 12 December 2012; advance access publication 15 January 2013.
In order to implement proper fishery management strategies aimed at avoiding stock declines, information about connectivity amongstocks and populations is critically required. In this perspective, the present study investigated population structure of the Atlanticmackerel Scomber scombrus in the northern –central Adriatic Sea by integrating multiple approaches (analysis of fisheries data, popu-lation genetics, and otolith chemistry). Monthly data of fishery landings indicate a latitudinal trend along the western Adriatic coast,with Atlantic mackerel disappearing from the northern waters in winter, corresponding to the reproductive season. Population geneticanalyses by genotyping of eight microsatellites clearly point to the presence of a single panmictic population in the northern –centralAdriatic Sea. Otolith cores of samples from the northern –central Adriatic were chemically homogeneous, suggesting a commonspawning ground. These results strongly suggest that Atlantic mackerel perform an autumn–winter migration in the northern–central Adriatic Sea, from the northern to the central sector, to reach a single spawning ground, and that a single population ispresent in this area. Considering that S. scombrus has shown a marked decline in the last 40 years in the Adriatic, this study highlightsa potential high vulnerability to collapse by overfishing for the Atlantic mackerel stocks in this geographic area.
Keywords: Adriatic Sea, Atlantic mackerel, microsatellite, otolith chemical fingerprint, population connectivity, spawning area.
IntroductionFailing to detect the population structure of marine species tar-geted by fishing can lead to local overfishing and severe stockdecline (Ying et al., 2011). This issue has often been underesti-mated based on the untested assumption of equality between thegenetic concept of population (a group of conspecific individualsinterbreeding and living in the same place at the same time) andthe management concept of stock (identifying a managementunit, i.e. a semi-discrete group of fish, with some definable attri-butes that are of interest to fishery managers regardless of strict
genetic and/or biological assumptions; Jennings et al., 2001).This has resulted in neglecting both that a stock could be replen-ished by multiple populations and that multiple stocks couldbelong to a single population (Hauser and Carvalho, 2008; Yinget al., 2011). Proper fish stock management thus requires knowl-edge of the stock structure (i.e. identification of the populationsreplenishing the stock) and its variation with respect to environ-mental and ecological conditions (Allison et al., 2009; Roseet al., 2011). In particular, a better understanding of the factorsinfluencing connectivity among spawning groups and estimation
†These authors contributed equally to this work.
# 2013 International Council for the Exploration of the Sea. Published by Oxford University Press. All rights reserved.For Permissions, please email: [email protected]
ICES Journal of
Marine ScienceICES Journal of Marine Science (2013), 70(2), 387–398. doi:10.1093/icesjms/fss201
Downloaded from https://academic.oup.com/icesjms/article-abstract/70/2/387/798183by gueston 28 January 2018
of the potential for replenishment of depleted grounds are critic-ally needed (Rose et al., 2011). In this framework, a multidisciplin-ary approach integrating, for example, fisheries data, populationgenetics, and otolith microchemistry analyses could provide essen-tial insights into population demographic processes, connectivity,and migration patterns (Hauser and Seeb, 2008), which representcritical pieces of information needed to answer relevant fisheryscience questions. Data from a specific fishing fleet operatingin a definite area may allow the highlighting of fish migration pat-terns through periodic and predictable changes in catches (Walshet al., 1995). Otolith microchemistry provides one of the mostvaluable methods to identify homogeneity/heterogeneity in thenatal origin of individuals belonging to single or multiple stocksand potentially to make inferences regarding patterns of dispersaland connectivity. Otoliths can be used as a natural biological tagfor natal origin of fish (Green et al., 2009), because theyincorporate, into the calcium carbonate matrix of their core(i.e. the portion of the otolith originating at birth and thusrelated to the natal origin of fish; Green et al., 2009), chemicalelements at rates related to environment concentrations andconditions at the moment of spawning. Similarly to otolith chem-ical data, genetics can provide connectivity information difficultto obtain with traditional methods, allowing a fine-scale pictureof spatio-temporal boundaries of populations (Hauser andCarvalho, 2008; Rose et al., 2011).
In the present study, we integrated multiple approaches (i.e.fisheries data, otolith microchemistry, and genetics) to investigatepopulation structure of Atlantic mackerel (Scomber scombrus) inthe Adriatic Sea, where this species represents a valuable targetfor local fisheries (IREPA, 2011). Scomber scombrus is a pelagicspecies widely distributed in the Atlantic Ocean, Black Sea, andMediterranean Sea (Studholme et al., 1999; Froese and Pauly,2012). Atlantic mackerel form large shoals (Lockwood, 1988)that undergo migrations over great distances (i.e. 1200 km in13 d in the Northeast Atlantic; Lockwood, 1988) mainly for repro-ductive and trophic needs (Walsh et al., 1995). Spawning groundsand/or migration routes are well known for the various stocks inthe Atlantic, e.g. along the European shelf around Britain (Walshet al., 1995; Reid et al., 1997), in the western Atlantic (Studholmeet al., 1999), and in the eastern Atlantic (Uriarte and Lucio, 2001).Migration routes are usually known and exploited by local fisher-ies, with the start of fishing activities coinciding with the spawningmigration (Punzon and Villamor, 2009).
The Adriatic Sea is a semi-enclosed, elongated basin of theMediterranean Sea (Russo and Artegiani, 1996; Figure 1) encom-passing two Geographical Subareas (GSA 17 for the northern–central Adriatic and GSA 18 for the southern Adriatic; GeneralFisheries Commission for the Mediterranean, www.gfcm.org;Figure 1). Three sub-basins have been recognized: (i) the northernone extending from the northernmost part to the 100 m bathy-metric line; (ii) the middle Adriatic from the limit of the northernsub-basin to the Pelagosa Sill (�170 m depth) characterized bytwo depressions, the Jabuka (Pomo) Pits, reaching a maximumdepth of �270 m; and (iii) the southern sub-basin extendingfrom the Pelagosa Sill to the border of the Ionian Sea, with adepth up to 1000 m (Russo and Artegiani, 1996). The AdriaticSea is one of the most exploited basins in the Mediterraneanand has been historically characterized by an intense fishery on de-mersal and pelagic fish (Barausse et al., 2009). In the Adriatic Sea,mackerel is a target of multiple fisheries, namely bottom andpelagic trawling, purse-seine, and a small artisanal fishery
(IREPA, 2011). This species has shown a massive decline incatches in the 1970s in different areas of the Adriatic, with nosigns of recovery (Sinovcic, 2001; Azzurro et al., 2011; ClodiaDatabase, 2012).
The combination of analysis of fisheries data, populationgenetics, and otolith chemistry was used in this study to investi-gate population and stock structure of Atlantic mackerel in thenorthern–central Adriatic (i.e. GSA 17). In particular, landingsdata from the different Italian regions of the Adriatic Sea wereused to highlight recurrent monthly–seasonal variations in catch,potentially providing suggestions about stock migrations. Popula-tion genetics analyses were aimed at verifying the presence of dif-ferentiation and possibly the existence of a panmictic populationin the northern–central Adriatic Sea, as suggested by the potentialfor long-distance dispersal of this species. Otolith chemical ana-lyses were aimed at identifying the occurrence of one or multiplespawning ground/s.
Material and methodsFisheries dataTo explore the monthly variation in Atlantic mackerel landingsalong the western Italian coast, official fisheries statistics fromIREPA (Institute for Economic Research in Fishery and Aqua-culture, http://www.irepa.org) were used. Mackerel landingswere available for each Adriatic Italian region (Figure 1) from2004 to 2009 (from 2005 to 2009 for Molise). Apulia data includedonly fisheries data from the Adriatic Sea.
Sample collectionSamples were collected within the GSA 17 from three areas of theAdriatic Sea located in the northern sub-basin and at the borderbetween the northern and central sub-basins. In order to illustratethe latitudinal location of the three sites, they will be referred as:northern–western (off Chioggia), central–western (off Ancona),and central–eastern (Kastela Bay, open sea off Solta and DugiOtok islands; Figure 1). Collections were made from April toJuly 2010, outside the breeding season that lasts from January toMarch (Bottari et al., 2004; C. Mazzoldi, unpubl. data). A totalof 172 samples (Table 1) were obtained by local fishers and pro-cessed fresh in the laboratory. Total length (TL to the nearest0.1 cm) and sex were recorded for each specimen. In order toavoid any bias in the results due to temporal or sex differencesin genetic structure or otolith chemistry, samples were chosen tomaintain a sex ratio and age ratio (1:2 years, C. Mazzoldi,unpubl. data) close to 1 for each sampling site. Age was assessedby otolith reading (C. Mazzoldi, unpubl. data). When this wasnot possible, the size range of individuals was used to infer age.All TLs were within the size range of individuals presenting age1 or 2 (C. Mazzoldi, unpubl. data). A finclip was taken, preservedin 95% ethanol, and refrigerated at 48C for genetic analysis.Otoliths (sagittae) were removed, cleaned of soft tissue usingplastic dissecting pins, and dry preserved.
Sample processing for population geneticsGenetic analyses were performed on all collected specimens and onone additional “historical” sample (n ¼ 50) collected in the south-ern–western Adriatic (in front of Bari, GSA 18) in June 2001.
Genomic DNA was extracted from 10–50 mg of finclip tissuefollowing a standard salting-out protocol (Patwary et al., 1994).
388 C. Papetti et al.
Downloaded from https://academic.oup.com/icesjms/article-abstract/70/2/387/798183by gueston 28 January 2018
All individuals were genotyped for eight microsatellite loci(GenBank accession numbers JQ219865, JQ219866, JQ219869,JQ219871, JQ219872, JQ219874, JQ219876, and JQ219878).Polymerase chain reaction (PCR) products were obtained in aGeneAmp PCR System 9700 thermal cycler (Applied Biosystems)
following described conditions (Molecular Ecology ResourcesPrimer Development Consortium et al., 2012). Amplified frag-ments were screened for microsatellite polymorphism using anABI 3130 XL automatic capillary sequencer (Applied Biosystems;service provided by BMR Genomics, http://bmr-genomics.com).
Figure 1. The Adriatic Sea. Italian regions, sampling sites (shaded areas), and the main localities cited in the text are indicated. The dotted lineindicates the boundary between Geographical Subareas (GSA) 17 and 18 following the General Fisheries Commission for the Mediterranean.
Population structure of Scomber scombrus 389
Downloaded from https://academic.oup.com/icesjms/article-abstract/70/2/387/798183by gueston 28 January 2018
Alleles were sized using a LIZ 500 (50–500 bp) size ladder (AppliedBiosystems) and analysed using GeneMarker v. 1.71 (SoftGenetics);binning was automated with the software FlexiBin 2 (Amos et al.,2007) and refined by eye. All samples with unsuccessful PCR werereamplified; in addition, �10% of all individuals were reamplifiedand rerun to ensure repeatability of allele scoring and to check forgenotyping artefacts. Micro-Checker ver. 2.2.3 (van Oosterhoutet al., 2004) was used to identify possible genotyping errors (i.e.stuttering, large allele dropout, and null alleles, 1000 randomiza-tions). Correction for null alleles was performed with FreeNA(Chapuis and Estoup, 2007).
Analysis of otolith chemistryOtoliths were mounted sulcus side up on a glass slide using crystal-bond, previously tested to ensure it was not a source of contamin-ation under the adopted analysis settings. Otoliths were polishedwith 40, 3, and 1 mm Imperial lapping film to expose innergrowth layers for analysis. We chose not to polish the otolith tothe core, but to leave material above the core to ensure it wasnot removed during pre-ablation procedures, which potentiallyallowed us to sample all the material associated with the core.After polishing with lapping film, otoliths were rinsed and soni-cated for 10 min in ultrapure water. After drying, otoliths weremounted in random order on clean petrographic slides.
All otoliths were analysed using a Thermo Elemental X7 in-ductively coupled plasma mass spectrometer (ICP-MS) coupledto a NewWave Research UP213 with an aperture imaging laserablation (LA) system. External calibration was performed withtwo Standard Reference Materials (SRMs) from the NationalInstitute of Standards and Technology: NIST 610 and NIST 612.Calcium was used as an internal standard to account for variationin ablation and aerosol efficiency. All nine elements analysed(24Mg, 55Mn, 66Zn, 88Sr, 138Ba, 208Pb, 7Li, 57Fe, and 59Co)were expressed as ratios relative to 44Ca.
Limits of detection (LOD) were calculated from the concentra-tion of analyte, yielding a signal equivalent to three times thestandard deviation of the blank signal for each of the elements,and are described in Table 2.
Otoliths were analysed for chemical composition of both thecore (in order to acquire information about natal origin) andthe margin (i.e. close to the otolith edge, reflecting exposure ofan individual to environmental conditions at the site where the in-dividual was sampled).
Otoliths were placed in the ablation chamber and viewed re-motely on a computer screen where the area for ablation wasselected. The laser was focused on the sample surface and firedthrough the microscope objective lens using a spot size of
30 mm. Each run generally consisted of 40 s acquisition: (i) 10 sblank to correct for background, which was subtracted fromeach sample; (ii) 10 s ablation (laser at 65% power, �6 J cm22)resulting in a pit �10 mm deep; and (iii) 20 s for washout.Prior to analysis, samples were pre-ablated to remove anysurface contamination (laser at 50% power). Helium gas wasflushed into the ablation cell to reduce the deposition of ablatedaerosols and to improve signal intensities. The ablated aerosolwas then mixed with argon before entering the ICP torch.
Elemental analyses of otolith cores and margins produced con-centrations that were greater than the LOD in 100% of the samplesfor Sr, Ba, and Mg (Table 2). Concentrations of other elementsconsidered were predominantly less than the LOD; for thisreason, these elements were excluded from subsequent analyses.
We sampled the material associated with the core using threediscrete vertical pits 30 mm (identified previously as the approxi-mate size of the cores) from the surface of the otolith throughthe visible core. Due to the exclusion of Mn from the analyses(because it was consistently below the LOD) and due to the factthat the LOD of Mn in the present study was similar to or lowerthan those from other studies where a spike in Mn:Ca wasadopted as an indicator of the core location (e.g. Di Francoet al., 2012, and references therein), we hypothesized that, in thestudied species, a spike in Mn:Ca could not be an effective “corelocalizer”. From this perspective, we chose to consider for thecore analyses all the three replicates sampled. In the presentwork, the core identifies the area laid down at egg fecundationand very early larval stages (as in Miller and Shanks, 2004).
In the otolith margin, we ablated three horizontal pits, and allthree were considered in subsequent analysis in order to account
Table 1. Samples of Scomber scombrus analysed in this study.
Sampling area (site, GSA) Year Tot ind. Size range (mm TL) n genetic n otolith
Northern–western (off Chioggia, 17) 2010 60 240–356 60 53Central–western (off Ancona, 17) 2010 59 228–300 59 39Central–eastern (Kastela Bay and off Solta and Dugi Otok, 17)a 2010 53 237–333 53 39Southern–western (off Bari, 18) 2001 50 265–317 50 NA
All individuals were genotyped for eight microsatellite loci, while population samples from the northern and central Adriatic Sea were used for otolithreading.GSA, Geographic Subarea following the General Fisheries Commission for the Mediterranean nomenclature; year, year of collection; tot ind., total number ofindividuals analysed for each site; size range, total length in mm; n genetic, number of samples used for genetic analyses; n otolith, number of samples usedfor otolith analyses; NA, not available.aSex was not determined for three specimens
Table 2. Limit of detection (LOD, given in mmol mol21) for eachtrace element in Scomber scombrus otoliths and percentage ofotolith ablations above the LOD for each element in both marginsand cores.
Downloaded from https://academic.oup.com/icesjms/article-abstract/70/2/387/798183by gueston 28 January 2018
for within-otolith variability (see Di Franco et al., 2011 for furtherdetails).
Data analysesMonthly fisheries data for each Italian region were analysed apply-ing the Kruskal–Wallis non-parametric analysis of variance(ANOVA), excluding August data since midwater and bottomtrawling is banned in this month in several regions.
Microsatellite genotypes were examined to infer genetic vari-ability and population structure patterns. The online version ofGenepop (Raymond and Rousset, 1995) was used to identifydeviations from Hardy–Weinberg equilibrium (HWE) by exacttests (1000 iterations) and genotypic disequilibrium (1000 itera-tions). Significance levels for multiple comparisons were adjustedusing the standard Bonferroni technique (Bonferroni, 1936;Miller, 1981).
Genetix ver. 4.05.2 (Belkhir et al., 2001) was used to calculatethe total number of alleles (TNA) and the observed and expectedheterozygosities (Ho and He, respectively). Allelic richness (AR)was calculated by Fstat 2.9.3.2 (Goudet, 1995). A Bayesian algo-rithm implemented in the software Structure ver. 2.3.3(Pritchard et al., 2000) was used to identify genetically homoge-neous groups of individuals on the basis of their genotypes at mul-tiple loci.
Differences in allele and genotype frequencies among samples(sampling site, sex, and age/size) were assessed using Fisher’sexact test as implemented in Genepop. Significance levels formultiple simultaneous comparisons were adjusted using theBonferroni technique, as described above. Population structurewas explored by calculating pairwise FST between samples inArlequin 3.5.1.2 (Excoffier and Lischer, 2010). Finally, the statistic-al power to detect various true levels of divergence for our samplesizes, number of loci, and their allele frequencies was evaluated bymeans of Fisher’s exact test using the simulation method of Rymanand Palm (2006) implemented in the software Powsim ver. 4.1.Simulations were run using default parameter values for deme-morizations (1000), batches (100), and iterations per batch(1000) for a scenario involving four subpopulations with FST
ranging from 0.001 to 0.02, using an effective population size(Ne of 6600) calculated with a heterozygosity-based method(Ohta and Kimura, 1973). This method predicts that, at muta-tion–drift equilibrium under the stepwise mutation model(SMM), Ne should equal [(1/1 – He)
2 – 1]/8m, where He is theobserved averaged heterozygosity and m is the mutation rate. mwas assumed to be 5 × 1024, according to Estoup and Angers(1998). The statistical power was estimated after 2000 replicatesas the proportion of statistically significant test (p , 0.05). Theprobability of obtaining false positives when the true FST ¼ 0was also obtained at generation t ¼ 0 as a measure of a errorrate. To assess consistency, all simulations were repeated at leastthree times.
For otolith chemistry analyses, to determine the number ofpotential natal origins, the otoliths’ core elemental concentrations(as a proxy for identifying the existence of single or multiple areasof origin) were analysed by cluster analysis. The similarity profilepermutation test (SIMPROF) procedure was used to determinewhich clusters were significantly different at the 5% level.For each specimen, the centroid from the three replicates wasconsidered.
Because homogeneity in otolith chemical composition maysimply reflect environmental similarity, we evaluated potential
spatial variability in otolith chemical composition. For thispurpose, we used unbalanced permutational multivariate analysisof variance (PERMANOVA) to test for differences between thethree sampling sites by analysing the otolith margin (i.e. theotolith portion laid down just before capture). “Site” (Si) wastreated as a random factor (three levels), and “Otolith” (Ot) as arandom factor nested in (Si) (39–59 levels). There were three rep-licate ablations for each otolith (n ¼ 453): the assessment ofintraotolith variability is, in fact, instrumental to then assess the“among-otoliths variability” (Di Franco et al., 2011). Fish TLwas set as the covariate. The test for covariate effect was performedto prevent a fish size (possibly different from site to site and con-sidered as a proxy of fish age) effect on spatial comparisons. Inother words, only conditioning on fish size, any observed differ-ence is attributable to “pure” spatial patterns. Elemental/Caratios that contribute to the significant differences among siteswere identified using similarity percentage (SIMPER).
Multivariate components of variation (VC), %TV [% of totalvariation, i.e. (variation of each factor/total variation) in %],and the ratio “estimated magnitude of variance for each factor/estimated residual variance” (ø) were calculated for the tworandom factors considered in the PERMANOVA analyses (Grayet al., 2009).
Statistical analyses were run using the Primer 6 PERMANOVA +software package and STATISTICA 10 software.
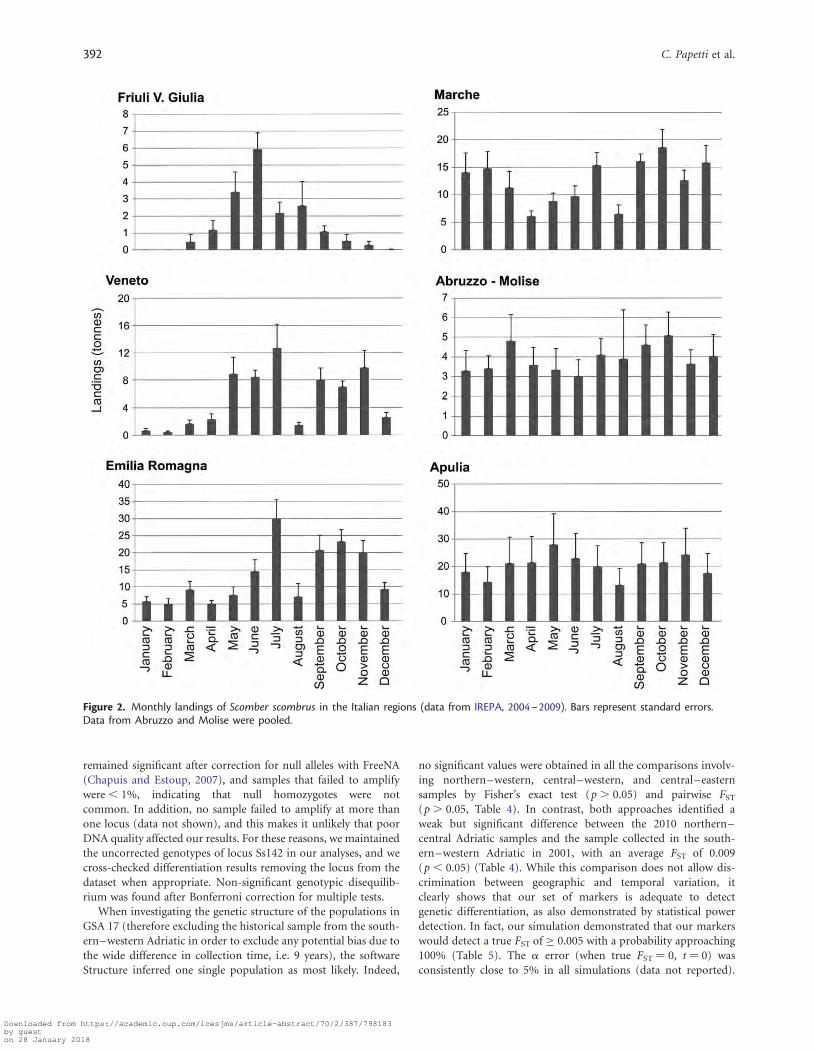
ResultsFisheries dataAverage landing of Atlantic mackerel showed significant differencesbetween months in Friuli Venezia Giulia (H10¼ 48.70; p , 0.0001),Veneto (H10¼ 46.52; p , 0.0001), Emilia Romagna (H10¼ 40.91;p , 0.0001), and Marche (H10¼ 19.62; p ¼ 0.033). Landingsshowed a seasonal trend shifted along a north–south gradient: thenorthern part, Friuli Venezia Giulia, presented the lowest landingsin autumn–winter, Veneto in winter, and Emilia Romagna inwinter–spring. Marche did not show any clear pattern. No significantdifferences were found in Abruzzo (H10¼ 4.69; p¼ 0.911), Molise(H10 ¼ 6.57; p ¼ 0.765), and Apulia (H10 ¼ 3.21; p ¼ 0.976)(Figure 2).
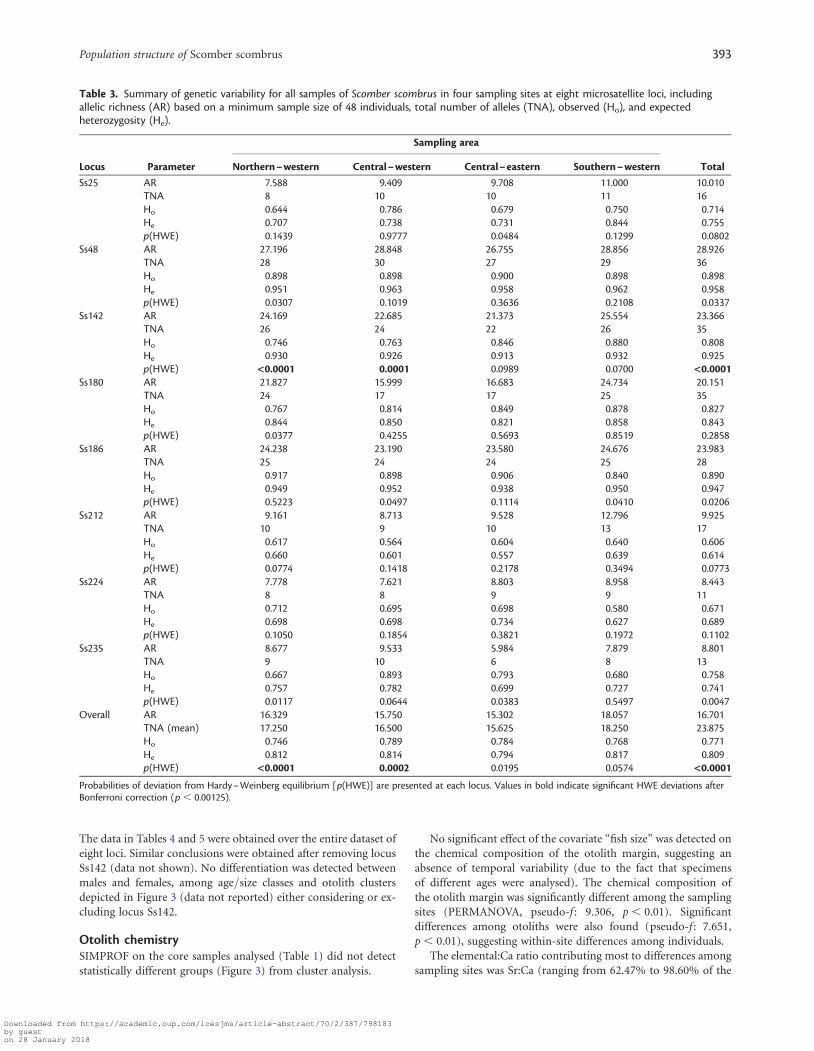
Population geneticsThe total number of alleles ranged between 6 (locus Ss235 in thecentral–eastern Adriatic) and 30 (locus Ss48 in the central–western Adriatic), and allelic richness varied from 5.984 (locusSs235 in the central–eastern Adriatic) to 28.856 (locus Ss48 inthe southern–western Adriatic). Average observed heterozygosityranged from 0.746 in the northern–western sample to 0.789 inthe central–western Adriatic, whereas average expected heterozy-gosity varied from 0.794 in the central–eastern to 0.817 in thesouthern–western sample (Table 3). All comparisons acrosssamples using a non-parametric Friedman test were statisticallynot significant (p . 0.5) except for allelic richness comparison(p ¼ 0.014), due to higher AR in the GSA 18 sample.
Significant departure from HWE was found at Ss142 in thepopulation samples from the central–western and northern–western Adriatic, with a corresponding heterozygote deficiencyin both samples. Micro-Checker provided no indications thatgenotyping errors affected allele scoring (e.g. allele dropouts orstuttering) at any marker in any sample, whereas it identifiednull alleles at locus Ss142. However, departure from HWE
Population structure of Scomber scombrus 391
Downloaded from https://academic.oup.com/icesjms/article-abstract/70/2/387/798183by gueston 28 January 2018
remained significant after correction for null alleles with FreeNA(Chapuis and Estoup, 2007), and samples that failed to amplifywere , 1%, indicating that null homozygotes were notcommon. In addition, no sample failed to amplify at more thanone locus (data not shown), and this makes it unlikely that poorDNA quality affected our results. For these reasons, we maintainedthe uncorrected genotypes of locus Ss142 in our analyses, and wecross-checked differentiation results removing the locus from thedataset when appropriate. Non-significant genotypic disequilib-rium was found after Bonferroni correction for multiple tests.
When investigating the genetic structure of the populations inGSA 17 (therefore excluding the historical sample from the south-ern–western Adriatic in order to exclude any potential bias due tothe wide difference in collection time, i.e. 9 years), the softwareStructure inferred one single population as most likely. Indeed,
no significant values were obtained in all the comparisons involv-ing northern–western, central–western, and central–easternsamples by Fisher’s exact test (p . 0.05) and pairwise FST
(p . 0.05, Table 4). In contrast, both approaches identified aweak but significant difference between the 2010 northern–central Adriatic samples and the sample collected in the south-ern–western Adriatic in 2001, with an average FST of 0.009(p , 0.05) (Table 4). While this comparison does not allow dis-crimination between geographic and temporal variation, itclearly shows that our set of markers is adequate to detectgenetic differentiation, as also demonstrated by statistical powerdetection. In fact, our simulation demonstrated that our markerswould detect a true FST of ≥ 0.005 with a probability approaching100% (Table 5). The a error (when true FST ¼ 0, t ¼ 0) wasconsistently close to 5% in all simulations (data not reported).
Figure 2. Monthly landings of Scomber scombrus in the Italian regions (data from IREPA, 2004–2009). Bars represent standard errors.Data from Abruzzo and Molise were pooled.
392 C. Papetti et al.
Downloaded from https://academic.oup.com/icesjms/article-abstract/70/2/387/798183by gueston 28 January 2018
The data in Tables 4 and 5 were obtained over the entire dataset ofeight loci. Similar conclusions were obtained after removing locusSs142 (data not shown). No differentiation was detected betweenmales and females, among age/size classes and otolith clustersdepicted in Figure 3 (data not reported) either considering or ex-cluding locus Ss142.
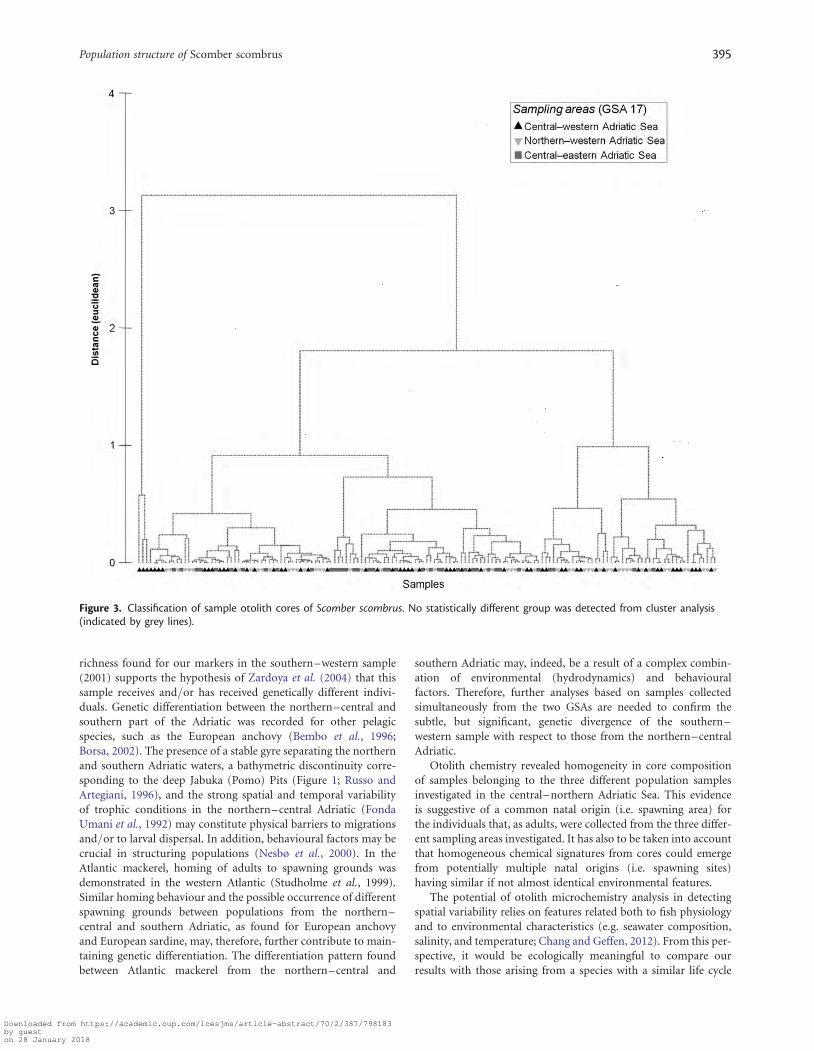
Otolith chemistrySIMPROF on the core samples analysed (Table 1) did not detectstatistically different groups (Figure 3) from cluster analysis.
No significant effect of the covariate “fish size” was detected onthe chemical composition of the otolith margin, suggesting anabsence of temporal variability (due to the fact that specimensof different ages were analysed). The chemical composition ofthe otolith margin was significantly different among the samplingsites (PERMANOVA, pseudo-f : 9.306, p , 0.01). Significantdifferences among otoliths were also found (pseudo-f : 7.651,p , 0.01), suggesting within-site differences among individuals.
The elemental:Ca ratio contributing most to differences amongsampling sites was Sr:Ca (ranging from 62.47% to 98.60% of the
Table 3. Summary of genetic variability for all samples of Scomber scombrus in four sampling sites at eight microsatellite loci, includingallelic richness (AR) based on a minimum sample size of 48 individuals, total number of alleles (TNA), observed (Ho), and expectedheterozygosity (He).
Locus Parameter
Sampling area
TotalNorthern – western Central – western Central– eastern Southern – western
Probabilities of deviation from Hardy–Weinberg equilibrium [p(HWE)] are presented at each locus. Values in bold indicate significant HWE deviations afterBonferroni correction (p , 0.00125).
Population structure of Scomber scombrus 393
Downloaded from https://academic.oup.com/icesjms/article-abstract/70/2/387/798183by gueston 28 January 2018
total dissimilarity in pairwise comparison among sites, SIMPERanalysis); Ba:Ca and Mg:Ca had little influence in determining dif-ferences between groups. The three sampling sites significantly dif-fered for the elemental ratios of Sr:Ca in the otoliths(PERMANOVA p , 0.01) and not for Ba:Ca and Mg:Ca.
Components of variation show that most of the variability isassociated with the factor “otolith” (VC ¼ 0.98, %TV ¼ 46.6,ø ¼ 1.49), while the variability associated with the residuals(VC ¼ 0.65, %TV ¼ 31.1, ø ¼ NA) and with the factor “site”(VC ¼ 0.45, %TV ¼ 21.6, ø ¼ 0.69) was lower. TL had almostno influence on total variation (VC ¼ 0.01, %TV ¼ 0.7, ø ¼ 0.02).
DiscussionMicrosatellite analysis clearly indicated the presence of a singlepanmictic population in the northern–central Adriatic Sea.Moreover, otolith chemistry analysis suggested a common natalorigin for individuals sampled in the three areas of the north-ern–central Adriatic Sea (i.e. GSA 17). These results, togetherwith monthly shifts in fishery landings, suggest that S. scombruscould perform an autumn–winter migration from the northernto the central Adriatic to reach a spawning ground common to dif-ferent stocks in the northern–central Adriatic.
Landings data highlighted a clear north–south trend in the sea-sonality of the Atlantic mackerel catches: the species almost com-pletely disappeared in catches from the northern Italian regionsFriuli Venezia Giulia and Veneto, and displayed a marked reduc-tion in Emilia Romagna in the winter months. In the Marcheregion, the species showed an increase in the winter months,while no clear patterns emerged in the southern region. Thesedata suggest a late autumn migration that follows the
southward–western branch of the cyclonic current in the north-ern–central Adriatic Sea (Russo and Artegiani, 1996). Landingsdata present well-known limits; indeed changes in landing maynot necessarily mirror changes in stock abundance, but mayrather reflect changes in fishing effort or fishing areas (Paulyet al., 1998). However, seasonal variations in catches are quite con-sistent among years and are supported, at least for the northernAdriatic, by the knowledge of local fishers about the movementof the study species. Therefore, these seasonal variations in land-ings are expected to reflect variations in local stock abundance re-liably. Moreover, other pelagic fish species in the Adriatic areknown to perform a similar seasonal migration in the northern–central part, following the main currents, for trophic and repro-ductive needs (Morello and Arneri, 2009).
With regard to population genetics, the simulation approachused revealed a high power of our markers to detect populationsubdivision at FST values as low as 0.0025, well below the thresholdunder which any possibly undetected difference would havelimited ecological and biological relevance (evolutionary popula-tion criterion EV3 , 5 and EV4 , 25 effective migrants per gen-eration; Waples and Gaggiotti, 2006). Thus, the non-significantFST values close to zero found for the northern–central Adriaticgene pool clearly point to an overall panmixia of S. scombrus,which is in line with several findings for marine species collectedat a similar geographical scale in GSA 17, including pelagic[European anchovy (Engraulis encrasicolus), Borsa (2002);European sardine (Sardina pilchardus), Tinti et al. (2002)] and de-mersal fish [common sole (Solea solea), Garoia et al. (2007); redmullet (Mullus barbatus), Maggio et al. (2009); marbled goby(Pomatoschistus marmoratus), Mejri et al. (2011)] as well as thenekton-benthic squids and cuttlefish (Garoia et al., 2004). The oc-currence of a single panmictic population in the northern–centralAdriatic is somewhat expected for the Atlantic mackerel, consider-ing the high dispersal capacity of this species at both the larval andadult stages. In fact, larvae are able to disperse over tens of kilo-metres in just 10 d (Jansen et al., 2012), a time frame representingabout a quarter of the entire larval stage that is reported to last upto 40 d in the northern Atlantic Ocean (Villamor et al., 2004).Moreover, adults are highly migratory and can cover up to1200 km in 13 d (Lockwood, 1988).
In contrast, our microsatellite analysis showed highly signifi-cant values of differentiation when samples collected at the north-ern–central sampling sites were compared with the southernAdriatic sample. This comparison involves samples collected in2010 at the GSA 17 locations and one single “historical” samplecollected in 2001 in the southern part of the Adriatic basin,since, for this location, we were not able to obtain, from commer-cial fishers, new samples with reliable information about the col-lection site.
The presence of population subdivision was demonstrated in S.scombrus, at least at a large geographic scale. In fact, a restriction ingene flow was found between spawning stocks from the easternand western Atlantic by Nesbø et al. (2000), based on mitochon-drial marker variability. At our geographic scale, the differenti-ation between samples from GSA 17 and 18 is, indeed,supported by a previous study (Zardoya et al., 2004) that foundgenetic differentiation comparing samples of S. scombrus fromAncona (July 1997) and Bari (December 2000–January 2001).In that case, Bari was similar to an Aegean sample, and a generalpattern of differentiation along the east–west axis of theMediterranean Sea was reported. The significantly higher allelic
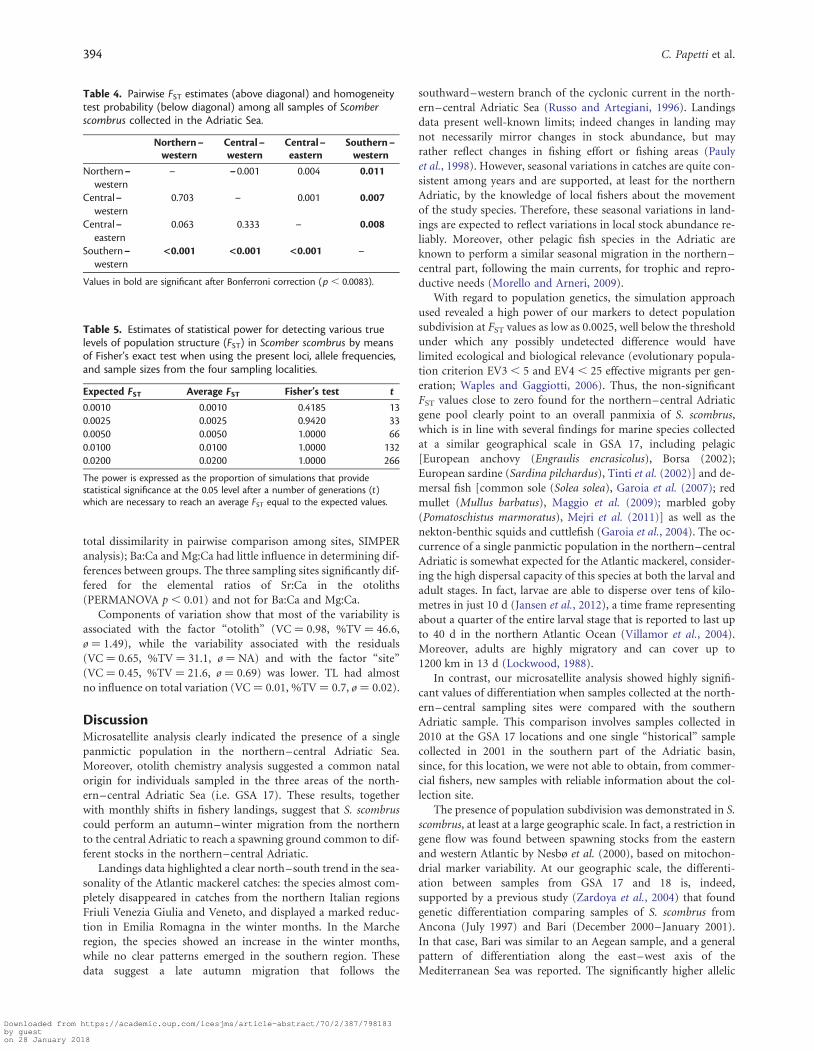
Table 4. Pairwise FST estimates (above diagonal) and homogeneitytest probability (below diagonal) among all samples of Scomberscombrus collected in the Adriatic Sea.
Northern –western
Central –western
Central–eastern
Southern –western
Northern –western
– –0.001 0.004 0.011
Central–western
0.703 – 0.001 0.007
Central–eastern
0.063 0.333 – 0.008
Southern –western
<0.001 <0.001 <0.001 –
Values in bold are significant after Bonferroni correction (p , 0.0083).
Table 5. Estimates of statistical power for detecting various truelevels of population structure (FST) in Scomber scombrus by meansof Fisher’s exact test when using the present loci, allele frequencies,and sample sizes from the four sampling localities.
The power is expressed as the proportion of simulations that providestatistical significance at the 0.05 level after a number of generations (t)which are necessary to reach an average FST equal to the expected values.
394 C. Papetti et al.
Downloaded from https://academic.oup.com/icesjms/article-abstract/70/2/387/798183by gueston 28 January 2018
richness found for our markers in the southern–western sample(2001) supports the hypothesis of Zardoya et al. (2004) that thissample receives and/or has received genetically different indivi-duals. Genetic differentiation between the northern–central andsouthern part of the Adriatic was recorded for other pelagicspecies, such as the European anchovy (Bembo et al., 1996;Borsa, 2002). The presence of a stable gyre separating the northernand southern Adriatic waters, a bathymetric discontinuity corre-sponding to the deep Jabuka (Pomo) Pits (Figure 1; Russo andArtegiani, 1996), and the strong spatial and temporal variabilityof trophic conditions in the northern–central Adriatic (FondaUmani et al., 1992) may constitute physical barriers to migrationsand/or to larval dispersal. In addition, behavioural factors may becrucial in structuring populations (Nesbø et al., 2000). In theAtlantic mackerel, homing of adults to spawning grounds wasdemonstrated in the western Atlantic (Studholme et al., 1999).Similar homing behaviour and the possible occurrence of differentspawning grounds between populations from the northern–central and southern Adriatic, as found for European anchovyand European sardine, may, therefore, further contribute to main-taining genetic differentiation. The differentiation pattern foundbetween Atlantic mackerel from the northern–central and
southern Adriatic may, indeed, be a result of a complex combin-ation of environmental (hydrodynamics) and behaviouralfactors. Therefore, further analyses based on samples collectedsimultaneously from the two GSAs are needed to confirm thesubtle, but significant, genetic divergence of the southern–western sample with respect to those from the northern–centralAdriatic.
Otolith chemistry revealed homogeneity in core compositionof samples belonging to the three different population samplesinvestigated in the central–northern Adriatic Sea. This evidenceis suggestive of a common natal origin (i.e. spawning area) forthe individuals that, as adults, were collected from the three differ-ent sampling areas investigated. It has also to be taken into accountthat homogeneous chemical signatures from cores could emergefrom potentially multiple natal origins (i.e. spawning sites)having similar if not almost identical environmental features.
The potential of otolith microchemistry analysis in detectingspatial variability relies on features related both to fish physiologyand to environmental characteristics (e.g. seawater composition,salinity, and temperature; Chang and Geffen, 2012). From this per-spective, it would be ecologically meaningful to compare ourresults with those arising from a species with a similar life cycle
Figure 3. Classification of sample otolith cores of Scomber scombrus. No statistically different group was detected from cluster analysis(indicated by grey lines).
Population structure of Scomber scombrus 395
Downloaded from https://academic.oup.com/icesjms/article-abstract/70/2/387/798183by gueston 28 January 2018
and inhabiting a geographic area close to the one investigated, but,as far as we know, no studies with these characteristics are avail-able. In the Mediterranean, some examples are available of fishshowing spatial variability in core chemical composition: somerefer to species with a similar life cycle, but coming from otherareas of the Mediterranean [e.g. Tanner et al. (2012) for a studyon European hake (Merluccius merluccius) from the westernMediterranean at a spatial scale comparable with the oneadopted in the present study; and Guidetti et al. (2013) for astudy on anchovy from the Ligurian Sea], and another onearises from species with different life habits, but coming fromthe Adriatic Sea (e.g. Di Franco et al., 2012 focusing on a coastalfish, Diplodus sargus sargus, from the southern Adriatic). This evi-dence supports the hypothesis that the recorded homogeneity incore composition represents a single natal origin for S. scomberin our study area and is not just based on a failure to detect differ-ent natal origins characterized by similar environmental condi-tions. An additional factor supporting a single natal origin isprovided by the high variability in otolith margins recorded, min-imizing the idea of similar environmental features among the sam-pling sites. It has to be stressed that we tested whether otolithchemistry in S. scombrus is able to record environmental hetero-geneity by analysing potential spatial variability in the otolithportion laid down before capture (i.e. the portion of the otolith“influenced” by the environmental condition of the samplingsite), but this assessment of variability reflects divergence inwater chemistry at the time of sampling that does not necessarilyrepresent water conditions at the time the fish were spawned,due to temporal variability in otolith chemistry. Temporal stabilityof the otolith fingerprint can be a major concern for application tonatal origin discrimination and connectivity studies. Studiesdealing with temporal variability in elemental signature are con-troversial, with some identifying significant interannual variabilityand others highlighting non-significant differences or differencesinsufficient to preclude grouping together fish caught in thesame location in different years (for a review, see Chang andGeffen, 2012). Moreover, in the case of a marine species such asAtlantic mackerel, the stability of the open marine environmentcompared with the greater year-to-year variability in, forexample, estuarine or embayment conditions would render theaccounting for temporal variation less critical (Fairclough et al.,2011).
Variability in chemical composition of the otolith marginalportion was mainly induced by variability in Sr:Ca. The incorpor-ation of trace elements into otoliths is a complex process that isstill not completely understood. It is potentially influenced by anumber of factors such as salinity, temperature, water chemistry,physiology, and metabolism (see Green et al., 2009, and referencestherein). Otolith Sr concentration is the result of the interaction ofconcentrations of chemicals in the seawater, temperature, and sal-inity (Chang and Geffen, 2012). As far as we know, no data aboutSr water concentration in the sampled area are available, but clearvariability in temperature and salinity was demonstrated duringthe summer (i.e. the season when samples were collected;Cushman-Roisin et al., 2007), potentially driving the recordeddifference in otolith chemistry.
Our data allow the depiction of a scenario characterized by asingle and common spawning area of Atlantic mackerel in thecentral–northern Adriatic Sea, where adults migrate and convergeat reproduction, a hypothesis supported by the disappearance ofripe males and females from the northern Adriatic during the
breeding season (C. Mazzoldi, unpubl. data) which correspondswell with the hypothesis that individuals disperse after reproduc-tion towards different areas (Sinovcic, 2001; Bottari et al., 2004).Atlantic mackerel eggs have been found in the eastern Adriatic(Hure, 1961) around the area where the European anchovy andEuropean sardine are also known to spawn (Morello and Arneri,2009). This area is characterized by upwelling phenomena(Morello and Arneri, 2009) and could, therefore, constitute a suit-able spawning ground for S. scombrus as well.
ConclusionsOur study points out the presence of a single population ofS. scombrus in the central–northern Adriatic that depends on asingle spawning area. These results, together with evidence of adecline in maximum age (from 8 to 3 years) and size (from 420to 360 mm TL), which occurred in the same area in the last 20years (C. Mazzoldi, unpubl. data), definitively suggest that theAtlantic mackerel stocks are at high risk and should be managedas a single population. Our results regarding S. scombrus popula-tion connectivity, coupled with the knowledge of migration pat-terns and the precise location of the spawning ground, providean ample basis for developing effective management strategies,possibly including a fishing ban during spawning periods in repro-ductive areas to reduce fishing pressure on spawning aggregations.
AcknowledgementsFor sample collection, we thank M. La Mesa and F. Donato(Ancona, 2010), C. Meneghesso and E. Riginella (Chioggia,2010), and S. Greco (Bari, 2001). Many thanks are due toB. Zannato for her support in microsatellite genotyping, andG. De Benedetto and A. Pennetta for their invaluable help in theotolith chemistry analyses. We wish to thank the Editor and twoanonymous reviewers for their constructive criticisms and com-ments that helped in improving the manuscript. This work waspart of the project CLODIA funded by the Veneto Region (Italy)Law 15/2007 (DGR n. 4069).
ReferencesAllison, E. H., Perry, A. L., Badjeck, M. C., Neil Adger, W., Brown, K.,
Conway, D., Halls, A. S., et al. 2009. Vulnerability of nationaleconomies to the impacts of climate change on fisheries. Fishand Fisheries, 10: 173–196.
Amos, W., Hoffman, J. I., Frodsham, A., Zhang, L., Best, S., andHill, A. V. S. 2007. Automated binning of microsatellite alleles: pro-blems and solutions. Molecular Ecology Notes, 7: 10–14.
Azzurro, E., Moschella, P., and Maynou, F. 2011. Tracking signals ofchange in mediterranean fish diversity based on local ecologicalknowledge. PLoS One, 6: e24885.
Barausse, A., Duci, A., Mazzoldi, C., Artioli, Y., and Palmeri, L. 2009.Trophic network model of the Northern Adriatic Sea: analysis of anexploited and eutrophic ecosystem. Estuarine, Coastal and ShelfScience, 83: 577–590.
Belkhir, K., Borsa, P., Chikhi, L., Raufaste, N., and Bonhomme, F.2001. Genetix 4.05, logiciel sous Windows TM pour la genetiquedes populations. Laboratoire Genome, Populations, Interactions,CNRS UMR 5000, Universite de Montpellier II Montpellier(France).
Bembo, D. G., Carvalho, G. R., Cingolani, N., Arneri, E., Giannetti, G.,and Pitcher, T. J. 1996. Allozymic and morphometric evidence fortwo stocks of the European anchovy Engraulis encrasicolus inAdriatic waters. Marine Biology, 126: 529–538.
396 C. Papetti et al.
Downloaded from https://academic.oup.com/icesjms/article-abstract/70/2/387/798183by gueston 28 January 2018
Bonferroni, C. E. 1936 Teoria statistica delle classi e calcolo delle prob-abilita. Pubblicazioni del R Istituto Superiore di ScienzeEconomiche e Commerciali di Firenze, 8, 3–62.
Borsa, P. 2002. Allozyme, mitochondrial-DNA, and morphometricvariability indicate cryptic species of anchovy (Engraulis encrasico-lus). Biological Journal of the Linnean Society, 75: 261–269.
Bottari, T., Rinelli, P., Giordano, D., and Greco, S. 2004. Length–weight relationship and maturity of the Atlantic mackerelScomber scombrus from the Adriatic Sea (eastern Mediterranean).Cahiers De Biologie Marine, 45: 49–53.
Chang, M. Y., and Geffen, A. J. 2012. Taxonomic and geographic influ-ences on fish otolith microchemistry. Fish and Fisheries, in press.
Chapuis, M. P., and Estoup, A. 2007. Microsatellite null alleles and es-timation of population differentiation. Molecular Biology andEvolution 24: 621–631.
Clodia Database. 2012. Database of fishery data from Chioggia,Northern Adriatic Sea. http://chioggia.scienze.unipd.it/DB/database_landing.html/ (last accessed December 2011).
Cushman-Roisin, B., Korotenko, K. A., Galos, C. E., and Dietrich,D. E. 2007. Simulation and characterization of the Adriatic Seamesoscale variability. Journal of Geophysical Research, 112:C03S14.
Di Franco, A., De Benedetto, G., De Rinaldis, G., Raventos, N.,Sahyoun, R., and Guidetti, P. 2011. Large scale-variability inotolith microstructure and microchemistry: the case study ofDiplodus sargus sargus (Pisces: Sparidae) in the MediterraneanSea. Italian Journal of Zoology, 78: 182–192.
Di Franco, A., Gillanders, B. M., De Benedetto, G., Pennetta, A., DeLeo, G. A., and Guidetti, P. 2012. Dispersal patterns of coastalfish: implications for designing networks of marine protectedareas. PLoS One, 7: e31681.
Estoup, A., and Angers, B. 1998 Microsatellites and minisatellitesfor molecular ecology: theoretical and empirical considerations.In Advances in Molecular Ecology, pp. 55–86. Ed. byG. Carvalho. IOS Press, Amsterdam.
Excoffier, L., and Lischer, H. E. L. 2010. Arlequin suite ver 3.5: a newseries of programs to perform population genetics analyses underLinux and Windows. Molecular Ecology Resources, 10: 564–567.
Fairclough, D. V., Edmonds, J., Lenanton, R. C. J., Jackson, G., Keay, I.,Crisafulli, B., and Newman, S. 2011 Rapid and cost-effective assess-ment of connectivity among assemblages of Choerodon rubescens(Labridae) using ablation inductively coupled plasma mass spec-trometry of sagittal otoliths. Journal of Experimental MarineBiology and Ecology, 403: 46–53.
Fonda Umani, S., Franco, P., Ghirardelli, E., and Malej, A. 1992.Outline of oceanography and the plankton of the Adriatic Sea.In Marine Eutrophication and Population Dynamics. Proceed-ings of 25th European Marine Biology Symposium, pp. 347–365.Ed. by G. Colombo, I. Ferrari, V. U. Ceccherelli, and R. Rossi.Olsen and Olsen, Fredensborg, Denmark. 395 pp.
Froese, R., and Pauly, D. 2012. FishBase. www.fishbase.org (lastaccessed June 2012).
Garoia, F., Guarniero, I., Grifoni, D., Marzola, S., and Tinti, F. 2007.Comparative analysis of AFLPs and SSRs efficiency in resolvingpopulation genetic structure of Mediterranean Solea vulgaris.Molecular Ecology, 16: 1377–1387.
Garoia, F., Guarniero, I., Ramsak, A., Ungaro, N., Landi, M.,Piccinetti, C., Mannini, P., et al. 2004. Microsatellite DNA variationreveals high gene flow and panmictic populations in the Adriaticshared stocks of the European squid and cuttlefish (Cephalopoda).Heredity, 93: 166–174.
Goudet, J. 1995. Fstat (Version 1.2): a computer program to calculateF-statistics. Journal of Heredity, 86: 485–486.
Gray, C. A., Rotherham, D., Chapman, M. G., Underwood, A. J., andJohnson, D. D. 2009. Spatial scales of variation of assemblages offish in coastal lakes sampled with multi-mesh gillnets: implicationsfor designing research surveys. Fisheries Research, 96: 58–63.
Green, B. S., Mapstone, B., Carlos, G., and Begg, G. A. 2009. TropicalFish Otoliths: Information for Assessment, Management andEcology. Springer, New York. 314 pp.
Guidetti, P., Petrillo, M., De Benedetto, G., and Albertelli, G. 2013. Theuse of otolith microchemistry to investigate spawning patterns ofEuropean anchovy: a case study in the eastern Ligurian Sea (NWMediterranean). Fisheries Research, 139: 1–4.
Hauser, L., and Carvalho, G. R. 2008. Paradigm shifts in marine fish-eries genetics: ugly hypotheses slain by beautiful facts. Fish andFisheries, 9: 333–362.
Hauser, L., and Seeb, J. E. 2008. Advances in molecular technology andtheir impact on fisheries genetics. Fish and Fisheries, 9: 473–486.
Hure, J. 1961. Contribution a la connaisance de la ponte de la sardineet du maquereau au large de l’Adriatique. Proceedings of GeneralFisheries Council for the Mediterranean, 6: 107–110.
IREPA. 2004–2009. Osservatorio Economico sulle StruttureProduttive della Pesca Marittima in Italia, 2004–2009. EdizioniScientifiche Italiane, Napoli.
IREPA. 2011. Osservatorio Economico sulle Strutture Produttive dellaPesca Marittima in Italia, 2010. Edizioni Scientifiche Italiane,Napoli.
Jansen, T., Kristensen, K., Payne, M., Edwards, M., Schrum, C., andPitois, S. 2012. Long-term retrospective analysis of mackerelspawning in the North Sea: a new time series and modeling ap-proach to CPR data. PLoS One, 7: e38758.
Jennings, S., Pinnegar, J. K., Polunin, N. V. C., and Boon, T. W. 2001.Weak cross-species relationships between body size and trophiclevel belie powerful size-based trophic structuring in fish commu-nities. Journal of Animal Ecology, 70: 934–944.
Lockwood, S. J. 1988. The Mackerel, its Biology, Assessment and theManagement of a Fishery. Fishing News Books, Farnham, UK.184 pp.
Maggio, T., Lo Brutto, S., Garoia, F., Tinti, F., and Arculeo, M. 2009.Microsatellite analysis of red mullet Mullus barbatus(Perciformes, Mullidae) reveals the isolation of the Adriatic Basinin the Mediterranean Sea. ICES Journal of Marine Science, 66:1883–1891.
Mejri, R., Arculeo, M., Hassine, O. K. B., and Lo Brutto, S. 2011.Genetic architecture of the marbled goby Pomatoschistus marmor-atus (Perciformes, Gobiidae) in the Mediterranean Sea. MolecularPhylogenetics and Evolution, 58: 395–403.
Miller, J. A., and Shanks, A. L. 2004. Evidence for limited larval disper-sal in black rockfish (Sebastes melanops): implications for popula-tion structure and marine-reserve design. Canadian Journal ofFisheries and Aquatic Sciences, 61: 1723–1735.
Miller, R. G. 1981 Simultaneous Statistical Inference, 2nd edn.Springer, New York. 299 pp.
Molecular Ecology Resources Primer Development Consortium,Arias, M. C., Arnoux, E., Bell, J. J., Bernadou, A., Bino, G.,Blatrix, R., et al. 2012. Permanent Genetic Resources added toMolecular Ecology Resources Database 1 December 2011–31January 2012. Molecular Ecology Resources, 12: 570–572.
Morello, E. B., and Arneri, E. 2009. Anchovy and sardine in theAdriatic Sea—an ecological review. Oceanography and MarineBiology: An Annual Review, 47: 209–256.
Nesbø, C. L., Rueness, E. K., Iversen, S. A., Skagen, D. W., andJakobsen, K. S. 2000. Phylogeography and population history ofAtlantic mackerel (Scomber scombrus L.): a genealogical approachreveals genetic structuring among the eastern Atlantic stocks.Proceedings of the Royal Society B: Biological Sciences, 267:281–292.
Ohta, T., and Kimura, M. 1973. A model of mutation appropriate toestimate the number of electrophoretically detectable alleles in afinite population. Genetical Research, 22: 201–204.
Patwary, M. U., Kenchington, E. L., Bird, C. J., and Zouros, E. 1994.The use of random amplified polymorphic DNA markers in
Population structure of Scomber scombrus 397
Downloaded from https://academic.oup.com/icesjms/article-abstract/70/2/387/798183by gueston 28 January 2018
genetic studies of the sea scallop Placopecten magellanicus (Gmelin,1791). Journal of Shellfish Research, 13: 547–553.
Pauly, D., Christensen, V., Dalsgaard, J., Froese, R., and Torres, F., Jr.1998. Fishing down marine food webs. Science, 279: 860–863.
Pritchard, J. K., Stephens, M., and Donnelly, P. 2000. Inference ofpopulation structure using multilocus genotype data. Genetics,155: 945–959.
Punzon, A., and Villamor, B. 2009. Does the timing of the spawningmigration change for the southern component of the north-eastAtlantic Mackerel (Scomber scombrus, L. 1758)? An approximationusing fishery analyses. Continental Shelf Research, 29: 1195–1204.
Raymond, M., and Rousset, F. 1995. Genepop (version 1.2): popula-tion genetics software for exact tests and ecumenicism. Journal ofHeredity, 86: 248–249.
Reid, D. G., Turrell, W. R., Walsh, M., and Corten, A. 1997. Cross-shelfprocesses north of Scotland in relation to the southerly migrationof Western mackerel. ICES Journal of Marine Science, 54:168–178.
Rose, G. A., Nelson, R. J., and Mello, L. G. S. 2011. Isolation or meta-population: whence and whither the Smith Sound cod? CanadianJournal of Fisheries and Aquatic Sciences, 68: 152–169.
Russo, A., and Artegiani, A. 1996. Adriatic Sea hydrography. ScientiaMarina, 60: 33–43.
Ryman, N., and Palm, S. 2006. Powsim: a computer program for asses-sing statistical power when testing for genetic differentiation.Molecular Ecology Notes, 6: 600–602.
Sinovcic, G. 2001. Population structure, reproduction, age and growthof Atlantic mackerel, Scomber scombrus L. in the Adriatic Sea. ActaAdriatica, 42: 85–92.
Studholme, A. L., Packer, D. B., Berrien, P. L., Johnson, D. L.,Zetlin, C. A., and Morse, W. W. 1999. Essential fish habitatsource document: Atlantic mackerel, Scomber scombrus, lifehistory and habitat characteristics. NOAA Technical Memoran-dum NMFS-NE-141. 35 pp.
Tanner, S. E., Vasconcelos, R. P., Cabral, H. N., and Thorrold, S. R.2012. Testing an otolith geochemistry approach to determine
population structure and movements of European hake in thenortheast Atlantic Ocean and Mediterranean Sea. FisheriesResearch, 125–126: 198–205.
Tinti, F., Di Nunno, C., Guarniero, I., Talenti, M., Tommasini, S.,Fabbri, E., and Piccinetti, C. 2002. Mitochondrial DNA sequencevariation suggests the lack of genetic heterogeneity in theAdriatic and Ionian stocks of Sardina pilchardus. MarineBiotechnology, 4: 163–172.
Uriarte, A., and Lucio, P. 2001. Migration of adult mackerel along theAtlantic European shelf edge from a tagging experiment in thesouth of the Bay of Biscay in 1994. Fisheries Research, 50: 129–139.
van Oosterhout, C., Hutchinson, W. F., Wills, D. P. M., and Shipley, P.2004. Micro-Checker: software for identifying and correcting geno-typing errors in microsatellite data. Molecular Ecology Notes, 4:535–538.
Villamor, B., Bernal, M., and Hernandez, C. 2004. Models describingmackerel (Scomber scombrus) early life growth in the north andnorthwest of the Iberian Peninsula in 2000. Scientia Marina, 68:571–583.
Walsh, M., Reid, D. G., and Turrell, W. R. 1995. Understanding mack-erel migration off Scotland: tracking with echosounders and com-mercial data, and including environmental correlates andbehaviour. ICES Journal of Marine Science, 52: 925–939.
Waples, R. S., and Gaggiotti, O. 2006. What is a population? An em-pirical evaluation of some genetic methods for identifying thenumber of gene pools and their degree of connectivity.Molecular Ecology, 15: 1419–1439.
Ying, Y., Chen, Y., Lin, L., and Gao, T. 2011. Risks of ignoring fishpopulation spatial structure in fisheries management. CanadianJournal of Fisheries and Aquatic Sciences, 68: 2101–2120.
Zardoya, R., Castilho, R., Grande, C., Favre-Krey, L., Caetano, S.,Marcato, S., Krey, G., et al. 2004. Differential population structur-ing of two closely related fish species, the mackerel (Scomber scom-brus) and the chub mackerel (Scomber japonicus), in theMediterranean Sea. Molecular Ecology, 13: 1785–1798.
Handling editor: Emory Anderson
398 C. Papetti et al.
Downloaded from https://academic.oup.com/icesjms/article-abstract/70/2/387/798183by gueston 28 January 2018