+ All Categories
Home > Documents > ices tepaper 2015 - harriswilliams.com banking services are provided by Harris Williams LLC, ... IPS...

ices tepaper 2015 - harriswilliams.com banking services are provided by Harris Williams LLC, ... IPS...

Date post: 29-Mar-2018
Category:
Upload: hanguyet
View: 217 times
Download: 4 times
Share this document with a friend
27
Infrastructure Services HW&Co. Whitepaper December 2015 Investment banking services are provided by Harris Williams LLC, a registered broker-dealer and member of FINRA and SIPC, and Harris Williams & Co. Ltd, which is authorised and regulated by the Financial Conduct Authority. Harris Williams & Co. is a trade name under which Harris Williams LLC and Harris Williams & Co. Ltd conduct business. www.harriswilliams.com
Transcript

Infr

ast

ruct

ure

Serv

ices

HW

&C

o. W

hit

epap

er

Dece

mb

er

2015

Investment banking services are provided by Harris Williams LLC, a registered broker-dealer and member of FINRA and SIPC,and Harris Williams & Co. Ltd, which is authorised and regulated by the Financial Conduct Authority. Harris Williams & Co. isa trade name under which Harris Williams LLC and Harris Williams & Co. Ltd conduct business.

www.harriswilliams.com

Harris Williams & Co. Infrastructure Services | December 2015

Our mission with this paper is to provide an overview of the U.S. industrial service

market for energy and power infrastructure. Outsourced industrial service providers

support critical operations across upstream, midstream, downstream, power

generation, and a wide range of additional process industries.

While the upstream market continues to face headwinds, North America is in the

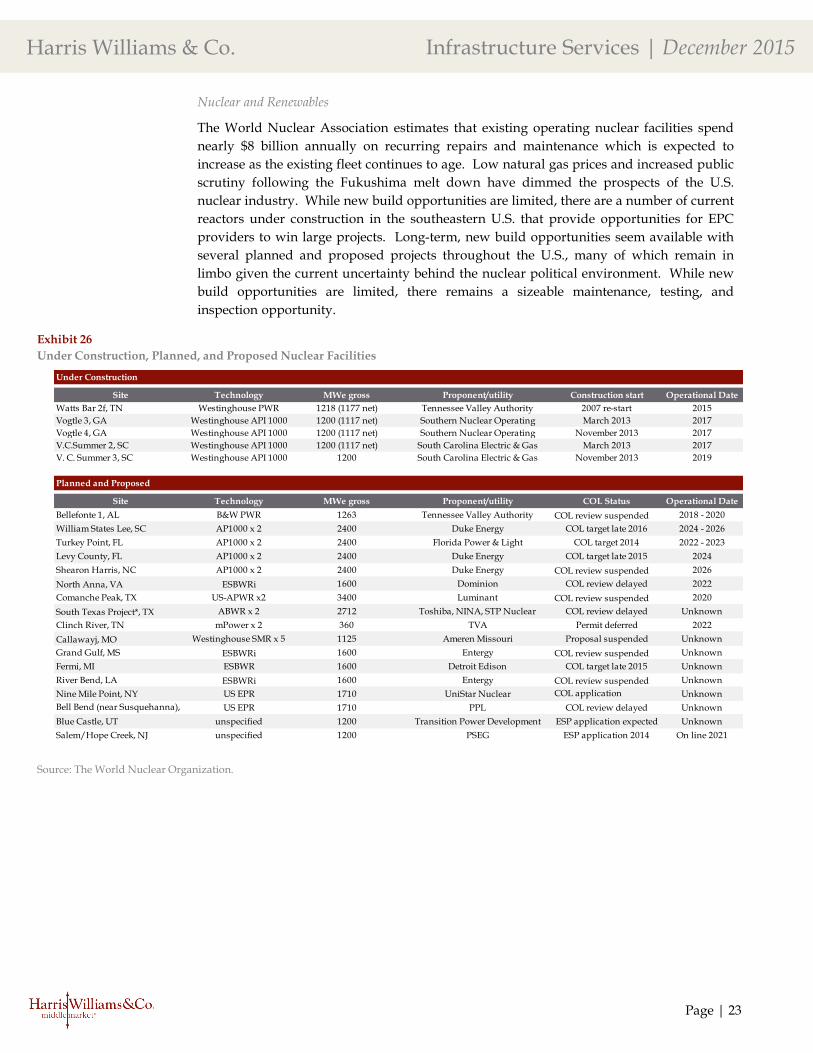
early stages of a prolonged investment cycle to expand the installed base of

processing equipment, and upgrade and repair aging infrastructure. Sector

investment is supported by a number of long-term, structural tailwinds. Providers of

outsourced industrial services are poised to benefit from this substantial market

opportunity.

Infrastructure ServicesIndustrial Services for Energy and Power InfrastructureHarris Williams & Co. WhitepaperDecember 2015

CONTENTS

Abstract

HW&Co. Infrastructure Services Experience

Industrial Services Overview

Industrial Services in Today’s Commodity Environment

Positive Domestic Refinery Market Outlook

Sustained Petrochemical and Chemical Growth

Rise of Domestic LNG Export Facilities

Strong Domestic Power Generation Fundamentals

ENERGY, POWER & INFRASTRUCTURE CONTACTSUnited States

Andrew Spitzer | Managing Director

[email protected]

+1(804) 915-0174

Brian Lucas | Managing Director

[email protected]

+1(804) 932-1323

Matt White | Director

[email protected]

+1(804) 915-0131

Luke Semple | Director

[email protected]

+1(804) 915-0158

Chris Burnham | Vice President

[email protected]

+1(804) 915-0142

Ian Thomas | Vice President

[email protected]

+1(804) 932-1384

Europe

Jeffery Perkins | Managing Director

[email protected]

+49 69 7593 7166

Harris Williams & Co. Infrastructure Services | December 2015

Harris Williams & Co. Select TransactionsInfrastructure Services

With more than 35 closed transactions across the sector, Harris Williams & Co. has

provided sell-side advisory services to some of the infrastructure service market’s premier

service providers.

Harris Williams & Co. Infrastructure Services Experience

a portfolio company of

has been acquired by

a portfolio company of

has been acquired by

has been acquired by

a portfolio company of

has been acquired by

has been acquired by

a portfolio company ofa portfolio company of

has been acquired by

a portfolio company of

has been acquired by

a portfolio company of

has been acquired by

a portfolio company of

has been acquired by

a portfolio company of

has been acquired by

has been acquired by

a portfolio company of

a portfolio company of

a portfolio company of

has been acquired by

The Sterling Group

a portfolio company of

has been acquired by

a portfolio company of

has been acquired by

has been acquired by

has been acquired by

a portfolio company of

a portfolio company of

has been acquired by

a portfolio company of

has been acquired by

a portfolio company of

has been acquired by

a portfolio company of

has been acquired by

a portfolio company of

has been acquired by

a portfolio company of

has been acquired by

a portfolio company of

has been acquired by

a portfolio company of

has been acquired by

has been acquired by

a portfolio company of

has been acquired by

Tanglewood Investments, Inc.

a portfolio company of

has been acquired by

a portfolio company of

has been acquired by

a portfolio company of

has been acquired by

a portfolio company of

has been acquired by

Harris Williams & Co. Infrastructure Services | December 2015

Page | 1

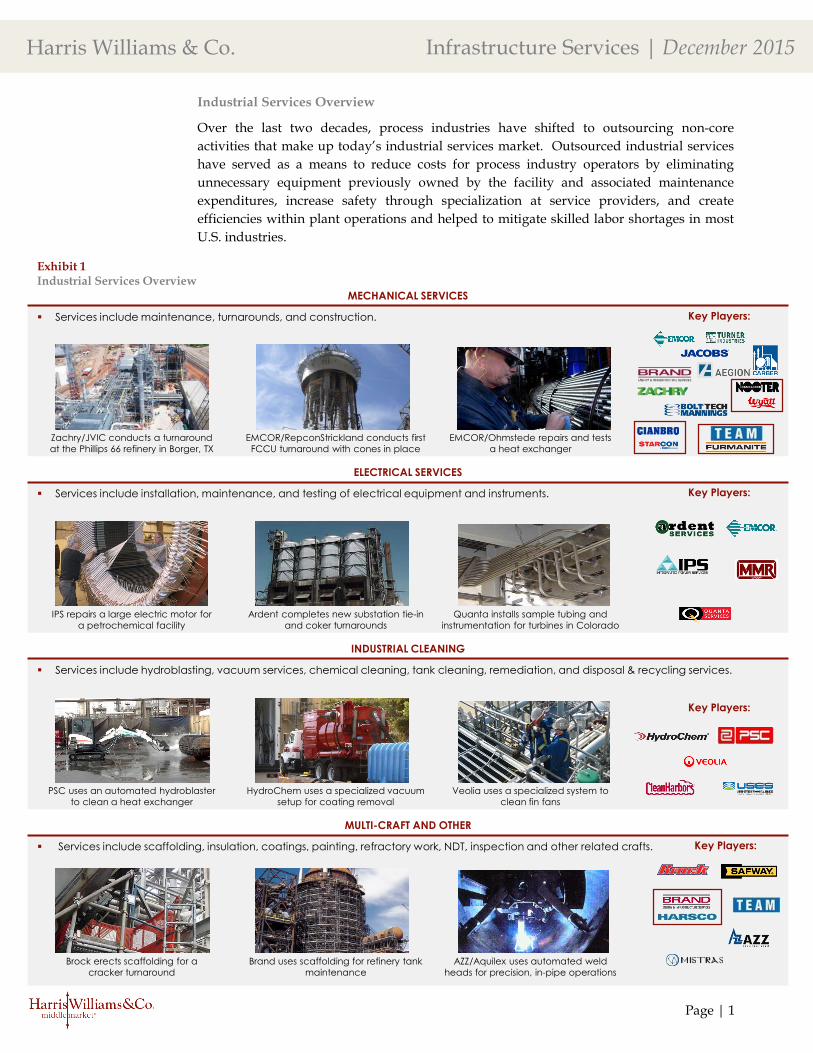
Over the last two decades, process industries have shifted to outsourcing non-core

activities that make up today’s industrial services market. Outsourced industrial services

have served as a means to reduce costs for process industry operators by eliminating

unnecessary equipment previously owned by the facility and associated maintenance

expenditures, increase safety through specialization at service providers, and create

efficiencies within plant operations and helped to mitigate skilled labor shortages in most

U.S. industries.

Industrial Services Overview

Exhibit 1Industrial Services Overview

MECHANICAL SERVICES

Services include maintenance, turnarounds, and construction.

Zachry/JVIC conducts a turnaround

at the Phillips 66 refinery in Borger, TX

EMCOR/RepconStrickland conducts first

FCCU turnaround with cones in place

EMCOR/Ohmstede repairs and tests

a heat exchanger

Key Players:

ELECTRICAL SERVICES

Services include installation, maintenance, and testing of electrical equipment and instruments.

IPS repairs a large electric motor for

a petrochemical facility

Ardent completes new substation tie-in

and coker turnarounds

Quanta installs sample tubing and

instrumentation for turbines in Colorado

Key Players:

INDUSTRIAL CLEANING

Services include hydroblasting, vacuum services, chemical cleaning, tank cleaning, remediation, and disposal & recycling services.

PSC uses an automated hydroblaster

to clean a heat exchanger

HydroChem uses a specialized vacuum

setup for coating removal

Veolia uses a specialized system to

clean fin fans

Key Players:

MULTI-CRAFT AND OTHER

Services include scaffolding, insulation, coatings, painting, refractory work, NDT, inspection and other related crafts.

Brock erects scaffolding for a

cracker turnaround

Brand uses scaffolding for refinery tank

maintenance

AZZ/Aquilex uses automated weld

heads for precision, in-pipe operations

Key Players:

Harris Williams & Co. Infrastructure Services | December 2015

Page | 2

Mechanical services include engineering, constructability, and planning services for

routine maintenance, plant turnarounds, expansions, and new construction. Routine

maintenance services consist of field machining, bolting/torqueing, and duct work, among

others, and are performed by employees of mechanical services companies that reside in or

are embedded in a customer’s facility. These services serve as a stable base of work on a

daily and weekly basis, are typically performed on time and materials agreements, and

often carry a lower margin than turnaround maintenance and expansion work.

Planned turnarounds (in refineries and petrochemical facilities) or outages (in power

plants) consist of scheduled, large-scale maintenance activities wherein an entire process

unit is taken off-line for comprehensive maintenance, revamp, and renewal. While

industry-specific terminology varies, the fall and spring seasons are the traditional

turnaround seasons when lower demand justifies equipment being taken off-line

temporarily as opposed to summer and winter seasons where facilities run 24 hours a day,

seven days a week. These regularly scheduled plant turnarounds are necessary to

minimize unexpected repairs and downtime of critical process equipment that can occur

with equipment failure. While the frequency of turnarounds can vary by facility type,

equipment age, and operator, a typical plant schedules turnarounds every two to five

years. However, it is not unusual for a plant operator to stage turnaround activities by

processing unit or type of equipment, so as to avoid having the entire facility shutdown at

one time, which results in a consistent flow of work for mechanical service providers.

During a turnaround, mechanical service firms flex their employee base at the site, which

can exceed 500 people for a large turnaround. Similar to routine maintenance, these

services are often performed on a time and materials basis, but command higher margins

due to added complexity and the timeliness in which work must be performed to limit

plant downtime.

Mechanical Services

Exhibit 2

Service Categories

Routine Maintenance Project Maintenance Capital Projects

Daily / weekly maintenanceoperations performed byembedded outsourced serviceproviders

Medium and large scalemaintenance operations thatoften require equipment to betemporarily taken offline every 1– 3 years

Upgrades, expansions, newconstruction, and capitalprojects scheduled on an as-needed basis

Outsourced services performed by industrial services providers can be sub-divided into

three categories that vary in scope and frequency.

Services Categories

Description

Time & Materials (“T&M”) T&M / Lump Sum Lump SumTypical

Structure

Low Medium HighMargins &

Perceived Risk

Harris Williams & Co. Infrastructure Services | December 2015

Page | 3

Electrical contractors within the industrial services sector provide engineering and

construction, fabrication, installation, and maintenance services to electrical systems and

equipment. These services typically encompass a wide array of maintenance services and

capital projects to numerous end markets, including electrical systems for refinery capacity

expansions, new petrochemical plants and expansions, LNG export facilities, oilfield

electrification, offshore oil and gas rigs and platforms, power generation facilities,

renewable energy resources, and many other process facilities in related markets. Electrical

systems in these facilities require significant ongoing maintenance to control, lighting, and

power systems and must be performed by specialized contractors to ensure the safe and

efficient operation of facilities.

Electrical Services

Exhibit 3

Mechanical Services

Key Services Description Key Players

Routine Maintenance

Smaller scale, regularly scheduled maintenanceperformed by resident outsourced service providersenergy infrastructure equipment throughout acontinuous process facility.

Turnarounds & Revamps

Planned, periodic shut down (total or partial) of aprocess unit or plant to perform maintenance, overhauland repair operations, and to inspect, test, and replaceprocess materials and equipment.

Facility Design & Construction

Services focus on constructability and maintainability offacilities and operations across process industries andother industrial and commercial applications.

Piping and Plumbing

Provide piping and plumbing system installation andintegration in addition to welding services associatedwith construction and maintenance.

HVAC Full service design, construction, and ongoing

maintenance of heating, ventilation, and air conditioningsystems.

Other Services Include cold cutting, isolation of lines and pipes for hot-

work, hydrotesting services on welding and bolts, andhot tapping and line stop services.

In addition to turnarounds, mechanical service providers specialize in facility construction

and expansion, which occurs when a facility needs to upgrade a unit or expand its

capacity. This work is often contracted in a lump sum structure that can introduce

execution risk for the service provider, but experienced firms often mitigate these risks

through effective planning and estimating, and can reap higher margins as a result. The

mechanical services market is dominated by large, national providers and is in the midst of

an ongoing consolidation trend as privately-held businesses begin to explore transition

opportunities.

Harris Williams & Co. Infrastructure Services | December 2015

Page | 4

The electrical services market is highly-fragmented with several large contractors gaining

scale and market share through the acquisition of smaller regional or “mom and pop”

operations across the country. Large industry participants include Quanta Services,

Ardent Services, EMCOR Group, and MMR Group, and several smaller providers with a

nationwide presence, diverse end market exposure, wide service offerings, and skilled

labor pools.

Unit Substation acts as an electrical control center in an industrial facility.

Substation is connected to electrical control systems.

Cable trays take cable from the substation to process unit.

Conduit duct banks connect to process unit.

Conduit and cable connect to control stations, lighting, electric motors, etc.

1 2 3 4 5

Exhibit 4

Sample Electrical Instrumentation Process FlowTypical Electric Systems Flow in an Industrial Process Facility

Exhibit 5

Electrical Services

Key Services Description Key Players

Electrical and Instrumentation(“E&I”) Systems Installation and Repair

Typically ongoing, daily maintenance services including repair,upgrades, and installation services for electrical infrastructurewithin process facilities, including conduit trays, other associatedcable trays, switchgear repair, calibration services, among others.

Electrical Systems Design

Computer modeling and engineering planning to design theproper locations of electrical systems and components around afacility.

Electrical Systems Inspection and Testing Services

Inspection and testing services that ensure equipment andsystems function properly at anticipated capacities without riskto other systems.

Substation Repair and Construction

Repair and construction services for electrical substations, whichtransform voltage along T&D systems from high to low, or viceversa, to control the transportation of electricity.

Unit Substation acts as an electrical control center in an industrial facility.

Substation is connected to electrical control systems.

Cable trays take cable from the substation to process unit.

Conduit duct banks connect to process unit.

Conduit and cable connect to control stations, lighting, electric motors, etc.

1 2 3 4 5

Unit substation act as as an

electrical control center in an

industrial facility.

Substation connected to

electrical control systems.

Cable trays take cable from

the substation to process

unit.

Conduit duct banks connect

to process unit.

Conduit and cable connect

to control stations, lighting,

electric motors, etc.

Harris Williams & Co. Infrastructure Services | December 2015

Page | 5

The industrial cleaning market’s core services include hydroblasting, industrial

vacuuming, chemical cleaning, and tank cleaning, among other specialty services, which

are necessary to improve or sustain the operating efficiencies and extend the useful lives of

process equipment and facilities through routine daily maintenance and turnaround

programs. Hydroblasting and industrial vacuum services represent the two largest

segments of the cleaning market and have seen substantial technological development

over the last five years, including increased automation and engineered safety systems.

For example, in an effort to create a safer environment and capitalize on increased

efficiency, speed, and quality, many service providers are moving to automate

hydroblasting services, which minimizes risk to employees and helps shorten cleaning

projects.

Industrial cleaning companies typically provide services to a wide range of process

industries, including hydrocarbon processing (petrochemical and refining), the electric

utility industry, and upstream oil and gas industry, among others. The industrial cleaning

market is highly fragmented with a few large, national providers comprising a large

portion of the market, while smaller regional and local companies make up the broadest

segment of the landscape. Industrial cleaning providers typically perform ongoing daily

maintenance within a facility, utility territory, or oil and gas field, as well as large-scale

projects such as turnarounds. Given the larger role these outsourced service providers

have taken, maintenance is no longer simply a necessary expense, but rather a strategic

contributor to the plant’s productivity. This has driven greater use of outsourced

maintenance and cleaning services to handle the more significant environmental, safety,

and reliability requirements of complex plants and infrastructure. Further, cost-cutting at

large process facilities has focused on supply chain management as a tool to consolidate

vendors, which will continue to favor the larger providers that have the requisite ability to

offer bundled services, a nationwide footprint, and leading safety and training programs.

Industrial Cleaning

Exhibit 6Industrial Cleaning

Key Services Description Key Players

Hydroblasting High-pressure, sometimes automated, water washing of

interior and exterior surfaces, process configurations,heat exchangers, and other vessels.

Industrial Vacuuming

Liquid vacuum services consist of the removal andtransportation of various liquids, while air movingvacuum services include a wide range of materials fromfine powder to concrete.

Chemical Cleaning The cleaning of equipment using chemical mixtures to

loosen, dissolve, and remove materials from equipment.

Tank Cleaning Cleaning of storage tanks to allow inspection and

maintenance activities and the removal of hazardousmaterials from inside the structure.

Harris Williams & Co. Infrastructure Services | December 2015

Page | 6

Multi-Craft and Other Trades

Multi-craft services address a wide range of service specialties for energy infrastructure.

These services are involved in the majority of maintenance and capital projects on-site and

are traditionally contracted to both large national players and a vast network of regional

firms with smaller service offerings. Multi-craft services include scaffolding, refractory,

crane / heavy haul, specialty welding, testing & inspection, painting, blasting, insulation,

and fireproofing, among others.

Scaffolding

Industrial facilities use scaffolding systems that provide closer access torepair equipment and perform routine maintenance activities, unplannedrepairs, and major pre-planned turnaround projects.

Larger scaffolding projects involve engineering designs to comply withOSHA standards and require qualified personnel with expertise inscaffolding assembly in harsh and dangerous environments and facilities.

Erecting and dismantling industrial scaffolding typically requiresconsiderably more technical expertise than commercial scaffolding.

Refractory

Refractory contractors provide installation and maintenance services across awide variety of processing industries and traditional materials includecastables, brick, mortar, refractory anchors and plastics, grouting, and other,usually nonmetallic, natural and synthetic materials.

Refractory products are exposed to temperatures of up to 2,000 degreesCelsius and require regular maintenance in today’s high utilizationenvironment across process industries.

Crane / Heavy Haul

Industrial crane / heavy haul services providers serve the refining,petrochemical, power, and oil & gas markets, among many other industrialand commercial markets.

Crane services are typically billed for on-site time on daily or hourly ratesand are used for large capital projects (turnarounds) and on a recurring basiswith ongoing maintenance and repair operations.

Equipment types include gantry lifts, boom truck cranes, rough terraincranes, all terrain cranes, and crawler cranes, among others.

Specialty Welding

Welding services are an integral part of turnaround and maintenanceservices at refineries, petrochemical plants, and power plants.

These services require highly-skilled labor forces to perform quality weldingservices on everything from revamps and upgrades of piping systems toheavy wall pressure vessels, exchangers, and tower services.

Testing & Inspection

Testing services encompass a wide variety of solutions to ensure processindustry code and specification compliance.

Services include visual inspection liquid penetrant, magnetic particle,radiographic, ultrasonic, and acoustic emissions tests.

Advances in testing technologies have allowed for more advancedtechniques such as eddy current inspections for crack detection andconductivity measurements, digital radiography for live inspections ofpiping systems, and automated ultrasonic systems for scanning duringturnarounds and maintenance.

Other Services Specialty painting and blasting. Insulation and fireproofing.

Exhibit 7Other Trades

Representative Other Trades Key Players

Harris Williams & Co. Infrastructure Services | December 2015

Page | 7

While the oil price turmoil has severely impacted the North American upstream market,

midstream and downstream markets have fared better though not without greater near-

term uncertainty. However, with billions of planned, announced, and committed capital

for energy infrastructure projects in the coming years, North America remains in the early

stages of a significant downstream energy infrastructure build out. Much of this

infrastructure is supported by the significant increase in North American natural gas

production (and concurrent price declines), which has increased North American global

cost competitiveness in petrochemical markets.

While the market has changed dramatically over the last 12 months, we continue to watch

it closely. In conjunction with the precipitous decline in oil prices, natural gas prices have

remained stable, albeit at a low historical level. Many analysts expect natural gas prices to

benefit from the current oil environment if production falls and the associated gas supply

weakens from the loss of production. As a result, there are a number of trends we are

watching closely as 2015 concludes.

Industrial Services in Today's Commodity Environment

Exhibit 8

Current Commodity Price Environment and Near-Term Impact to Industrial Service Providers

West Texas Intermediate and Henry Hub Gas Prices Key Near-Term Indicators

Source: EIA

Refinery

Refinery capacity utilization Crack spreads and refiner margins Petroleum products imports /

exports Workforce dynamics (e.g. United

Steelworkers strike)

Petrochemical Natural gas prices Global ethylene demand and cost

curve dynamics

Midstream

Ongoing projects (large and smalldiameter)

Political climate Throughput rates MLP activity, guidance, and

dividend health

Upstream

Global hydrocarbon demand andconsumption

Capital markets liquidity andavailability

E&P capex guidance Commodity environment Regulatory requirements and

changes to oil export ban Geo-political climate U.S. land purchases / leases / well

permits

$0

$1

$2

$3

$4

$5

$6

$7

$8

$9

$0

$20

$40

$60

$80

$100

$120

Jan

-14

Mar

-14

May

-14

Jul-

14

Sep

-14

No

v-14

Jan

-15

Mar

-15

May

-15

Jul-

15

Sep

-15

No

v-15

Hen

ery

Hu

b ($

/Mcf)

WT

I ($

/ B

bl)

WTI Henry Hub

Harris Williams & Co. Infrastructure Services | December 2015

Page | 8

In recent years, technological advancements have enabled producers to successfully

develop previously uneconomic hydrocarbon resources throughout the U.S. Oil producing

regions such as the Bakken Shale in North Dakota and the Eagle Ford Shale and Permian

Basin in Texas have greatly contributed to a revival of U.S. oil production, which has

spurred a renaissance in the domestic upstream, midstream, and downstream markets.

Due to the rapid development of shale oil resources, U.S. oil production rose in each of the

last five years after more than 20 years of decline. While oil from unconventional resources

represented approximately 15% of U.S. production in 2010, the EIA estimates that

currently identified unconventional oil plays could add output of nearly three million

barrels per day, boosting U.S. production beyond Saudi Arabia by 2020.

The resurgence in domestic production has resulted in a revival of the energy

infrastructure industry and spurred increased budgets to upgrade existing infrastructure

for lighter crude that comes from unconventional resources. In the refinery market,

domestic production increases have enabled many refiners to purchase crude at large

discounts to international benchmark prices providing a sharp cost advantage. Based on

this cost advantage, the U.S. is a net exporter of refined petroleum products for the first

time since the 1940s.

Resurgence of Domestic Crude Production

Exhibit 9

Domestic Crude Production

U.S. Historical and Projected Crude Production(Mbpd)

Source: EIA 2015 Annual Energy Outlook.

7.4 7.2 6.7 6.5 6.3 5.8 5.7 5.4 5.1 5.0 5.5

6.5

8.7 9.3

10.6

2.0

4.0

6.0

8.0

10.0

12.0

1990 1992 1994 1996 1998 2000 2002 2004 2006 2008 2010 2012 2014 2015E 2020P

Harris Williams & Co. Infrastructure Services | December 2015

Page | 9

$35

$40

$45

$50

$55

$60

$65

$70

Jan-15 Mar-15 May-15 Jul-15 Sep-15 Nov-15

WTI Brent

The U.S. refining market maintains structural price advantages relative to the rest of the

world. Domestic refiners are operating much more profitably, which has strengthened

utilization, particularly along the U.S. Gulf Coast corridor due to the close proximity to the

Eagle Ford Shale and Permian Basin. One of the major competitive advantages for U.S.

refiners is the short distance that oil must be transported before being refined, as

transportation costs can deteriorate much of the profit spread. Additionally, the low cost

of WTI crude relative to Brent provides domestics refiners with some of the lowest input

costs worldwide. Lastly, sustained low natural gas prices continue to keep domestic

operating costs low, further benefitting domestic refiners relative their international peers.

As refiners’ profits are directly tied to the crack spread, or the difference between the price

of crude oil and the price of refined products, strong spreads can translate into stronger

financial performance for refiners whereas falling crack spreads will spur retrofits and lead

to catch-up spending by operators to maintain facilities after extended periods of

operations at high utilizations. In environments with strong crack spreads, many

refineries will delay turnaround maintenance programs to maximize cash flow, which can

sometimes impact the backlog and pipeline of industrial service providers. On the positive

side for outsourced service providers, delays often result in expanded repair and

maintenance work in the near-term as equipment is strained by the deferral of

maintenance.

Positive Domestic Refinery Market Outlook

Exhibit 10

Significant Advantage for Domestic Refiners

U.S. Refinery Margin Advantage in 2015 - 2016 WTI – Brent Spread($ in USD)

Source: Equity Research; Bloomberg.

Product Yield Product

Netback

Transport Cost

Crude Input Cost

Op Ex

D&A

Gross Margin

EBIT Margin

Transportation costs key differentiator across US regions

Cheaper domestic crude improves US refinery

margins

Cheaper natural gas provides operating expenses cushion

A wide WTI-Brent spread provides domestic refiners with a significant cost advantage over international competitors that source feedstock at higher prices benchmarked to Brent crude

Brent is trading at a ~5% premium to WTI

Harris Williams & Co. Infrastructure Services | December 2015

Page | 10

The relative lack of domestic investment in recent years is expected to drive material

capital spending in the U.S. refining industry with nearly $50 billion in capital projects

slated for 2015 and 2016, according to IIR. Additionally, a new 20,000 bbl/d refinery to

serve the Bakken Formation began operations in July 2015 and is the first greenfield

refinery in the U.S. since 1976. Given the boom in domestic oil production and favorable

cost environment, industry analysts anticipate additional refinery construction and

expansion project announcements.

Exhibit 11

Refinery Utilization Rates and Crack Spreads

Average Annual Refinery Utilization Rates Cushing Crack Spreads($ per Bbl)

Source: EIA; Bloomberg.

85%83%

86% 86%89% 88%

90% 92%

50%

55%

60%

65%

70%

75%

80%

85%

90%

95%

100%

2008 2009 2010 2011 2012 2013 2014 2015Avg.

($5)

$0

$5

$10

$15

$20

$25

$30

$35

$40

$45

Strong crack spreads have supported attractive margins for domestic refiners and driven

U.S. refinery utilization rates to increase from a decade-low of 83% in 2009 to an average of

92% in 2015 as independent refiners capitalize on profits and integrated refiners aim to

offset losses in upstream operations. For example, Tesoro reported their plants were

running at 101% of their official capacity in Q3 2015. While in the short-term refiners often

delay routinely scheduled maintenance to take advantage of high margins, they increase

the risk of shutdowns and equipment malfunctions due to over-utilization of equipment as

already seen in several instances in North America. In fact, BP Whiting was forced to shut

down due to over-utilization, which further underlines the importance of routine

maintenance work and provides a positive outlook for industrial services providers.

Harris Williams & Co. Infrastructure Services | December 2015

Page | 11

Since 2000, the number of domestic refineries has decreased from 158 to 142. According to

IHS, weak refining margins caused by overcapacity, along with costly environmental

requirements, were a major burden on refiners and resulted in numerous closures over the

last 15 years. Now, given attractive pricing and crack spreads, existing facilities have

chosen to expand capacity rather than greenfielding new plants. Despite the declining

installed base, capacity has increased by over 458 mbpd over that same period due to

facility expansions and increased capacity within current facilities. Continued facility

expansions and utilization increases are expected to drive additional service intensity,

including maintenance, cleaning, electrical, and craft services within the fence as

throughput and capacity expand.

Increasing Refinery Capacity

Due in large part to increasing domestic production and the relative strength of U.S.

refiners, U.S. exports of finished petroleum products have increased dramatically over the

past ten years and shifted the country from a net importer to a net exporter of petroleum

products. This trend is expected to continue in the future.

Refineries Operating at Record Levels to Export Refined Petroleum Products

Exhibit 12

Domestic RefineriesRefinery Count from 2000 to 2015(As of January 1, 2000 – 2015)

Net U.S. Capacity Additions(MMbpd)

Source: EIA.

3.6

3.7

3.8

3.9

4.0

4.1

4.2

4.3

2000 2003 2006 2009 2012 2015

158

155

153

149

149

148

149

149

150

150

148

148

144

143

142

140

130

135

140

145

150

155

160

2000 2003 2006 2009 2012 2015

Exhibit 13

Refinery Inputs and Petroleum Products

U.S. Net Imports of Total Petroleum Products(Mbpd)

Source: EIA.

(4.0)

(2.0)

0.0

2.0

4.0

6.0

2005 2006 2007 2008 2009 2010 2011 2012 2013 2014 2015

U.S. Net Imports of Total Petroleum Products Linear (U.S. Net Imports of Total Petroleum Products)

Harris Williams & Co. Infrastructure Services | December 2015

Page | 12

According to Turner Mason, a leading refinery consultancy, the quality of growing

domestic crude supply is significantly different than the waterborne imports it displaces,

requiring refiners to spend new capital to maintain capacity and maximize yields. The

domestic shale crudes are lighter, and will require refinery-specific modifications (e.g.,

distillation towers, debutanizers, and light ends recovery). Distillation yields from the new

shale crude are skewed more toward light ends and naphtha, and there are fewer middle

distillate and gas oil barrels. Since this runs counter to expected demand patterns, capital

expenditures for hydrocrackers, distillation towers, and other facilities to “reshape” yields

will be necessary. In addition, shale crudes serve as an ideal feed for resident fluid

catalytic cracking units (“FCCU”), and this will encourage conversion of existing units to

add this capability.

Increased heavy, sour crude production, particularly from oil sands regions, has also led to

a fundamental shift in U.S. refinery capabilities. Canadian heavy crudes have increased

TAN (“total acid number”) levels, requiring investment in metallurgical upgrades and

other corrosion prevention and remediation projects. As heavy crudes with higher

impurities continue to grow as a component of oil supplies, refineries must continue to

invest in additional capacity in order to process these inputs profitably.

Changing Mix of Crude Slates

Harris Williams & Co. Infrastructure Services | December 2015

Page | 13

$0

$250

$500

$750

$1,000

0 20 40 60 80 100 120 140

Do

llars

per

Metr

ic T

on

Ethylene Capacity

2015 Cost Curve 2009 Cost Curve

Exhibit 14

Abundant Supply of Natural Gas has Lowered Prices and Feedstocks

U.S. Natural Gas Production(Tcf)

Ethylene Cost Curve1

(industry capacity in metric tons)

Source: EIA, Equity Research.1) 2009 cost curve assume $50 WTI and $60 Brent Crude

2015 cost curve assume $50 WTI and $50 Brent Crude

ME Ethane

SE Asia

NE Asia

Western Europe

+45%

24.0 25.3 25.7 27.3 28.0

30.5 32.3

35.0

5.0

10.0

15.0

20.0

25.0

30.0

35.0

40.0

2011 2012 2013 2014 2015E 2020P 2025P 2030P

North America

Unconventional resources have dramatically changed the landscape for domestic natural

gas supply. Shale gas production, which accounted for 2% of natural gas production in

2000, represented approximately 20% of gas production in 2010 and is expected to increase

to more than 45% by 2030, according to Wood Mackenzie. According to the EIA, U.S.

natural gas production is estimated to increase over 45% from 24.0 Tcf in 2011 to 35.0 Tcf in

2030P due largely to continued shale gas development.

The abundance of natural gas resources and structural decline in natural gas prices has

radically changed North America’s global cost competitiveness for ethylene and derivative

products. Currently, North America is second only to the Middle East on the ethylene cost

curve, a remarkable shift from being the highest cost producer in 2003. This development

is expected to result in higher utilization at current facilities, the construction of new

facilities, and significant capital investments to expand capacity at existing petrochemical

plants in the U.S.

Sustained Petrochemical and Chemical Growth

North America

Harris Williams & Co. Infrastructure Services | December 2015

Page | 14

Global product demand for ethylene-derived products (e.g., PVC, plastics) is expected to

increase driven largely by demand from Asia and other emerging markets. Industry

analysts expect demand growth to outpace supply growth in China for the foreseeable

future, with much of the supply differential for ethylene derivatives coming from the U.S.

As a result, global demand will continue to drive high utilization rates at U.S.

petrochemical process plants leading to longer run-times and throughput with

petrochemical operating rates, standard industry nomenclature for utilization, expected to

climb above 90% in 2016 to accommodate the steadily growing demand for ethylene.

Additionally, these trends will result in increasing turnaround slates, ongoing preventative

and corrective maintenance, and a higher frequency of emergency repair work.

Increasing Demand for Ethylene Driving High Operating Rates

Exhibit 15

Worldwide Ethylene

Worldwide Ethylene Demand and Petrochemical Operating Rate(ethylene demand in million mt/year)

Source: Dow Chemicals.

80%

85%

90%

95%

100%

-

100

200

300

400

500

2010 2011 2012 2013 2014 2015 2016 2017 2018 2019 2020

Glo

ba

l Op

era

ting

Ra

teEth

yle

ne

De

ma

nd

Demand Operating Rate

Exhibit 16

Near-Term North American Petrochemical Investment

North American Petrochemical Investment($ in billions)

U.S. Ethylene Cracker New-build Projects Under Construction3

(lbs in billions)

40

50

60

70

80

2014 2018P

FacilityIn

Service

Freeport – Dow 2017

Baytown – Chevron Phillips

2017

Baytown –ExxonMobil Chemical

2017

Lake Charles – Sasol 2017

Monaca - Shell TBD

30% increase in capacity

Source: IIR, Equity Research.

$0.0

$10.0

$20.0

$30.0

$40.0

$50.0

$60.0

2010 2011 2012 2013 2014 2015P 2016P

NA

M P

etc

hem

In

vest

men

t

Pending Petrochemical Spending

Actual Petrochemical Spending

As a result of the high operating rates and favorable cost environment, the petrochemical

industry is projected to attract over $85 billion of capital investment in 2015 and 2016 to

augment ethylene capacity through (i) feedstock flexibility projects; (ii) expansion projects;

and (iii) new crackers. Increased throughput at existing facilities and an expanding

installed base provide a large maintenance opportunity for industrial services providers.

Harris Williams & Co. Infrastructure Services | December 2015

Page | 15

Chemical projects across North America have significantly increased in recent years

representing a significant opportunity for infrastructure service providers with the largest

planned expenditures through 2016 expected across the South and Midwest United States.

Exhibit 17

North American Chemical ProjectsAs of January 2015 ($ in billions)

Domestic Capacity Expansion Heat Map by State and Expected Investment by 2016As of January 2015

Source: Equity Research.

$400 million

$2.0billion

$1.0 billion

$3.6 billion

4 4 4 3 65

7 208 12 11 22

32

39

53

26

$0

$20

$40

$60

2001 2002 2003 2004 2005 2006 2007 2008 2009 2010 2011 2012 2013 2014 2015 2016

To

tal

Sp

en

din

g

Total Spending Project Count

Harris Williams & Co. Infrastructure Services | December 2015

Page | 16

U.S. natural gas prices have remained substantially below global market prices due to

increasing supply from domestic unconventional resources. With U.S. natural gas prices

expected to remain below the major European and Asian markets, five U.S. LNG export

facilities are currently under construction or in advanced planning stages in Sabine, LA,

Hackberry, LA, Freeport, TX, Cove Point, MD, and Corpus Christi, TX.

The Rise of Domestic LNG Export Facilities

Exhibit 18

Global Price Differentials and Rising Demand Support Additional Investment

Global Price Differentials1

(USD in actual dollars per MMBtu)Global LNG Demand

Global price differentials support extensive North American LNG export opportunities.

(1) As of October 2015.Source: IMF. Poten & Partners, Cowen and Company.

Growing global LNG demand is spurring a race by major oil and gas producers to expand

the already-constrained approximately 300MM mtpb global LNG capacity currently in

place. With the fourth largest shale gas resource in the world and the most attractive cost

profile for supplying East Asia, the U.S. remains the most attractive opportunity for LNG

expansion projects.

Exhibit 19

Resource Abundance Coupled With Attractive Cost ProfileAbundant Shale Gas Resource(Tcf)

Source: EIA; Poten & Partners, Cowen and Company.

$9.00

$6.01

$2.32

$5.00

$10.00

$15.00

$20.00

$25.00

Oct-10 Jun-12 Feb-14 Oct-15

Asia Benchmark Europe BenchmarkHenry Hub

-

50

100

150

200

250

300

350

400

450

2000 2005 2010 2015 2020 2025 2030

MM

t/y

Niche (Asia & ME) Americas

Europe China & India

Japan, Korea and Taiwan Uncovered Demand

02468

101214161820

U.S GulfCoast

Brownfield

U.S. GulfCoast

Greenfield

CanadaWestCoast

CanadaEast

Coast

East Africa AustraliaExpansion

AustraliaGreenfield

Asia Bound Europe Bound

LNG Breakeven Price (15% IRR)($/MMBtu)

1,115

802 707 665

573 545 437 390

285

200

400

600

800

1,000

1,200

China Argent. Algeria U.S. CA Mex. Aust. S.Africa

Russia

Harris Williams & Co. Infrastructure Services | December 2015

Page | 17

The construction and engineering of new LNG export facilities will require billions in

capital expenditures and represent an attractive opportunity for industrial service

providers on capital, turnaround, and long-term maintenance contracts. While there are

presently 5 U.S. facilities under construction, there are an additional 27 applications

currently under review by the DOE and FERC, which represents a significant growth

opportunity for contractors in the coming years. Sabine Pass, for example, has expected

total project costs of approximately $11.5 billion for the first two LNG trains that are

currently under construction.

DOE and FERC approvals, which are required for non-FTA destinations, span

approximately 2-3 years and provide an attractive outlook on U.S. LNG opportunities even

if only a few facilities ultimately receive approval or move forward as global demand for

LNG is assessed. Asian demand is expected to be the main factor, where, in addition to a

more challenging economic model, Asian buyers typically desire to price long-term

contracts on an index derived from oil prices so any faltering in demand there could

potentially lead to project delays or cancellations.

LNG Export Projects Advancing in North America Due to Attractive Pricing Dynamics

Exhibit 20

U.S. LNG Export Terminal Proposals(Capacity in Bcfd)

North American LNG Export Terminal Proposals

As of September 2015

Source: Equity Research.

Project Capacity Owner

Pending Applications

Coos Bay 0.9 Jordan Cove Energy Project

Lake Charles 2.2 Southern Union - Lake Charles

Astoria 1.3 Oregon LNG

Elba Island 0.4 Southern LNG Company

Lake Charles 1.1 Magnolia LNG

Sabine Pass 2.1 ExxonMobil-Golden Pass

Pascagoula 1.5 Gulf LNG Liquefaction

Freeport 0.3 Freeport LNG Dev

Cameron Parish 1.4 Venture Global Calcasieu Pass

Projects in Pre-Filling

Plaquemines Parish 1.1 CE FLNG

Plaquemines Parish 0.3 Louisiana LNG

Robbinston 0.5 Kestrel Energy - Downeast LNG

Jacksonville 0.1 Eagle LNG Partners

Hackberry 1.4 Sempra-Cameron LNG

Brownsville 0.5 Texas LONG Brownsville

Brownsville 0.9 Annova LNG Brownsville

Port Arthur 1.4 Port Arthur LNG

Brownsville 3.6 Rio Grande LNG - NextDecade

Freeport 0.7 Freeport LNG Dev

Corpus Christi 1.4 Cheniere-Corpus Christi LNG

Plaquemines Parish 2.8 Venture Global LNG

Nikiski 2.6 Exxon, Conoco, BP, TransCanada

Project Capacity Owner

Proposed to US-Marad/Coast Guard

Gulf of Mexico 1.8 Delfin LNG

Proposed Canadian Sites

Kitimat 1.3 Apache Canada Ltd.

Douglas Island 0.2 BC LNG Export Cooperative

Prince Rupert Island 2.7 Pacific Northwest LNG

Squamish 0.3 Woodfibre LNG Ltd.

Harris Williams & Co. Infrastructure Services | December 2015

Page | 18

The U.S. power generation grid is a vast network of over 3,000 operating power plant units

that provide critical energy to residential and commercial customers and is dominated by

three fuel sources – coal, natural gas, and nuclear power. These primary sources represent

approximately 87% of U.S. electricity generation and are expected to maintain their share

for the foreseeable future with mix changes occurring due to input costs and government

and environmental regulations. Currently, coal accounts for approximately 37% of power

generation largely due to its abundant supply, low cost, and existing plant infrastructure.

While coal is forecast to remain the largest source of power generation in the U.S. through

2035, it has declined from 51% of to 37% since 2003. Conversely, natural gas has grown

significantly as a percent of total generation (from 17% in 2003 to 27% in 2014) due to coal

retirements and new-build gas capacity. While there is expected to be a slow shift from

coal to gas power, nuclear power’s share of the domestic power supply has remained

relatively steady since 2003 at approximately 19%.

Strong Domestic Power Generation Fundamentals

Exhibit 21

U.S. Power Generation Infrastructure

Source: Ceres.

Utility industry capital expenditures are expected to exceed $95 billion in 2015, with the

majority of spending related to upgrading and retrofitting existing power infrastructure

and environmental compliance, according to the Edison Electric Institute (“EEI”). Utilities

are highly incentivized to spend their entire capital budgets or risk reduced funding or rate

reductions in the future, making these spending forecasts a reliable predictor of pending

investment.

Harris Williams & Co. Infrastructure Services | December 2015

Page | 19

Furthermore, utility revenue streams tend to be very steady, thus allowing them to spend

more consistently on repair, maintenance, and construction. This creates a stable and

growing base of demand that further supports the long-term industry trends.

In addition to growing demand and aging infrastructure, state and federal regulations and

initiatives are pressuring the energy infrastructure industry to meet more stringent

requirements for quality, reliability, and emissions controls. This culmination of events

highlights significant investment that is needed across the entire power generation market.

Exhibit 22

Domestic Power Generation

U.S. Power Generation by Fuel Source(in billion kilowatthours)

2014 U.S. Power Generation Industry Capital Expenditures ($ in millions)

An abundance of natural gas supply from shale production and persistent low prices are

driving the construction of new natural gas combined-cycle units to act as baseload

generators. Traditionally, due to the volatility of natural gas commodity prices, natural

gas units were used as peak generators (“peakers”) and only activated during periods of

peak electricity loads, such as summer demand for air conditioning. This dynamic is

shifting as natural gas’ share of capacity additions rises through 2040, according to the

EIA. Nearly 44% of all expected capacity additions will ultimately be natural gas by 2018.

With increased production, gas prices declined and normalized to levels low enough to

attract investment in new build capacity for power generation in lieu new coal-fired

generation. As a result, the long-term outlook for natural gas is extremely favorable as

older, smaller coal plants are retired due to increasingly stringent environmental standards

and the threat of additional EPA action for potential CO2 regulation down the road.

Natural Gas Driven Power Generation

Source: EIA, EEI.

400

600

800

1,000

1,200

1,400

1,600

1,800

2,000

2010 2015 2020 2025 2030 2035 2040

Coal Natural Gas

Nuclear Power Renewable & Other

Harris Williams & Co. Infrastructure Services | December 2015

Page | 20

Natural gas is expected to grow its share of total generation over the next 25 years as a

result of its favorable cost advantage (lower fixed costs), an accommodative political and

regulatory environment, and shorter construction times than traditional power generation

plants such as coal and nuclear. This expanded installed base represents a significant

opportunity for growth for industrial service providers.

Electric power plants are utilized based on their variable cost of operation, which is

dictated by both the price of the fuel used and the efficiency of the plant. Therefore,

natural gas combined cycle power plants represent a significant opportunity for utilities to

shift to a lower variable cost structure, as gas power generation is more efficient and

flexible than traditional coal-fired steam turbines in today’s low natural gas price

environment. By 2040, the EIA expects fixed capital costs of new build gas plants to be

roughly 20% of those of coal, nuclear, and wind per kilowatthour, which supports the ~250

gigawatts of expected natural gas power generation capacity additions projected by the

EIA.

Exhibit 24

Natural Gas as a Percentage of Total Power Generation

Exhibit 23Substantial Capacity Expected

Natural Gas New Build Costs (Cents per kilowatthour)

Expected Power Generation Capacity Additions by Fuel(gigawatts)

2020

2040

Natural Gas CC

Wind

Nuclear

Coal

Capital Operations & Maintenance Transmission

0 2 4 6 8 10

Natural Gas CC

Wind

Nuclear

Coal

10

20

30

40

50

60

70

2013-2015

2016-2020

2021-2025

2026-2030

2031-2035

2036-2040

Coal Nuclear Renewables/ Other Natural gasSource: EIA.

Source: EIA.

Natural

Gas23%

Other

77%

Natural

Gas31%

Other

69%

20153.8B kWh

20404.7B kWh

Harris Williams & Co. Infrastructure Services | December 2015

Page | 21

While coal’s share of the total power generation market is slowly declining due to

regulatory initiatives and the resurgence of gas generation, it represents a significant

maintenance and retrofitting opportunity for service providers given the aging

infrastructure and the need for large plants to be retrofitted with environmental

compliance systems such as air quality control systems (“AQCS”), flue-gas desulfurization

(“FgD”) systems, baghouses, and selective catalytic reduction (“SCR”) systems.

Coal-Fired Power Generation

Coal Retirements Planned

With existing large, coal-fired power plants serving as a primary baseload, smaller and

less-efficient coal plants have been selected for retirement over the next five years. Larger

plants, which serve critical roles in the U.S. power system, will be retrofitted or converted

rather than retired. These retrofits are much less costly than new build gas or coal plants,

and adequately address the stringent emissions standards that are currently set. As a

result, new EPA standards to reduce emissions are primarily driving the retirement of

aging and smaller coal-fired power plants. Of the 3,084 operating power units in the U.S.,

1,260 are coal-fired units with a total generating capacity of 320 GW, with 218 of those

units currently scheduled for retirement, which make up only 14% of total coal-fired

capacity. Nearly 80% of the units currently scheduled to be retired have generating

capacity of less than 250 MW.

Harris Williams & Co. Infrastructure Services | December 2015

Page | 22

The regulatory environment surrounding coal-fired power plants has all but eliminated

opportunities for future new build capital spending, however, there remain substantial

opportunities related to decommissioning and environmental compliance. Two recent

EPA rulings – Clean Air Interstate (“CAIR”) and Mercury and Air Toxics Standards

(“MATS”) – have been enacted to regulate emissions levels for existing and new power

plants. Upon implementation in 2005, the EPA projected CAIR compliance costs of nearly

$4 billion annually by 2015. Further, the EPA estimated the annual cost of MATS

compliance to be $9.6 billion by 2015. NERA’s estimated that compliance costs associated

with MATS would approach $100 billion over the life of the law for the remaining fleet.

These costs underscore the potential capital costs for retrofits to meet increasingly

stringent standards.

Regulatory Impact on Coal-Fired Fleet

Exhibit 25Coal Retirements Impact Capacity Utilization

Estimated Coal Retirements (Thousands of Megawatts)

Increase Remaining Fleet Utilizations (Utilization Factor)

Source: EPA, Equity Research.

2.9

8.9

6.0

3.5

19.4

11.7

4.4 3.5

0.6 1.6

0.0

5.0

10.0

15.0

20.0

25.0

The reduction in generating capacity due to announced plant retirements is expected to

increase utilization of the remaining units, which will require additional maintenance to

ensure proper operation. According to the EIA, coal will account for over 35% of electric

power generation in 2040 with utilization rates expected to increase through 2016 to offset

the effect of coal-fired unit retirements. The newer, larger coal-fired units will be

retrofitted with SCRs to reduce nitrogen oxides emissions, FgDs to reduce sulfur dioxide

emissions, and baghouses to reduce particle emissions. Additionally, the corresponding

reduction in capacity due to plant retirements will therefore be offset by increased

utilization of the remaining units, which will require additional maintenance to ensure

proper operation of each unit. This increase in utilization will drive higher maintenance

expenditures.

60%55%

65% - 75%

0%

10%

20%

30%

40%

50%

60%

70%

80%

2011 2012 2015P

Harris Williams & Co. Infrastructure Services | December 2015

Page | 23

The World Nuclear Association estimates that existing operating nuclear facilities spend

nearly $8 billion annually on recurring repairs and maintenance which is expected to

increase as the existing fleet continues to age. Low natural gas prices and increased public

scrutiny following the Fukushima melt down have dimmed the prospects of the U.S.

nuclear industry. While new build opportunities are limited, there are a number of current

reactors under construction in the southeastern U.S. that provide opportunities for EPC

providers to win large projects. Long-term, new build opportunities seem available with

several planned and proposed projects throughout the U.S., many of which remain in

limbo given the current uncertainty behind the nuclear political environment. While new

build opportunities are limited, there remains a sizeable maintenance, testing, and

inspection opportunity.

Nuclear and Renewables

Exhibit 26

Under Construction, Planned, and Proposed Nuclear Facilities

Under Construction

Site Technology MWe gross Proponent/utility Construction start Operational Date

Watts Bar 2f, TN Westinghouse PWR 1218 (1177 net) Tennessee Valley Authority 2007 re-start 2015

Vogtle 3, GA Westinghouse API 1000 1200 (1117 net) Southern Nuclear Operating March 2013 2017

Vogtle 4, GA Westinghouse API 1000 1200 (1117 net) Southern Nuclear Operating November 2013 2017

V.C.Summer 2, SC Westinghouse API 1000 1200 (1117 net) South Carolina Electric & Gas March 2013 2017

V. C. Summer 3, SC Westinghouse API 1000 1200 South Carolina Electric & Gas November 2013 2019

Planned and Proposed

Site Technology MWe gross Proponent/utility COL Status Operational Date

Bellefonte 1, AL B&W PWR 1263 Tennessee Valley Authority COL review suspended 2018 - 2020

William States Lee, SC AP1000 x 2 2400 Duke Energy COL target late 2016 2024 - 2026

Turkey Point, FL AP1000 x 2 2400 Florida Power & Light COL target 2014 2022 - 2023

Levy County, FL AP1000 x 2 2400 Duke Energy COL target late 2015 2024

Shearon Harris, NC AP1000 x 2 2400 Duke Energy COL review suspended 2026

North Anna, VA ESBWRi 1600 Dominion COL review delayed 2022

Comanche Peak, TX US-APWR x2 3400 Luminant COL review suspended 2020

South Texas Project*, TX ABWR x 2 2712 Toshiba, NINA, STP Nuclear COL review delayed Unknown

Clinch River, TN mPower x 2 360 TVA Permit deferred 2022

Callawayj, MO Westinghouse SMR x 5 1125 Ameren Missouri Proposal suspended Unknown

Grand Gulf, MS ESBWRi 1600 Entergy COL review suspended Unknown

Fermi, MI ESBWR 1600 Detroit Edison COL target late 2015 Unknown

River Bend, LA ESBWRi 1600 Entergy COL review suspended Unknown

Nine Mile Point, NY US EPR 1710 UniStar Nuclear COL application

withdrawn

Unknown

Bell Bend (near Susquehanna),

PA

US EPR 1710 PPL COL review delayed Unknown

Blue Castle, UT unspecified 1200 Transition Power Development ESP application expected Unknown

Salem/Hope Creek, NJ unspecified 1200 PSEG ESP application 2014 On line 2021

Source: The World Nuclear Organization.

Harris Williams & Co. Infrastructure Services | December 2015

Page | 24

Harris Williams & Co. (www.harriswilliams.com) is a preeminent middle market investment bank focused on

the advisory needs of clients worldwide. The firm has deep industry knowledge, global transaction expertise,

and an unwavering commitment to excellence. Harris Williams & Co. provides sell-side and acquisition

advisory, restructuring advisory, board advisory, private placements, and capital markets advisory services.

Investment banking services are provided by Harris Williams LLC, a registered broker-dealer and member of

FINRA and SIPC, and Harris Williams & Co. Ltd, which is authorised and regulated by the Financial Conduct

Authority. Harris Williams & Co. is a trade name under which Harris Williams LLC and Harris Williams & Co.

Ltd conduct business.

THIS REPORT MAY CONTAIN REFERENCES TO REGISTERED TRADEMARKS, SERVICE MARKS AND

COPYRIGHTS OWNED BY THIRD-PARTY INFORMATION PROVIDERS. NONE OF THE THIRD-PARTY

INFORMATION PROVIDERS IS ENDORSING THE OFFERING OF, AND SHALL NOT IN ANY WAY BE

DEEMED AN ISSUER OR UNDERWRITER OF, THE SECURITIES, FINANCIAL INSTRUMENTS OR OTHER

INVESTMENTS DISCUSSED IN THIS REPORT, AND SHALL NOT HAVE ANY LIABILITY OR

RESPONSIBILITY FOR ANY STATEMENTS MADE IN THE REPORT OR FOR ANY FINANCIAL

STATEMENTS, FINANCIAL PROJECTIONS OR OTHER FINANCIAL INFORMATION CONTAINED OR

ATTACHED AS AN EXHIBIT TO THE REPORT. FOR MORE INFORMATION ABOUT THE MATERIALS

PROVIDED BY SUCH THIRD PARTIES, PLEASE CONTACT US AT THE ABOVE ADDRESSES OR

NUMBERS.

The information and views contained in this report were prepared by Harris Williams & Co. (“Harris

Williams”). It is not a research report, as such term is defined by applicable law and regulations, and is

provided for informational purposes only. It is not to be construed as an offer to buy or sell or a solicitation of

an offer to buy or sell any financial instruments or to participate in any particular trading strategy. The

information contained herein is believed by Harris Williams to be reliable, but Harris Williams makes no

representation as to the accuracy or completeness of such information. Harris Williams and/or its affiliates may

be market makers or specialists in, act as advisers or lenders to, have positions in and effect transactions in

securities of companies mentioned herein and also may provide, may have provided, or may seek to provide

investment banking services for those companies. In addition, Harris Williams and/or its affiliates or their

respective officers, directors and employees may hold long or short positions in the securities, options thereon

or other related financial products of companies discussed herein. Opinions, estimates and projections in this

report constitute Harris Williams’ judgment and are subject to change without notice. The financial instruments

discussed in this report may not be suitable for all investors, and investors must make their own investment

decisions using their own independent advisors as they believe necessary and based upon their specific

financial situations and investment objectives. Also, past performance is not necessarily indicative of future

results. No part of this material may be copied or duplicated in any form or by any means, or redistributed,

without Harris Williams’ prior written consent.

Copyright© 2015 Harris Williams & Co., all rights reserved.


Recommended