Practical issues in updating IDF curves for future climate: Climate models, “Physics”, …. Slobodan P. Simonović Abhishek Gaur Andre Schardong Civil and Environmental Engineering Institute for Catastrophic Loss Reduction The University of Western Ontario
Transcript
Practical issues in updating IDF curves for future climate:
Climate models, “Physics”, ….
Slobodan P. SimonovićAbhishek Gaur
Andre SchardongCivil and Environmental Engineering
Institute for Catastrophic Loss ReductionThe University of Western Ontario
PRESENTATIONThanks2|
Dr. Abhishek GAUR, Post Doctoral Fellow Dr. Andre SCHARDONG, Post Doctoral Fellow
Data – Environment and Climate Change Canada Dr. Zhang Xuebin; Dr. Ka-Hing Yau; Dr. Gordon McBean
Funding – ICLR; NSERC
CONCLUSIONS3|
There is a clear practical need for updating IDF relationships for climate change
Challenges in projecting precipitation extremes remain
Use of the IDF_CC tool is a recommended option The Clausius-Clapeyron scaling rate (7% per 0C) clearly does not apply for
stations used in this study and should not be arbitrarily applied to derive IDF curves for future
The IDF_CC better captures uncertainty from the GCMs
Recommendations Use the IDF_CC tool – live with the process uncertainty
Move from risk based decision making to process based engineering
Switch from risk to resilience
PRESENTATIONOutline4|
Needs of engineering practice Comparison
Precipitation based climate models use (IDF_CC) Physics-based temperature scaling Experiments
Practical issues Uncertainty Needs for a new decision making paradigm
Guidelines From risk-based to performance-based engineering From risk to resilience
Conclusions
NEEDS OF ENGINEERING PRACTICEChanging conditions5|
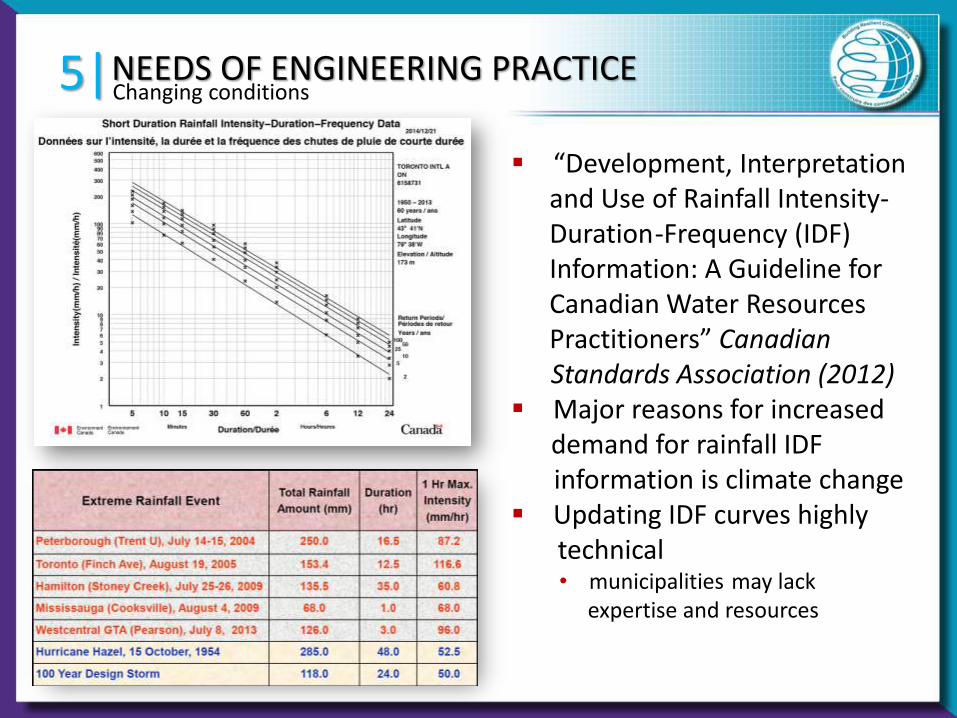
“Development, Interpretation and Use of Rainfall Intensity-Duration-Frequency (IDF) Information: A Guideline for Canadian Water Resources Practitioners” Canadian Standards Association (2012)
Major reasons for increased demand for rainfall IDF information is climate change
Updating IDF curves highly technical• municipalities may lack
expertise and resources
NEEDS OF ENGINEERING PRACTICEChallenges6|
NEEDS OF ENGINEERING PRACTICEOptions7|
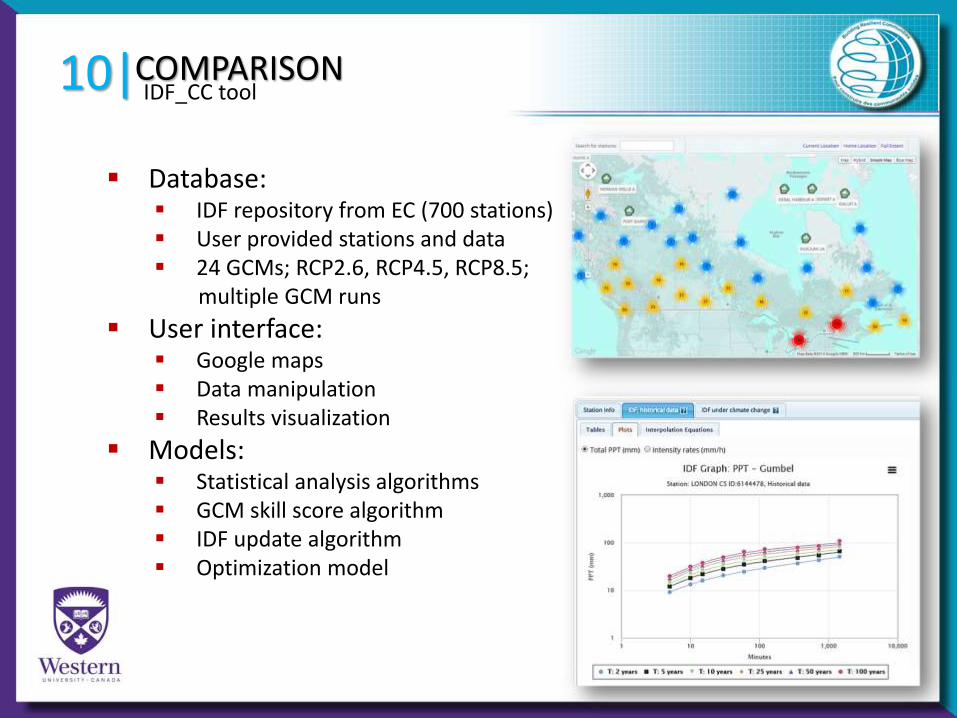
Use of precipitation and global climate models: IDF_CC toolhttps://www.idf-cc-uwo.ca/
Use of precipitation and regional climate model:Ontario Climate Change Data Portal http://www.ontarioccdp.ca/Northeast Regional Climate Center, Cornell University http://ny-idf-projections.nrcc.cornell.edu/#dialog_box
Use of temperature as a predictor for updating IDF curves.
Assumption and hypothesis: Increase of precipitation extremes at a rate of ~7 % per 0C, assuming
constant relative humidity indicated by the Clausius-Clapeyron (C-C) relationship
Claims “use of physics”
“Lower uncertainty” in the projected IDF curves
Experiment 1 - Analysis of the empirical relations between daily maximum precipitation and daily temperatures and comparison with the ~7% the C-C scaling
Experiment 2 - Comparison of IDF curves derived from the theoretical Clausius-Clapeyron (C-C) scaling (~7% rate) with the IDF_CC tool
COMPARISONPhysics based approach12|
The Clausius-Clapeyron (C-C) describes the increase in the saturation water vapor pressure associated with warming as:
𝜕𝑒𝑠
𝜕𝑇=
𝐿𝑣
𝑅𝑣𝑇2
Where:
𝑒𝑠: is the saturation water vapor pressure
𝐿𝑣: is the latent heat of vaporization (2.5 × 10⁶ J kg−1 at 0°C)
𝑇: is the absolute atmospheric temperature in Kelvin𝑅𝑣: is the gas constant (461.5 J kg−1 K−1)
COMPARISONPhysics based approach13|
In the August–Roche–Magnus approximation, 𝑒𝑠 can be related to temperature 𝑇∗ (in oC) by:
𝑒𝑠= 6.1094. 𝑒𝑥𝑝17.625.𝑇∗
𝑇∗+243.04
Saturation water vapor pressure is directedly related to relative humidity.
Assuming constant relative humidity, this would lead to an increase of moisture available to rainstorms at the Clausius-Clapeyron rate of ~ 7 % per oC (Westra et al., 2014)
COMPARISONPhysics based approach14|
Experiment 1
Observed short duration daily precipitation maximums and average daily temperatures relations are extracted and validated against the Clausius-Clapeyron (7% C-C) scaling rate.
Short duration daily maximum precipitation considered: 5, 10, 15, 30 min, 1, 2, 6, 12 and 24 hours
Analysis for 4 stations across Canada: London CS (Ontario) Moncton A (New Brunswick) Brandon A (Manitoba) Vancouver A (British Columbia)
COMPARISONPhysics based approach15|
COMPARISONPhysics based approach16|
COMPARISONPhysics based approach17|
COMPARISONPhysics based approach18|
COMPARISONPhysics based approach19|
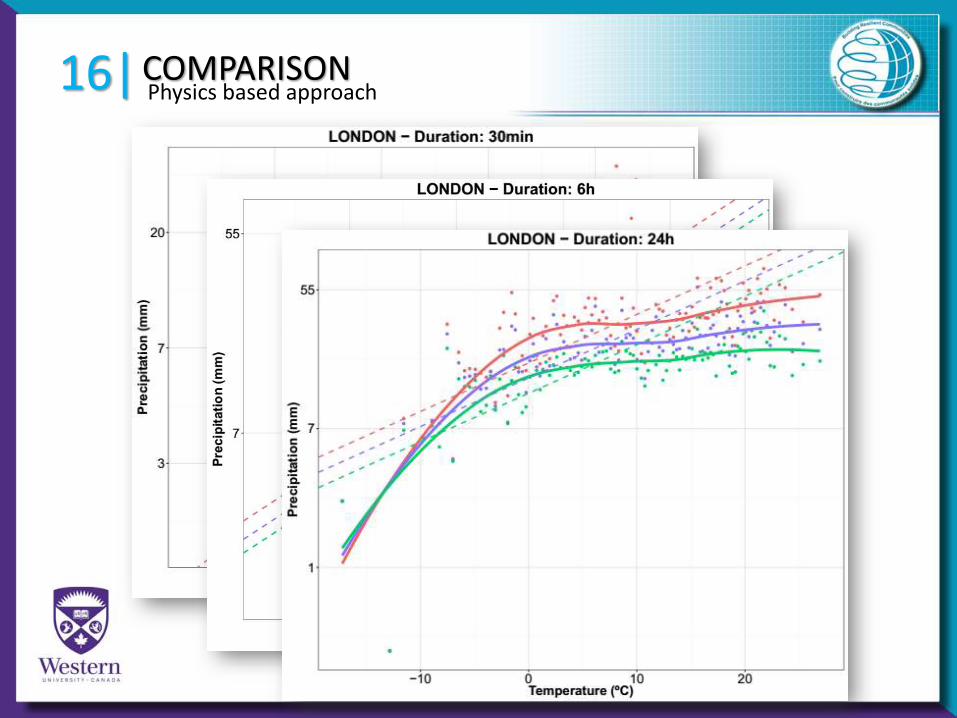
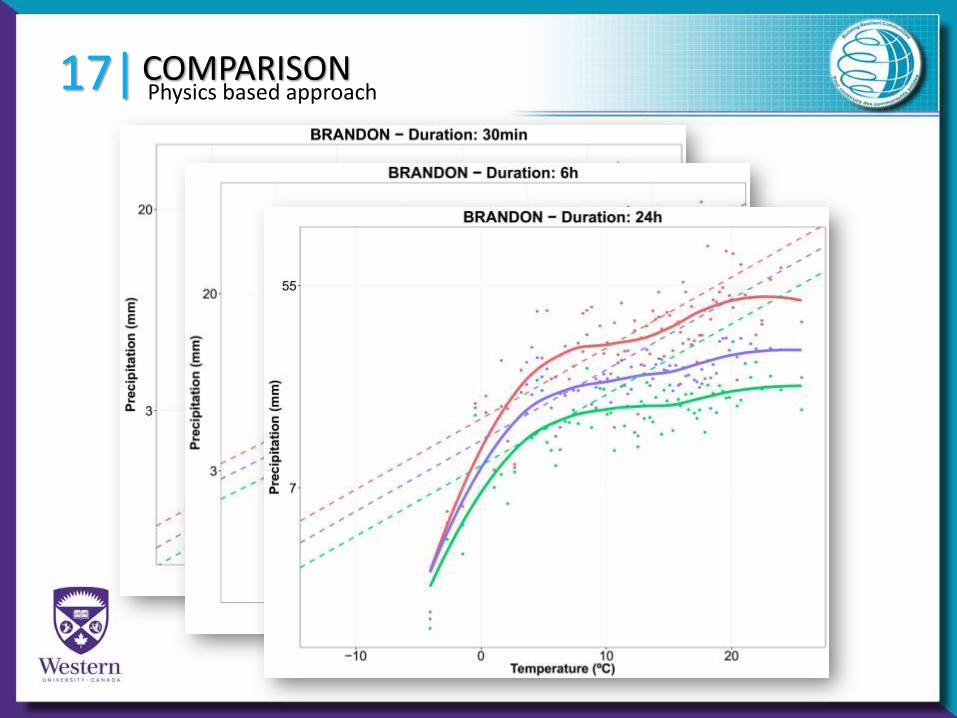
Summary The sub-daily daily maximum precipitation shows weak linear
correlation to the daily temperature for most stations and durations. Only lower durations for Moncton, London and Brandonshow correlations roughly identical to the theoretical C-C 7% per 0C rate.
For Vancouver station none of the sub-daily durations present linear correlation to temperature. For temperatures higher than 10 ºC negative slopes are observed.
Conclusion The Clausius-Clapeyron scaling rate clearly does not apply for any of
the stations consider in this study, and should not be arbitrarily applied to derive IDF curves for future.
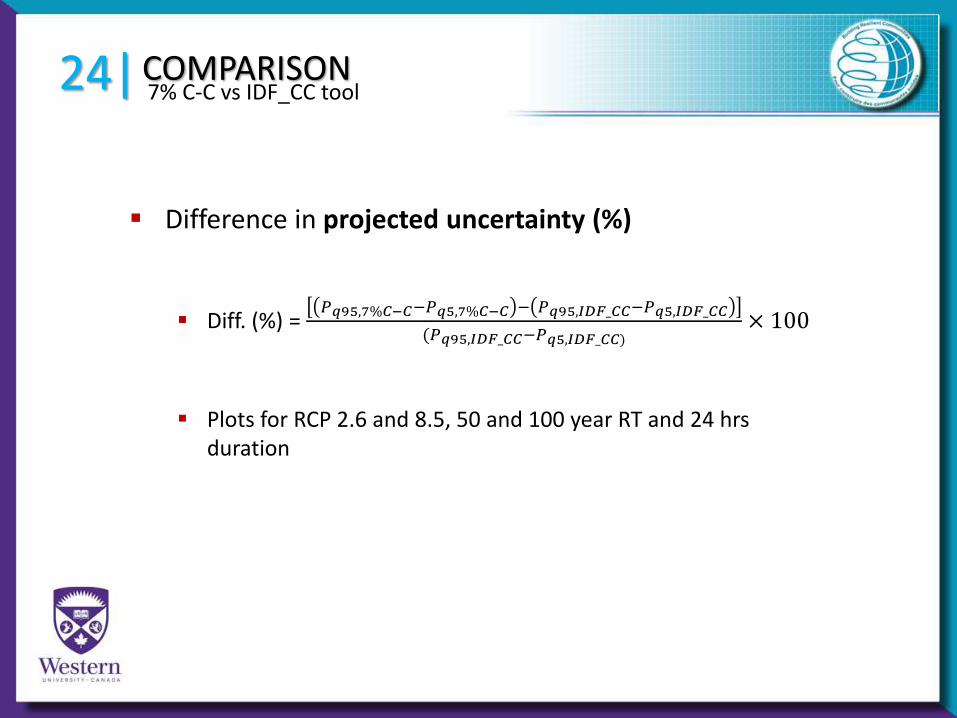
COMPARISON7% C-C vs IDF_CC tool 20|
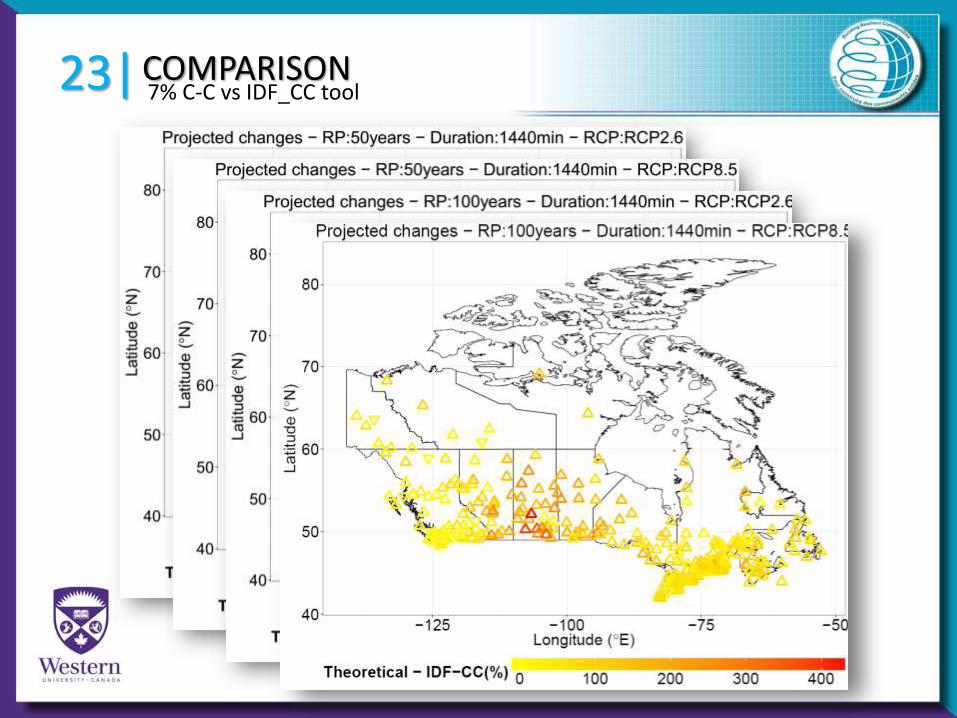
Experiment 2
358 selected stations across Canada with at least 20 years of observed data
Difference in projected changes (total precipitation): 7% C-C vs. IDF_CC is analyzed for the ensemble of all GCMs, RCP 2.6, 4.5 and 8.5, 2 to 100 years RT and durations: 5, 10, 15, 30 min, 1, 2, 6 and 24hrs
Difference in projected uncertainty: 7% C-C vs. IDF_CC is analyzed for the ensemble of all GCMs, RCP 2.6, 4.5 and 8.5, 2 to 100 years RT and durations: 5, 10, 15, 30 min, 1, 2, 6 and 24hrs. Some plots are presented.
COMPARISON7% C-C vs IDF_CC tool 21|
COMPARISON7% C-C vs IDF_CC tool 22|
Difference in projected changes (total precipitation)
Difference (%) = 𝑃7%𝐶−𝐶 −𝑃𝐼𝐷𝐹_𝐶𝐶
𝑃𝐼𝐷𝐹_𝐶𝐶× 100
Plots for RCP 2.6 and 8.5, 50 and 100 year RT and 24 hrs duration
Plots for RCP 2.6 and 8.5, 50 and 100 year RT and 24 hrs duration
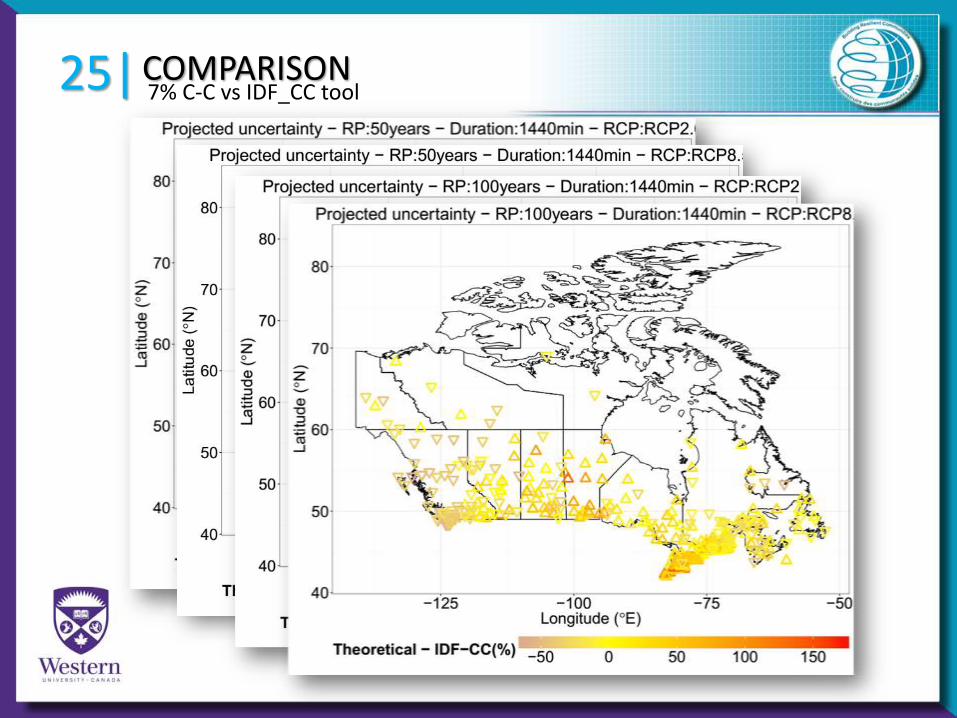
COMPARISON7% C-C vs IDF_CC tool 25|
COMPARISON7% C-C vs IDF_CC tool 26|
Summary Theoretical 7% C-C scaling is resulting in higher values of projected
changes for the future compared to the IDF_CC tool for RCP 4.5 and 8.5 - specially in the prairies. For RCP 2.6 the results are mixed
For RCP 2.6 the IDF_CC is resulting in lower uncertainty, and for RCP 4.5 and 8.5, the uncertainty is lower for the 7% C-C.
Conclusions The IDF_CC better captures uncertainty from the GCMs. The 7% C-C does not produce a single future IDF curve. The
uncertainty range may be even larger than the resulting from the IDF_CC tool.
COMPARISON27|
Conclusions Live with the process uncertainty
Adapt the decision making process
Questions from the practice Standardization?
How to deal with the uncertainty? (communication and understanding)
What to do for ungauged sites?
Recommendations Use IDF_CC tool
Move from risk based decision making to process based engineering
Switch from risk to resilience
So what?
PRACTICAL ISSUES28| Regulatory approach
Standardization PEI (Transportation, Infrastructure, and Energy Dept) example:"The impact of climate change is to be considered in the planning and design of new subdivisions and developments to prevent any flood related damages to structures and properties. This approach requires the use of future climate data instead of historical data in the design of stormwater systems, as historical data does not represent future climate anymore and it may underestimate climate risk and its impact. Future climate data can be generated or obtained using available resources and studies, the University of Western-Ontario IDF CC Tool is one of these resources and it is recommended for generating future rainfall data. However, if consultant/engineer prefers other resources or specific global climate models to generate rainfall data, TIE will review the proposed information and advise if it coincides with the recommended tool. The Tool can be found at: www.idf-cc-uwo.ca . To generate future data from IDF CC Tool, using an ensemble of all models is recommended to avoid variability in data generated from individual models. Also, future data should be generated based on RCP 4.5 and RCP 8.5 scenarios."
PRACTICAL ISSUES29| Uncertainty communication and understanding
PRACTICAL ISSUES30| Uncertainty communication and understanding
PRACTICAL ISSUES31| Ungauged sites
PRACTICAL ISSUES32| Ungauged sites
Development of a gridded short duration maximum precipitation dataset for the Canadian landmass Methodology for historical data 10 km grid Mean annual precipitation, maximum annual precipitation, and
mean annual convective available potential energy - regression with 24, 12, 6, 2, 1 hour, 30, 15, 10, 5 minute precipitation
Linear Regression (LR), Quantile Regression (QR) and Generalized Additive Model (GAM)
Evaluations based on RMSE, precipitation distribution and trend Tested using 526 stations Climate Dynamics - under review
Implementation with the climate change projections
PRACTICAL ISSUES33| Ungauged sites
GUIDELINES34| Major transformation
From codes and standards to process-based engineering
From risk to resilience
GUIDELINES35| Major transformation
From codes and standards to process-based engineering Systems analysis Probabilistic approach replaced with system simulation Understanding system structure and relationships that result in
system performance
GUIDELINES36| Major transformation
From risk to resilience Quantitative description of system performance in response to
changing conditions
CONCLUSIONS37|
There is a clear practical need for updating IDF relationships for climate change
Challenges in projecting precipitation extremes remain
Use of the IDF_CC tool is a recommended option The Clausius-Clapeyron scaling rate (7% per 0C) clearly does not apply for
stations used in this study and should not be arbitrarily applied to derive IDF curves for future
The IDF_CC better captures uncertainty from the GCMs
Recommendations Use the IDF_CC tool – live with the process uncertainty
Move from risk based decision making to process based engineering
Switch from risk to resilience
RESOURCES38|
Choice of distribution Millington, N., S. Das, and S.P. Simonovic (2011). The Comparison of GEV, Log-Pearson
Type 3 and Gumbel Distributions in the Upper Thames River Watershed under Global Climate Models. Water Resources Research Report no. 077, Facility for Intelligent Decision Support, Department of Civil and Environmental Engineering, London, Ontario, Canada, 53 pages. 85.
Solaiman, T.A. and S.P. Simonovic (2011). Development of Probability Based Intensity-Duration-Frequency Curves under Climate Change. Water Resources Research Report no. 072, Facility for Intelligent Decision Support, Department of Civil and Environmental Engineering, London, Ontario, Canada, 89 pages.
Solaiman, T.A., S. P. Simonovic, and D. H. Burn, (2012) “Quantifying Uncertainties in the Modelled Estimates of Extreme Precipitation Events at Upper Thames River Basin”, British Journal of Environment and Climate Change, 2(2):180-215.
Das, S., N. Millington, and S. P. Simonovic, (2013) “Distribution Choice for the Assessment of Design Rainfall for the City of London (Ontario, Canada) under Climate Change”, Canadian Journal of Civil Engineering, 40(2):121-129.
RESOURCES39| IDF_CC tool
Srivastav, R.K., A. Schardong and S.P. Simonovic, (2014) “Equidistance Quantile Matching Method for Updating IDF Curves Under Climate Change”, Water Resources Management: An International Journal, 28(9): 2539-2562.
Schardong, A., R. K. Srivastav and S. P. Simonovic (2014). Computerized Tool for the Development of Intensity-Duration-Frequency Curves under a Changing Climate: Users Manual v.1 Water Resources Research Report no. 088, Facility for Intelligent Decision Support, Department of Civil and Environmental Engineering, London, Ontario, Canada, 68 pages
Srivastav, R.K., A. Schardong and S. P. Simonovic (2014). Computerized Tool for the Development of Intensity-Duration-Frequency Curves under a Changing Climate: Technical Manual v.1 Water Resources Research Report no. 089, Facility for Intelligent Decision Support, Department of Civil and Environmental Engineering, London, Ontario, Canada, 62 pages
Simonovic, S.P., A. Schardong, D. Sandink, and R. Srivastav, (2016) “A Web-based Tool for the Development of Intensity Duration Frequency Curves under Changing Climate”, Environmental Modelling & Software Journal, 81:136-153.
Sandink, D., S.P. Simonovic, A. Schardong, and R. Srivastav, (2016) “A Decision Support System for Updating and Incorporating Climate Change Impacts into Rainfall Intensity-Duration-Frequency Curves: Review of the Stakeholder Involvement Process”, Environmental Modelling & Software Journal, 84:193-209.
Simonovic, S.P, A. Schardong, and D. Sandink, (2016) “Mapping Extreme Rainfall Statistics for Canada Under Climate Change Using Updated Intensity-Duration-Frequency Curves”, ASCE Journal of Water Resources Planning and Management. Available online at http://dx.doi.org/10.1061/(ASCE)WR.1943-5452.0000725
RESOURCES40|
Resilience Simonovic, S.P., and A. Peck, (2013) "Dynamic Resilience to Climate Change Caused
Natural Disasters in Coastal Megacities - Quantification Framework", British Journal of Environment and Climate Change, 3(3): 378-401.
Simonovic, S.P. (2016) “From risk management to quantitative disaster resilience: a paradigm shift”, International Journal of Safety and Security Engineering, 6(2):85-95.
Irwin, S., A. Schardong, S.P. Simonovic, and N. Nirupama, (2016) “ResilSIM - A Decision Support Tool for Estimating Resilience of Urban Systems”, Water – special issue Hydroinformatics and Urban Water Systems, 8(377):1-25.
Simonovic, S.P., and R. Arunkumar, (2016) “Comparison of static and dynamic resilience for a multi-purpose reservoir operation”, Water Resources Research, 52, online first doi:10.1002/2016WR019551.
Kong, J., and S. P. Simonovic (2016), “An original model of infrastructure system resilience”, Proceedings, CSCE Annual Meeting: Resilient Infrastructure, NDM515-1 –NDM515-10, June 1-4, London, Canada.
RESOURCES41|
www.slobodansimonovic.com
Research -> Publications
FIDS -> Products -> Water Resources Research Reports