46
National Interface Mapping for Canada ICLR Friday Forum Webinar February 17, 2017
| Date post: | 20-Mar-2017 |
| Category: |
Education |
| Upload: | glennmcgillivray |
| View: | 108 times |
| Download: | 1 times |
National Interface Mapping for Canada
ICLR Friday Forum WebinarFebruary 17, 2017
2
© Her Majesty the Queen in Right of Canada, as represented by the Minister of Natural Resources, 2016

3
© Her Majesty the Queen in Right of Canada, as represented by the Minister of Natural Resources, 2016
Data: National Fire Database
Wildland Fire BackgroundYearly average:
7000+ fires
2.5 million ha
but…by area human (15%) vs. lightning (85%)
Fire causes:
Human (65%) vs. lightning (35%)

4
© Her Majesty the Queen in Right of Canada, as represented by the Minister of Natural Resources, 2016
Fuels
5
© Her Majesty the Queen in Right of Canada, as represented by the Minister of Natural Resources, 2016
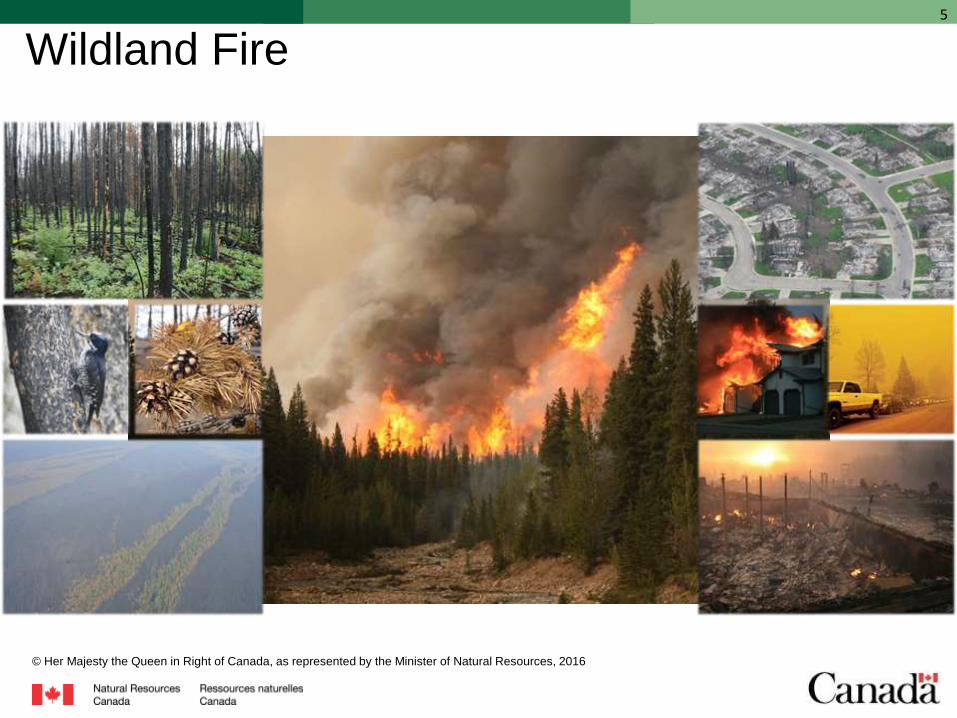
Wildland Fire

6
© Her Majesty the Queen in Right of Canada, as represented by the Minister of Natural Resources, 2016
Evacuations
Data: Beverly and Bothwell(2011)

7
© Her Majesty the Queen in Right of Canada, as represented by the Minister of Natural Resources, 2016
Structure Ignition

8
© Her Majesty the Queen in Right of Canada, as represented by the Minister of Natural Resources, 2016
Fire Mitigation

9
© Her Majesty the Queen in Right of Canada, as represented by the Minister of Natural Resources, 2016
Fire Management
10
© Her Majesty the Queen in Right of Canada, as represented by the Minister of Natural Resources, 2016
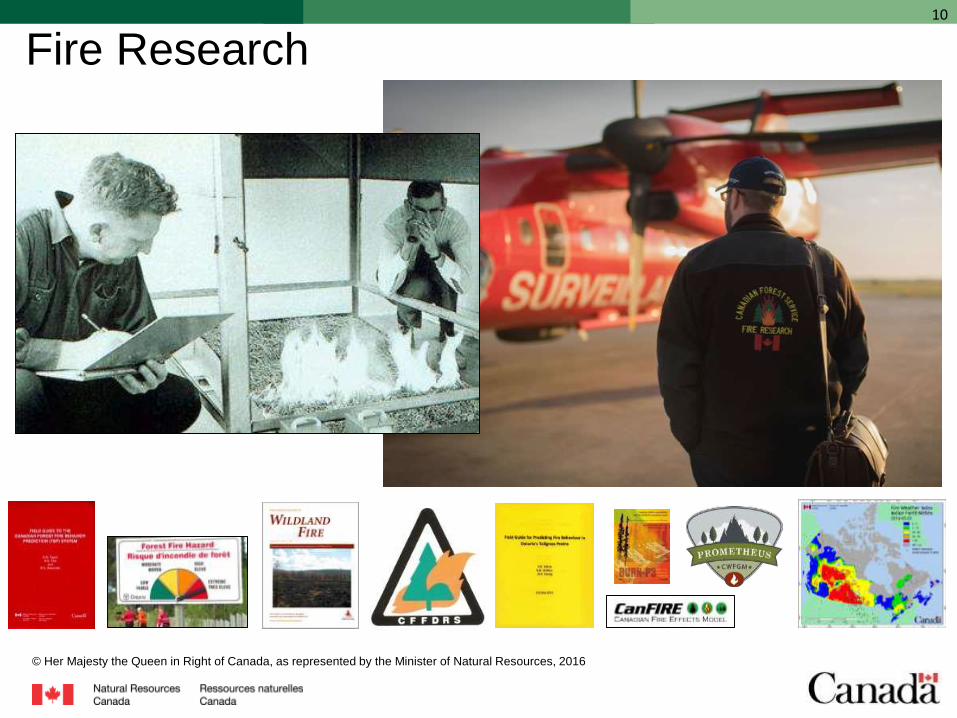
Fire Research

11
© Her Majesty the Queen in Right of Canada, as represented by the Minister of Natural Resources, 2016
Knowledge Gap
Where are we most
vulnerable/at risk to wildfire?
?

12
© Her Majesty the Queen in Right of Canada, as represented by the Minister of Natural Resources, 2016
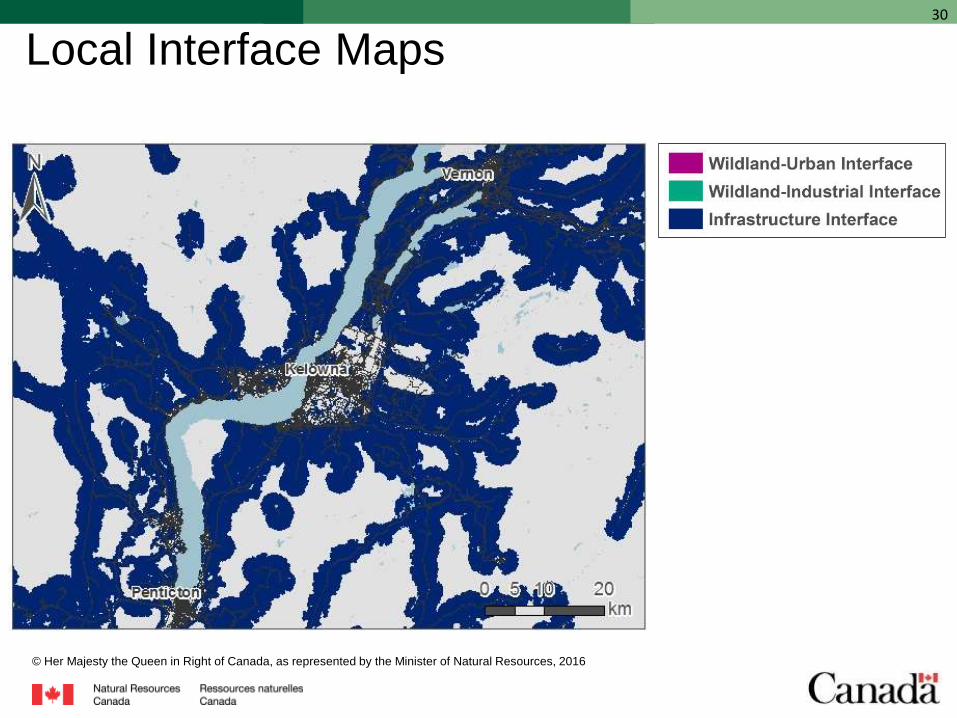
Wildland-Urban Interface
Infrastructure InterfaceIndustrial Interface
Wildland-Urban Interface
13
© Her Majesty the Queen in Right of Canada, as represented by the Minister of Natural Resources, 2016
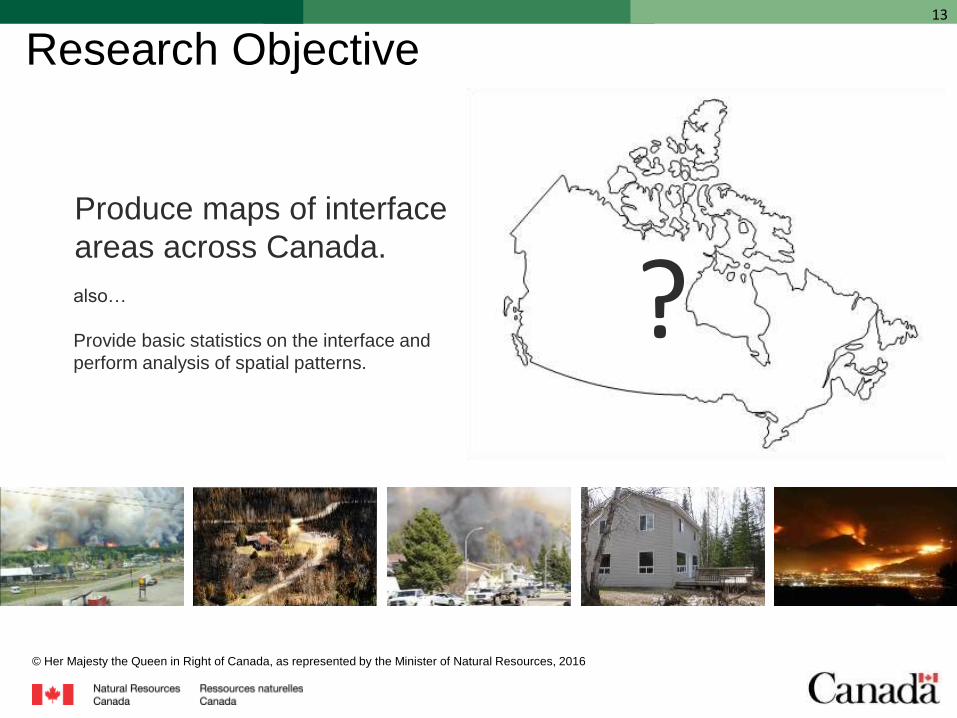
Research Objective
Produce maps of interface
areas across Canada.
?also…
Provide basic statistics on the interface and
perform analysis of spatial patterns.

14
© Her Majesty the Queen in Right of Canada, as represented by the Minister of Natural Resources, 2016
Interface Maps
15
© Her Majesty the Queen in Right of Canada, as represented by the Minister of Natural Resources, 2016
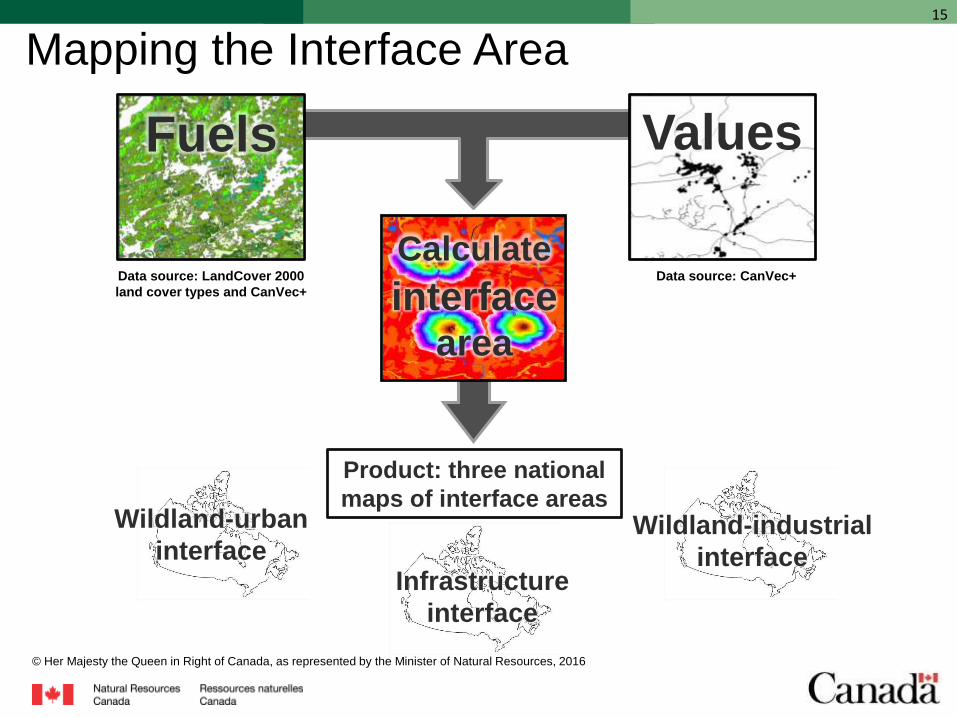
Mapping the Interface Area
Fuels Values
Calculate
interface area
Infrastructure
interface
Wildland-industrial
interface
Wildland-urban
interface
Product: three national
maps of interface areas
Data source: LandCover 2000
land cover types and CanVec+
Data source: CanVec+

16
© Her Majesty the Queen in Right of Canada, as represented by the Minister of Natural Resources, 2016
Fuels and values:
Contains information licensed under the Open Government Licence –Canada.

17
© Her Majesty the Queen in Right of Canada, as represented by the Minister of Natural Resources, 2016
Cost distance:
Fuel Weight
1
2
3
4
5
6
7
10
Contains information licensed under the Open Government Licence –Canada.
18
© Her Majesty the Queen in Right of Canada, as represented by the Minister of Natural Resources, 2016
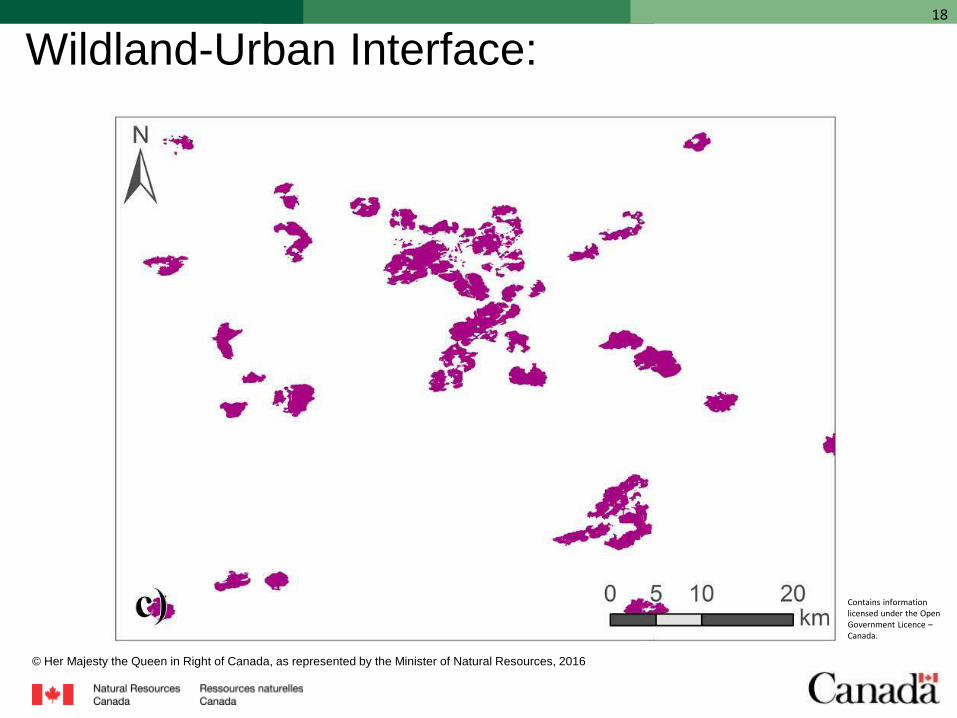
Wildland-Urban Interface:
Contains information licensed under the Open Government Licence –Canada.

19
© Her Majesty the Queen in Right of Canada, as represented by the Minister of Natural Resources, 2016
Interface Maps
116.5million hectares

20
© Her Majesty the Queen in Right of Canada, as represented by the Minister of Natural Resources, 2016
Interface Maps
32.3million hectares
21
© Her Majesty the Queen in Right of Canada, as represented by the Minister of Natural Resources, 2016
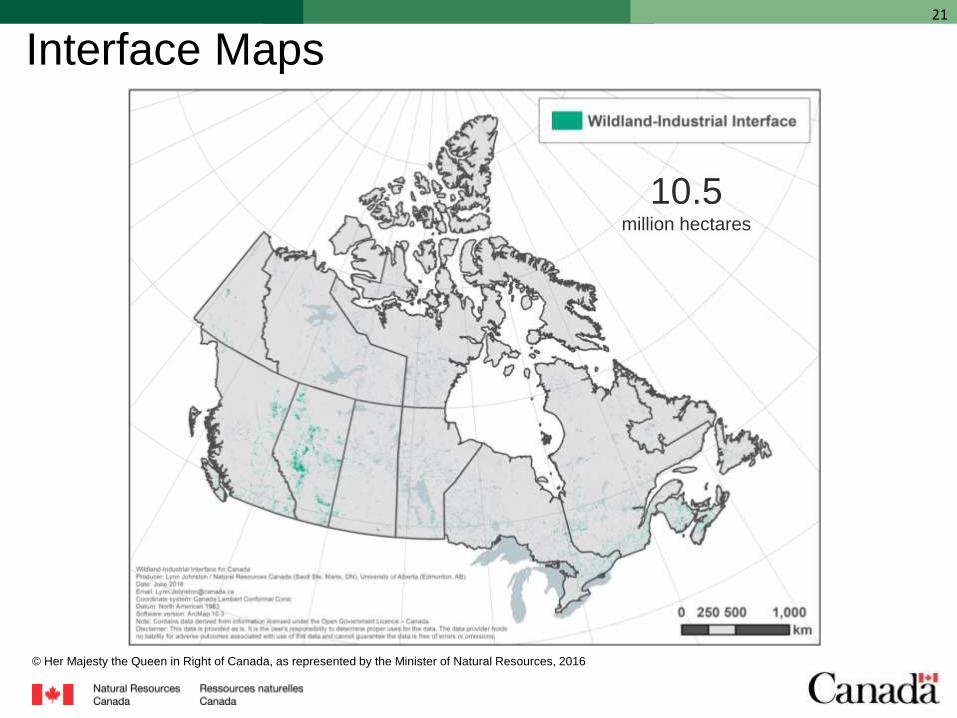
Interface Maps
10.5million hectares
22
© Her Majesty the Queen in Right of Canada, as represented by the Minister of Natural Resources, 2016
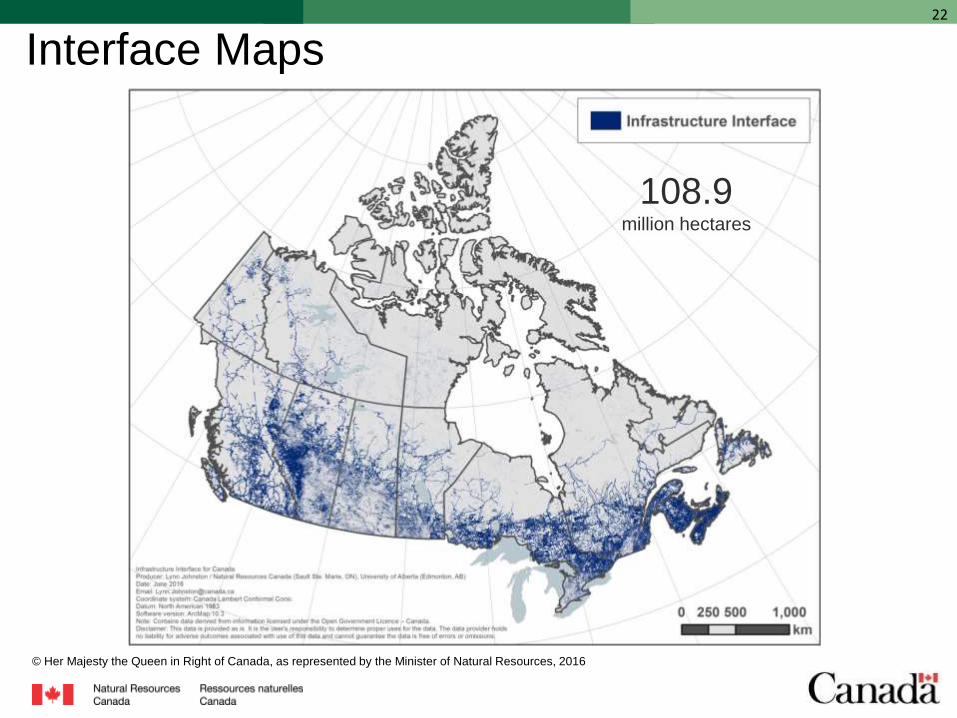
Interface Maps
108.9million hectares
23
© Her Majesty the Queen in Right of Canada, as represented by the Minister of Natural Resources, 2016
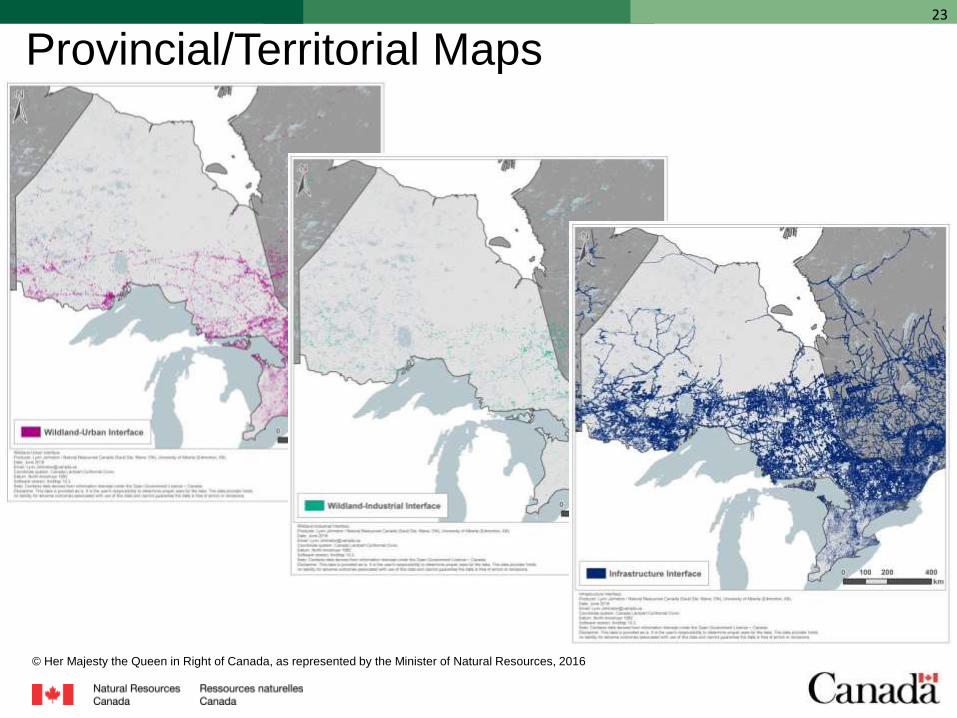
Provincial/Territorial Maps
24
© Her Majesty the Queen in Right of Canada, as represented by the Minister of Natural Resources, 2016
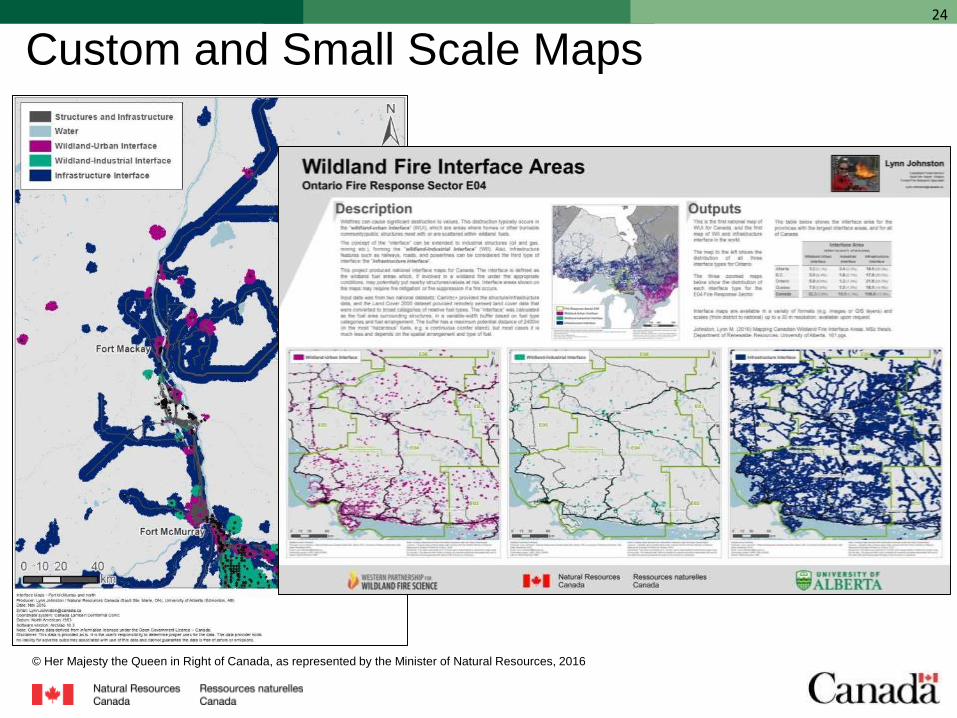
Custom and Small Scale Maps

25
© Her Majesty the Queen in Right of Canada, as represented by the Minister of Natural Resources, 2016
Local Interface Maps

26
© Her Majesty the Queen in Right of Canada, as represented by the Minister of Natural Resources, 2016
Local Interface Maps

27
© Her Majesty the Queen in Right of Canada, as represented by the Minister of Natural Resources, 2016
Local Interface Maps
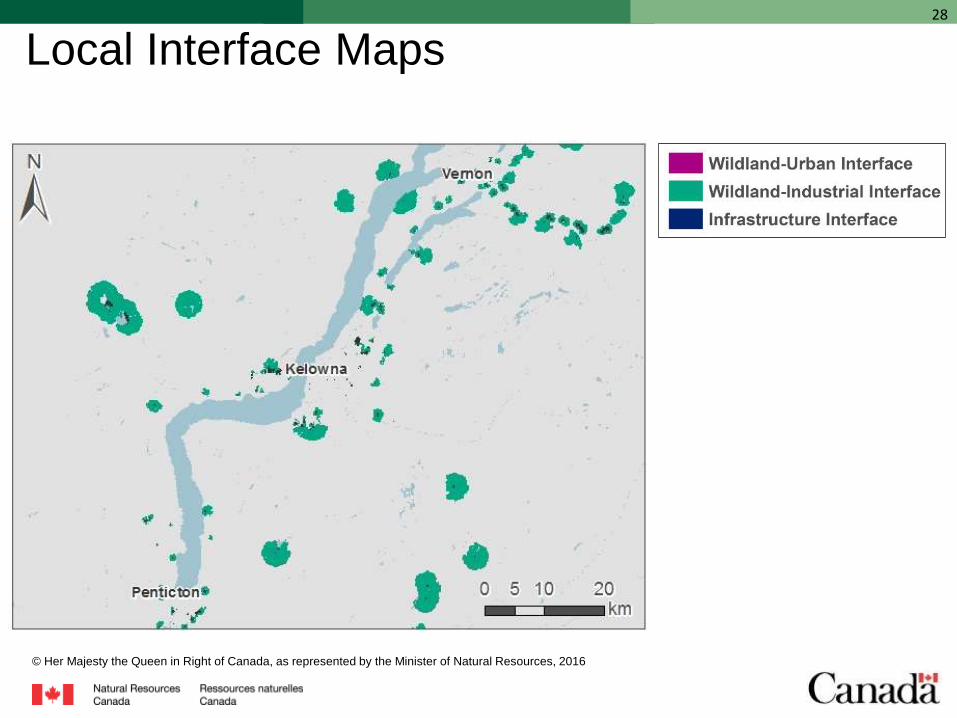
28
© Her Majesty the Queen in Right of Canada, as represented by the Minister of Natural Resources, 2016
Local Interface Maps

29
© Her Majesty the Queen in Right of Canada, as represented by the Minister of Natural Resources, 2016
Local Interface Maps
30
© Her Majesty the Queen in Right of Canada, as represented by the Minister of Natural Resources, 2016
Local Interface Maps

31
© Her Majesty the Queen in Right of Canada, as represented by the Minister of Natural Resources, 2016
Local Interface Maps

32
© Her Majesty the Queen in Right of Canada, as represented by the Minister of Natural Resources, 2016
Provincial/territorial Choropleth Maps

33
© Her Majesty the Queen in Right of Canada, as represented by the Minister of Natural Resources, 2016
Fuels
Burnable wildland fuels: 562 million hectares
= 67% of total land area
Wildland FuelsRelative Fuel Weight
1234567

34
© Her Majesty the Queen in Right of Canada, as represented by the Minister of Natural Resources, 2016
6% of burnable wildland fuel is
wildland-urban interface
2% of burnable wildland fuel is
wildland-industrial interface
Fuels
20% of burnable wildland fuel is
infrastructure interface
Wildland FuelsRelative Fuel Weight
1234567
35
© Her Majesty the Queen in Right of Canada, as represented by the Minister of Natural Resources, 2016
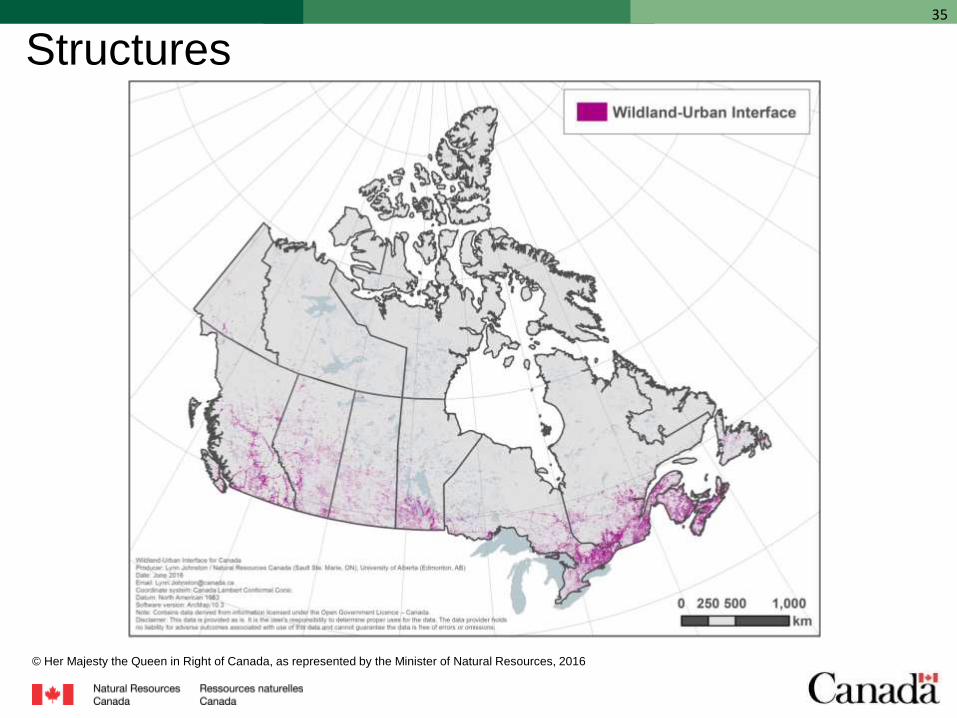
Structures

36
© Her Majesty the Queen in Right of Canada, as represented by the Minister of Natural Resources, 2016
Structures
Of all “Populated Places” across Canada…
60%have at least 500 hectares of
wildland-urban interface within 5 km
37
© Her Majesty the Queen in Right of Canada, as represented by the Minister of Natural Resources, 2016
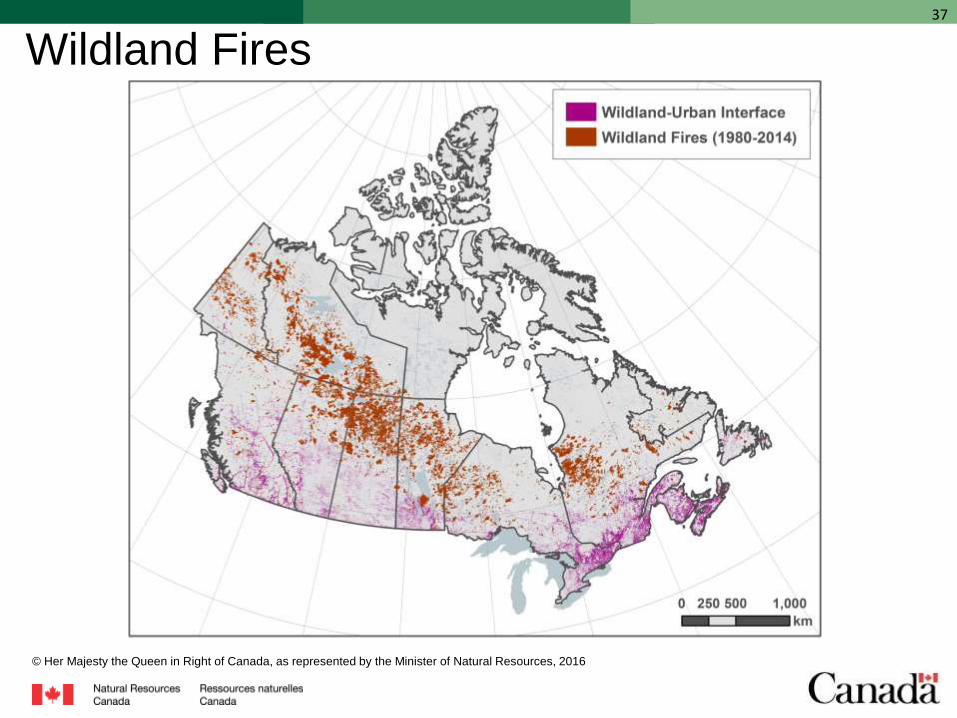
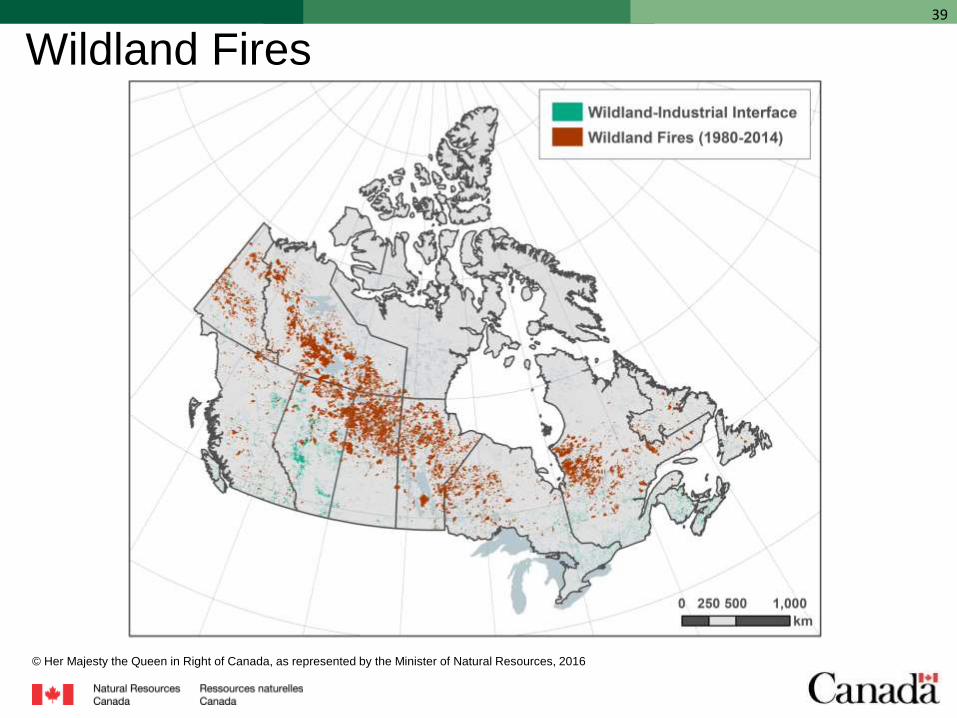
Wildland Fires
38
© Her Majesty the Queen in Right of Canada, as represented by the Minister of Natural Resources, 2016
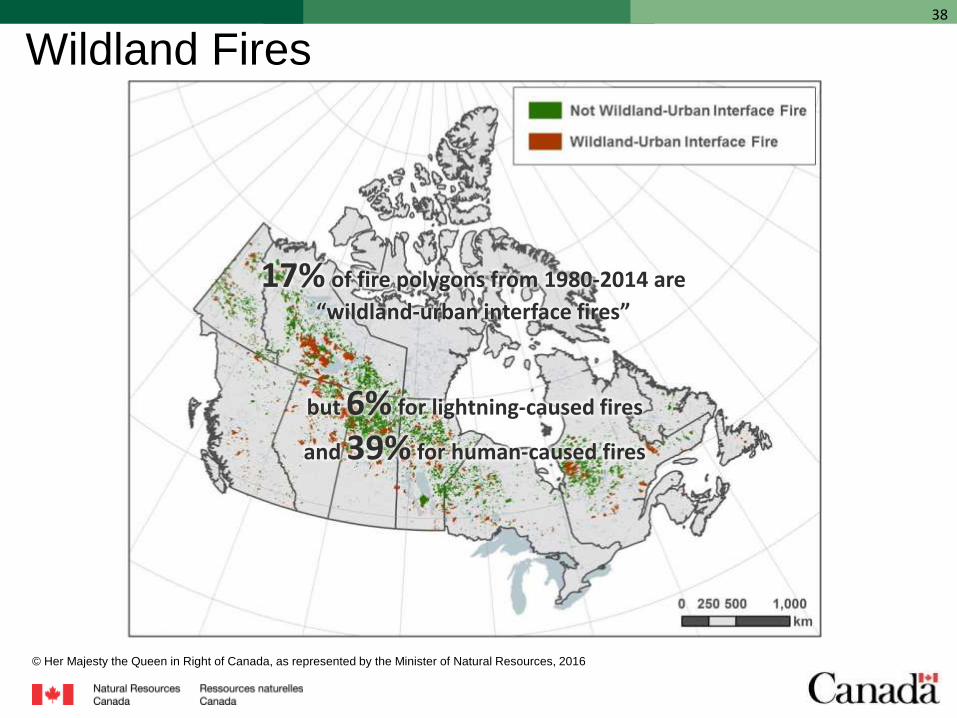
Wildland Fires
17% of fire polygons from 1980-2014 are
“wildland-urban interface fires”
but 6% for lightning-caused fires
and 39% for human-caused fires
39
© Her Majesty the Queen in Right of Canada, as represented by the Minister of Natural Resources, 2016
Wildland Fires

40
© Her Majesty the Queen in Right of Canada, as represented by the Minister of Natural Resources, 2016
Wildland Fires
6% of fire polygons from 1980-2014 are
“wildland-industrial interface fires”
but 3% for lightning-caused fires
and 12% for human-caused fires

41
© Her Majesty the Queen in Right of Canada, as represented by the Minister of Natural Resources, 2016
Wildland Fires

42
© Her Majesty the Queen in Right of Canada, as represented by the Minister of Natural Resources, 2016
Wildland Fires
38% of fire polygons from 1980-2014 are
“infrastructure interface fires”
but 25% for lightning-caused fires
and 65% for human-caused fires

43
© Her Majesty the Queen in Right of Canada, as represented by the Minister of Natural Resources, 2016
Risk
Future Work
Fire Risk in Interface Areas Change Detection and
Future PredictionInterface
Areas
FWI
Ignition
Probability
FBP
Detailed fuel information
Structure Value/Potential
Loss
Suppression/ Values Protection
Capacity
Structure Ignition
Historic
Fires
Homogenous
Fire Regime
Zones (HFZ)
Topography
Burn
Probability
44
© Her Majesty the Queen in Right of Canada, as represented by the Minister of Natural Resources, 2016
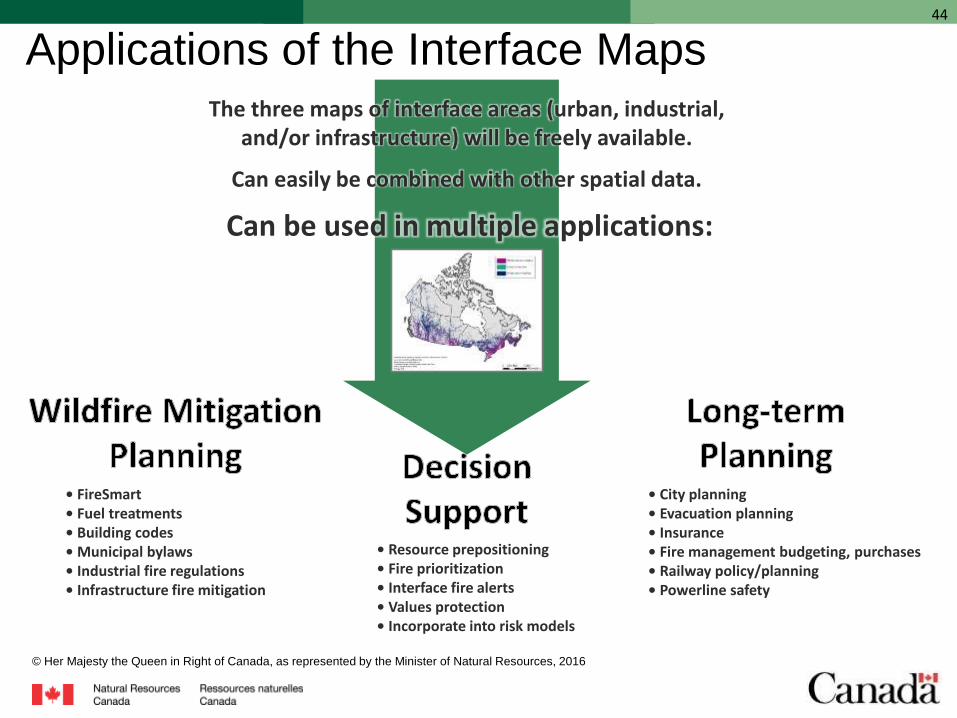
Applications of the Interface MapsThe three maps of interface areas (urban, industrial,
and/or infrastructure) will be freely available.
Can easily be combined with other spatial data.
Can be used in multiple applications:
• FireSmart• Fuel treatments• Building codes• Municipal bylaws• Industrial fire regulations• Infrastructure fire mitigation
• Resource prepositioning • Fire prioritization• Interface fire alerts• Values protection• Incorporate into risk models
• City planning• Evacuation planning• Insurance• Fire management budgeting, purchases• Railway policy/planning• Powerline safety
45
© Her Majesty the Queen in Right of Canada, as represented by the Minister of Natural Resources, 2016
Thank You!
Mike FlanniganTara McGeeJen BeverlyKelsy Gibos
Canadian Forest Service
Joshua JohnstonXianli WangFrancois RobinneKaren BlouinLaura GrayEmily TuomiJeremy JohnstonBrian Wiens

46
© Her Majesty the Queen in Right of Canada, as represented by the Minister of Natural Resources, 2016
Questions?


![Wildfires and insurance - ICLR · Microsoft PowerPoint - 2002 May slides for wildfire speech.ppt [Compatibility Mode] Author: User Created Date: 7/7/2008 11:10:09 AM ...](https://static.documents.pub/doc/80x56/5fffe5d3574391752161b216/wildfires-and-insurance-iclr-microsoft-powerpoint-2002-may-slides-for-wildfire.jpg)


