APPLICATION NOTE Authors: Deborah K Bradshaw Atomic Spectroscopy Training and Consulting Laura Thompson PerkinElmer, Inc. Shelton, CT Introduction The prevention and control of water pollution is of critical importance to protecting human and environmental health. Monitoring of water and wastes is an efficacious way to prevent the introduction of pollutants and costly remediation of drinking and environmentally important waters. The United States Environmental Protection Agency (U.S. EPA), along with local regulatory bodies, is responsible for regulating water and wastes under the Clean Water Act and the Safe Drinking Water Act. Depending on the number and type of analytes, the number of samples and the productivity requirements, several different analytical techniques can be applied to measure trace elements in water and wastes. U.S. EPA Method 200.7 Version 4.4 covers the use of inductively coupled plasma optical emission spectroscopy (ICP-OES) in radial and/or axial viewing for the determination of metals and some non-metals in water and wastes for regulatory compliance. 1 Method 200.7 contains a lengthy description of procedures for the collection, preservation and preparation of samples for analysis. The objective of this work was to complete the method using the PerkinElmer ® Optima ® 8300 ICP-OES coupled with the prepFAST™ Automated In-Line Auto-Dilution/Calibration System (Elemental Scientific Inc., Omaha, NE). The Analysis of Water and Wastes by U.S. EPA Method 200.7 Using the Optima 8300 ICP-OES and prepFAST Auto-Dilution/ Calibration System ICP-Optical Emission Spectroscopy
Transcript
A P P L I C A T I O N N O T E
Authors:Deborah K Bradshaw
Atomic Spectroscopy Training and Consulting
Laura Thompson
PerkinElmer, Inc. Shelton, CT
Introduction
The prevention and control of water pollution is of critical importance to protecting human and environmental health. Monitoring of water and wastes is an efficacious way to prevent the introduction of pollutants and costly remediation of drinking and environmentally
important waters. The United States Environmental Protection Agency (U.S. EPA), along with local regulatory bodies, is responsible for regulating water and wastes under the Clean Water Act and the Safe Drinking Water Act. Depending on the number and type of analytes, the number of samples and the productivity requirements, several different analytical techniques can be applied to measure trace elements in water and wastes.
U.S. EPA Method 200.7 Version 4.4 covers the use of inductively coupled plasma optical emission spectroscopy (ICP-OES) in radial and/or axial viewing for the determination of metals and some non-metals in water and wastes for regulatory compliance.1 Method 200.7 contains a lengthy description of procedures for the collection, preservation and preparation of samples for analysis. The objective of this work was to complete the method using the PerkinElmer® Optima® 8300 ICP-OES coupled with the prepFAST™ Automated In-Line Auto-Dilution/Calibration System (Elemental Scientific Inc., Omaha, NE).
The Analysis of Water and Wastes by U.S. EPA Method 200.7 Using the Optima 8300 ICP-OES and prepFAST Auto-Dilution/Calibration System
ICP-Optical Emission Spectroscopy
2
The prepFAST™ system provides a number of advantages over conventional ICP-OES introduction systems, the most significant of which is higher sample throughput and reduced memory effects. The prepFAST™ system allows accurate, syringe-driven auto dilution of samples and standards, eliminating manual dilution errors and increasing calibration range. Reducing costly high-purity reagent and sample consumption, the prepFAST™ Auto-Dilution/Calibration System is one of the best ways to improve laboratory productivity.
Summary of Method 200.7
The direct analysis of samples was performed according to Method 200.7. For samples that require total recoverable analysis, refer to section 11.2 of EPA Method 200.7 rev 4.4. Below is a summary of the steps required for compliance with EPA 200.7 revision 4.4.
1) For direct analysis (samples with < 1 NTU), dilute, if necessary, to an appropriate volume and preserve samples to a pH < 2 with ultrapure HNO3.
2) Optimize the instrument using the plasma solution (section 10.2.3) after allowing 15-30 minutes for the plasma to stabilize to the environment.
3) Calibrate the instrument using at least one blank and one calibration standard.
4) Run the instrument performance check (IPC sample) immediately following daily calibration and verify its recovery within 5%. The IPC should also be run after every 10th sample and at the end of a sample run and recovered within 10%.
5) Prepare an inter-element correction (IEC) table, if necessary, and analyze the spectral interference check (SIC) solution to verify lack of spectral interferents in the method. This should be repeated on a periodic basis.
6) Perform the initial demonstration of performance (IDP)
a. Instrument detection limit (IDL) – Calculated as 3x the standard deviation of 10 replicate measurements of the calibration blank.
b. Method detection limit (MDL) – Calculated as 3.14x the standard deviation of seven replicate aliquots of fortified (2-3x estimated IDL) reagent water.
c. Quality control sample (QCS) – Prepared from a second source. Verify that the mean concentration of three analyses is recovered within 5%. Also run QCS quarterly or after new calibration standards are made.
d. Linear dynamic range (LDR) – Analyze successively higher standard concentrations until they return 90% of the stated concentration based on a typical standard curve. Verify annually.
7) Laboratory reagent blank (LRB) – Analyze one every 20 samples. Should be below MDL.
8) Laboratory fortified blank (LFB) – Analyze one with each batch of samples. Verify within 85-115% recovery.
9) Laboratory fortified matrix (LFM) – Spike 10% of the samples prior to sample prep. Verify within 70-130% recovery. Concentration should be ≥ 30% of background concentration.
10) Reference materials – Should be run when available.
Experimental Conditions
Instrumentation
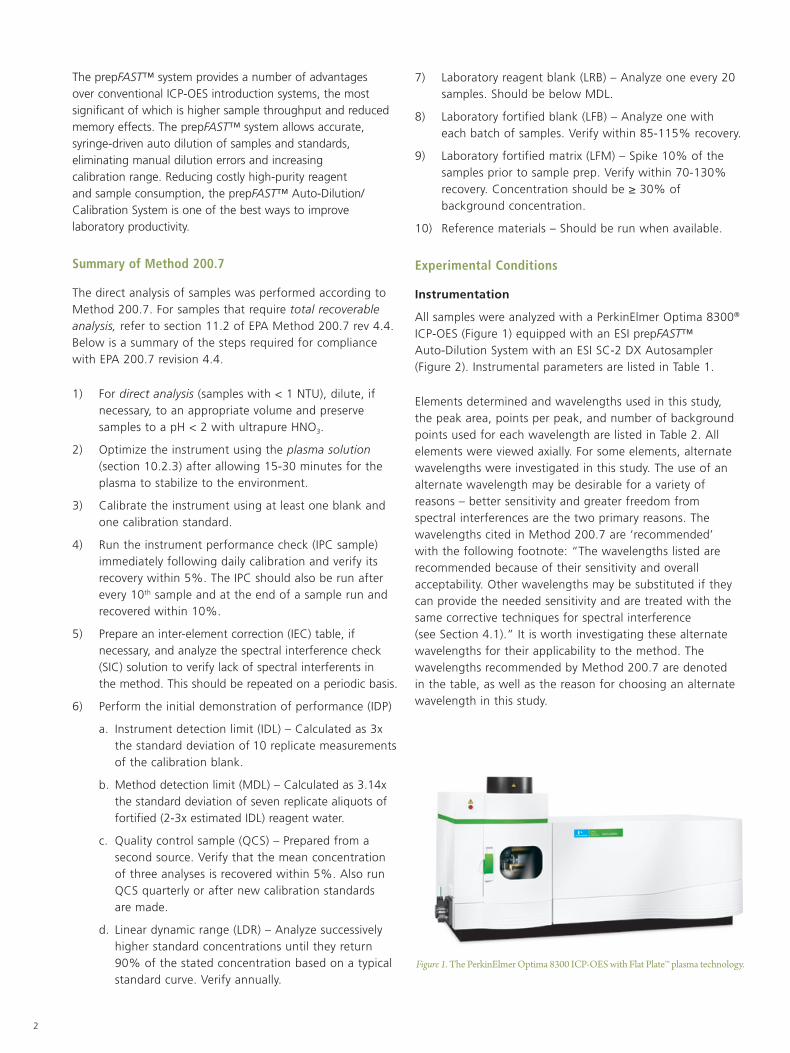
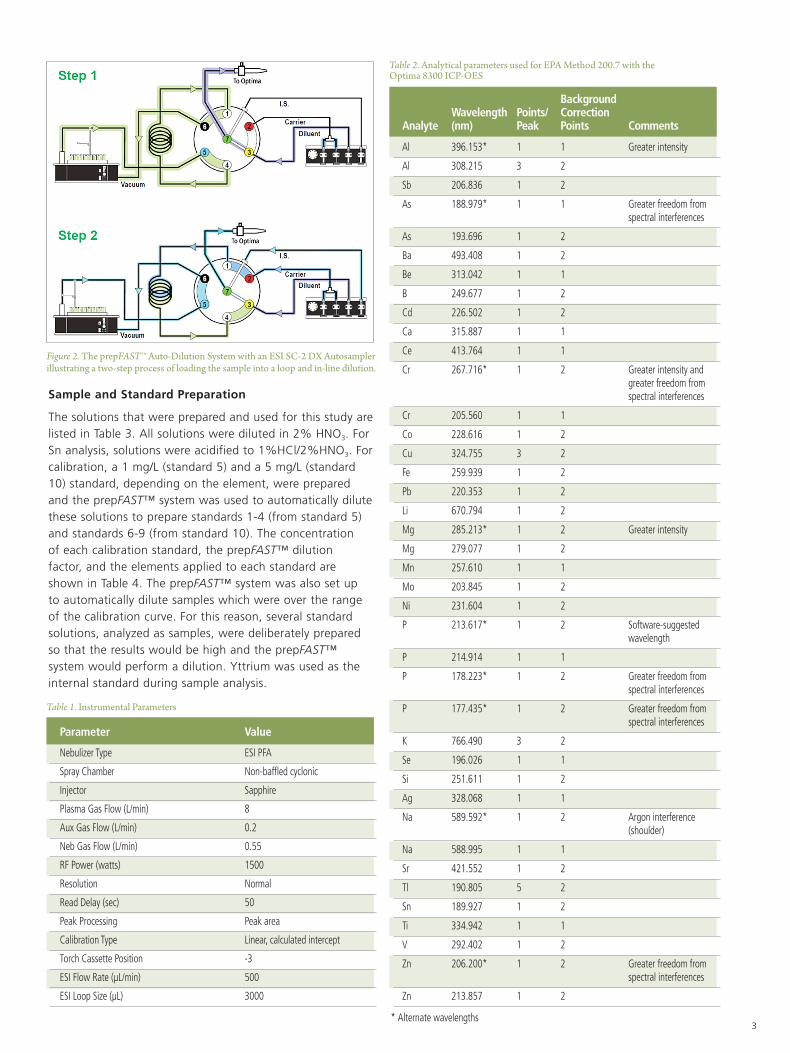
All samples were analyzed with a PerkinElmer Optima 8300® ICP-OES (Figure 1) equipped with an ESI prepFAST™ Auto-Dilution System with an ESI SC-2 DX Autosampler (Figure 2). Instrumental parameters are listed in Table 1.
Elements determined and wavelengths used in this study, the peak area, points per peak, and number of background points used for each wavelength are listed in Table 2. All elements were viewed axially. For some elements, alternate wavelengths were investigated in this study. The use of an alternate wavelength may be desirable for a variety of reasons – better sensitivity and greater freedom from spectral interferences are the two primary reasons. The wavelengths cited in Method 200.7 are ‘recommended’ with the following footnote: “The wavelengths listed are recommended because of their sensitivity and overall acceptability. Other wavelengths may be substituted if they can provide the needed sensitivity and are treated with the same corrective techniques for spectral interference (see Section 4.1).” It is worth investigating these alternate wavelengths for their applicability to the method. The wavelengths recommended by Method 200.7 are denoted in the table, as well as the reason for choosing an alternate wavelength in this study.
Figure 1. The PerkinElmer Optima 8300 ICP-OES with Flat Plate™ plasma technology.
3
Sample and Standard Preparation
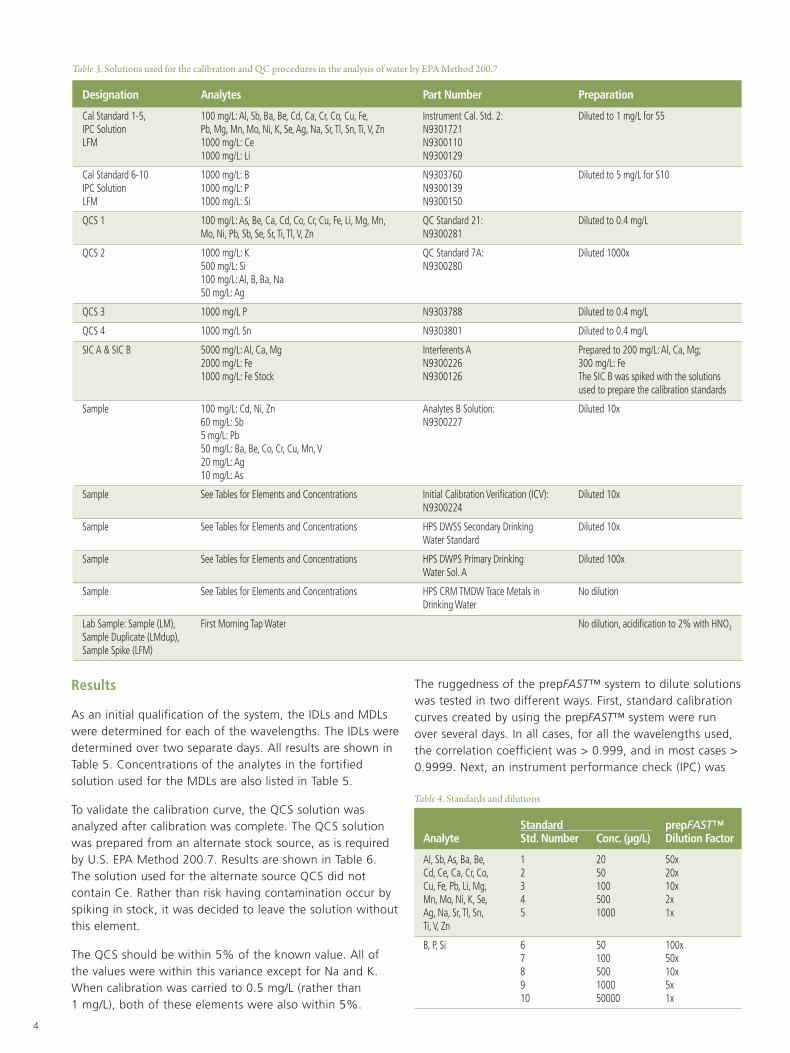
The solutions that were prepared and used for this study are listed in Table 3. All solutions were diluted in 2% HNO3. For Sn analysis, solutions were acidified to 1%HCl/2%HNO3. For calibration, a 1 mg/L (standard 5) and a 5 mg/L (standard 10) standard, depending on the element, were prepared and the prepFAST™ system was used to automatically dilute these solutions to prepare standards 1-4 (from standard 5) and standards 6-9 (from standard 10). The concentration of each calibration standard, the prepFAST™ dilution factor, and the elements applied to each standard are shown in Table 4. The prepFAST™ system was also set up to automatically dilute samples which were over the range of the calibration curve. For this reason, several standard solutions, analyzed as samples, were deliberately prepared so that the results would be high and the prepFAST™ system would perform a dilution. Yttrium was used as the internal standard during sample analysis.
Table 2. Analytical parameters used for EPA Method 200.7 with the Optima 8300 ICP-OES
As 188.979* 1 1 Greater freedom from spectral interferences
As 193.696 1 2
Ba 493.408 1 2
Be 313.042 1 1
B 249.677 1 2
Cd 226.502 1 2
Ca 315.887 1 1
Ce 413.764 1 1
Cr 267.716* 1 2 Greater intensity and greater freedom from spectral interferences
Cr 205.560 1 1
Co 228.616 1 2
Cu 324.755 3 2
Fe 259.939 1 2
Pb 220.353 1 2
Li 670.794 1 2
Mg 285.213* 1 2 Greater intensity
Mg 279.077 1 2
Mn 257.610 1 1
Mo 203.845 1 2
Ni 231.604 1 2
P 213.617* 1 2 Software-suggested wavelength
P 214.914 1 1
P 178.223* 1 2 Greater freedom from spectral interferences
P 177.435* 1 2 Greater freedom from spectral interferences
K 766.490 3 2
Se 196.026 1 1
Si 251.611 1 2
Ag 328.068 1 1
Na 589.592* 1 2 Argon interference (shoulder)
Na 588.995 1 1
Sr 421.552 1 2
Tl 190.805 5 2
Sn 189.927 1 2
Ti 334.942 1 1
V 292.402 1 2
Zn 206.200* 1 2 Greater freedom from spectral interferences
Zn 213.857 1 2
Table 1. Instrumental Parameters
Parameter Value
Nebulizer Type ESI PFA
Spray Chamber Non-baffled cyclonic
Injector Sapphire
Plasma Gas Flow (L/min) 8
Aux Gas Flow (L/min) 0.2
Neb Gas Flow (L/min) 0.55
RF Power (watts) 1500
Resolution Normal
Read Delay (sec) 50
Peak Processing Peak area
Calibration Type Linear, calculated intercept
Torch Cassette Position -3
ESI Flow Rate (μL/min) 500
ESI Loop Size (μL) 3000
* Alternate wavelengths
Figure 2. The prepFAST™ Auto-Dilution System with an ESI SC-2 DX Autosampler illustrating a two-step process of loading the sample into a loop and in-line dilution.
4
Table 3. Solutions used for the calibration and QC procedures in the analysis of water by EPA Method 200.7
Designation Analytes Part Number Preparation
Cal Standard 1-5, 100 mg/L: Al, Sb, Ba, Be, Cd, Ca, Cr, Co, Cu, Fe, Instrument Cal. Std. 2: Diluted to 1 mg/L for S5 IPC Solution Pb, Mg, Mn, Mo, Ni, K, Se, Ag, Na, Sr, Tl, Sn, Ti, V, Zn N9301721 LFM 1000 mg/L: Ce N9300110 1000 mg/L: Li N9300129
Cal Standard 6-10 1000 mg/L: B N9303760 Diluted to 5 mg/L for S10 IPC Solution 1000 mg/L: P N9300139 LFM 1000 mg/L: Si N9300150
QCS 1 100 mg/L: As, Be, Ca, Cd, Co, Cr, Cu, Fe, Li, Mg, Mn, QC Standard 21: Diluted to 0.4 mg/L Mo, Ni, Pb, Sb, Se, Sr, Ti, Tl, V, Zn N9300281
QCS 2 1000 mg/L: K QC Standard 7A: Diluted 1000x 500 mg/L: Si N9300280 100 mg/L: Al, B, Ba, Na 50 mg/L: Ag
QCS 3 1000 mg/L P N9303788 Diluted to 0.4 mg/L
QCS 4 1000 mg/L Sn N9303801 Diluted to 0.4 mg/L
SIC A & SIC B 5000 mg/L: Al, Ca, Mg Interferents A Prepared to 200 mg/L: Al, Ca, Mg; 2000 mg/L: Fe N9300226 300 mg/L: Fe 1000 mg/L: Fe Stock N9300126 The SIC B was spiked with the solutions used to prepare the calibration standards
Sample 100 mg/L: Cd, Ni, Zn Analytes B Solution: Diluted 10x 60 mg/L: Sb N9300227 5 mg/L: Pb 50 mg/L: Ba, Be, Co, Cr, Cu, Mn, V 20 mg/L: Ag 10 mg/L: As
Sample See Tables for Elements and Concentrations Initial Calibration Verification (ICV): Diluted 10x N9300224
Sample See Tables for Elements and Concentrations HPS DWSS Secondary Drinking Diluted 10x Water Standard
Sample See Tables for Elements and Concentrations HPS DWPS Primary Drinking Diluted 100x Water Sol. A
Sample See Tables for Elements and Concentrations HPS CRM TMDW Trace Metals in No dilution Drinking Water
Lab Sample: Sample (LM), First Morning Tap Water No dilution, acidification to 2% with HNO3 Sample Duplicate (LMdup), Sample Spike (LFM)
Results
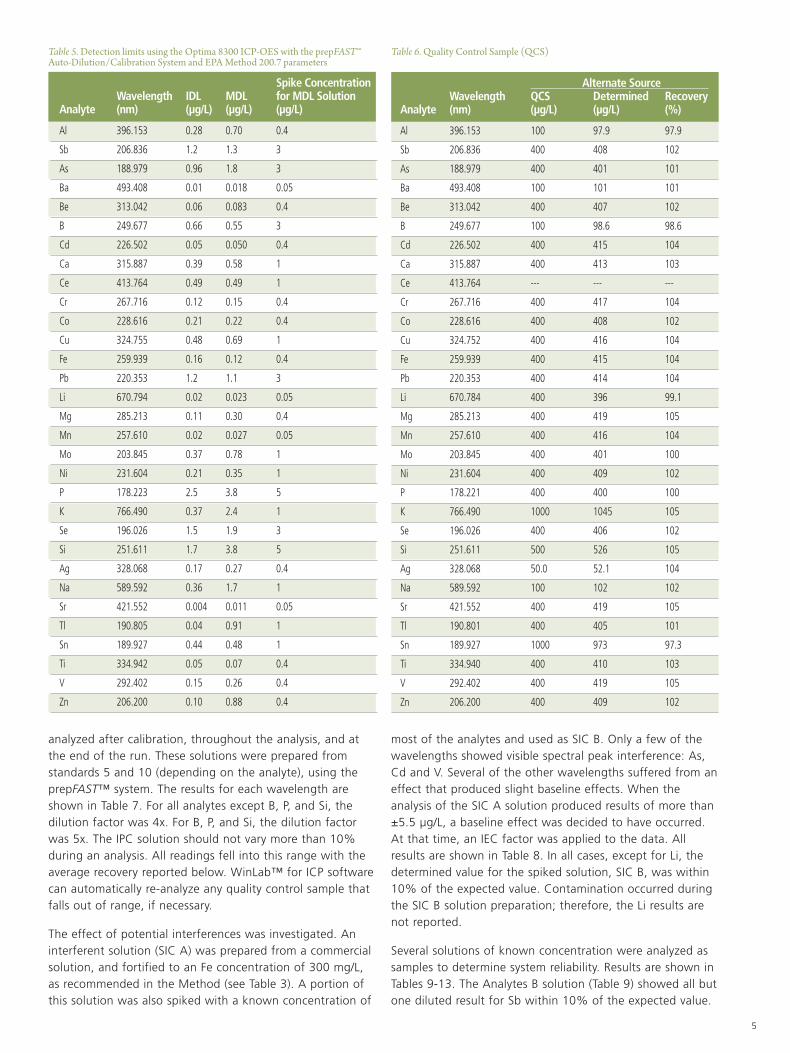
As an initial qualification of the system, the IDLs and MDLs were determined for each of the wavelengths. The IDLs were determined over two separate days. All results are shown in Table 5. Concentrations of the analytes in the fortified solution used for the MDLs are also listed in Table 5.
To validate the calibration curve, the QCS solution was analyzed after calibration was complete. The QCS solution was prepared from an alternate stock source, as is required by U.S. EPA Method 200.7. Results are shown in Table 6. The solution used for the alternate source QCS did not contain Ce. Rather than risk having contamination occur by spiking in stock, it was decided to leave the solution without this element.
The QCS should be within 5% of the known value. All of the values were within this variance except for Na and K. When calibration was carried to 0.5 mg/L (rather than 1 mg/L), both of these elements were also within 5%.
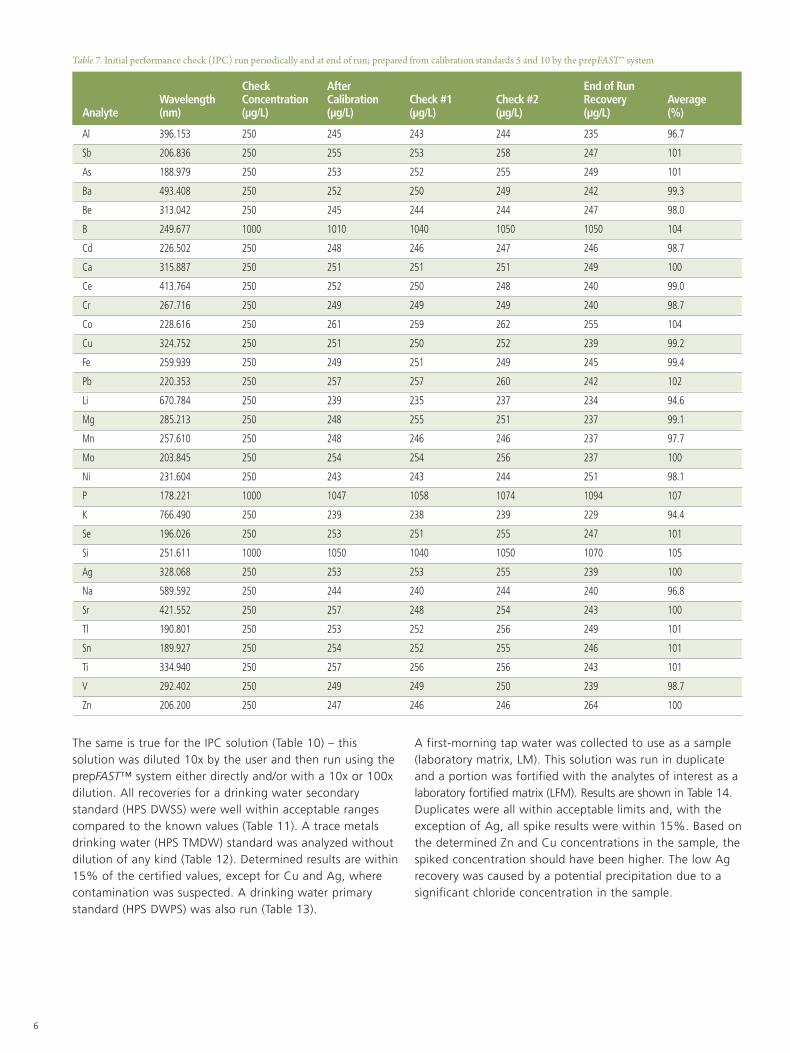
The ruggedness of the prepFAST™ system to dilute solutions was tested in two different ways. First, standard calibration curves created by using the prepFAST™ system were run over several days. In all cases, for all the wavelengths used, the correlation coefficient was > 0.999, and in most cases > 0.9999. Next, an instrument performance check (IPC) was
Table 4. Standards and dilutions
Standard prepFAST™ Analyte Std. Number Conc. (μg/L) Dilution Factor
analyzed after calibration, throughout the analysis, and at the end of the run. These solutions were prepared from standards 5 and 10 (depending on the analyte), using the prepFAST™ system. The results for each wavelength are shown in Table 7. For all analytes except B, P, and Si, the dilution factor was 4x. For B, P, and Si, the dilution factor was 5x. The IPC solution should not vary more than 10% during an analysis. All readings fell into this range with the average recovery reported below. WinLab™ for ICP software can automatically re-analyze any quality control sample that falls out of range, if necessary.
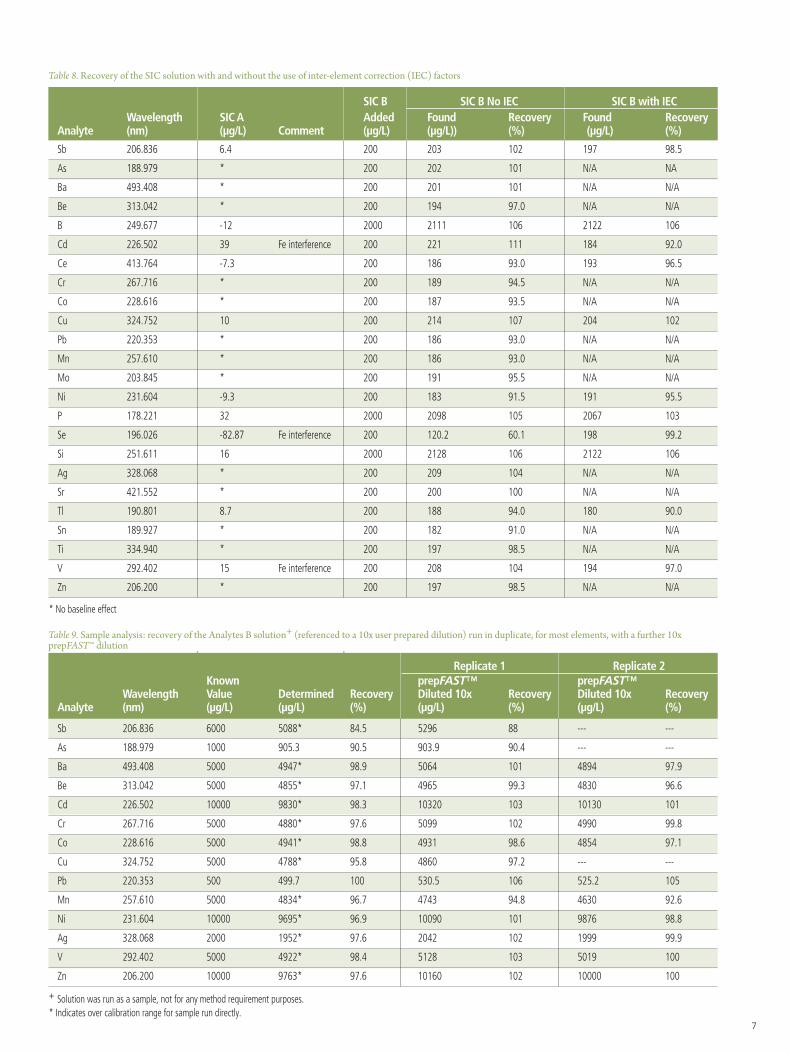
The effect of potential interferences was investigated. An interferent solution (SIC A) was prepared from a commercial solution, and fortified to an Fe concentration of 300 mg/L, as recommended in the Method (see Table 3). A portion of this solution was also spiked with a known concentration of
most of the analytes and used as SIC B. Only a few of the wavelengths showed visible spectral peak interference: As, Cd and V. Several of the other wavelengths suffered from an effect that produced slight baseline effects. When the analysis of the SIC A solution produced results of more than ±5.5 µg/L, a baseline effect was decided to have occurred. At that time, an IEC factor was applied to the data. All results are shown in Table 8. In all cases, except for Li, the determined value for the spiked solution, SIC B, was within 10% of the expected value. Contamination occurred during the SIC B solution preparation; therefore, the Li results are not reported.
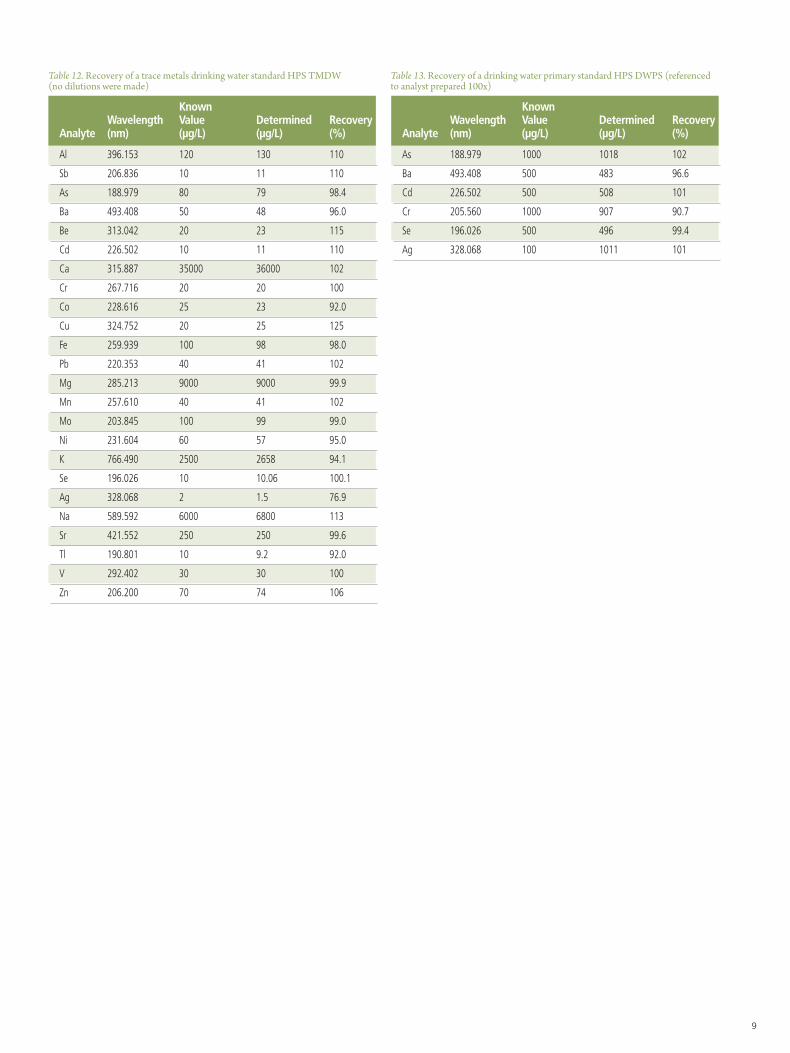
Several solutions of known concentration were analyzed as samples to determine system reliability. Results are shown in Tables 9-13. The Analytes B solution (Table 9) showed all but one diluted result for Sb within 10% of the expected value.
Table 7. Initial performance check (IPC) run periodically and at end of run; prepared from calibration standards 5 and 10 by the prepFAST™ system
Check After End of Run Wavelength Concentration Calibration Check #1 Check #2 Recovery Average Analyte (nm) (μg/L) (μg/L) (μg/L) (μg/L) (μg/L) (%)
Al 396.153 250 245 243 244 235 96.7
Sb 206.836 250 255 253 258 247 101
As 188.979 250 253 252 255 249 101
Ba 493.408 250 252 250 249 242 99.3
Be 313.042 250 245 244 244 247 98.0
B 249.677 1000 1010 1040 1050 1050 104
Cd 226.502 250 248 246 247 246 98.7
Ca 315.887 250 251 251 251 249 100
Ce 413.764 250 252 250 248 240 99.0
Cr 267.716 250 249 249 249 240 98.7
Co 228.616 250 261 259 262 255 104
Cu 324.752 250 251 250 252 239 99.2
Fe 259.939 250 249 251 249 245 99.4
Pb 220.353 250 257 257 260 242 102
Li 670.784 250 239 235 237 234 94.6
Mg 285.213 250 248 255 251 237 99.1
Mn 257.610 250 248 246 246 237 97.7
Mo 203.845 250 254 254 256 237 100
Ni 231.604 250 243 243 244 251 98.1
P 178.221 1000 1047 1058 1074 1094 107
K 766.490 250 239 238 239 229 94.4
Se 196.026 250 253 251 255 247 101
Si 251.611 1000 1050 1040 1050 1070 105
Ag 328.068 250 253 253 255 239 100
Na 589.592 250 244 240 244 240 96.8
Sr 421.552 250 257 248 254 243 100
Tl 190.801 250 253 252 256 249 101
Sn 189.927 250 254 252 255 246 101
Ti 334.940 250 257 256 256 243 101
V 292.402 250 249 249 250 239 98.7
Zn 206.200 250 247 246 246 264 100
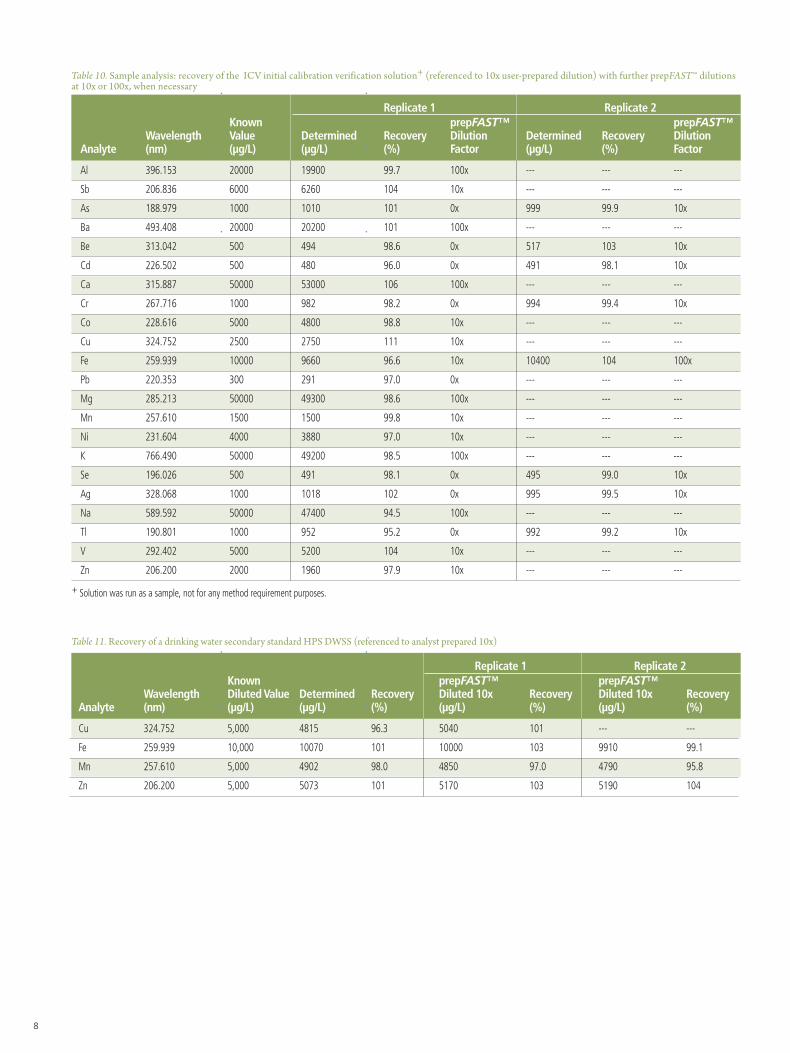
The same is true for the IPC solution (Table 10) – this solution was diluted 10x by the user and then run using the prepFAST™ system either directly and/or with a 10x or 100x dilution. All recoveries for a drinking water secondary standard (HPS DWSS) were well within acceptable ranges compared to the known values (Table 11). A trace metals drinking water (HPS TMDW) standard was analyzed without dilution of any kind (Table 12). Determined results are within 15% of the certified values, except for Cu and Ag, where contamination was suspected. A drinking water primary standard (HPS DWPS) was also run (Table 13).
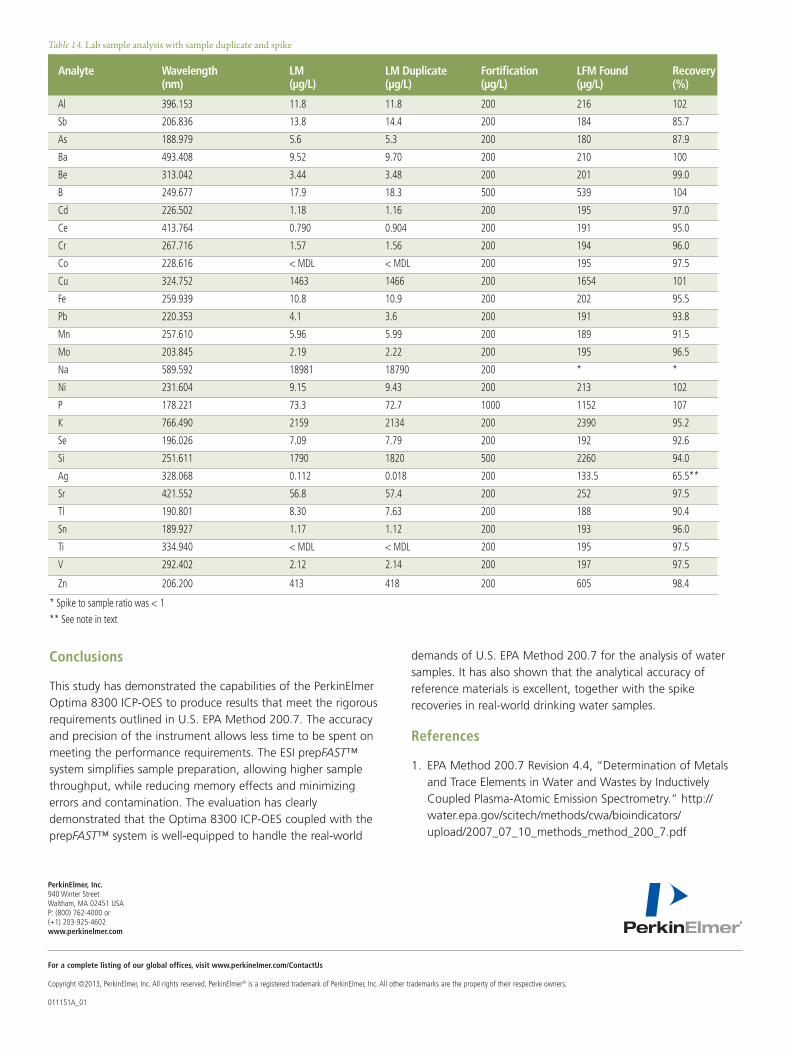
A first-morning tap water was collected to use as a sample (laboratory matrix, LM). This solution was run in duplicate and a portion was fortified with the analytes of interest as a laboratory fortified matrix (LFM). Results are shown in Table 14. Duplicates were all within acceptable limits and, with the exception of Ag, all spike results were within 15%. Based on the determined Zn and Cu concentrations in the sample, the spiked concentration should have been higher. The low Ag recovery was caused by a potential precipitation due to a significant chloride concentration in the sample.
7
Table 8. Recovery of the SIC solution with and without the use of inter-element correction (IEC) factors
SIC B SIC B No IEC SIC B with IEC Wavelength SIC A Added Found Recovery Found Recovery Analyte (nm) (μg/L) Comment (μg/L) (μg/L)) (%) (μg/L) (%)
Sb 206.836 6.4 200 203 102 197 98.5
As 188.979 * 200 202 101 N/A NA
Ba 493.408 * 200 201 101 N/A N/A
Be 313.042 * 200 194 97.0 N/A N/A
B 249.677 -12 2000 2111 106 2122 106
Cd 226.502 39 Fe interference 200 221 111 184 92.0
Ce 413.764 -7.3 200 186 93.0 193 96.5
Cr 267.716 * 200 189 94.5 N/A N/A
Co 228.616 * 200 187 93.5 N/A N/A
Cu 324.752 10 200 214 107 204 102
Pb 220.353 * 200 186 93.0 N/A N/A
Mn 257.610 * 200 186 93.0 N/A N/A
Mo 203.845 * 200 191 95.5 N/A N/A
Ni 231.604 -9.3 200 183 91.5 191 95.5
P 178.221 32 2000 2098 105 2067 103
Se 196.026 -82.87 Fe interference 200 120.2 60.1 198 99.2
Si 251.611 16 2000 2128 106 2122 106
Ag 328.068 * 200 209 104 N/A N/A
Sr 421.552 * 200 200 100 N/A N/A
Tl 190.801 8.7 200 188 94.0 180 90.0
Sn 189.927 * 200 182 91.0 N/A N/A
Ti 334.940 * 200 197 98.5 N/A N/A
V 292.402 15 Fe interference 200 208 104 194 97.0
Zn 206.200 * 200 197 98.5 N/A N/A
* No baseline effect
+ Solution was run as a sample, not for any method requirement purposes.* Indicates over calibration range for sample run directly.
Table 9. Sample analysis: recovery of the Analytes B solution+ (referenced to a 10x user prepared dilution) run in duplicate, for most elements, with a further 10x prepFAST™ dilution
Table 10. Sample analysis: recovery of the ICV initial calibration verification solution+ (referenced to 10x user-prepared dilution) with further prepFAST™ dilutions at 10x or 100x, when necessary
* Spike to sample ratio was < 1** See note in text
Conclusions
This study has demonstrated the capabilities of the PerkinElmer Optima 8300 ICP-OES to produce results that meet the rigorous requirements outlined in U.S. EPA Method 200.7. The accuracy and precision of the instrument allows less time to be spent on meeting the performance requirements. The ESI prepFAST™ system simplifies sample preparation, allowing higher sample throughput, while reducing memory effects and minimizing errors and contamination. The evaluation has clearly demonstrated that the Optima 8300 ICP-OES coupled with the prepFAST™ system is well-equipped to handle the real-world
demands of U.S. EPA Method 200.7 for the analysis of water samples. It has also shown that the analytical accuracy of reference materials is excellent, together with the spike recoveries in real-world drinking water samples.
References
1. EPA Method 200.7 Revision 4.4, “Determination of Metals and Trace Elements in Water and Wastes by Inductively Coupled Plasma-Atomic Emission Spectrometry.” http://water.epa.gov/scitech/methods/cwa/bioindicators/upload/2007_07_10_methods_method_200_7.pdf