Page 1
2018/19 ICR Related Values 1
ISO New England Installed Capacity Requirement,
Local Sourcing Requirements and Capacity
Requirement Values for the System-Wide Capacity
Demand Curve for the 2018/19 Capacity Commitment
Period
ISO New England Inc. February 2015
Page 2
2018/19 ICR Related Values 1
ISO New England Installed Capacity Requirement, Local
Sourcing Requirements, and Capacity Requirement Values for
the System-Wide Capacity Demand Curve for the 2018/19
Capacity Commitment Period
Executive Summary As part of the Forward Capacity Market (FCM), ISO New England Inc. (ISO-NE)
conducts a Forward Capacity Auction (FCA) three years in advance of each Capacity
Commitment Period (CCP) to meet the region’s resource adequacy needs. The latest
FCA, conducted on February 2, 2015, resulted in capacity (megawatts) commitments of
sufficient quantities to meet the Installed Capacity Requirement (ICR) for the 2018/19
CCP. The 2018/19 CCP is the ninth CCP of the FCM (FCA9) and it begins on June 1,
2018 and ends on May 31, 2019.
This report documents the assumptions and simulation results of the 2018/19 CCP ICR,
Local Sourcing Requirements (LSR) and Capacity Requirement Values for the System–
Wide Capacity Demand Curve calculations – (collectively referred to as the “ICR Related
Values”), all of which are key inputs in FCA9, along with the Hydro-Québec
Interconnection Capability Credits (HQICCs), which are also a key input into the
calculation of the ICR.
For the 2018/19 CCP, ISO-NE has identified three Load Zones that are import-
constrained and as a result, modeled as Capacity Zones in FCA9. These Capacity Zones
are: Connecticut, Northeast Massachusetts/Boston (NEMA/Boston) and the combined
Load Zones of Southeastern Massachusetts and Rhode Island (SEMA/RI). 1
Therefore,
the ICR Related Values for FCA9 consider three LSR values. The Maine Load Zone,
which was modeled as an export-constrained Capacity Zone in prior FCAs, was
determined not to be export-constrained. In fact, no Load Zones were considered to be
export-constrained. Therefore the ICR Related Values for FCA9 do not consider any
Maximum Capacity Limit (MCL) values.
In a filing, dated April 1, 2014, ISO-NE filed Market Rules relating to a System-Wide
Capacity Demand Curve (Demand Curve) which was used for the first time in FCA9.2
The Demand Curve has capacity requirement values which were calculated at the cap and
foot3 of the curve and are considered and filed as part of the ICR Related Values.
1 The FERC filing identifying SEMA/RI as a Capacity Zone is available at: http://www.iso-ne.com/static-
assets/documents/regulatory/ferc/filings/2014/may/er14_____000_5_8_14_iso_zone_boundry.pdf. 2 The filing is available at: http://www.iso-ne.com/static-
assets/documents/regulatory/ferc/filings/2014/apr/er14_1639_000_demand_curve_chges_4_1_2014.pdf. 3 The design of the Demand Curve is specified in Section III.13.2.2. of the Market Rules which describes the cap as the
Capacity Requirement Value at 0.200 LOLE, Max[1.6 x Net CONE,CONE] and the foot of the Demand Curve of
Capacity Requirement Value at 0.011 LOLE, $0. See Figure 2 for the FCA9 Demand Curve.
Page 3
2018/19 ICR Related Values 2
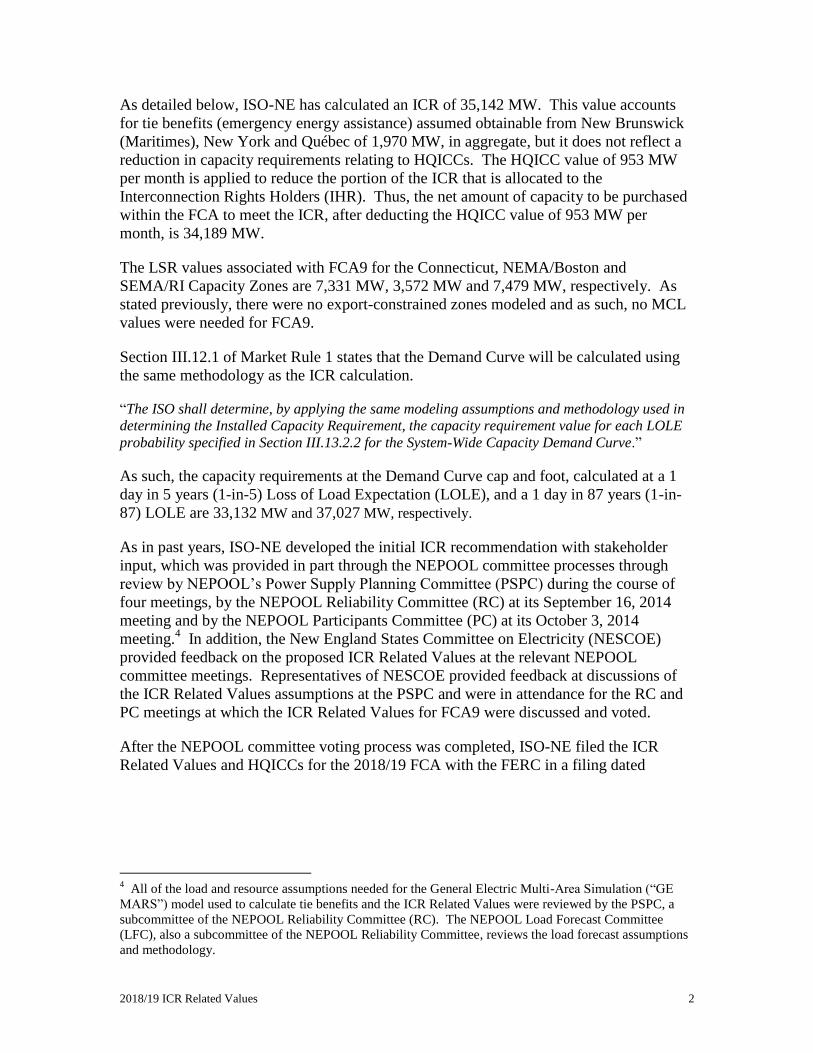
As detailed below, ISO-NE has calculated an ICR of 35,142 MW. This value accounts
for tie benefits (emergency energy assistance) assumed obtainable from New Brunswick
(Maritimes), New York and Québec of 1,970 MW, in aggregate, but it does not reflect a
reduction in capacity requirements relating to HQICCs. The HQICC value of 953 MW
per month is applied to reduce the portion of the ICR that is allocated to the
Interconnection Rights Holders (IHR). Thus, the net amount of capacity to be purchased
within the FCA to meet the ICR, after deducting the HQICC value of 953 MW per
month, is 34,189 MW.
The LSR values associated with FCA9 for the Connecticut, NEMA/Boston and
SEMA/RI Capacity Zones are 7,331 MW, 3,572 MW and 7,479 MW, respectively. As
stated previously, there were no export-constrained zones modeled and as such, no MCL
values were needed for FCA9.
Section III.12.1 of Market Rule 1 states that the Demand Curve will be calculated using
the same methodology as the ICR calculation.
“The ISO shall determine, by applying the same modeling assumptions and methodology used in
determining the Installed Capacity Requirement, the capacity requirement value for each LOLE
probability specified in Section III.13.2.2 for the System-Wide Capacity Demand Curve.”
As such, the capacity requirements at the Demand Curve cap and foot, calculated at a 1
day in 5 years (1-in-5) Loss of Load Expectation (LOLE), and a 1 day in 87 years (1-in-
87) LOLE are 33,132 MW and 37,027 MW, respectively.
As in past years, ISO-NE developed the initial ICR recommendation with stakeholder
input, which was provided in part through the NEPOOL committee processes through
review by NEPOOL’s Power Supply Planning Committee (PSPC) during the course of
four meetings, by the NEPOOL Reliability Committee (RC) at its September 16, 2014
meeting and by the NEPOOL Participants Committee (PC) at its October 3, 2014
meeting.4 In addition, the New England States Committee on Electricity (NESCOE)
provided feedback on the proposed ICR Related Values at the relevant NEPOOL
committee meetings. Representatives of NESCOE provided feedback at discussions of
the ICR Related Values assumptions at the PSPC and were in attendance for the RC and
PC meetings at which the ICR Related Values for FCA9 were discussed and voted.
After the NEPOOL committee voting process was completed, ISO-NE filed the ICR
Related Values and HQICCs for the 2018/19 FCA with the FERC in a filing dated
4 All of the load and resource assumptions needed for the General Electric Multi-Area Simulation (“GE
MARS”) model used to calculate tie benefits and the ICR Related Values were reviewed by the PSPC, a
subcommittee of the NEPOOL Reliability Committee (RC). The NEPOOL Load Forecast Committee
(LFC), also a subcommittee of the NEPOOL Reliability Committee, reviews the load forecast assumptions
and methodology.
Page 4
2018/19 ICR Related Values 3
November 4, 2014.5 The FERC accepted the ICR Related Values in a letter dated
January 2, 2015.6
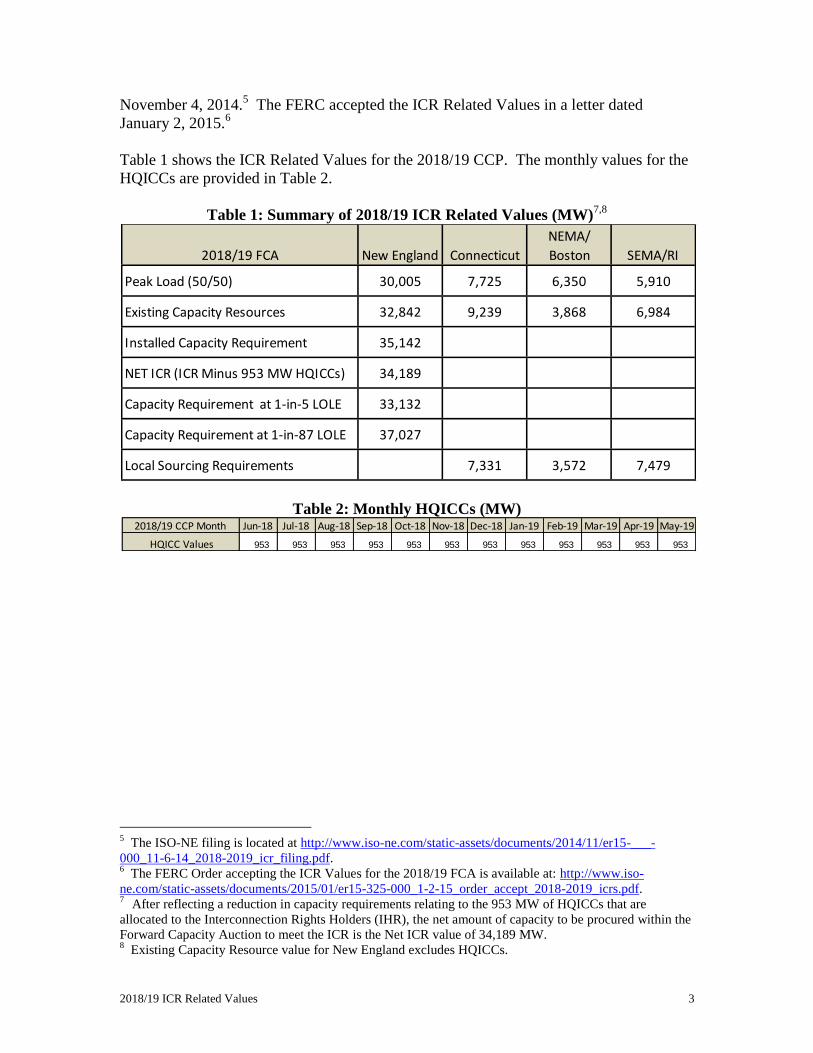
Table 1 shows the ICR Related Values for the 2018/19 CCP. The monthly values for the
HQICCs are provided in Table 2.
Table 1: Summary of 2018/19 ICR Related Values (MW)7,8
Table 2: Monthly HQICCs (MW)
5 The ISO-NE filing is located at http://www.iso-ne.com/static-assets/documents/2014/11/er15-___-
000_11-6-14_2018-2019_icr_filing.pdf. 6 The FERC Order accepting the ICR Values for the 2018/19 FCA is available at: http://www.iso-
ne.com/static-assets/documents/2015/01/er15-325-000_1-2-15_order_accept_2018-2019_icrs.pdf. 7 After reflecting a reduction in capacity requirements relating to the 953 MW of HQICCs that are
allocated to the Interconnection Rights Holders (IHR), the net amount of capacity to be procured within the
Forward Capacity Auction to meet the ICR is the Net ICR value of 34,189 MW. 8 Existing Capacity Resource value for New England excludes HQICCs.
2018/19 FCA New England Connecticut
NEMA/
Boston SEMA/RI
Peak Load (50/50) 30,005 7,725 6,350 5,910
Existing Capacity Resources 32,842 9,239 3,868 6,984
Installed Capacity Requirement 35,142
NET ICR (ICR Minus 953 MW HQICCs) 34,189
Capacity Requirement at 1-in-5 LOLE 33,132
Capacity Requirement at 1-in-87 LOLE 37,027
Local Sourcing Requirements 7,331 3,572 7,479
2018/19 CCP Month Jun-18 Jul-18 Aug-18 Sep-18 Oct-18 Nov-18 Dec-18 Jan-19 Feb-19 Mar-19 Apr-19 May-19
HQICC Values 953 953 953 953 953 953 953 953 953 953 953 953
Page 5
2018/19 ICR Related Values 4
Table of Contents
Executive Summary ............................................................................................................ 1 Table of Contents ................................................................................................................ 4 List of Tables ...................................................................................................................... 5 List of Figures ..................................................................................................................... 6
Introduction ......................................................................................................................... 7 Summary of ICR Related Values and Components for 2018/19 ........................................ 8 Stakeholder Process .......................................................................................................... 11 Methodology ..................................................................................................................... 13
Reliability Planning Model for ICR Related Values ................................................ 13
Installed Capacity Requirement (ICR) Calculation .................................................. 14
Local Sourcing Requirements (LSR) Calculation .................................................... 15
Local Resource Adequacy (LRA) Requirement ............................................................... 16
Transmission Security Analysis (TSA) Calculation ................................................. 18 Methodology for Calculating the TSA ..................................................................... 19 Local Sourcing Requirement (LSR) ......................................................................... 20
Maximum Capacity Limit (MCL) Calculation ......................................................... 21 Assumptions ...................................................................................................................... 23
Load Forecast .................................................................................................................... 23 Load Forecast Uncertainty ........................................................................................ 23
Existing Capacity Resources............................................................................................. 24
Generating Resources ............................................................................................... 25 Intermittent Power Resources ................................................................................... 26
Demand Resources.................................................................................................... 26 Import Resources ...................................................................................................... 27
Export Bids ....................................................................................................................... 27 New Capacity Resources .................................................................................................. 28 Resources Used to Calculate Locational Requirements ................................................... 28
Transmission Transfer Capability ..................................................................................... 29 External Transmission Transfer Capability .............................................................. 29
External Transmission Interface Availability ........................................................... 29 Internal Transmission Transfer Capability ............................................................... 30
OP-4 Load Relief .............................................................................................................. 31
Tie Benefits ............................................................................................................... 32 5% Voltage Reduction .............................................................................................. 36
Operating Reserve ............................................................................................................. 38
Proxy Units ....................................................................................................................... 38
Summary ........................................................................................................................... 40 Availability ....................................................................................................................... 41
Generating Resource Forced Outages ....................................................................... 41 Generating Resource Scheduled Outages ................................................................. 41 Intermittent Power Resource Availability ................................................................ 42 Demand Resources Availability ............................................................................... 42
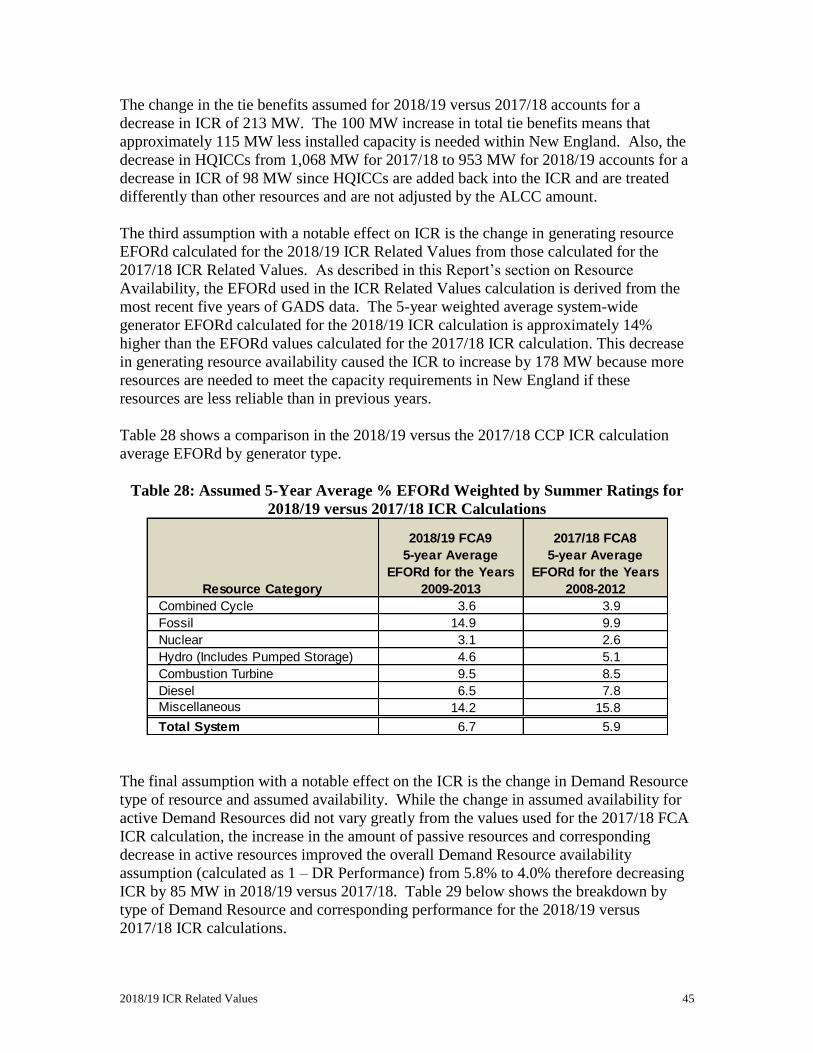
Difference from 2017/18 FCA ICR Related Values ......................................................... 44
Page 6
2018/19 ICR Related Values 5
List of Tables
Table 1: Summary of 2018/19 ICR Related Values (MW) ................................................ 3 Table 2: Monthly HQICCs (MW)....................................................................................... 3 Table 3: ICR Related Values and Components for 2018/19 (MW).................................... 8 Table 4: Variables Used to Calculate ICR and Demand Curve (MW) ............................. 15
Table 5: LRA Requirement Calculation Details (MW) .................................................... 18 Table 6: TSA Calculation Details (MW) .......................................................................... 20 Table 7: LSR for the 2018/19 CCP (MW) ........................................................................ 21 Table 8: Indicative MCL for the Maine Load Zone Calculation Details (MW) ............... 22 Table 9: Summer 2018 Peak Load Forecast Distribution (MW) ...................................... 24
Table 10: Existing Qualified Generating Capacity by Load Zone (MW) ........................ 25
Table 11: Existing IPR by Load Zone (MW) ................................................................... 26
Table 12: Existing Demand Resources by Load Zone (MW)........................................... 27
Table 13: Existing Import Resources (MW) ..................................................................... 27 Table 14: Capacity Exports (MW) .................................................................................... 28 Table 15: Resources Used in the LSR Calculations (MW) .............................................. 29
Table 16: Transmission Transfer Capability of New England External Interfaces Modeled
in the Tie Benefits Study (MW)........................................................................................ 29
Table 17: External Interface Outage Rates (% and Weeks) ............................................. 30 Table 18: Internal Transmission Transfer Capability Modeled in the LSR Calculations
(MW),, ............................................................................................................................... 31
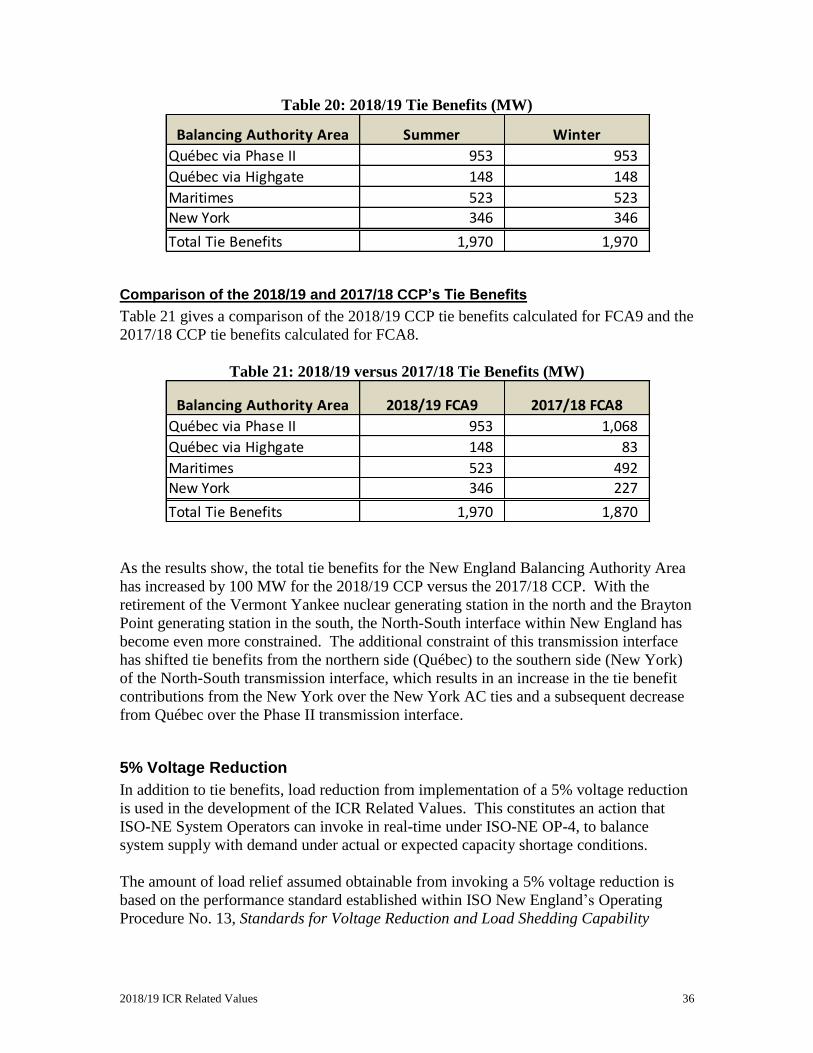
Table 19: Capacity Imports Used to Adjust Tie Benefits by External Interface (MW) ... 35 Table 20: 2018/19 Tie Benefits (MW) .............................................................................. 36
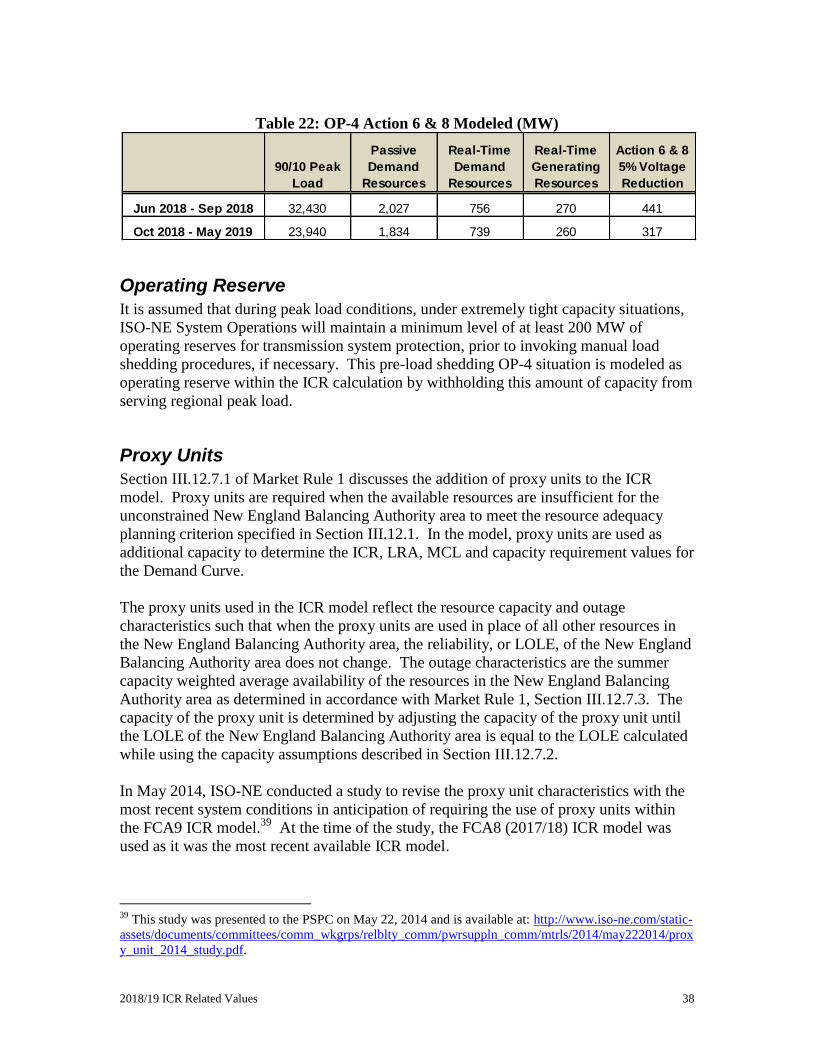
Table 21: 2018/19 versus 2017/18 Tie Benefits (MW) .................................................... 36 Table 22: OP-4 Action 6 & 8 Modeled (MW) .................................................................. 38
Table 23: Summary of Resource and OP-4 Assumptions (MW) ..................................... 40 Table 24: Generating Resource EFORd (%) and Maintenance Weeks by Resource
Category ............................................................................................................................ 41
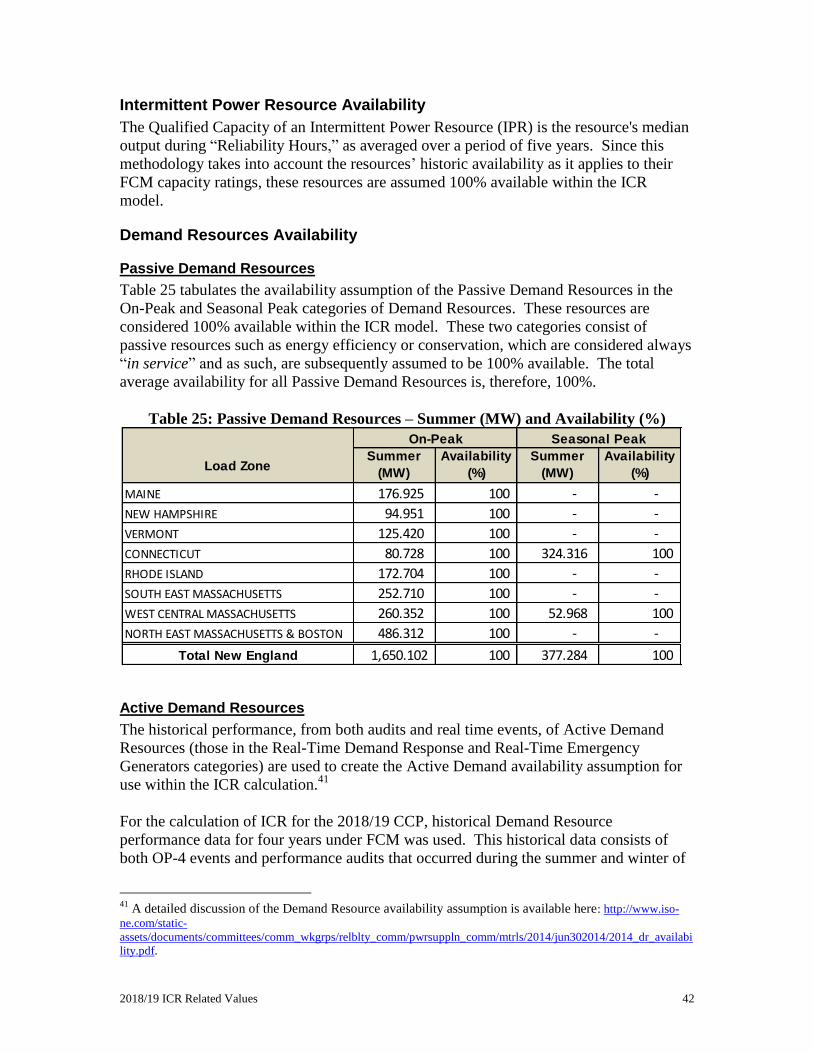
Table 25: Passive Demand Resources – Summer (MW) and Availability (%) ................ 42 Table 26: Demand Response Resources Summer (MW) and Availability (%)................ 43
Table 27: Summary of ICR Input Assumptions for 2018/19 vs. 2017/18 ........................ 44 Table 28: Assumed 5-Year Average % EFORd Weighted by Summer Ratings for
2018/19 versus 2017/18 ICR Calculations ....................................................................... 45
Table 29: Comparison of Demand Resources (MW) & Performance (%) for 2018/19
versus 2017/18 ICR Calculations...................................................................................... 46 Table 30: Summary of Changes in LRA Requirement for 2018/19 vs. 2017/18 ............. 46
Table 31: Comparison of the TSA Requirement Calculation for 2018/19 vs. 2017/18
(MW)................................................................................................................................. 47 Table 32: Comparison of all ICR Related Values (MW) ................................................. 48
Page 7
2018/19 ICR Related Values 6
List of Figures
Figure 1: Formula for Annual Resulting Reserve Margin (%) ........................................... 8 Figure 2: System-Wide Capacity Demand Curve for 2018/19 (FCA9) ........................... 10 Figure 3: Formula for ICR Calculation ............................................................................. 14
Figure 4: Formula for LRA Calculation ........................................................................... 18 Figure 5: Surplus Capacity Adjustment in Rest of New England ..................................... 18 Figure 6: Formula for TSA Requirements ........................................................................ 19 Figure 7: Formula for MCL Calculation ........................................................................... 22 Figure 8: Summarization of the Tie Benefits Calculation Process ................................... 33
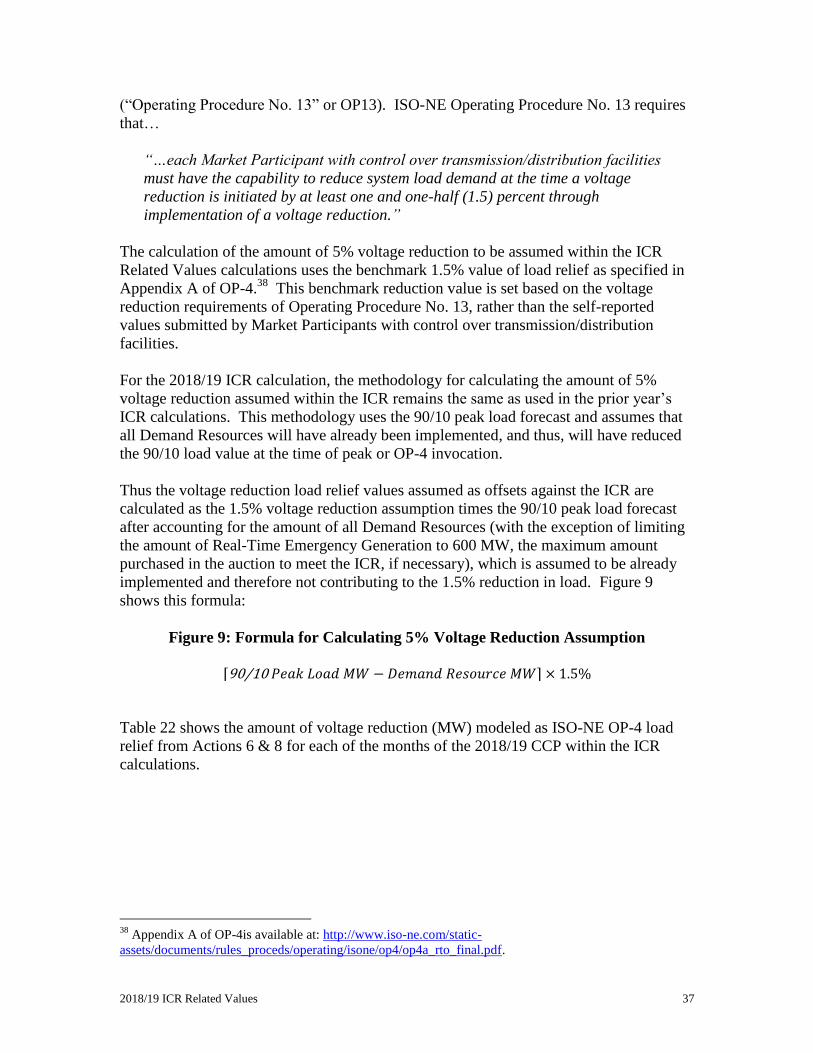
Figure 9: Formula for Calculating 5% Voltage Reduction Assumption ........................... 37
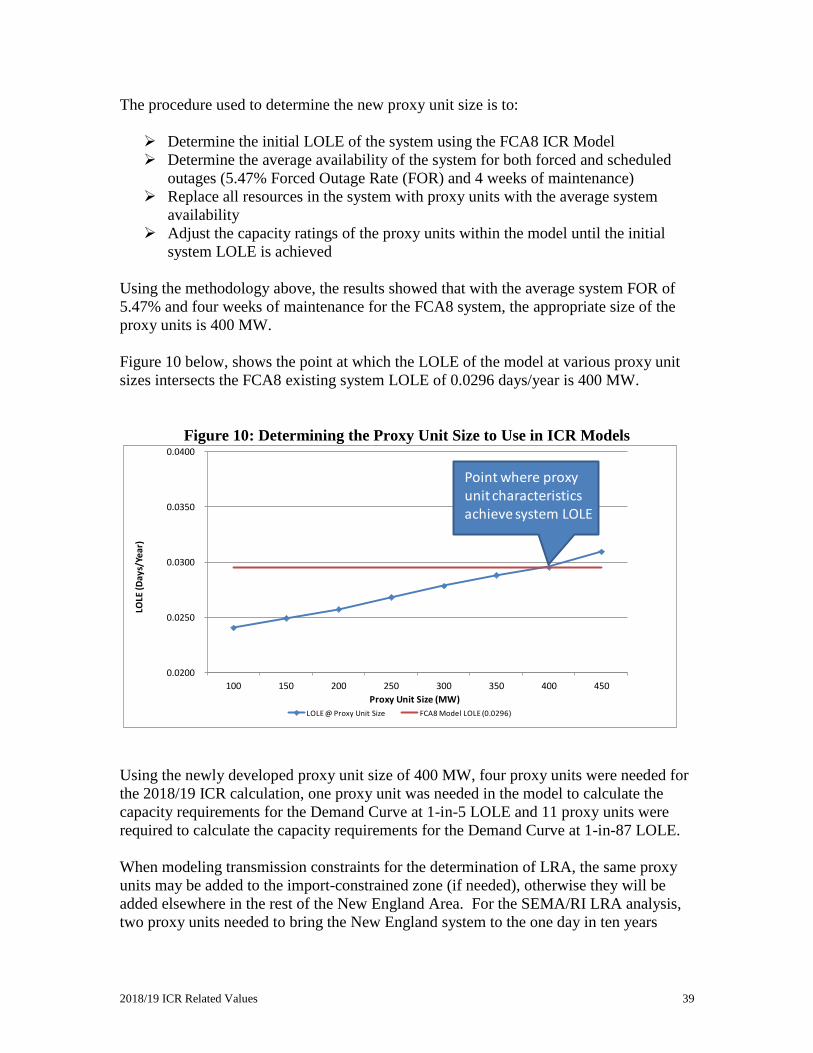
Figure 10: Determining the Proxy Unit Size to Use in ICR Models ................................ 39
Page 8
2018/19 ICR Related Values 7
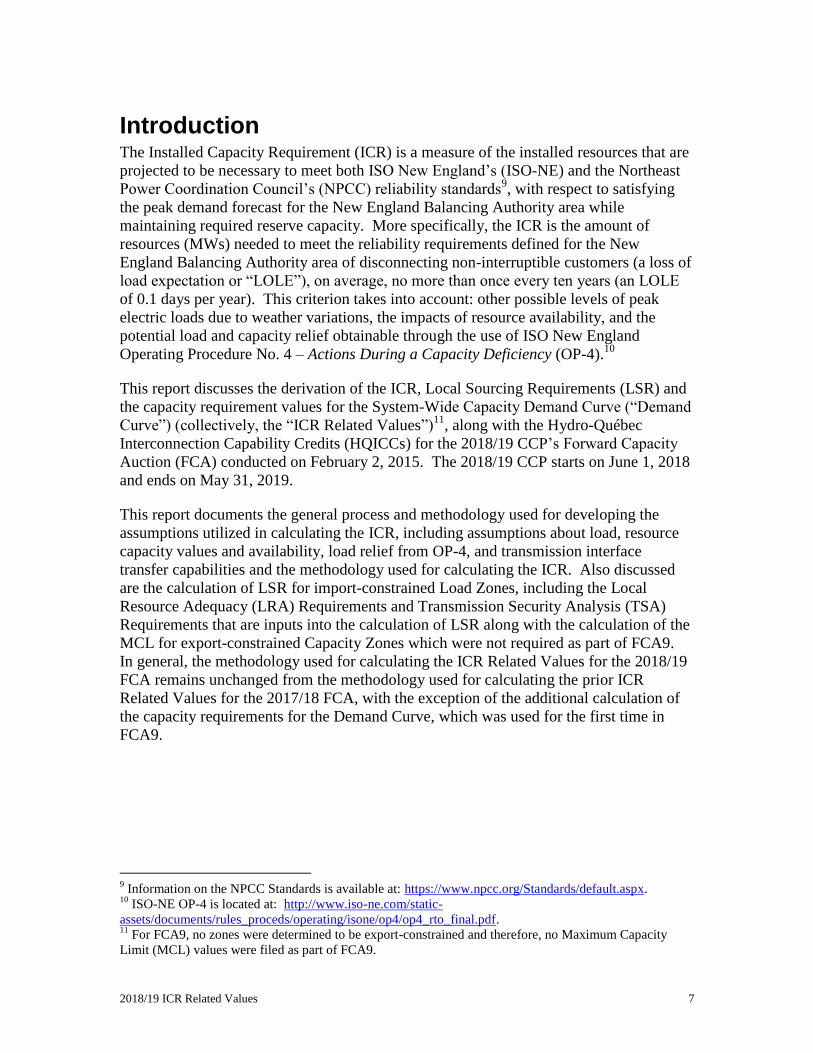
Introduction The Installed Capacity Requirement (ICR) is a measure of the installed resources that are
projected to be necessary to meet both ISO New England’s (ISO-NE) and the Northeast
Power Coordination Council’s (NPCC) reliability standards9, with respect to satisfying
the peak demand forecast for the New England Balancing Authority area while
maintaining required reserve capacity. More specifically, the ICR is the amount of
resources (MWs) needed to meet the reliability requirements defined for the New
England Balancing Authority area of disconnecting non-interruptible customers (a loss of
load expectation or “LOLE”), on average, no more than once every ten years (an LOLE
of 0.1 days per year). This criterion takes into account: other possible levels of peak
electric loads due to weather variations, the impacts of resource availability, and the
potential load and capacity relief obtainable through the use of ISO New England
Operating Procedure No. 4 – Actions During a Capacity Deficiency (OP-4).10
This report discusses the derivation of the ICR, Local Sourcing Requirements (LSR) and
the capacity requirement values for the System-Wide Capacity Demand Curve (“Demand
Curve”) (collectively, the “ICR Related Values”)11
, along with the Hydro-Québec
Interconnection Capability Credits (HQICCs) for the 2018/19 CCP’s Forward Capacity
Auction (FCA) conducted on February 2, 2015. The 2018/19 CCP starts on June 1, 2018
and ends on May 31, 2019.
This report documents the general process and methodology used for developing the
assumptions utilized in calculating the ICR, including assumptions about load, resource
capacity values and availability, load relief from OP-4, and transmission interface
transfer capabilities and the methodology used for calculating the ICR. Also discussed
are the calculation of LSR for import-constrained Load Zones, including the Local
Resource Adequacy (LRA) Requirements and Transmission Security Analysis (TSA)
Requirements that are inputs into the calculation of LSR along with the calculation of the
MCL for export-constrained Capacity Zones which were not required as part of FCA9.
In general, the methodology used for calculating the ICR Related Values for the 2018/19
FCA remains unchanged from the methodology used for calculating the prior ICR
Related Values for the 2017/18 FCA, with the exception of the additional calculation of
the capacity requirements for the Demand Curve, which was used for the first time in
FCA9.
9 Information on the NPCC Standards is available at: https://www.npcc.org/Standards/default.aspx.
10 ISO-NE OP-4 is located at: http://www.iso-ne.com/static-
assets/documents/rules_proceds/operating/isone/op4/op4_rto_final.pdf. 11
For FCA9, no zones were determined to be export-constrained and therefore, no Maximum Capacity
Limit (MCL) values were filed as part of FCA9.
Page 9
2018/19 ICR Related Values 8
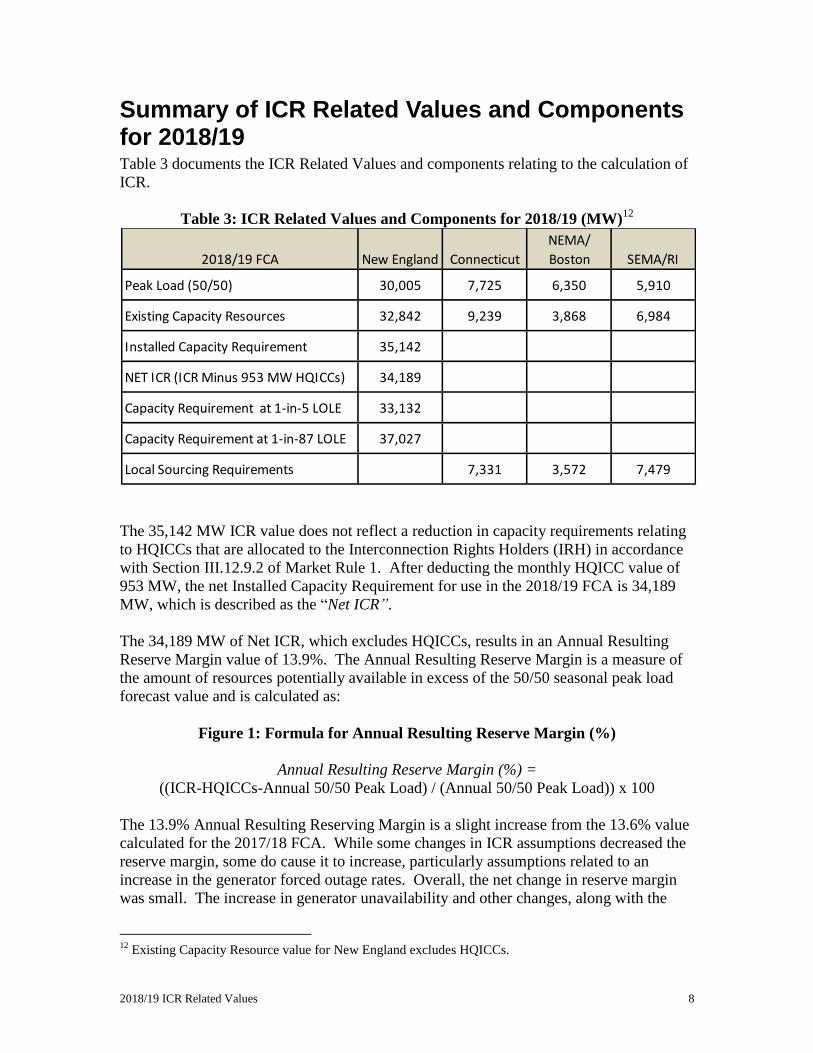
Summary of ICR Related Values and Components for 2018/19 Table 3 documents the ICR Related Values and components relating to the calculation of
ICR.
Table 3: ICR Related Values and Components for 2018/19 (MW)12
The 35,142 MW ICR value does not reflect a reduction in capacity requirements relating
to HQICCs that are allocated to the Interconnection Rights Holders (IRH) in accordance
with Section III.12.9.2 of Market Rule 1. After deducting the monthly HQICC value of
953 MW, the net Installed Capacity Requirement for use in the 2018/19 FCA is 34,189
MW, which is described as the “Net ICR”.
The 34,189 MW of Net ICR, which excludes HQICCs, results in an Annual Resulting
Reserve Margin value of 13.9%. The Annual Resulting Reserve Margin is a measure of
the amount of resources potentially available in excess of the 50/50 seasonal peak load
forecast value and is calculated as:
Figure 1: Formula for Annual Resulting Reserve Margin (%)
Annual Resulting Reserve Margin (%) =
((ICR-HQICCs-Annual 50/50 Peak Load) / (Annual 50/50 Peak Load)) x 100
The 13.9% Annual Resulting Reserving Margin is a slight increase from the 13.6% value
calculated for the 2017/18 FCA. While some changes in ICR assumptions decreased the
reserve margin, some do cause it to increase, particularly assumptions related to an
increase in the generator forced outage rates. Overall, the net change in reserve margin
was small. The increase in generator unavailability and other changes, along with the
12
Existing Capacity Resource value for New England excludes HQICCs.
2018/19 FCA New England Connecticut
NEMA/
Boston SEMA/RI
Peak Load (50/50) 30,005 7,725 6,350 5,910
Existing Capacity Resources 32,842 9,239 3,868 6,984
Installed Capacity Requirement 35,142
NET ICR (ICR Minus 953 MW HQICCs) 34,189
Capacity Requirement at 1-in-5 LOLE 33,132
Capacity Requirement at 1-in-87 LOLE 37,027
Local Sourcing Requirements 7,331 3,572 7,479
Page 10
2018/19 ICR Related Values 9
overall change in ICR, is discussed in more detail in the last section of this report,
Difference from the 2017/18 FCA ICR Related Values.
The capacity requirement values for the Demand Curve, calculated for the first time for
FCA9 require that:
“The ISO shall determine, by applying the same modeling assumptions and methodology used in
determining the Installed Capacity Requirement, the capacity requirement value for each LOLE
probability specified in Section III.13.2.2 for the System-Wide Capacity Demand Curve”
according to Section III.12.1 of Market Rule 1.
As such, the capacity requirement values at the Demand Curve cap and foot, calculated at
1 day in 5 years (1-in-5) Loss of Load Expectation (LOLE), and at 1 day in 87 years (1-
in-87) LOLE are 33,132 MW and 37,027 MW, respectively.
The coordinates of the Demand Curve use a price quantity for the Cost of New Entry
(CONE) into the capacity market. This price quantity is determined as max [1.6 times
Net CONE, CONE]. CONE for the FCA for the 2018/19 CCP is $14.04/kW-month
while Net CONE is $11.08/kW-month.13
Using the coordinates of the cap of the Demand Curve of [Capacity Requirement Value
at 1-in-5 LOLE, 1.6 x Net CONE ($17.728] and the foot of the Demand Curve of
[Capacity Requirement Value at 1-in-87 LOLE, $0], the Demand Curve for FCA9 is
shown in Figure 2.
13
The determination of CONE for 2018/19 was discussed at the March 12, 2014 Markets Committee:
http://www.iso-ne.com/static-
assets/documents/committees/comm_wkgrps/mrkts_comm/mrkts/mtrls/2014/mar12132014/a02a_the_brattl
e_group_demand_curve_net_cone_final_proposal_03_12_14.pptx. For rules relating to CONE, see Market
Rule 1 III.13.2.4.
Page 11
2018/19 ICR Related Values 10
Figure 2: System-Wide Capacity Demand Curve for 2018/19 (FCA9)
A summary of historical ICR Related Values, including links to documentation and
filings for FCA9 and prior years are available on the ISO-NE website under System
Planning > Installed Capacity Requirements > Summary of Historical ICR Values
(EXCEL Spreadsheet) and can be directly accessed at this link: http://www.iso-ne.com/static-
assets/documents/2014/12/summary_of_icr_values_expanded.xlsx.
$0
$5
$10
$15
$20
30
,00
0
31
,00
0
32
,00
0
33
,00
0
34
,00
0
35
,00
0
36
,00
0
37
,00
0
38
,00
0
Pri
ce (
$)
Capacity Requirement (MW)
Net ICR
Page 12
2018/19 ICR Related Values 11
Stakeholder Process As in past years, ISO-NE developed the initial ICR recommendation with stakeholder
input, which was provided in part through the NEPOOL committee process with review
by NEPOOL’s Power Supply Planning Committee (PSPC) during the course of four
meetings. The PSPC, which is chaired by ISO-NE, is a non-voting, technical
subcommittee reporting to the NEPOOL Reliability Committee (RC). Most PSPC
members are representatives of NEPOOL Participants. The PSPC assists ISO-NE with
the development of resource adequacy based requirements such as the ICR, LSR, MCL
and Demand Curve capacity requirements, including the appropriate load and resource
assumptions for modeling expected power system conditions.
As part of the stakeholder voting process, the ICR Related Values was vetted through the
RC at its September 16, 2014 meeting and acted on by the NEPOOL Participants
Committee (PC) at its October 3, 2014 meeting.14
Representatives of the New England
States Committee on Electricity (“NESCOE”) provided feedback on the proposed ICR
Related Values at the relevant NEPOOL PSPC, RC and PC meetings, and were in
attendance for the meetings at which the ICR Related Values for the 2018/19 Forward
Capacity Auction were discussed and voted.
At the September 16, 2014 meeting of the RC, a motion to recommend support of the
ICR Related Values passed by a show of hands, with four opposed (1 Transmission
Sector, 1 Publicly Owned Sector, and 2 Supplier Sector) and one abstention (1
Transmission Sector). A motion that the RC recommend that the PC support the HQICC
values passed by a show of hands, with two opposed (2 Supplier Sector) and one
abstention (1 Supplier Sector).
At the October 3, 2014 PC meeting, the ICR Related Values and HQICC Values were
removed as part of the Consent Agenda due to concerns by some Stakeholders that ISO-
NE “failed to recognize a present and continuing investment in renewable distributed
generation resources.” 15
Specifically they believed the load forecast, as an input into the
ICR Related Values, should be decreased by an appropriate forecast of photovoltaic
resources in the 2018/19 CCP. The vote on ICR Related Values subsequently failed at
the PC.16
14
All of the load and resource assumptions needed for the General Electric Multi-Area Simulation (GE
MARS) model used to calculate tie benefits and the ICR Related Values were reviewed by the PSPC, a
subcommittee of the NEPOOL RC. The NEPOOL Load Forecast Committee (LFC), also a subcommittee
of the NEPOOL RC, reviews the load forecast assumptions and methodology. 15
The memo is part of the October 3, 2014 PC Meeting materials at http://www.iso-ne.com/static-
assets/documents/2014/10/NPC_20141003_Addl.pdf. 16
At the PC, the vote on the FCA9 ICR Related Values failed with a 38.61% vote in favor (Generation –
17.17%, Transmission – 0%; Supplier – 15.60%; Alternative Resources – 4.28%; Publicly Owned Entity –
0%; and End User – 1.56%).
Page 13
2018/19 ICR Related Values 12
ISO-NE filed the ICR Related Values and HQICCs for the 2018/19 FCA with the FERC
on November 4, 2014.17
The FERC accepted the ICR Related Values in a letter dated
January 2, 2015.18
17
A copy of the filing is available at: http://www.iso-ne.com/static-assets/documents/2014/11/er15-___-
000_11-6-14_2018-2019_icr_filing.pdf. 18
The FERC Order accepting the ICR Values for the 2018/19 FCA is available at: http://www.iso-
ne.com/static-assets/documents/2015/01/er15-325-000_1-2-15_order_accept_2018-2019_icrs.pdf.
Page 14
2018/19 ICR Related Values 13
Methodology
Reliability Planning Model for ICR Related Values
The ICR is the minimum level of capacity required to meet the reliability requirements
defined for the New England Balancing Authority area. This requirement is documented
in Section 2 of ISO New England Planning Procedure No. 3,19
Reliability Standards for
the New England Area Bulk Power Supply System, which states:
“Resources will be planned and installed in such a manner that, after due
allowance for the factors enumerated below, the probability of disconnecting non-
interruptible customers due to resource deficiency, on the average, will be no
more than once in ten years. Compliance with this criterion shall be evaluated
probabilistically, such that the loss of load expectation (LOLE) of disconnecting
non-interruptible customers due to resource deficiencies shall be, on average, no
more than 0.1 day per year.”
Included as variables within the reliability model are:
a. The possibility that load forecasts may be exceeded as a result of weather
variations.
b. Immature and mature equivalent forced outage rates appropriate for resources of
various sizes and types, recognizing partial and full outages.
c. Due allowance for generating unit scheduled outages and deratings.
d. Seasonal adjustments of resource capability.
e. Proper maintenance requirements.
f. Available operating procedures.
g. The reliability benefits of interconnections with systems that are not Governance
Participants.
h. Such other factors as may be appropriate from time to time.
The ICR for the 2018/19 CCP was established using the General Electric Multi-Area
Reliability Simulation Model (GE MARS). GE MARS is a computer program that uses a
sequential Monte Carlo simulation to probabilistically compute the resource adequacy of a
bulk electric power system by simulating the random behavior of both loads and
resources. For the ICR calculation, the GE MARS model is used as a one-bus model and
the New England transmission system is assumed to have no constraints within this
simulation. In other words, all the resources modeled are assumed to be able to deliver
their full output to meet forecast load requirements.
To calculate the expected days per year that the bulk electric system would not have
adequate resources to meet peak demands and required reserves, the GE MARS Monte
Carlo process repeatedly simulates the year using multiple replications and evaluates the
impacts of a wide-range of possible random combinations of resource outages.
19
Available at: http://www.iso-ne.com/static-assets/documents/rules_proceds/isone_plan/pp03/pp3_final.pdf.
Page 15
2018/19 ICR Related Values 14
Chronological system histories are developed by combining randomly generated operating
histories of the resources serving the hourly chronological demand. For each hour, the
program computes the isolated area margins based on the available capacity and demand
within each area. The program collects the statistics for computing the reliability indices
and then proceeds to the next hour to perform the same type of calculation. After
simulating all of the hours in the year, the program computes the annual indices and tests
for convergence. If the simulation has not converged to an acceptable level, it proceeds to
another replication of the study year.
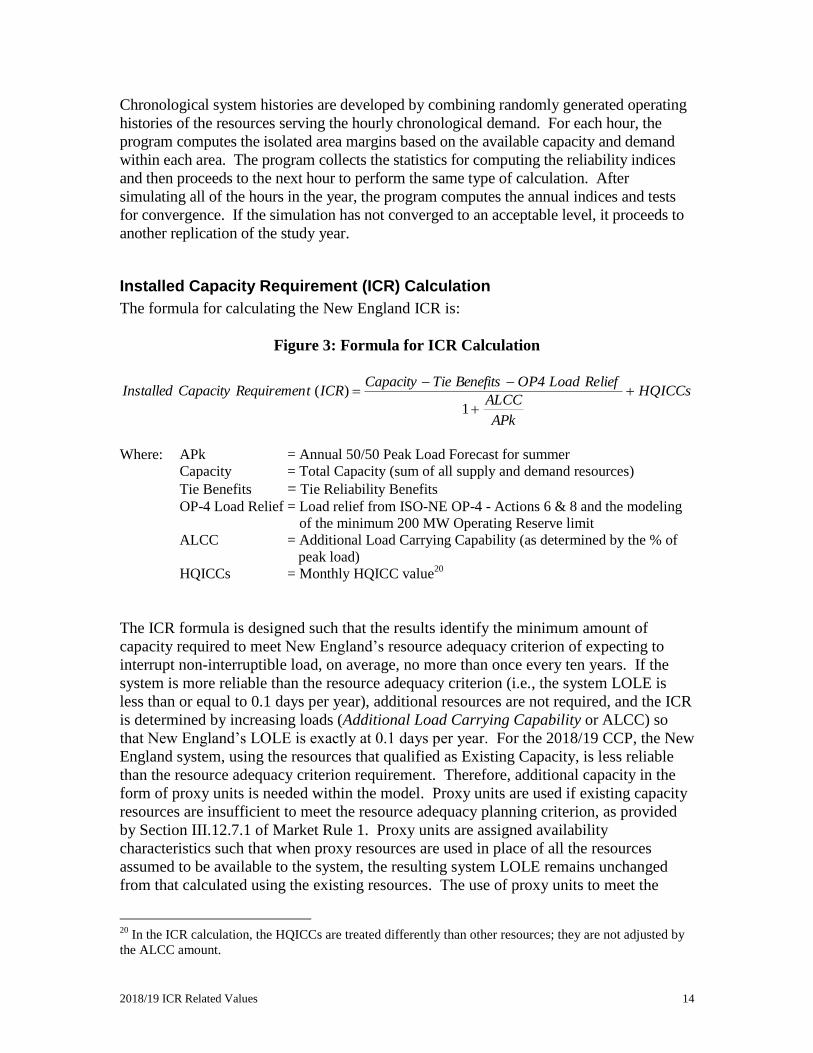
Installed Capacity Requirement (ICR) Calculation
The formula for calculating the New England ICR is:
Figure 3: Formula for ICR Calculation
Where: APk = Annual 50/50 Peak Load Forecast for summer
Capacity = Total Capacity (sum of all supply and demand resources)
Tie Benefits = Tie Reliability Benefits OP-4 Load Relief = Load relief from ISO-NE OP-4 - Actions 6 & 8 and the modeling
of the minimum 200 MW Operating Reserve limit
ALCC = Additional Load Carrying Capability (as determined by the % of
peak load)
HQICCs = Monthly HQICC value20
The ICR formula is designed such that the results identify the minimum amount of
capacity required to meet New England’s resource adequacy criterion of expecting to
interrupt non-interruptible load, on average, no more than once every ten years. If the
system is more reliable than the resource adequacy criterion (i.e., the system LOLE is
less than or equal to 0.1 days per year), additional resources are not required, and the ICR
is determined by increasing loads (Additional Load Carrying Capability or ALCC) so
that New England’s LOLE is exactly at 0.1 days per year. For the 2018/19 CCP, the New
England system, using the resources that qualified as Existing Capacity, is less reliable
than the resource adequacy criterion requirement. Therefore, additional capacity in the
form of proxy units is needed within the model. Proxy units are used if existing capacity
resources are insufficient to meet the resource adequacy planning criterion, as provided
by Section III.12.7.1 of Market Rule 1. Proxy units are assigned availability
characteristics such that when proxy resources are used in place of all the resources
assumed to be available to the system, the resulting system LOLE remains unchanged
from that calculated using the existing resources. The use of proxy units to meet the
20
In the ICR calculation, the HQICCs are treated differently than other resources; they are not adjusted by
the ALCC amount.
HQICCs
APk
ALCC
liefReLoad4OPBenefitsTieCapacityICRtRequiremenCapacityInstalled
1
)(
Page 16
2018/19 ICR Related Values 15
system LOLE criterion is intended to neutralize the size and availability impact of
unknown resource additions on the ICR.
Prior to the calculation of ICR Related Values for the 2018/19 CCP, ISO-NE conducted a
study to update the size and availability characteristics of the proxy units used in the
analysis.21
In the study, proxy unit characteristics are determined using the average
system availability and a series of LOLE calculations. Using these characteristics gives a
proxy unit that when added to the model, does not increase or decrease ICR. For more
details on the proxy unit characteristics, see the section of this report entitled “Proxy
Units.”
To determine the ICR for the 2018/19 CCP, four proxy units were needed in addition to
the existing capacity within the ICR model. In addition, for the 1-in-5 LOLE and the 1-
in-87 LOLE capacity requirements calculations for the Demand Curve, one proxy unit
was needed and14 proxy units were needed, respectively.
Table 4 shows the details of the variables used to calculate the ICR for the 2018/19 CCP.
Table 4: Variables Used to Calculate ICR and Demand Curve (MW)
Local Sourcing Requirements (LSR) Calculation
The methodology for calculating LSR for import-constrained Capacity Zones involves
calculating the amount of resources located within the Capacity Zone that would meet
21
Study results presented at the May 22, 2014 PSPC Meeting: http://www.iso-ne.com/static-
assets/documents/committees/comm_wkgrps/relblty_comm/pwrsuppln_comm/mtrls/2014/may222014/prox
y_unit_2014_study.pdf.
Total Capacity Breakdown 1-in-5 LOLE 2018/19 FCA ICR 1-in-87 LOLE
Generating Resources 29,829 29,829 29,829
Tie Benefits 1,970 1,970 1,970
Imports/Sales (41) (41) (41)
Demand Resources 3,054 3,054 3,054
OP4 - Action 6 & 8 (Voltage Reduction) 441 441 441
Minimum Reserve Requirement (200) (200) (200)
Proxy Unit Capacity 400 1,600 4,400
Total Capacity 35,453 36,653 39,453
Installed Capacity Requirement Calculation Details 1-in-5 LOLE 2018/19 FCA ICR 1-in-87 LOLE
Annual Peak 30,005 30,005 30,005
Total Capacity 35,453 36,653 39,453
Tie Benefits 1,970 1,970 1,970
HQICCs 953 953 953
OP4 - Action 6 & 8 (Voltage Reduction) 441 441 441
Minimum Reserve Requirement (200) (200) (200)
ALCC 99 222 175
Installed Capacity Requirements 34,085 35,142 37,980
Net ICR 33,132 34,189 37,027
Reserve Margin without HQICCs 10.4% 13.9% 23.4%
Page 17
2018/19 ICR Related Values 16
both a local criterion requirement called the Local Resource Adequacy (LRA)
Requirement and a transmission security criterion called the Transmission Security
Analysis (TSA) Requirement. The TSA Requirement is an analysis that ISO-NE uses to
maintain operational reliability when reviewing de-list bids of resources within the FCM
auctions. The system must meet both resource adequacy and transmission security
requirements; therefore, the LSR for an import-constrained zone is the amount of
capacity needed to satisfy “the higher of” either (i) the LRA or (ii) the TSA
Requirement.
Local Resource Adequacy (LRA) Requirement
The LRA Requirements are calculated using the same assumptions for forecasted load
and resources as those used within the calculation of the ICR. To determine the
locational requirements of the system, the LRA Requirements are calculated using the
multi-area reliability model, GE MARS, according to the methodology specified in
Section III.12.2 of Market Rule 1.
The LRA Requirements are calculated using the value of the firm load adjustments and
the existing resources within the zone, including any proxy units that were added as a
result of the total system not meeting the LOLE criteria. Because the LRA Requirement
is the minimum amount of resources that must be located within a zone to meet the
system reliability requirements, for a zone with excess capacity, the process to calculate
this value involves shifting capacity out of the zone under study until the reliability
threshold, or target LOLE, is achieved. Shifting capacity, however, may lead to skewed
results, since the load carrying capability of various resources are not homogeneous. For
example, one megawatt of capacity from a nuclear power plant does not necessarily have
the same load carrying capability as one megawatt of capacity from a wind turbine.
Consequently, in order to model the effect of shifting “generic” capacity, firm load is
shifted. Specifically, as one megawatt of load is added to an import-constrained zone, a
megawatt of load is subtracted from the rest of New England, thus keeping the entire
system load constant. The load that was shifted must be subtracted from the total
resources (including proxy units) to determine the minimum amount of resources that are
required in that zone. Before the shifted load is subtracted, it is first converted to
equivalent capacity by using the average resource-unavailability rate within the zone.
Thus, the LRA Requirement is calculated as the existing resources in the zone including
any proxy units, minus the unavailability-adjusted firm load adjustment.
As this load shift test is being performed over a transmission interface internal to the New
England Balancing Authority Area, an allowance for transmission-related LOLE must
also be applied. This transmission-related LOLE allowance is 0.005 days per year and is
only applied when determining the LRA Requirement of a Capacity Zone. An LOLE of
0.105 days per year is the point at which it becomes clear that the remaining resources
within the zone under study are becoming insufficient to satisfy local capacity
requirements. Further reduction in local resources would cause the LOLE in New
England to rapidly increase above the criterion.
Page 18
2018/19 ICR Related Values 17
For each import-constrained transmission Capacity Zone, the LRA Requirement is
calculated using the following methodology, as outlined in Market Rule 1, Section
III.12.2.1:
a) Model the Capacity Zone under study and the Rest of New England area using the
GE MARS simulation model, reflecting load and resources (supply & demand-
side) electrically connected to them, including external Balancing Authority area
support from tie benefits.
b) If the system LOLE is less than 0.1 days/year, firm load is added (or unforced
capacity is subtracted) so that the system LOLE equals 0.1 days/year.
c) Model the transmission interface constraint between the Load Zone under study
and the Rest of New England.
d) Add proxy units, if required, within the ISO-NE Balancing Authority Area to
meet the resource adequacy planning criterion of once in 10 year disconnection of
non-interruptible customers. If the system LOLE with proxy units added is less
than 0.1 days/year, firm load is added (or unforced capacity is subtracted) so that
the system LOLE equals 0.1 days/year. Proxy units are modeled as stated in
Section III.12.7.1 of Market Rule 1.
e) Adjust the firm load within the Capacity Zone under study until the LOLE of the
ISO-NE Balancing Authority Area reaches 0.105 days per year LOLE. As firm
load is added to (or subtracted from) the Capacity Zone under study, an equal
amount of firm load is removed from (or added to) the Rest of New England.
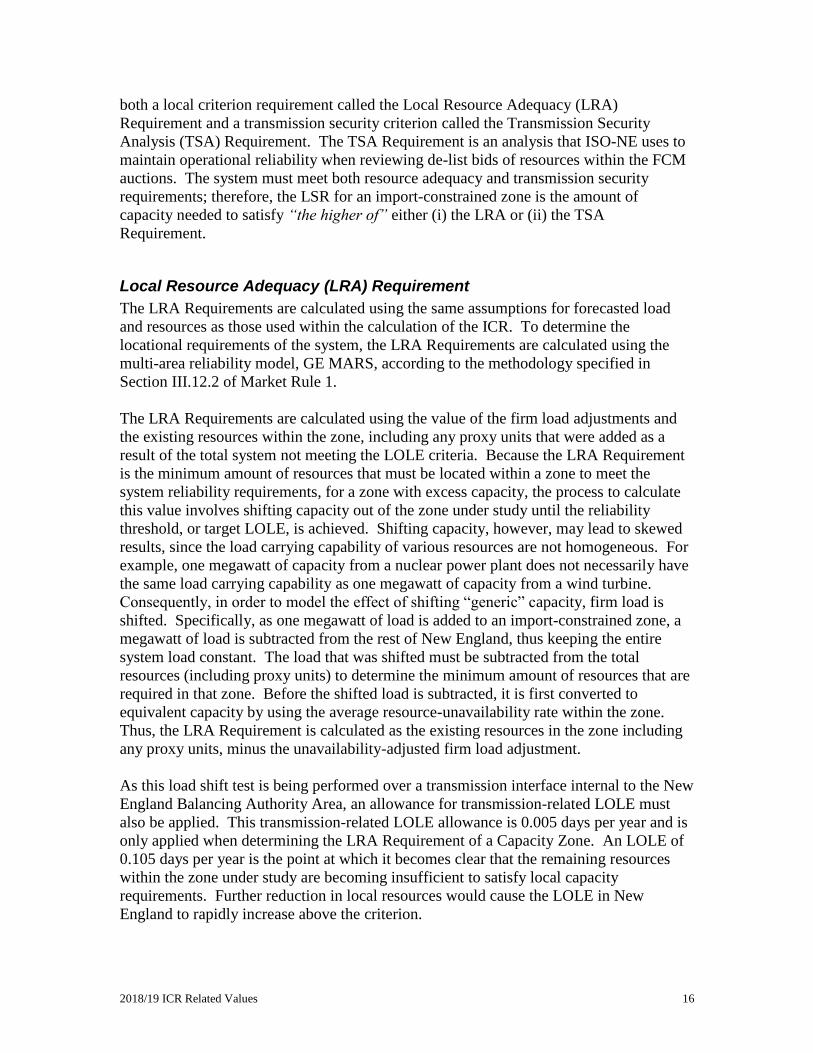
The LRA Requirement is then calculated using the formula:
Page 19
2018/19 ICR Related Values 18
Figure 4: Formula for LRA Calculation
Where LRAz = Local Resource Adequacy Requirement for Capacity Zone Z.
Resourcesz = MW of resources (supply & demand-side) electrically located
within Load Zone Z, including Import Capacity Resources on the
import-constrained side of the interface, if any and excludes
HQICCs.
Proxy Unitsz
= MW of proxy unit additions, if needed, in Capacity Zone Z.
Firm Load Adjustmentz
= MW of firm load added within Capacity Zone Z to make the LOLE
of the New England Balancing Authority area equal to 0.105 days
per year.
FORz
= Capacity weighted average of the forced outage rate modeled for
all resources (supply & demand-side) within Capacity Zone Z,
including any proxy unit additions to Capacity Zone Z.
In addition, when performing the LRA calculation for the Rest of New England area used
in the calculation of local requirements for export-constrained zones, the surplus capacity
adjustment used to bring the system to the 0.1 days per year reliability criterion is also
included in the calculation as:
Figure 5: Surplus Capacity Adjustment in Rest of New England
Where: Surplus Capacity Adjustmentz = MW of firm load added within Zone Z to make the LOLE of the
New England Balancing Authority area equal to 0.1 days per year
Table 5 shows the details of the LRA Requirement calculation for the 2018/19 CCP.
Table 5: LRA Requirement Calculation Details (MW)
Transmission Security Analysis (TSA) Calculation
The TSA is a deterministic reliability screen of a transmission import-constrained area
and is a security review as defined within Section 3 of ISO New England Planning
Procedure No. 3, Reliability Standards for the New England Area Bulk Power Supply
System and within Section 5.4 of Northeast Power Coordinating Council’s (NPCC)
Z
Z
ZZZ
FORAdjustment Load Firm
UnitsProxy ResourcesLRA1
Z
Z
FORAdjustmentCapacity Surplus
1
Connecticut NEMA/Boston SEMA/RI
Resourcez [1] 9,239 3,868 6,984
Proxy Unitsz [2] 0 0 800
Firm Load Adjustmentz [4] 1,825 775 278
FORz [5] 0.074 0.042 0.090
LRAz [5]=[1]+[2]-([3]/(1-[4])) 7,268 3,129 7,479
Page 20
2018/19 ICR Related Values 19
Regional Reliability Reference Directory #1, Design and Operation of the Bulk Power
System.22
The TSA review determines the requirements of the sub-area in order to meet
its load through internal generation and import capacity. It is performed via a series of
discrete transmission load flow study scenarios. In performing the analysis, static
transmission interface transfer limits are established as a reasonable representation of the
transmission system’s capability to serve sub-area demand with available existing
resources. The results are then presented in the form of a deterministic operable capacity
analysis.
In accordance with ISO New England Planning Procedure No. 3 and NPCC’s Regional
Reliability Reference Directory #1, the TSA includes evaluations of both: (1) the loss of
the most critical transmission element and the most critical generator (Line-Gen), and (2)
the loss of the most critical transmission element followed by loss of the next most
critical transmission element (Line-Line). These deterministic analyses are currently
used each day by ISO-NE System Operations to assess the amount of capacity required to
be committed day-ahead within import-constrained Capacity Zones. Further, such
deterministic sub-area transmission security analyses have consistently been used for
reliability review studies performed to determine whether a resource seeking to retire or
de-list would cause a violation of the reliability criteria.
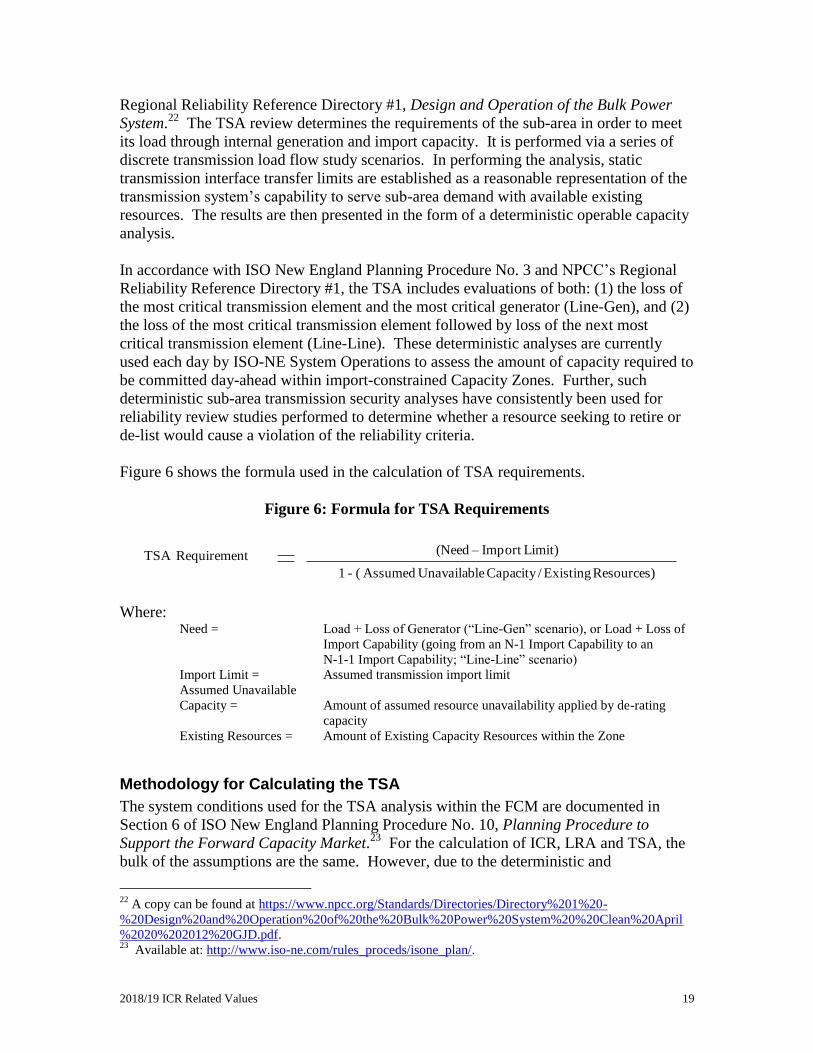
Figure 6 shows the formula used in the calculation of TSA requirements.
Figure 6: Formula for TSA Requirements
Where: Need = Load + Loss of Generator (“Line-Gen” scenario), or Load + Loss of
Import Capability (going from an N-1 Import Capability to an
N-1-1 Import Capability; “Line-Line” scenario)
Import Limit = Assumed transmission import limit
Assumed Unavailable
Capacity = Amount of assumed resource unavailability applied by de-rating
capacity
Existing Resources = Amount of Existing Capacity Resources within the Zone
Methodology for Calculating the TSA
The system conditions used for the TSA analysis within the FCM are documented in
Section 6 of ISO New England Planning Procedure No. 10, Planning Procedure to
Support the Forward Capacity Market.23
For the calculation of ICR, LRA and TSA, the
bulk of the assumptions are the same. However, due to the deterministic and
22
A copy can be found at https://www.npcc.org/Standards/Directories/Directory%201%20-
%20Design%20and%20Operation%20of%20the%20Bulk%20Power%20System%20%20Clean%20April
%2020%202012%20GJD.pdf. 23
Available at: http://www.iso-ne.com/rules_proceds/isone_plan/.
(Need – Import Limit)
1 - ( Assumed Unavailable Capacity / Existing Resources)
TSA Requirement
Page 21
2018/19 ICR Related Values 20
transmission security-oriented nature of the TSA, some of the assumptions for calculating
the TSA requirement differ from the assumptions used in determining the LRA
Requirement. The differences are as follows: the assumed loads for the TSA are the
90/10 peak loads for the Connecticut, Boston and combined SEMA and Rhode Island
sub-areas24
for the 2018/19 CCP, whereas for LRA calculations, a distribution of loads
covering the range of possible peak loads for that CCP is used. In addition, for the TSA,
the forced outage of fast-start (peaking) generation is based on an assumed value of 20%
instead of being based on historical five-year average generating unit performance.
Finally, the load and capacity relief obtainable from actions of ISO-NE OP-4, with the
exception of Demand Resources (which are treated as capacity resources), is not assumed
within TSA calculations.
Table 5 shows the details of the TSA requirement calculation for the Connecticut,
NEMA/Boston, and SEMA/RI Capacity Zones.
Table 6: TSA Calculation Details (MW)
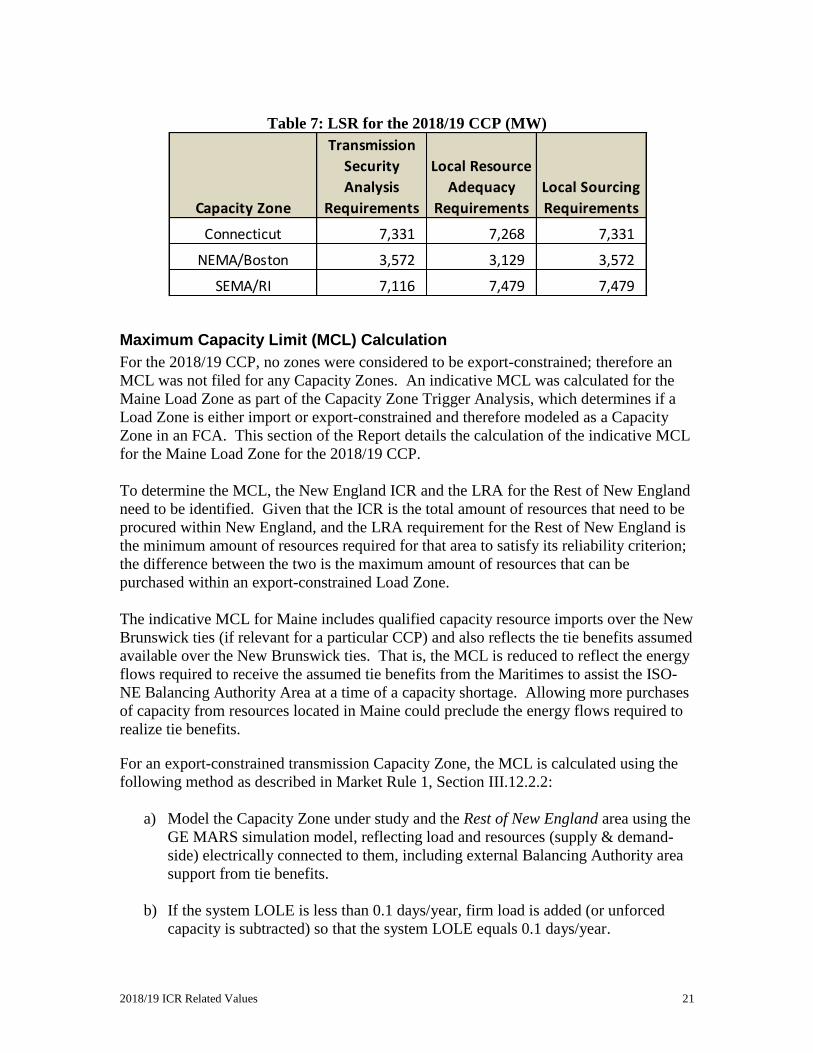
Local Sourcing Requirement (LSR)
The LSR is determined as the higher of the LRA Requirement or TSA Requirement for
the respective Capacity Zone. Table 7 summarizes the LRA and TSA for the
Connecticut, NEMA/Boston and SEMA/RI Capacity Zones. As shown, the LRA is the
highest requirement for the SEMA/RI Capacity Zone while the TSA is the highest
requirement for the Connecticut and NEMA/Boston Capacity Zones. Therefore, the LSR
for the Connecticut, NEMA/Boston and SEMA/RI Capacity Zones are 7,331 MW, 3,572
MW and 7,479 MW, respectively.
24
The combined Connecticut, Southwest Connecticut and Norwalk sub-areas, the Boston sub-area, and the
combined Southeastern Massachusetts and Rhode Island sub-area load forecast and resources are used as
proxies for the Connecticut, NEMA/Boston and SEMA/RI Capacity Zones load forecast and resources
since the transmission transfer capability of the interfaces used in the respective LSR calculations are
determined based on the 13 sub-area system representations used within ISO-NE’s Regional System Plan
(RSP).
Connecticut NEMA/Boston SEMA/RI
2014 Sub-area 90/10 Load* 8,415 6,835 6,465
Reserves (Largest unit or loss of import capability) 1,225 1,412 700
Sub-area Transmission Security Need 9,640 8,247 7,165
Sub-area Existing Resources 9,239 3,868 6,984
Assumed Unavailable Capacity -808 -190 -723
Sub-area N-1 Import Limit 2,950 4,850 786
Sub-area Available Resources 11,381 8,528 7,047
TSA Requirement = (9640-2950)/(1-808/9239) (8247-4850)/(1-190/3868) (7165-786)/(1-723/6984)
= 7,331 = 3,572 = 7,116
Page 22
2018/19 ICR Related Values 21
Table 7: LSR for the 2018/19 CCP (MW)
Maximum Capacity Limit (MCL) Calculation
For the 2018/19 CCP, no zones were considered to be export-constrained; therefore an
MCL was not filed for any Capacity Zones. An indicative MCL was calculated for the
Maine Load Zone as part of the Capacity Zone Trigger Analysis, which determines if a
Load Zone is either import or export-constrained and therefore modeled as a Capacity
Zone in an FCA. This section of the Report details the calculation of the indicative MCL
for the Maine Load Zone for the 2018/19 CCP.
To determine the MCL, the New England ICR and the LRA for the Rest of New England
need to be identified. Given that the ICR is the total amount of resources that need to be
procured within New England, and the LRA requirement for the Rest of New England is
the minimum amount of resources required for that area to satisfy its reliability criterion;
the difference between the two is the maximum amount of resources that can be
purchased within an export-constrained Load Zone.
The indicative MCL for Maine includes qualified capacity resource imports over the New
Brunswick ties (if relevant for a particular CCP) and also reflects the tie benefits assumed
available over the New Brunswick ties. That is, the MCL is reduced to reflect the energy
flows required to receive the assumed tie benefits from the Maritimes to assist the ISO-
NE Balancing Authority Area at a time of a capacity shortage. Allowing more purchases
of capacity from resources located in Maine could preclude the energy flows required to
realize tie benefits.
For an export-constrained transmission Capacity Zone, the MCL is calculated using the
following method as described in Market Rule 1, Section III.12.2.2:
a) Model the Capacity Zone under study and the Rest of New England area using the
GE MARS simulation model, reflecting load and resources (supply & demand-
side) electrically connected to them, including external Balancing Authority area
support from tie benefits.
b) If the system LOLE is less than 0.1 days/year, firm load is added (or unforced
capacity is subtracted) so that the system LOLE equals 0.1 days/year.
Capacity Zone
Transmission
Security
Analysis
Requirements
Local Resource
Adequacy
Requirements
Local Sourcing
Requirements
Connecticut 7,331 7,268 7,331
NEMA/Boston 3,572 3,129 3,572
SEMA/RI 7,116 7,479 7,479
Page 23
2018/19 ICR Related Values 22
c) Model the transmission interface constraint between the Capacity Zone under
study and the Rest of New England area.
d) Add proxy units, if required, within the ISO-NE Balancing Authority Area to
meet the resource adequacy planning criterion of once in 10 years of
disconnection of non-interruptible customers. If the system LOLE with proxy
units added is less than 0.1 days/year, firm load is added (or unforced capacity is
subtracted) so that the system LOLE equals 0.1 days/year.
e) Adjust the firm load within the Rest of New England area until the LOLE of the
Rest of New England area reaches 0.105 days per year LOLE. As firm load is
added to (or subtracted from) the Rest of New England area, an equal amount of
firm load is removed from (or added to) the Capacity Zone under study.
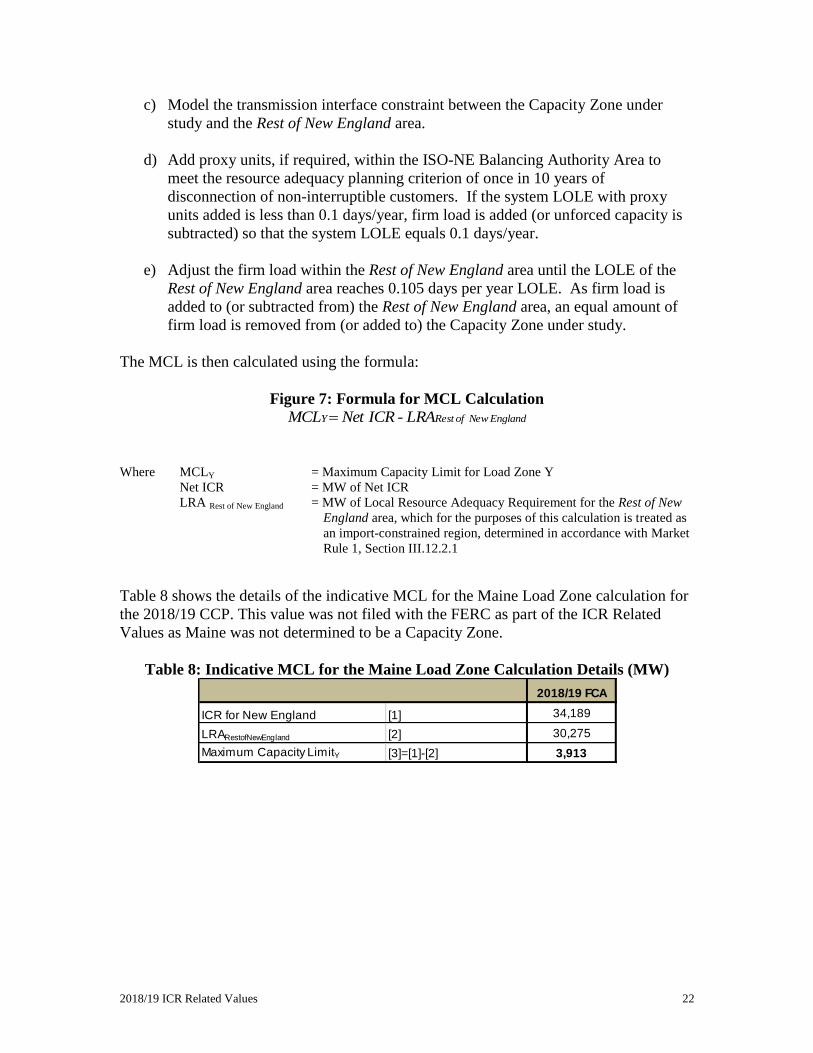
The MCL is then calculated using the formula:
Figure 7: Formula for MCL Calculation
Where MCLY = Maximum Capacity Limit for Load Zone Y
Net ICR = MW of Net ICR
LRA Rest of New England = MW of Local Resource Adequacy Requirement for the Rest of New
England area, which for the purposes of this calculation is treated as
an import-constrained region, determined in accordance with Market
Rule 1, Section III.12.2.1
Table 8 shows the details of the indicative MCL for the Maine Load Zone calculation for
the 2018/19 CCP. This value was not filed with the FERC as part of the ICR Related
Values as Maine was not determined to be a Capacity Zone.
Table 8: Indicative MCL for the Maine Load Zone Calculation Details (MW)
England New of RestY LRA - ICR Net MCL
2018/19 FCA
ICR for New England [1] 34,189
LRARestofNewEngland [2] 30,275
Maximum Capacity LimitY [3]=[1]-[2] 3,913
Page 24
2018/19 ICR Related Values 23
Assumptions
Load Forecast
For each state in New England, ISO-NE develops a forecast distribution of typical daily
peak loads for each week of the year based on each week’s historical weather distribution
combined with an econometrically estimated monthly model of typical daily peak
demands. Each weekly distribution of typical daily peak demands includes the full range
of daily peaks that could occur over the full range of weather experienced within that
week along with their associated probabilities.
The load forecast models for each of the six New England states were estimated using
thirteen years of historical weekday daily peaks, the weather conditions at the time of the
daily peak, a seasonal relationship that captures the change in peak demand response to
weather over time, and a seasonal relationship that captures the change in peak demand
response to base energy demand (and therefore economic and demographic factors) over
time. The weather response relationships are forecast to grow at their historical rates but
are adjusted for expected changes in electric appliance saturations. The base load
relationships are forecasted to grow at the same rate as the associated energy forecast.
The weather is represented by over forty years of historically-based weekly regional
weather. The energy forecast for each state is econometrically estimated using forecasts
of the real price of electricity and either real income or real gross state product.
For purposes of determining the load forecast, ISO-NE Balancing Authority Area’s load
is defined as the sum of the load of each of the six New England states, calculated as
described above. The forecasted load for the Connecticut Capacity Zone is the forecasted
load for the state of Connecticut. The forecasted load for the NEMA/Boston Capacity
Zone is developed using a load share ratio of the NEMA/Boston load to the forecasted
load for the entire state of Massachusetts. The load share ratio is based on detailed bus
load data from the network model for NEMA/Boston, as compared to the entire state of
Massachusetts. The forecasted load for the SEMA portion of the SEMA/RI Capacity
Zone is developed using the same load share ratio methodology as NEMA/Boston, while
the RI portion is the load forecast for the state of Rhode Island.
The overall New England and individual sub-area load forecasts used in the calculation
of ICR Related Values for the 2018/19 CCP are documented within the 2014 Forecast
Report of Capacity, Energy, Loads and Transmission (CELT Report).25
Load Forecast Uncertainty
GE MARS models the load forecast using hourly chronological sub-area loads and can
include the effects of load forecast uncertainty by calculating the LOLE for up to ten
different load levels and computes a weighted-average value based on the input
25
Located on ISO-NE’s website at: http://www.iso-ne.com/static-
assets/documents/trans/celt/report/2014/2014_celt_report_rev.pdf.
Page 25
2018/19 ICR Related Values 24
probabilities. Load forecast uncertainty multipliers are then used to account for load
uncertainty related to weather. These are the “per unit” multipliers used for computing
the loads used to calculate the reliability indices. Each per unit multiplier represents a
load level, which is assigned a probability of that load level occurring. The mean, or 1.0
multiplier, represents the 50/50 forecast for peak load. These uncertainty multipliers are
allowed to vary by month.
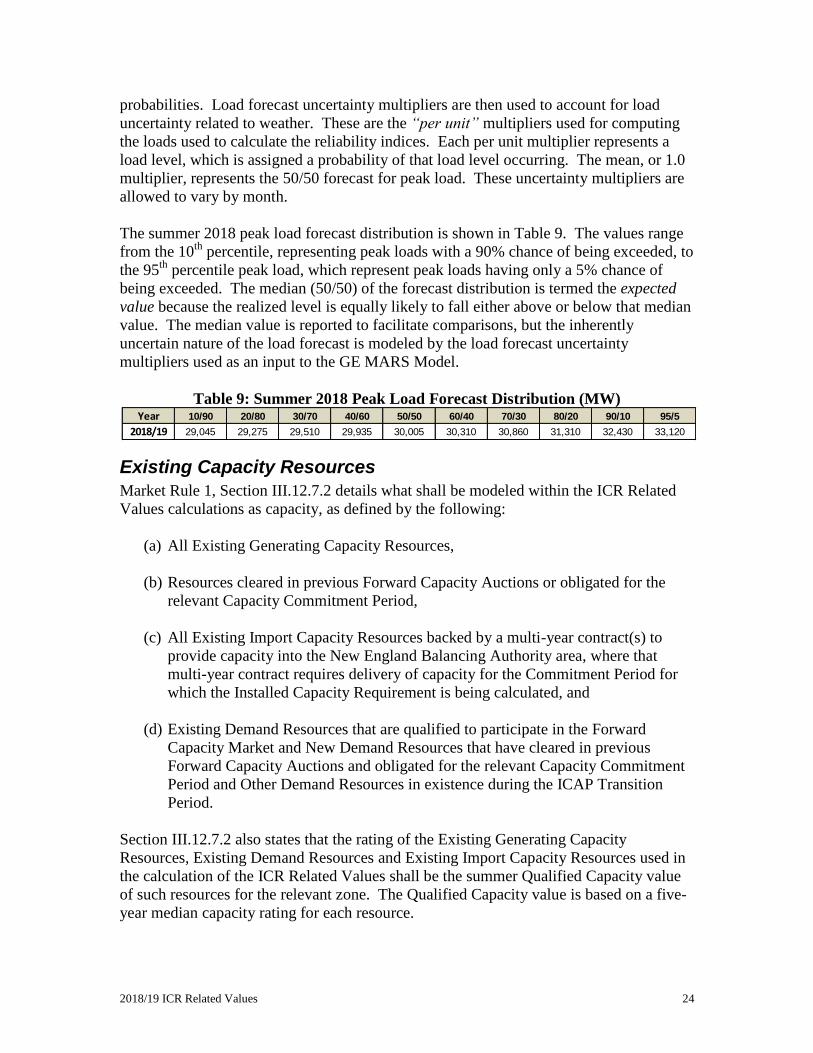
The summer 2018 peak load forecast distribution is shown in Table 9. The values range
from the 10th
percentile, representing peak loads with a 90% chance of being exceeded, to
the 95th
percentile peak load, which represent peak loads having only a 5% chance of
being exceeded. The median (50/50) of the forecast distribution is termed the expected
value because the realized level is equally likely to fall either above or below that median
value. The median value is reported to facilitate comparisons, but the inherently
uncertain nature of the load forecast is modeled by the load forecast uncertainty
multipliers used as an input to the GE MARS Model.
Table 9: Summer 2018 Peak Load Forecast Distribution (MW)
Existing Capacity Resources
Market Rule 1, Section III.12.7.2 details what shall be modeled within the ICR Related
Values calculations as capacity, as defined by the following:
(a) All Existing Generating Capacity Resources,
(b) Resources cleared in previous Forward Capacity Auctions or obligated for the
relevant Capacity Commitment Period,
(c) All Existing Import Capacity Resources backed by a multi-year contract(s) to
provide capacity into the New England Balancing Authority area, where that
multi-year contract requires delivery of capacity for the Commitment Period for
which the Installed Capacity Requirement is being calculated, and
(d) Existing Demand Resources that are qualified to participate in the Forward
Capacity Market and New Demand Resources that have cleared in previous
Forward Capacity Auctions and obligated for the relevant Capacity Commitment
Period and Other Demand Resources in existence during the ICAP Transition
Period.
Section III.12.7.2 also states that the rating of the Existing Generating Capacity
Resources, Existing Demand Resources and Existing Import Capacity Resources used in
the calculation of the ICR Related Values shall be the summer Qualified Capacity value
of such resources for the relevant zone. The Qualified Capacity value is based on a five-
year median capacity rating for each resource.
Year 10/90 20/80 30/70 40/60 50/50 60/40 70/30 80/20 90/10 95/5
2018/19 29,045 29,275 29,510 29,935 30,005 30,310 30,860 31,310 32,430 33,120
Page 26
2018/19 ICR Related Values 25
Summaries of resources categorized as Existing Capacity within the ICR Related Values
calculations are provided in the sections below.26
It should be noted that with the
exception of Intermittent Power Resources (IPR), only summer capacity values are used
within the calculation of the ICR Related Values.
For the 2018/19 CCP, a total of approximately 319 MW of resources were at risk of
having their FCA Qualified Capacity administratively set by ISO-NE to the lesser of their
summer or winter Qualified Capacity rating due to Market Rule III.13.1.2.2.5.2, which
relates to an Existing Capacity resource which has a higher summer Qualified Capacity
than winter Qualified Capacity. While resources in this situation had opportunities to
mitigate this potential derating, ISO-NE did not know with certainty the exact amount of
the administratively reduced capacity and therefore, these MWs were not removed from
the model for the FCA9 ICR Related Values calculation.
For the 2018/19 FCA ICR Related Values calculations, there were a total of 32,842 MW
of capacity resources modeled. These capacity resources are made up of generating,
intermittent, demand and import resources along with a reduction in generating capacity
to account for exports and de-ratings of import capacity. These resources are described
in more detail in Table 10 – Table 15 of this report.
Generating Resources
Market Rule 1, Section III.13.1.2.2.1.1 states that the summer Qualified Capacity of a
Generating Resource is calculated as the median of the most recent five summer Seasonal
Claimed Capability (SCC) ratings with only positive, non-zero ratings included within
the calculation. Generating resources, by Load Zone, used within the ICR Related
Values calculations were based on Qualified Existing Generating Resources for the
2018/19 CCP at the time of the ICR calculation and are summarized in Table 10.
Table 10: Existing Qualified Generating Capacity by Load Zone (MW)
26
For detailed data on the Qualified Existing Resources that participated in the FCA9 see:
http://www.iso-ne.com/static-assets/documents/2014/11/er15-___-000_11-
3_14_fca_9_info_filing_public_version.pdf.
Load Zone Summer
MAINE 2,888.145
NEW HAMPSHIRE 4,070.494
VERMONT 255.102
CONNECTICUT 8,255.015
RHODE ISLAND 1,861.432
SOUTH EAST MASSACHUSETTS 4,471.042
WEST CENTRAL MASSACHUSETTS 3,880.929
NORTH EAST MASSACHUSETTS & BOSTON 3,235.563
Total New England 28,917.722
Page 27
2018/19 ICR Related Values 26
Intermittent Power Resources
Section III.13.1.2.2.2 of Market Rule 1 discusses the rating methodology of resources
considered Intermittent Power Resources (IPR). IPR are defined as wind, solar, run-of-
river hydro-electric and other renewable resources that do not have direct control over
their net power output.
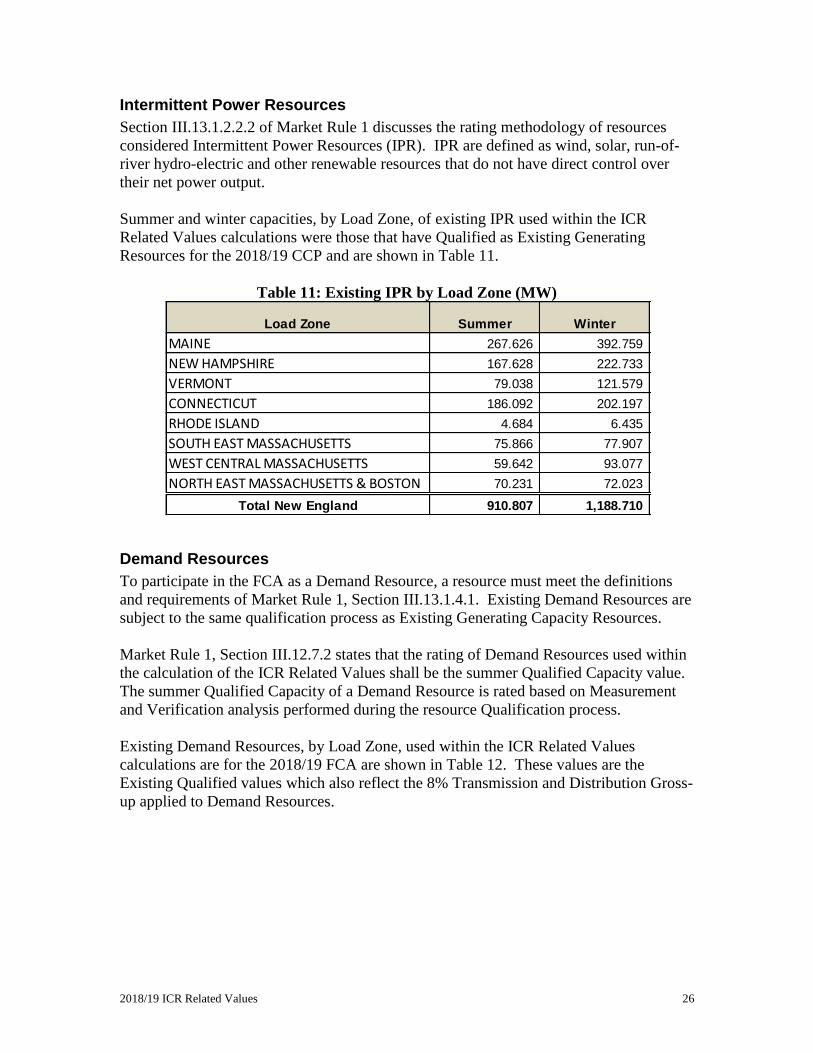
Summer and winter capacities, by Load Zone, of existing IPR used within the ICR
Related Values calculations were those that have Qualified as Existing Generating
Resources for the 2018/19 CCP and are shown in Table 11.
Table 11: Existing IPR by Load Zone (MW)
Demand Resources
To participate in the FCA as a Demand Resource, a resource must meet the definitions
and requirements of Market Rule 1, Section III.13.1.4.1. Existing Demand Resources are
subject to the same qualification process as Existing Generating Capacity Resources.
Market Rule 1, Section III.12.7.2 states that the rating of Demand Resources used within
the calculation of the ICR Related Values shall be the summer Qualified Capacity value.
The summer Qualified Capacity of a Demand Resource is rated based on Measurement
and Verification analysis performed during the resource Qualification process.
Existing Demand Resources, by Load Zone, used within the ICR Related Values
calculations are for the 2018/19 FCA are shown in Table 12. These values are the
Existing Qualified values which also reflect the 8% Transmission and Distribution Gross-
up applied to Demand Resources.
Load Zone Summer Winter
MAINE 267.626 392.759
NEW HAMPSHIRE 167.628 222.733
VERMONT 79.038 121.579
CONNECTICUT 186.092 202.197
RHODE ISLAND 4.684 6.435
SOUTH EAST MASSACHUSETTS 75.866 77.907
WEST CENTRAL MASSACHUSETTS 59.642 93.077
NORTH EAST MASSACHUSETTS & BOSTON 70.231 72.023
Total New England 910.807 1,188.710
Page 28
2018/19 ICR Related Values 27
Table 12: Existing Demand Resources by Load Zone (MW)
Import Resources
The Summer Qualified Capacity of an Existing Import Capacity Resource modeled
within the ICR calculation follows Market Rule 1, Section III.13.1.3.3, which outlines the
Qualification Process for Existing Import Capacity Resources.
The rating of imports used within the calculation of the ICR Related Values is the
summer Qualified Capacity value, reduced by any submitted de-list bids reflecting the
value of a firm contract(s) or any de-ratings due to Transmission Transfer Capability
(TTC) limitations. If the overall amount of Existing Qualified Import Capacity over a
transmission interface is greater than the transmission interface limit, the capacity of the
import(s) being modeled within the ICR calculation is subsequently reduced to a value
equal to that of the applicable transmission interface TTC. Table 13 shows the Existing
Qualified Import Resources used within the ICR Related Values calculations for the
2018/19 CCP and the corresponding external transmission interface supplying the import
capacity (MWs). There were no de-ratings of TTC for the Existing Qualified Import
Capacity Resources for 2018/19 CCP. However; there was a 30 MW de-rating of
generating capacity to reflect the value of the Vermont Joint Owners (VJO) contract.
Table 13: Existing Import Resources (MW)
Export Bids
An Export Bid is a Participant bid that may be submitted by certain resources in the FCA
to export capacity to an external Balancing Authority area, as described in Section
III.13.1.2.3.2.3 of Market Rule 1.
Market Rule 1 Section III.12.7.2 paragraph e) states that:
Load Zone On-Peak
Seasonal
Peak
Real-Time
Demand
Response
Real-Time
Emergency
Gen Total
MAINE 176.925 0.000 207.892 11.802 396.619
NEW HAMPSHIRE 94.951 0.000 18.707 14.022 127.680
VERMONT 125.420 0.000 37.007 2.866 165.293
CONNECTICUT 80.728 324.316 254.510 138.338 797.892
RHODE ISLAND 172.704 0.000 57.595 33.540 263.839
SOUTH EAST MASSACHUSETTS 252.710 0.000 38.785 15.962 307.457
WEST CENTRAL MASSACHUSETTS 260.352 52.968 91.799 27.798 432.917
NORTH EAST MASSACHUSETTS & BOSTON 486.312 0.000 50.189 26.099 562.600
Total New England 1,650.102 377.284 756.484 270.427 3,054.297
Import Resource Summer External Interface
VJO - Highgate 6.000 Hydro-Quebec Highgate
NYPA - CMR 68.800 New York AC Ties
NYPA - VT 14.000 New York AC Ties
Total MW 88.800
Page 29
2018/19 ICR Related Values 28
“…capacity associated with Export Bids cleared in previous Forward Capacity Auctions and
obligated for the relevant Capacity Commitment Period” shall be excluded from the ICR
Related Values calculation.
Only one capacity export was modeled within the ICR Related Values calculation
assumptions. This is the 100 MW sale of capacity to the Long Island Power Authority
(LIPA) over the Cross-Sound Cable, which is modeled as a reduction in capacity from
the unit-specific resource backing the export contract.
Table 14: Capacity Exports (MW)
New Capacity Resources
Market Rule 1, Section III.12.7.2 describes the capacity resources that were modeled
within the ICR calculations as the aggregate amount of Existing Generation Capacity
Resources, Existing Import Capacity Resources, and Existing Demand Resources.
Resource capacity that qualifies as a New Capacity Resource is not modeled within the
ICR calculation.
Resources Used to Calculate Locational Requirements
The LRA and TSA values, used to determine the LSR for the import-constrained
Connecticut, NEMA/Boston and SEMA/RI Capacity Zones are calculated with resource
locations identified within the ISO-NE’s Regional System Plan (RSP) sub-areas
representing Connecticut, Boston and SEMA/RI combined, respectively. These
resources are used as proxies for resources located within those Capacity Zones. This is
done because the TTC calculated for the interfaces studied in the locational requirements
analyses use the ISO-NE RSP sub-areas and are thus calculated for the RSP zones. For
Demand Resources, the Existing Qualified Demand Resources for the Capacity Zone are
used because the RSP values available would have to be estimated (particularly for the
Passive Demand Resources) since actual locations for some of these resources are not
currently available.
For the 2018/19 FCA ICR Related Values, there are no differences between the resources
located within the corresponding RSP zones versus the resources located within the
Connecticut, NEMA/Boston and combined SEMA/RI Capacity Zones. Table 15 shows
the resources modeled in each of the Capacity Zones with a locational requirement along
with the New England values.
Export Summer
LIPA over Cross-Sound Cable 100.000
Page 30
2018/19 ICR Related Values 29
Table 15: Resources Used in the LSR Calculations (MW)
Transmission Transfer Capability
Market Rule 1, Section III.12.5 requires that ISO-NE update the transmission interface
transfer capability for each internal and external transmission interface for the 2018/19
CCP, if necessary.27
Although external transmission transfer capability is not used within
the ICR calculation, they are used in the determination of tie benefits, including HQICCs,
and will also be used within the FCA to limit the purchases of external installed capacity.
Internal transmission transfer capability limits are used in the determination of any LSR
and MCL values and tie benefit values.
External Transmission Transfer Capability
Table 16 shows the External TTC values that were used within the 2018/19 tie benefits
study.
Table 16: Transmission Transfer Capability of New England External Interfaces
Modeled in the Tie Benefits Study (MW)
External Transmission Interface Availability
The forced and scheduled outage rates of the transmission interfaces connecting ISO-NE
to its neighboring Balancing Authorities are based on historical data provided by these
Balancing Authorities. These values are shown in Table 17 and include the average
forced outage rate (%) and maintenance outage rate (in weeks) as used in the models that
27
For more detailed information on the RSP14 TTC analysis see a presentation from the March 17, 2014
Planning Advisory Committee (PAC) meeting: http://www.iso-ne.com/static-
assets/documents/committees/comm_wkgrps/prtcpnts_comm/pac/mtrls/2014/mar172014/a8_rsp14_transmission_interf
ace_transfer_capabilities.pdf.
Type of Resource New England Connecticut NEMA/Boston SEMA/RI
Generating Resources 28,787.722 8,255.015 3,235.563 6,332.474
Intermittent Power Resources 910.807 186.092 70.231 80.550
Passive Demand Resources 2,027.386 405.044 486.312 425.414
Active Demand Resources 1,026.911 392.848 76.288 145.882
Import Resources 88.800 - - -
Total MW Modeled 32,841.626 9,238.999 3,868.394 6,984.320
External Interfaces Into New England Summer TTC
Hydro-Quebec to New England via Phase II 1,400
Hydro-Quebec to New England via Highgate 200
New Brunswick to New England 700
New York to New England via New York AC Ties 1,400
New York to New England via Cross-Sound Cable DC Interface 0
Page 31
2018/19 ICR Related Values 30
are associated with each external transmission interface. These assumptions were
developed in 2011 and include data from the five-year period of 2006 through 2010.28
Table 17: External Interface Outage Rates (% and Weeks)
Internal Transmission Transfer Capability
For the 2018/19 FCA, ISO-NE evaluated three Capacity Zones relating to their LRA,
using the zone under study and Rest of New England methodology. The first is the
Connecticut Capacity Zone, which is modeled as import-constrained into Connecticut.
The second is the NEMA/Boston Load Zone, which is modeled as import-constrained
into NEMA/Boston. The third is the combined SEMA/RI Capacity Zone, which is
modeled as import-constrained into SEMA/RI. In addition, the TSA analysis, which uses
both the N-1 limit and the N-1-1 limit, was performed for these three Capacity Zones.29
Table 18 shows the N-1 and N-1-1 internal TTC for the Connecticut Import interface,
Boston Import interface, and SEMA/RI Import interface used to calculate LSR within the
Connecticut, NEMA/Boston and SEMA/RI Capacity Zones, respectively. These TTC
values are part of an annual study of transmission topology and are documented in the
2014 Regional System Plan (RSP14).
With the exception of the TTC values for the Connecticut, NEMA/Boston and SEMA/RI
Capacity Zones which are modeled in the LSR calculations, remaining internal interfaces
with a calculated TTC are modeled in the tie benefits study. For the 2018/19 CCP tie
benefits study, these internal interfaces are documented as part of RSP14 and are
available on slide 12 of a presentation given on March 17, 2014 to the Planning Advisory
Committee (PAC):
http://www.iso-ne.com/static-
assets/documents/committees/comm_wkgrps/prtcpnts_comm/pac/mtrls/2014/mar172014/
a8_rsp14_transmission_interface_transfer_capabilities.pdf.
28
For more detail on external tie availability assumptions see: http://www.iso-ne.com/static-
assets/documents/committees/comm_wkgrps/relblty_comm/pwrsuppln_comm/mtrls/2011/jul152011/extern
al_tie_outage_assumptions.pdf. 29
The term N-1 represents the first contingency and the term N-1-1 represents the second contingency.
External Ties
Forced
Outage Rate
(%)
Maintenance
(Weeks)
Hydro-Quebec Phase II 0.39 2.7
Highgate 0.07 1.3
New Brunswick Interface 0.08 0.4
New York AC Interface 0 0
Cross-Sound Cable 0.89 1.5
Page 32
2018/19 ICR Related Values 31
Table 18: Internal Transmission Transfer Capability Modeled in the LSR
Calculations (MW)30,31,32
OP-4 Load Relief
The New England resource planning reliability criterion requires that adequate capacity
resources be planned and installed such that disconnection of firm load would not occur
more often than once in 10 years due to a capacity deficiency, after taking into account
the load and capacity relief obtainable from implementing Emergency Operating
Procedures (EOPs). ISO New England Operating Procedure No. 4 – Action During a
Capacity Deficiency (OP-4) is the EOP for New England. In other words, load and
capacity relief assumed obtainable from implementing certain OP-4 actions are direct
substitutes for capacity resources in meeting the once in 10 years disconnection of firm
load criterion.
Under the FCM, the assumed emergency assistance (i.e. tie benefits) available from
neighboring Balancing Authority areas, load reduction from implementation of 5%
voltage reduction,33
and capacity available from the dispatch of Real-Time Demand
Resources34
and Real-Time Emergency Generating Demand Resources35
all constitute
actions that ISO-NE System Operators can invoke under OP-4 to balance real-time
system supply with demand (as applicable under both actual or forecast capacity shortage
conditions). These actions are used as load and capacity relief assumptions within the
development of the ICR Related Values.
30
The Boston Import TTC shown in Table 18 includes the impact of the retirement of the Salem Harbor
station and inclusion of the advanced NEMA/Boston transmission upgrades in the analysis. The proposed
Footprint generating project was not included in the Boston Import interface import capability and will be
evaluated at a future date. 31
The Connecticut Import shown includes The New England East-West Solution (NEEWS), expected to be
in-service by December 2015 and has been certified and accepted by ISO-NE to be included in FCA9
analyses. 32
The Maine-New Hampshire interface TTC value of 1,900 MW was used in the indicative MCL analysis
and Capacity Zone Trigger Analysis. 33
Action 6 and 8 of OP4. 34
Action 2 of OP4. 35
Action 6 of OP4.
2018/19
N-1 4,850
N-1-1 4,175
N-1 2,950
N-1-1 1,600
N-1 786
N-1-1 473 SEMA/RI Import
Interface
Boston Import
CT Import
Page 33
2018/19 ICR Related Values 32
Tie Benefits
In the event of a capacity shortage in New England, tie benefits reflect the amount of
emergency assistance that is assumed will be available to ISO-NE from its neighboring
Balancing Authority areas, without jeopardizing system reliability in either the ISO-NE
Balancing Authority area or its neighboring Balancing Authority areas. Tie Benefits are
an input into the determination of the ICR Related Values, and in fact, displace the MW
amount of resources that need to be purchased internal to New England within the FCA
by an almost one to one ratio.
Tie Benefits Calculation Methodology
ISO-NE used the procedures for calculating tie benefits documented in Section III.12.9 of
Market Rule 1. The tie benefits calculation methodology includes the calculation of tie
benefits at the system-wide level and for each of the directly interconnected neighboring
Balancing Authority areas of Québec, New Brunswick (Maritimes) and New York.
The tie benefits study for the 2018/19 CCP was conducted using the probabilistic GE
MARS program to model projected system conditions for that timeframe. The
methodology for calculating the total tie benefits, individual Balancing Authority tie
benefits and the tie benefits assumed for individual interconnections is documented in
more detail in Figure 8.
Page 34
2018/19 ICR Related Values 33
Figure 8: Summarization of the Tie Benefits Calculation Process36
Total Tie Benefits
Total tie benefits were calculated using the results of a probabilistic analysis that
determines LOLE indices for the ISO-NE and neighboring Balancing Authority areas.
The LOLE calculations were first done on an interconnected basis that included all
existing connections (tie lines) between ISO-NE’s directly connected neighboring
Balancing Authority areas. This established the minimum amount of capacity that each
area needs in order to comply with the NPCC resource adequacy requirements of 0.1
days per year LOLE.
These LOLE calculations were then repeated with ISO-NE isolated from all neighboring
Balancing Authority areas. The tie benefits are then quantified by adding firm capacity
resources within the isolated ISO-NE Balancing Authority area, until the LOLE is
returned back to 0.1 days per year. The resources which were added to return ISO-NE to
a LOLE of 0.1 days per year are called “firm capacity equivalents” and are assumed to
be ISO-NE’s total tie benefits.
Based on the methodology described above, a total of 1,970 MW of tie benefits are
assumed within the ICR calculations for the 2018/19 CCP.
Individual Balancing Authority Area Tie Benefits
For calculating each Balancing Authority area’s individual tie benefits, all the tie lines
associated with the Balancing Authority area of interest are treated on an aggregate basis.
36
A presentation on the 2018/19 Tie Benefits Study was reviewed at the RC on September 16, 2014 which
provides more details on the calculation details and study assumptions and is available at http://www.iso-
ne.com/static-assets/documents/2014/09/a6_fca9_tie_benefits_study.pdf.
• Process 1.0 – Calculate the tie benefits values for all possible interconnection states using isolated New England
system as the reference
• Process 2.0 – Calculate initial total tie benefits for New England from all neighboring Balancing Authority Areas
• Process 3.0– Calculate initial tie benefits for each individual neighboring Balancing Authority Area– Pro-rate tie benefits values of individual Balancing Authority Areas based on the total tie benefits, if
necessary
• Process 4.0– Calculate initial tie benefits for individual interconnection or group of interconnections– Pro-rate tie benefits values of individual interconnection or group of interconnections based on the
individual Balancing Authority Area tie benefits, if necessary
• Process 5.0– Adjust tie benefits of individual interconnection or group of interconnections to account for capacity
imports
• Process 6.0– Calculate the final tie benefits for each individual neighboring Balancing Authority Area
• Process 7.0– Calculate the final total tie benefits for New England
Page 35
2018/19 ICR Related Values 34
The tie benefits from each Balancing Authority area are calculated for all possible
interconnection states. The simple average of these tie benefits from each of these states
will represent the calculated tie benefits from that specific Balancing Authority area.
If the sum of the Balancing Authority areas tie benefits is different from the total tie
benefits for ISO-NE, then each Balancing Authority area’s tie benefits are adjusted (up or
down) based on the ratio of the individual Balancing Authority area tie benefits to the
total tie benefits.
For the 2018/19 CCP, the individual Balancing Authority area tie benefits were
calculated as 1,101 MW for Québec, 523 MW for the Maritimes, and 346 MW for New
York.
Individual Tie (or Group of Ties) Tie Benefits
The tie benefits methodology calls for tie benefits to be calculated for an individual tie or
group of ties to the extent that a discrete and material transfer capability can be identified
for it. To calculate tie benefits for each tie or group of ties from the external Balancing
Authority area of interest into ISO-NE, each is treated independently. The tie benefits for
each individual tie or group of ties is calculated for all the interconnection states and the
simple average of the tie benefits associated with these interconnections states is the
resultant tie benefits for each tie or group of ties.
If the sum of the tie benefits from the individual tie or group of ties relative to their
Balancing Authority area’s total tie benefits are different, then the tie benefits of each
individual tie or group of ties are adjusted (up or down) based on the ratio of the tie
benefits of the individual tie or group of ties to the Balancing Authority area’s total tie
benefits.
For the 2018/19 CCP, individual interconnection tie benefits were determined from
Québec over the HQ Phase II facility of 953 MW, 148 MW from Québec over the
Highgate facility, 523 MW from the Maritimes over the New Brunswick interface and
346 MW of the New York tie benefits are delivered over the New York AC ties and 0
MW from the Cross-Sound Cable.
Hydro-Québec Interconnection Capability Credits (HQICCs)37
Hydro-Québec Interconnection Capability Credits, or HQICCs, are an allocation of the
tie benefit over the Hydro-Québec Interconnection to the Interconnection Rights Holders
(IHR), which are regional entities that hold certain contractual entitlements (i.e. rights)
over this specific transmission interconnection. These rights are monetized as credits in
the form of reduced capacity requirements.
37
The 2018/19 CCP HQICCs values were filed with the Commission in the 2018/19 ICR filing:
http://www.iso-ne.com/static-assets/documents/2014/11/er15-___-000_11-6-14_2018-2019_icr_filing.pdf.
Page 36
2018/19 ICR Related Values 35
The HQICC value is 953 MW, as determined by the tie benefits from Québec over the
Phase II facility, and are applicable for every month during the 2018/19 CCP.
Adjustments to Tie Benefits
Processes 5.0 of the current tie benefits methodology requires that that individual
interconnections or group of interconnections tie benefit values be adjusted, if necessary
to account for the Existing Qualified Import Capacity Resources for 2018/19. If the sum
of the tie benefits value and the import capacity is greater than the TTC of the individual
interconnection or group of interconnections under study, then the tie benefits value will
be reduced.
Process 6.0 of the tie benefits methodology determines the final tie benefits for each
neighboring Balancing Authority Area as the sum of the tie benefits from the individual
interconnections or groups of interconnections with that Balancing Authority Area, after
accounting for any adjustment for capacity imports as determined within Process 5.0.
Final total tie benefits for the New England Balancing Authority Area from all
neighboring Balancing Authority Areas is determined within Process 7.0 of the tie
benefits methodology as the sum of these neighboring area tie benefits after accounting
for any adjustment for capacity imports as determined within Process 6.0.
For the 2018/19 CCP, Table 19 shows the Existing Qualified Import Capacity Resources
used to determine if adjustments of tie benefits are necessary as defined within Process
5.0 through Process 7.0 of the tie benefits methodology. For the 2018/19 Tie Benefits
Study, no adjustment to tie benefits to account for capacity imports was necessary.
Table 19: Capacity Imports Used to Adjust Tie Benefits by External Interface (MW)
The results of the Tie Benefits Study for the 2018/19 CCP are summarized in Table 20.
Import
New
Brunswick
Hydro-Québec
Phase II Highgate
New York AC
Ties
NYPA - CMR 68.8
NYPA - VT 14
VJO - Highgate 6
Total 6 82.8
Page 37
2018/19 ICR Related Values 36
Table 20: 2018/19 Tie Benefits (MW)
Comparison of the 2018/19 and 2017/18 CCP’s Tie Benefits
Table 21 gives a comparison of the 2018/19 CCP tie benefits calculated for FCA9 and the
2017/18 CCP tie benefits calculated for FCA8.
Table 21: 2018/19 versus 2017/18 Tie Benefits (MW)
As the results show, the total tie benefits for the New England Balancing Authority Area
has increased by 100 MW for the 2018/19 CCP versus the 2017/18 CCP. With the
retirement of the Vermont Yankee nuclear generating station in the north and the Brayton
Point generating station in the south, the North-South interface within New England has
become even more constrained. The additional constraint of this transmission interface
has shifted tie benefits from the northern side (Québec) to the southern side (New York)
of the North-South transmission interface, which results in an increase in the tie benefit
contributions from the New York over the New York AC ties and a subsequent decrease
from Québec over the Phase II transmission interface.
5% Voltage Reduction
In addition to tie benefits, load reduction from implementation of a 5% voltage reduction
is used in the development of the ICR Related Values. This constitutes an action that
ISO-NE System Operators can invoke in real-time under ISO-NE OP-4, to balance
system supply with demand under actual or expected capacity shortage conditions.
The amount of load relief assumed obtainable from invoking a 5% voltage reduction is
based on the performance standard established within ISO New England’s Operating
Procedure No. 13, Standards for Voltage Reduction and Load Shedding Capability
Balancing Authority Area Summer Winter
Québec via Phase II 953 953
Québec via Highgate 148 148
Maritimes 523 523New York 346 346
Total Tie Benefits 1,970 1,970
Balancing Authority Area 2018/19 FCA9 2017/18 FCA8
Québec via Phase II 953 1,068
Québec via Highgate 148 83
Maritimes 523 492
New York 346 227
Total Tie Benefits 1,970 1,870
Page 38
2018/19 ICR Related Values 37
(“Operating Procedure No. 13” or OP13). ISO-NE Operating Procedure No. 13 requires
that…
“…each Market Participant with control over transmission/distribution facilities
must have the capability to reduce system load demand at the time a voltage
reduction is initiated by at least one and one-half (1.5) percent through
implementation of a voltage reduction.”
The calculation of the amount of 5% voltage reduction to be assumed within the ICR
Related Values calculations uses the benchmark 1.5% value of load relief as specified in
Appendix A of OP-4.38
This benchmark reduction value is set based on the voltage
reduction requirements of Operating Procedure No. 13, rather than the self-reported
values submitted by Market Participants with control over transmission/distribution
facilities.
For the 2018/19 ICR calculation, the methodology for calculating the amount of 5%
voltage reduction assumed within the ICR remains the same as used in the prior year’s
ICR calculations. This methodology uses the 90/10 peak load forecast and assumes that
all Demand Resources will have already been implemented, and thus, will have reduced
the 90/10 load value at the time of peak or OP-4 invocation.
Thus the voltage reduction load relief values assumed as offsets against the ICR are
calculated as the 1.5% voltage reduction assumption times the 90/10 peak load forecast
after accounting for the amount of all Demand Resources (with the exception of limiting
the amount of Real-Time Emergency Generation to 600 MW, the maximum amount
purchased in the auction to meet the ICR, if necessary), which is assumed to be already
implemented and therefore not contributing to the 1.5% reduction in load. Figure 9
shows this formula:
Figure 9: Formula for Calculating 5% Voltage Reduction Assumption
Table 22 shows the amount of voltage reduction (MW) modeled as ISO-NE OP-4 load
relief from Actions 6 & 8 for each of the months of the 2018/19 CCP within the ICR
calculations.
38
Appendix A of OP-4is available at: http://www.iso-ne.com/static-
assets/documents/rules_proceds/operating/isone/op4/op4a_rto_final.pdf.
Page 39
2018/19 ICR Related Values 38
Table 22: OP-4 Action 6 & 8 Modeled (MW)
Operating Reserve
It is assumed that during peak load conditions, under extremely tight capacity situations,
ISO-NE System Operations will maintain a minimum level of at least 200 MW of
operating reserves for transmission system protection, prior to invoking manual load
shedding procedures, if necessary. This pre-load shedding OP-4 situation is modeled as
operating reserve within the ICR calculation by withholding this amount of capacity from
serving regional peak load.
Proxy Units
Section III.12.7.1 of Market Rule 1 discusses the addition of proxy units to the ICR
model. Proxy units are required when the available resources are insufficient for the
unconstrained New England Balancing Authority area to meet the resource adequacy
planning criterion specified in Section III.12.1. In the model, proxy units are used as
additional capacity to determine the ICR, LRA, MCL and capacity requirement values for
the Demand Curve.
The proxy units used in the ICR model reflect the resource capacity and outage
characteristics such that when the proxy units are used in place of all other resources in
the New England Balancing Authority area, the reliability, or LOLE, of the New England
Balancing Authority area does not change. The outage characteristics are the summer
capacity weighted average availability of the resources in the New England Balancing
Authority area as determined in accordance with Market Rule 1, Section III.12.7.3. The
capacity of the proxy unit is determined by adjusting the capacity of the proxy unit until
the LOLE of the New England Balancing Authority area is equal to the LOLE calculated
while using the capacity assumptions described in Section III.12.7.2.
In May 2014, ISO-NE conducted a study to revise the proxy unit characteristics with the
most recent system conditions in anticipation of requiring the use of proxy units within
the FCA9 ICR model.39
At the time of the study, the FCA8 (2017/18) ICR model was
used as it was the most recent available ICR model.
39
This study was presented to the PSPC on May 22, 2014 and is available at: http://www.iso-ne.com/static-
assets/documents/committees/comm_wkgrps/relblty_comm/pwrsuppln_comm/mtrls/2014/may222014/prox
y_unit_2014_study.pdf.
90/10 Peak
Load
Passive
Demand
Resources
Real-Time
Demand
Resources
Real-Time
Generating
Resources
Action 6 & 8
5% Voltage
Reduction
Jun 2018 - Sep 2018 32,430 2,027 756 270 441
Oct 2018 - May 2019 23,940 1,834 739 260 317
Page 40
2018/19 ICR Related Values 39
The procedure used to determine the new proxy unit size is to:
Determine the initial LOLE of the system using the FCA8 ICR Model
Determine the average availability of the system for both forced and scheduled
outages (5.47% Forced Outage Rate (FOR) and 4 weeks of maintenance)
Replace all resources in the system with proxy units with the average system
availability
Adjust the capacity ratings of the proxy units within the model until the initial
system LOLE is achieved
Using the methodology above, the results showed that with the average system FOR of
5.47% and four weeks of maintenance for the FCA8 system, the appropriate size of the
proxy units is 400 MW.
Figure 10 below, shows the point at which the LOLE of the model at various proxy unit
sizes intersects the FCA8 existing system LOLE of 0.0296 days/year is 400 MW.
Figure 10: Determining the Proxy Unit Size to Use in ICR Models
Using the newly developed proxy unit size of 400 MW, four proxy units were needed for
the 2018/19 ICR calculation, one proxy unit was needed in the model to calculate the
capacity requirements for the Demand Curve at 1-in-5 LOLE and 11 proxy units were
required to calculate the capacity requirements for the Demand Curve at 1-in-87 LOLE.
When modeling transmission constraints for the determination of LRA, the same proxy
units may be added to the import-constrained zone (if needed), otherwise they will be
added elsewhere in the rest of the New England Area. For the SEMA/RI LRA analysis,
two proxy units needed to bring the New England system to the one day in ten years
0.0200
0.0250
0.0300
0.0350
0.0400
100 150 200 250 300 350 400 450
LOLE
(Day
s/Ye
ar)
Proxy Unit Size (MW)
LOLE @ Proxy Unit Size FCA8 Model LOLE (0.0296)
Point where proxy unit characteristics achieve system LOLE
Page 41
2018/19 ICR Related Values 40
LOLE reliability criteria were subsequently added to the SEMA/RI combined sub-area in
order to calculate the SEMA/RI LRA.
Summary
Table 23 summarizes the capacity resources, proxy units and OP-4 assumptions used for
the calculation of the 2018/19 ICR Related Values.
Table 23: Summary of Resource and OP-4 Assumptions (MW)
Type of Resource/OP-4 2018/19 FCA
Generating Resources 28,917.722
Intermittent Power Resources 910.807
Demand Resources 3,054.297
Import Resources 88.800
Export Delist (100.000)
Import Deratings (30.000)
OP-4 Voltage Reduction 441.000
Minimum Operating Reserve (200.000)
Tie Benefits (Includes 953 MW of HQICCs) 1,970.000
Proxy Units 1,600.000
Total MW Modeled in ICR 36,652.626
Page 42
2018/19 ICR Related Values 41
Availability
Generating Resource Forced Outages A five-year, historical average of unit-specific forced outage assumptions is determined
for each generating unit that qualified as an Existing Generating Capacity Resource,
using the most recent available data of monthly Equivalent Forced Outage Rate -
Demand (EFORd) values from NERC’s Generating Availability Data System (GADS).40
The NERC GADS data, which is submitted by owners of regional generators to ISO-NE
for the months of January 2009 through December 2013, was used to create an EFORd
value for each generating unit that submits such data. The NERC Class Average data is
used as a substitute for immature units and for units that are not required to submit NERC
GADS data.
Table 24 shows the capacity-weighted, average EFORd values resulting from summing
the individual generator data by generating resource category, weighted by individual
capacity ratings. This is provided for informational purposes only. In the GE MARS
model, the calculated EFORd for each generating resource is used as a generator-specific
input assumption.
Generating Resource Scheduled Outages
A weekly representation of a generator’s scheduled (maintenance) outages is another
input assumption that goes into the GE MARS model. Included within the scheduled
outages are annual maintenance outages and short-term outages, scheduled more than 14
days in advance of their outage date. A single value is then calculated for each generator,
based on a five-year historical average. In addition to the EFORd data, Table 24
illustrates the average annual maintenance weeks assumed for each type of unit category,
weighted by the summer capability. NERC Class Average data is used to calculate the
average maintenance weeks assumption for immature units.
Table 24: Generating Resource EFORd (%) and Maintenance Weeks by Resource
Category
40
For more information on GADS, see the NERC website located at:
http://www.nerc.com/pa/RAPA/gads/Pages/default.aspx.
Resource Category Summer MW
Assumed Average
EFORd (%) Weighted
by Summer Ratings
Assumed Average
Maintenance Weeks
Weighted by Summer
Ratings
Combined Cycle 12,523 3.6 5.8
Fossil 6,254 14.9 5.2
Nuclear 4,024 3.1 3.9
Hydro
(Includes Pumped Storage) 2,931 4.6 6.5
Combustion Turbine 2,908 9.5 2.3
Diesel 193 6.5 1.0
Miscellaneous 86 14.2 1.8
Total System 28,918 6.7 5.1
Page 43
2018/19 ICR Related Values 42
Intermittent Power Resource Availability
The Qualified Capacity of an Intermittent Power Resource (IPR) is the resource's median
output during “Reliability Hours,” as averaged over a period of five years. Since this
methodology takes into account the resources’ historic availability as it applies to their
FCM capacity ratings, these resources are assumed 100% available within the ICR
model.
Demand Resources Availability
Passive Demand Resources
Table 25 tabulates the availability assumption of the Passive Demand Resources in the
On-Peak and Seasonal Peak categories of Demand Resources. These resources are
considered 100% available within the ICR model. These two categories consist of
passive resources such as energy efficiency or conservation, which are considered always
“in service” and as such, are subsequently assumed to be 100% available. The total
average availability for all Passive Demand Resources is, therefore, 100%.
Table 25: Passive Demand Resources – Summer (MW) and Availability (%)
Active Demand Resources
The historical performance, from both audits and real time events, of Active Demand
Resources (those in the Real-Time Demand Response and Real-Time Emergency
Generators categories) are used to create the Active Demand availability assumption for
use within the ICR calculation.41
For the calculation of ICR for the 2018/19 CCP, historical Demand Resource
performance data for four years under FCM was used. This historical data consists of
both OP-4 events and performance audits that occurred during the summer and winter of
41
A detailed discussion of the Demand Resource availability assumption is available here: http://www.iso-
ne.com/static-
assets/documents/committees/comm_wkgrps/relblty_comm/pwrsuppln_comm/mtrls/2014/jun302014/2014_dr_availabi
lity.pdf.
Load ZoneSummer
(MW)
Availability
(%)
Summer
(MW)
Availability
(%)
MAINE 176.925 100 - -
NEW HAMPSHIRE 94.951 100 - -
VERMONT 125.420 100 - -
CONNECTICUT 80.728 100 324.316 100
RHODE ISLAND 172.704 100 - -
SOUTH EAST MASSACHUSETTS 252.710 100 - -
WEST CENTRAL MASSACHUSETTS 260.352 100 52.968 100
NORTH EAST MASSACHUSETTS & BOSTON 486.312 100 - -
Total New England 1,650.102 100 377.284 100
On-Peak Seasonal Peak
Page 44
2018/19 ICR Related Values 43
2010 through 2013. At the June 24, 2014 PSPC meeting, ISO-NE proposed using an
availability assumption for Active Demand Resources based on the summer and winter
Active Demand performance data for the years 2010 through 2013, weighted by the
capacity (MW) of the resources within each Load Zone for each year. After the
presentation of this data to the PSCPC and subsequent stakeholder discussions, it was
decided to use this proposal within the ICR Related Values calculations.
Table 26 shows the performance rates for Active Demand Resources applied to the
Demand Resources by Load Zone and type of resource that are qualified as Existing
Resources to participate in the 2018/19 FCA. This gives an average Active Demand
Resource availability assumption of 88% for both Real-Time Demand Response and
Real-Time Emergency Generators. The total average Demand Resource availability
assumption for all Demand Resources, both Active and Passive, is 96%. This is an
increase in performance of approximately 2% over prior values assumed within the
2017/18 ICR Related Values calculation, which used historical data from summer 2010
through 2012. In the ICR model, Demand Resources are modeled in blocks consisting of
the type of Demand Resource by Load Zone. The overall availability is shown for
informational purposes only.
Table 26: Demand Response Resources Summer (MW) and Availability (%)
Load ZoneSummer (MW) Availability (%) Summer (MW) Availability (%)
MAINE 207.892 99 11.802 93
NEW HAMPSHIRE 18.707 88 14.022 99
VERMONT 37.007 92 2.866 82
CONNECTICUT 254.510 82 138.338 85
RHODE ISLAND 57.595 85 33.540 90
SOUTH EAST MASSACHUSETTS 38.785 84 15.962 84
WEST CENTRAL MASSACHUSETTS 91.799 89 27.798 89
NORTH EAST MASSACHUSETTS & BOSTON 50.189 81 26.099 89
Total New England 756.484 88 270.427 88
Real-Time
Demand Response
Real-Time Emergency
Generators
Page 45
2018/19 ICR Related Values 44
Difference from 2017/18 FCA ICR Related Values
Change in ICR
In an effort to quantify the effects that each input assumption has on the determination of
ICR results, ISO-NE began with the input assumptions associated with the ICR
calculated for the 2017/18 CCP and substituted each assumption individually with the
corresponding 2018/19 CCP assumption. The net of these changes within the ICR value,
as a result of each individual input assumption change, was then considered as the overall
effect of the changed assumption set. Table 27 lists the assumptions for each CCP and
their subsequent effect on the resultant ICR value. Note that the sum of the individual
assumption effects on ICR do not necessarily sum to the total difference in ICR due to the
interplay of the various assumptions within the model when they are modeled
concurrently.
Table 27: Summary of ICR Input Assumptions for 2018/19 vs. 2017/18
As shown in Table 27, there are several assumptions which have a notable effect on the
ICR. The first is the increase in the load forecast for the 2018/19 CCP versus the 2017/18
CCP. While the 50/50 load forecast is shown for reference purposes, when calculating
the ICR, a full distribution of possible peak loads is modeled along with moments of the
distribution: the mean, standard deviation and 3rd
cummulant which together form the
load forecast uncertainty within the model. Other factors in addition to the load forecast
uncertainty also can affect the amount of installed capacity needed to meet the load
forecast, particularly the resource size and availabilities modeled. So while the annual
increase in the 50/50 load forecast is 215 MW as shown, there is a decrease in the ALCC
(amount of additional load) the system is able to support of 309 MW. This translates to
the system requiring 348 MW of additional installed capacity to meet the load forecast in
2018/19 versus 2017/18.
Total
MW
Weighted Forced
Outage MW
Weighted Forced
Outage
Generation & IPR 29,699 6.5% 32,098 5.8% 178
Demand Resources 3,054 4.0% 3,416 5.8% -85
Imports 89 0.0% 89 0.0% 0
Load Forecast 348
MW % MW %
OP 4 5% VR 441 1.50% 432 1.50% -9
ICR 21935,142 34,923
MW MW
30,005 29,790
MW MW
953 MW Quebec (HQICCs) 1068 MW Quebec (HQICCs)
148 MW Quebec via Highgate 83 MW Quebec via Highgate
1,970 MW 1,870 MW
Assumption
Effect on
ICR (MW)2018/2019 FCA 2017/2018 FCA
Tie Benefits & Updated
External Interface Outage
Assumptions
346 MW New York 227 MW New York
-213
523 MW Maritimes 492 MW Maritimes
Page 46
2018/19 ICR Related Values 45
The change in the tie benefits assumed for 2018/19 versus 2017/18 accounts for a
decrease in ICR of 213 MW. The 100 MW increase in total tie benefits means that
approximately 115 MW less installed capacity is needed within New England. Also, the
decrease in HQICCs from 1,068 MW for 2017/18 to 953 MW for 2018/19 accounts for a
decrease in ICR of 98 MW since HQICCs are added back into the ICR and are treated
differently than other resources and are not adjusted by the ALCC amount.
The third assumption with a notable effect on ICR is the change in generating resource
EFORd calculated for the 2018/19 ICR Related Values from those calculated for the
2017/18 ICR Related Values. As described in this Report’s section on Resource
Availability, the EFORd used in the ICR Related Values calculation is derived from the
most recent five years of GADS data. The 5-year weighted average system-wide
generator EFORd calculated for the 2018/19 ICR calculation is approximately 14%
higher than the EFORd values calculated for the 2017/18 ICR calculation. This decrease
in generating resource availability caused the ICR to increase by 178 MW because more
resources are needed to meet the capacity requirements in New England if these
resources are less reliable than in previous years.
Table 28 shows a comparison in the 2018/19 versus the 2017/18 CCP ICR calculation
average EFORd by generator type.
Table 28: Assumed 5-Year Average % EFORd Weighted by Summer Ratings for
2018/19 versus 2017/18 ICR Calculations
The final assumption with a notable effect on the ICR is the change in Demand Resource
type of resource and assumed availability. While the change in assumed availability for
active Demand Resources did not vary greatly from the values used for the 2017/18 FCA
ICR calculation, the increase in the amount of passive resources and corresponding
decrease in active resources improved the overall Demand Resource availability
assumption (calculated as 1 – DR Performance) from 5.8% to 4.0% therefore decreasing
ICR by 85 MW in 2018/19 versus 2017/18. Table 29 below shows the breakdown by
type of Demand Resource and corresponding performance for the 2018/19 versus
2017/18 ICR calculations.
Resource Category
2018/19 FCA9
5-year Average
EFORd for the Years
2009-2013
2017/18 FCA8
5-year Average
EFORd for the Years
2008-2012
Combined Cycle 3.6 3.9
Fossil 14.9 9.9
Nuclear 3.1 2.6
Hydro (Includes Pumped Storage) 4.6 5.1
Combustion Turbine 9.5 8.5
Diesel 6.5 7.8
Miscellaneous 14.2 15.8
Total System 6.7 5.9
Page 47
2018/19 ICR Related Values 46
Table 29: Comparison of Demand Resources (MW) & Performance (%) for 2018/19
versus 2017/18 ICR Calculations
Change in LRA Requirement
Table 30 shows the difference in the assumptions and results of the 2018/19 LRA
Requirement calculation, as compared to the 2017/18 LRA Requirement calculation for
the import-constrained Connecticut and NEMA/Boston Load Zones Capacity Zones. A
SEMA/RI locational capacity requirement was calculated for the first time for FCA9,
therefore no comparisons are available.
Table 30: Summary of Changes in LRA Requirement for 2018/19 vs. 2017/18
Change in TSA Requirement
Table 31 shows the difference in the assumptions and results of the 2018/19 TSA
Requirement calculation, as compared to the 2017/18 TSA Requirement calculations for
the import-constrained Connecticut and NEMA/Boston Load Zones. As noted above,
there is no comparison available for the SEMA/RI Capacity Zone TSA since FCA9 is the
first time a TSA Requirement was calculated.
MW % MW %
Passive Demand Resources 2,027 100 1,769 100
Real-Time Demand Response 756 88 1,165 89
Real-Time Emergency Generators 270 88 483 86
Total Demand Resources 3,054 96 3,416 94
2018/19 FCA9 2017/18 FCA8
Type of Demand Resource
Connecticut Zone 2018/19 FCA9 2017/18 FCA8 2018/19 FCA9 2017/18 FCA8
Resourcez [1] 9,239 9,768 3,868 3,685
Proxy Unitsz [2] 0 0 0 0
Firm Load Adjustmentz [3] 1,825 2,282 775 685
FORz [4] 0.074 0.068 0.042 0.044
LRAz [5]=[1]+[2]-([3]/(1-[4])) 7,268 7,319 3,129 2,968
Connectiuct NEMA/Boston
Page 48
2018/19 ICR Related Values 47
Table 31: Comparison of the TSA Requirement Calculation for 2018/19 vs. 2017/18
(MW)42
Connecticut
The Connecticut LRA decreased for 2018/19 versus the 2017/18 CCP calculation. The
primary reason for the decrease in the Connecticut LRA for the 2018/19 CCP versus the
2017/18 CCP is the increase in the N-1 TTC for the Connecticut Import interface that
was used to calculate the Connecticut LRA Requirement. The N-1 TTC increased from
2,800 MW to 2,950 MW. This increase in the Connecticut Import TTC is due to
transmission upgrades associated with the New England East-West Solution (NEEWS)
which is expected to be in-service by December 2015 and has been certified and accepted
by ISO-NE to be included in FCA9 analyses. The increase in TTC within the
probabilistic LRA analysis translates to an almost one to one MW decrease in the LRA
Requirement without considering any other assumption changes.
The Connecticut TSA increased for the 2018/19 CCP versus the 2017/18 CCP. While the
increase in the Connecticut Import N-1 and N-1-1 TTC does act to decrease the TTC,
other factors such as an increase in the rating of the largest generator used as reserves in
the calculation from 1,200 to 1,225 MW, an increase in the 90/10 load forecast of 84 MW
and an increase in the amount of unavailable resource MWs of 79 MW (approximately
10%) were enough to offset the increase in TTC and subsequently increase the TSA for
Connecticut by 58 MW (less than 1%).
NEMA/Boston
The increase in the NEMA/BOSTON LRA and TSA Requirements for the 2018/19 CCP
is primarily due to an increase in the load forecast for the NEMA/Boston sub-area.
42
The 90/10 load for Connecticut and NEMA/Boston shown are the sub-area loads. The LRA and TSA
analyses are preformed on a sub-area basis which is used as proxies for the load zones. This is done
because the transmission transfer capabilities are calculated using a sub-area analysis only.
2018/19 FCA9 2017/18 FCA8 2018/19 FCA9 2017/18 FCA8
Sub-area 90/10 Load 8,415 8,330 6,835 6,745
Reserves (Largest unit or loss of import capability) 1,225 1,200 1,412 1,395
Sub-area Transmission Security Need 9,640 9,530 8,247 8,140
Existing Resources 9,239 9,768 3,868 3,685
Assumed Unavailable Capacity -808 -729 -190 -149
Sub-area N-1 Import Limit 2,950 2,800 4,850 4,850
Sub-area Available Resources 11,381 11,839 8,528 8,386
TSA Requirement 7,331 7,273 3,572 3,428
Connecticut NEMA/Boston
Page 49
2018/19 ICR Related Values 48
Table 32 shows the summary comparison between the all the ICR Related Values and
their inputs calculated for the 2018/19 FCA versus the 2017/18 FCA.
Table 32: Comparison of all ICR Related Values (MW)43
43
Existing Capacity Resources value for New England excludes HQICCs.
2018/19
FCA
2017/18
FCA
2018/19
FCA
2017/18
FCA
2018/19
FCA
2017/18
FCA
2018/19
FCA
2017/18
FCA
Peak Load (50/50) 30,005 29,790 7,725 7,650 6,350 6,260 5,910 -
Existing Capacity Resources* 32,842 35,443 9,239 9,768 3,868 3,685 6,984 -
Installed Capacity Requirement 35,142 34,923
NET ICR (ICR Minus HQICCs) 34,189 33,855
1-in-5 LOLE Demand Curve capacity value 33,132 -
1-in-87 LOLE Demand Curve capacity value 37,027 -
Local Resource Adequacy Requirement 7,268 7,319 3,129 2,968 7,479 -
Transmission Security Requirement 7,331 7,273 3,572 3,428 7,116 -
Local Sourcing Requirement 7,331 7,319 3,572 3,428 7,479 -
New England Connecticut NEMA/Boston SEMA/RI
Page 50
2018/19 ICR Related Values 49
{ End of Report }